Chloroplast acquisition without the gene transfer in kleptoplastic sea slugs, Plakobranchus ocellatus - eLife
←
→
Page content transcription
If your browser does not render page correctly, please read the page content below
RESEARCH ARTICLE

                                   Chloroplast acquisition without the gene
                                   transfer in kleptoplastic sea slugs,
                                   Plakobranchus ocellatus
                                   Taro Maeda1†*, Shunichi Takahashi2, Takao Yoshida3, Shigeru Shimamura3,
                                   Yoshihiro Takaki3, Yukiko Nagai3, Atsushi Toyoda4, Yutaka Suzuki5,
                                   Asuka Arimoto6, Hisaki Ishii7, Nori Satoh8, Tomoaki Nishiyama9,
                                   Mitsuyasu Hasebe1,10, Tadashi Maruyama11, Jun Minagawa1,10,
                                   Junichi Obokata7,12, Shuji Shigenobu1,10*
                                   1
                                     National Institute for Basic Biology, Okazaki, Japan; 2Sesoko Station, Tropical
                                   Biosphere Research Center, University of the Ryukyu, Okinawa, Japan; 3Japan
                                   Agency for Marine-Earth Science and Technology, Yokosuka, Japan; 4National
                                   Institute of Genetics, Shizuoka, Japan; 5The University of Tokyo, Tokyo, Japan;
                                   6
                                     Marine Biological Laboratory, Hiroshima University, Hiroshima, Japan; 7Kyoto
                                   Prefectural University, Kyoto, Japan; 8Okinawa Institute of Science and Technology
                                   Graduate University, Okinawa, Japan; 9Research Center for Experimental Modeling
                                   of Human Disease, Kanazawa University, Kanazawa, Japan; 10SOKENDAI, the
                                   Graduate University for Advanced Studies, Okazaki, Japan; 11Kitasato University,
                                   Tokyo, Japan; 12Setsunan Universiy, Hirakata, Japan

                                   Abstract Some sea slugs sequester chloroplasts from algal food in their intestinal cells and
                                   photosynthesize for months. This phenomenon, kleptoplasty, poses a question of how the
*For correspondence:
                                   chloroplast retains its activity without the algal nucleus. There have been debates on the horizontal
taromaedaj@gmail.com (TM);
shige@nibb.ac.jp (SS)
                                   transfer of algal genes to the animal nucleus. To settle the arguments, this study reported the
                                   genome of a kleptoplastic sea slug, Plakobranchus ocellatus, and found no evidence of
Present address: †Ryukoku          photosynthetic genes encoded on the nucleus. Nevertheless, it was confirmed that light
University, Otsu, Japan            illumination prolongs the life of mollusk under starvation. These data presented a paradigm that a
Competing interests: The           complex adaptive trait, as typified by photosynthesis, can be transferred between eukaryotic
authors declare that no            kingdoms by a unique organelle transmission without nuclear gene transfer. Our phylogenomic
competing interests exist.         analysis showed that genes for proteolysis and immunity undergo gene expansion and are up-
Funding: See page 24               regulated in chloroplast-enriched tissue, suggesting that these molluskan genes are involved in the
                                   phenotype acquisition without horizontal gene transfer.
Received: 18 June 2020
Accepted: 01 April 2021
Published: 27 April 2021

Reviewing editor: Kristin
Tessmar-Raible, University of
                                   Introduction
Vienna, Austria                    Since the Hershey–Chase experiment (Hershey and Chase, 1952), which proved that DNA is the
                                   material transferred to bacteria in phage infections, horizontal gene transfer (HGT) has been consid-
   Copyright Maeda et al. This
                                   ered essential for cross-species transformation (Arber, 2014). Although the prion hypothesis has
article is distributed under the
                                   rekindled the interest in proteins as an element of phenotype propagation (Crick, 1970;
terms of the Creative Commons
Attribution License, which         Wickner et al., 2015), HGT is still assumed to be the cause of transformation. For example, in a sec-
permits unrestricted use and       ondary plastid acquisition scenario in dinoflagellates, (1) a non-phototrophic eukaryote sequesters a
redistribution provided that the   unicellular archaeplastid; (2) the endogenous gene transfer to the non-phototrophic eukaryote leads
original author and source are     to the shrinkage of the archaeplastidan nuclear DNA (nucDNA); and (3) the archaeplastidan nucleus
credited.                          disappears, and its plastid becomes a secondary plastid in the host (Reyes-Prieto et al., 2007).

Maeda et al. eLife 2021;10:e60176. DOI: https://doi.org/10.7554/eLife.60176                                                       1 of 32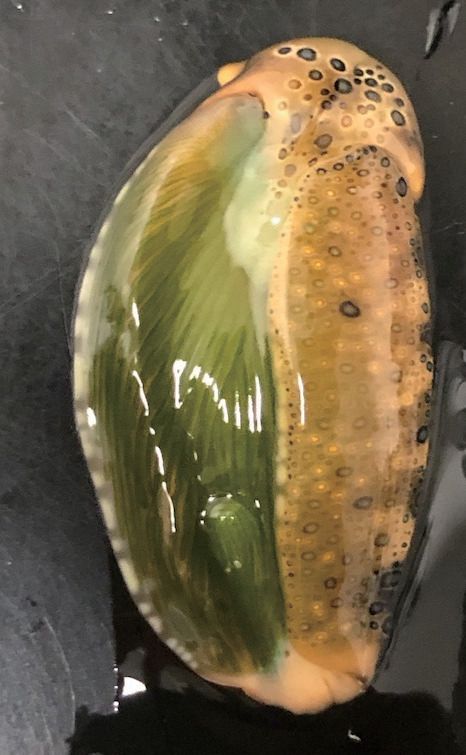
Research article                                                                                          Evolutionary Biology

                                      Chloroplast sequestration in sea slugs has attracted much attention due to the uniqueness of the
                                   algae-derived phenotype acquisition. Some species of sacoglossan sea slugs (Mollusca: Gastropoda:
                                   Heterobranchia) can photosynthesize using the chloroplasts of their algal food (Figure 1A and B;
                                   de Vries and Archibald, 2018; Kawaguti, 1965; Pierce and Curtis, 2012; Rumpho et al., 2011;
                                   Serôdio et al., 2014). These sacoglossans ingest species-specific algae and sequester the chloro-
                                   plasts into their intestinal cells. This phenomenon is called kleptoplasty (Gilyarov, 1983;
                                   Pelletreau et al., 2011). The sequestered chloroplasts (named kleptoplasts) retain their electron
                                   microscopic structure (Fan et al., 2014; Kawaguti, 1965; Martin et al., 2015; Pelletreau et al.,
                                   2011; Trench, 1969) and photosynthetic activity (Cartaxana et al., 2017; Christa et al., 2014a;
                                   Cruz et al., 2015; Händeler et al., 2009; Taylor, 1968; Teugels et al., 2008; Wägele, 2001;
                                   Yamamoto et al., 2009). The retention period of photosynthesis differs among sacoglossan species
                                   (1 to >300 days; Figure 1B; Christa et al., 2015, Christa et al., 2014a, Christa et al., 2014b;
                                   Evertsen et al., 2007; Laetz and Wägele, 2017) and development stages and depends on the plas-
                                   tid ‘donor’ species (Curtis et al., 2007; Laetz and Wägele, 2017).
                                      The absence of algal nuclei in sacoglossan cells makes kleptoplasty distinct from other symbioses
                                   and plastid acquisitions (de Vries and Archibald, 2018; Rauch et al., 2015). Electron microscopic
                                   studies have indicated that the sea slug maintains photosynthetic activity without algal nuclei (Hir-
                                   ose, 2005; Kawaguti, 1965; Laetz and Wägele, 2019; Martin et al., 2015; Pierce and Curtis,
                                   2012). Because the algal nucleus, rather than the plastids, encodes most photosynthetic proteins,
                                   the mechanism to maintain photosynthetic proteins is especially intriguing, given that photosynthetic
                                   proteins have a high turnover rate (de Vries and Archibald, 2018; Pelletreau et al., 2011). Previous
                                   polymerase chain reaction (PCR)-based studies have suggested the HGT of algal nucleic photosyn-
                                   thetic genes (e.g., psbO) to the nucDNA of the sea slug, Elysia chlorotica (Pierce et al., 1996;
                                   Pierce et al., 2009; Pierce et al., 2007; Pierce et al., 2003; Rumpho et al., 2008; Schwartz et al.,
                                   2014). A genomic study of E. chlorotica (N50 = 824 bases) provided no reliable evidence of HGT
                                   but predicted that fragmented algal DNA and mRNAs contribute to its kleptoplasty
                                   (Bhattacharya et al., 2013). Schwartz et al., 2014 reported in situ hybridization-based evidence for
                                   HGT and argued that the previous E. chlorotica genome might overlook the algae-derived gene.
                                   Although an improved genome of E. chlorotica (N50 = 442 kb) was published recently, this study
                                   made no mention of the presence or absence of algae-derived genes (Cai et al., 2019). The geno-
                                   mic studies of sea slug HGT have been limited to E. chlorotica, and the studies have used multiple
                                   samples with different genetic backgrounds for genome assembling (Bhattacharya et al., 2013;
                                   Cai et al., 2019). The genetic diversity of sequencing data may have inhibited genome assembling.
                                   Although transcriptomic analyses of other sea slug species failed to detect HGT (Chan et al., 2018;
                                   Wägele et al., 2011), transcriptomic data were insufficient to ascertain genomic gene composition
                                   (de Vries et al., 2015; Rauch et al., 2015).
                                      Here, the genome sequences of another sacoglossan species, Plakobranchus ocellatus
                                   (Figure 1C–E), are presented to clarify whether HGT is the primary system underlying kleptoplasty.
                                   For more than 70 years, multiple research groups have studied P. ocellatus for its long-term (>3
                                   months) ability to retain kleptoplasts (Christa et al., 2013; Evertsen et al., 2007; Greve et al.,
                                   2017; Kawaguti, 1941; Trench et al., 1970; Wade and Sherwood, 2017; Wägele et al., 2011).
                                   However, a recent phylogenetic analysis showed that P. ocellatus is a species complex (a set of
                                   closely related species; Figure 1F; Christa et al., 2014c; Krug et al., 2013; Maeda et al., 2012;
                                   Meyers-Muñoz et al., 2016; Yamamoto et al., 2013). Therefore, it is useful to revisit previous stud-
                                   ies on P. ocellatus. This study first confirmed the photosynthetic activity and adaptive relevance of
                                   kleptoplasty to P. ocellatus type black (a species confirmed by Krug et al., 2013 via molecular phy-
                                   logenetics; hereafter ‘PoB’). The genome sequences of PoB (N50 = 1.45 Mb) and a related species,
                                   Elysia marginata (N50 = 225 kb), were then constructed. By improving the DNA extraction method,
                                   the genome sequences from a single sea slug individual in each species were successfully assembled.
                                   The comparative genomic and transcriptomic analyses of these species demonstrate the complete
                                   lack of photosynthetic genes in these sea slug genomes and supported an alternative hypothetical
                                   kleptoplasty mechanism.

Maeda et al. eLife 2021;10:e60176. DOI: https://doi.org/10.7554/eLife.60176                                                       2 of 32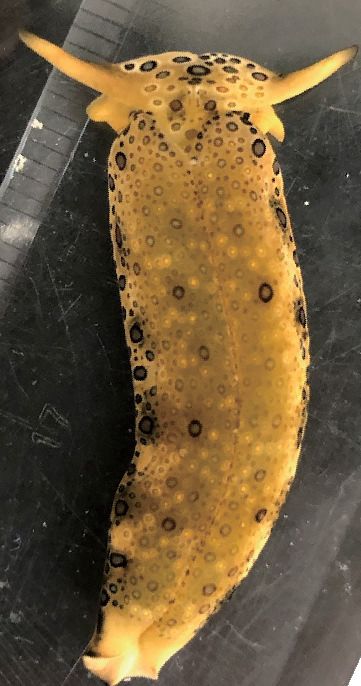
Research article Evolutionary Biology
A C D E
Food algae H
H
Sea slug
P
Ingested plastid R
Intestinal tract
Stomach Kleptoplast
Algal nucleus
500 nm
Intestinal epithelial cells
1 cm
1 cm
Sea slug nucleus P
Algal cell wall Chloroplast DG
Previously
B Nudipleura F DQ991939 Thuridilla gracilis analyzed topics
Euopisthobranchia
Euplumonata GQ996679 [sp.1] Kleptoplast activity
OxynoaceaŸ KC573731* [spotless]
Costasiella ocelifera ★ KC573729 [aff. purple] Transcriptome
Limapontioidea
Costasiella kuroshimaeƔ HM187633 Kleptoplast activity
Non-functional KC573730*
chloroplast retention Costasiella nonatoiŸ
Placida Ÿ AB758969 [purple]
Alderia Ÿ KC573727*
Ercolania Ÿ AB758968 [blue]
Cyerce Ÿ KC573717* `
Mourgona Ÿ KC573716*
Polybranchia Ÿ KC573714*
Plakobranchus ★
Plakobranchus cf. ocellatus
KC573732* [P. papua]
ThuridillaƔ KC573734*
BoselliaƔ KC573737*
Elysia tucaŸ [sp.2]
Elysia bennettaeƔ KC573736* Kleptoplast activity
Sacoglossa
Elysia pusillaƔ KC573738*
Elysia zuleicaeŸ GQ996680
KC573718* [black]
Plakobranchoidea
Elysia papillosaƔ
Elysia chlorotica★ AB758971 Donor algae detection
Elysia crispata ★ Present sample
Elysia viridisƔ JX272705 [white]
Elysia translucensƔ HM187634
Elysia trisinuataƔ JX272694
Elysia amakusanaƔ JX272704
Elysia marginataƔ JX272695
Elysia nigrocapitataƔ KC573723* Mitochondria genome
Elysia obtusaƔ Kleptoplast activity
Elysia timida ★
JX272717
(Short-term) Functional JX272687 Transcriptome
chloroplast retention Elysia cornigera Ɣ KX853083† Donor algae detection
Elysia tomentosa Ɣ
★Long-term retention Elysia subornata Ÿ KC573720*
Elysia pratensis Ɣ JX272712
Ɣ Short-term retention AB758970
Elysia macnaei Ɣ Tree scale: 0.1
ŸNon-functional retention Elysia asbecki Ɣ KC573719*
KC573725*
Figure 1. Kleptoplasty in sea slugs. (A) Process of algal chloroplast retention by a sacoglossan sea slug (Pierce and Curtis, 2012). Sacoglossan sea
slugs puncture the cell wall of food algae to suck out the protoplasm. The chloroplasts in the protoplasm are transported to the sea slug’s intestinal
tract, and the intestinal epithelial cells sequester chloroplasts by phagocytosis. The sequestered chloroplasts (kleptoplasts) maintain the photosynthetic
activity in the cell for days to months. The sacoglossan cell contains no algal nuclei. Kleptoplast has never been found in germ cells of sea slug. (B)
Phylogenetic distribution of kleptoplasty in the order Sacoglossa. Phylogenetic analysis showed that a common ancestor of Sacoglossa acquired non-
functional chloroplast retention phenomena (without the maintenance of photosynthetic function), and multiple sacoglossan groups subsequently
acquired the ability to maintain photosynthetic activity. Phylogenetic tree and kleptoplasty states are simplified from Christa et al., 2015.
Christa et al., 2014b defined functional chloroplast retention for less than 2 weeks as ‘short-term retention’, and for more than 20 days as ‘long-term
retention’. Relationships within Heterobranchia are described according to Zapata et al., 2014. The red-colored taxa include the species used in the
present study (P. ocellatus and E. marginata). (C–E) Photo images of PoB starved for 21 days. (C) Dorsal view. H, head; R, rhinophores; P, parapodia
(lateral fleshy flat protrusions). Almost always, PoB folded parapodia to the back in nature. (D) The same individual of which parapodium was turned
inside out (without dissection). The back of the sea slug and inside of the parapodia are green. This coloration is caused by the kleptoplasts in DG,
which are visible through the epidermis. (E) Magnified view of the inner surface of parapodium. The diagonal green streaks are ridged projections on
the inner surface of the parapodium. The cells containing kleptoplasts are visible as green spots. (F) Phylogeny of the P. cf. ocellatus species complex
Figure 1 continued on next page
Maeda et al. eLife 2021;10:e60176. DOI: https://doi.org/10.7554/eLife.60176 3 of 32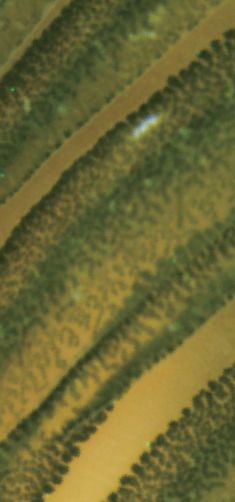
Research article                                                                                                     Evolutionary Biology

Figure 1 continued
based on mitochondrial cox1 genes (ML tree from 568 nucleotide positions) from INSD and the whole mtDNA sequence. The sequence data for the
phylogenetic analysis are listed in Figure 1—source data 1. Clade names in square brackets are based on Krug et al., 2013. Asterisks mark the
genotypes from Krug et al., 2013. Study topics analyzed by previous researchers were described within the colored boxes for each cluster. Small black
circles indicate nodes supported by a high bootstrap value (i.e., 80–100%). Thuridilla gracilis is an outgroup. Plakobranchus papua is a recently
described species and previously identified as P. ocellatus (Meyers-Muñoz et al., 2016).
The online version of this article includes the following source data for figure 1:
Source data 1. Sequence ID list used for phylogenetic analysis on Figure 1B.

                                    Results
                                    Does the kleptoplast photosynthesis prolong the life of PoB?
                                    To explore the photosynthetic activity of PoB, three photosynthetic indices were measured: photo-
                                    chemical efficiency of kleptoplast photosystem II (PSII), oxygen production rate after starvation for
                                    1–3 months, and effect of illumination on PoB longevity. The Fv/Fm value, which reflects the maxi-
                                    mum quantum yield of PSII, was 0.68–0.69 in the ‘d38’ PoB group (starved for 38 days) and 0.57–
                                    0.64 in the ‘d109’ group (starved for 109–110 days; Figure 2A). These values were only slightly lower
                                    than those of healthy Halimeda borneensis, a kleptoplast donor of PoB (Maeda et al., 2012), which
                                    showed Fv/Fm values of 0.73–0.76. The donor algae of PoB consisted of at least eight green algal
                                    species, and they are closely related to H. borneensis (Maeda et al., 2012). Although it is not clear
                                    whether the Fv/Fm is the same for all donor algae, Fv/Fm is almost identical (~0.83) in healthy terres-
                                    trial plants regardless of species (Maxwell and Johnson, 2000). Moreover, the values of H. borneen-
                                    sis were similar to those of other green algae (e.g., Chlamydomonas reinhardtii, Fv/Fm = 0.66–0.75;
                                    Bonente et al., 2012). Hence, we assumed that Fv/Fm values are similar among the donor species.
                                    The Fv/Fm value suggested that PoB kleptoplasts retain a similar photochemical efficiency of PSII to
                                    that of the food algae for more than 3 months.
                                        Based on the measurement of oxygen concentrations in seawater, starved PoB individuals (‘d38’
                                    and ‘d109’) displayed gross photosynthetic oxygen production (Figure 2B and C). The mock exami-
                                    nation without the PoB sample indicated no light-dependent increase in oxygen concentrations, i.e.,
                                    no detectable microalgal photosynthesis in seawater (Figure 2—figure supplement 1). The results
                                    demonstrated that PoB kleptoplasts retain photosynthetic activity for more than 3 months, consis-
                                    tent with previous studies on P. cf. ocellatus (Christa et al., 2014c; Evertsen et al., 2007).
                                        The longevity of starved PoB specimens was then measured under different light conditions. The
                                    mean longevity was 156 days under continuous darkness and 195 days under a 12 hr light/12 hr dark
                                    cycle (p=0.022; Figure 2D), indicating that light exposure significantly prolongs PoB longevity. This
                                    observation was consistent with that of Yamamoto et al., 2013 that the survival rate of PoB after 21
                                    days under starvation is light dependent. Although a study using P. cf. ocellatus reported that pho-
                                    tosynthesis had no positive effect on the survival rate (Christa et al., 2014c), our results indicated
                                    that this finding does not apply to PoB.
                                        Given the three photosynthetic indices’ data, we concluded that the increase in PoB survival days
                                    was due to photosynthesis. A previous study using the short-term (retention period of 4–8 days)
                                    kleptoplastic sea slug, Elysia atroviridis, indicated no positive effect of light illumination on their sur-
                                    vival rate (Akimoto et al., 2014). These results supported that light exposure does not affect saco-
                                    glossan longevity in the absence of kleptoplasts. Although plastid-free PoB may directly indicate
                                    that kleptoplasty extends longevity, there is no way to remove kleptoplasts from PoB, except during
                                    long-term starvation. PoB feeds on nothing but algae and retains the kleptoplast for 3–5 months.
                                    Although future research methods may allow for more experimental analyses of kleptoplast func-
                                    tions, the currently most straightforward idea is that kleptoplast photosynthesis increases the starva-
                                    tion resistance of PoB.

                                    Do kleptoplasts encode more photosynthetic genes than general
                                    plastid?
                                    To reveal the proteins synthesized from kleptoplast DNA (kpDNA), we sequenced the whole kpDNA
                                    from PoB and compared the sequences with algal plastid and nuclear genes. Illumina sequencing
                                    provided two types of circular kpDNA and one whole mitochondrial DNA (mtDNA) (Figure 3A;

Maeda et al. eLife 2021;10:e60176. DOI: https://doi.org/10.7554/eLife.60176                                                                   4 of 32
Research article Evolutionary Biology
A B
Temp. (°C)
0.8 24
Oxygen concentration in sea water (mgO2/L)
23
7.0 22
0.6
Fv/Fm
0.4
6.5
0.2
0.0 6.0
Habo d38 d109
PoB 0 1000 2000 3000 4000
Elapsed time (s)
C D
d38 d109 250
100
Sea slug longevity (days)
200
Oxygen production rate
(pgO2/h/individual)
ĺ*HQHUDWLRQ
50 150
100 p = 0.02
0 O2
&RQVXPSWLRQĸ
50
0
í
D L G D L G
D L/D
Light condition Light condition
Figure 2. Photosynthetic activity of PoB. (A) Jitter plot of Fv/Fm values indicating the photochemical efficiency of
PSII. Habo, H. borneensis; d38, starved PoB for 38 days; d109, starved for 109 to 110 days (12 hr light/12 hr dark
cycle; the light phase illumination was 10 mmol photons m 2 s 1). The magenta line indicates the mean, and the
black dot indicates each individual’s raw value (n = 3 per group). (B) Dynamics of seawater oxygen concentration.
To better demonstrate the PoB photosynthesis, a change of oxygen concentration every second was visualized. A
PoB individual, one of the d38 samples (ID1), was put into the measurement chamber, and the light conditions
were changed in tens of minutes. The measurements in other individuals are visualized in Figure 2—figure
supplement 1, along with the diagrams of the measuring equipment. Each point represents the oxygen
concentration value per second. Gray signifies a dark period, and yellow means an illuminated period (50 mmol
photons m 2 s 1). Temp, water temperature. Although the values fluctuated by the noise due to ambient light and
other factors, the oxygen concentration decreased in the dark conditions and increased in the light conditions.
When the illumination condition was changed, the changing pattern kept the previous pattern for a few minutes.
This discrepancy may reflect the distance between the organism and oxygen sensor and the time for adaptation to
brightness by the kleptoplast. (C) Jitter plots of PoB oxygen consumption and generation. D, dark conditions; L,
light conditions; G, gross rate of light-dependent oxygen generation (L minus D). (D) Jitter plots of PoB longevity
(n = 5 per group). D, Continuous dark; L/D, 12 hr light/12 hr dark cycle. The p from Welch’s two-sample t-test was
Figure 2 continued on next page
Maeda et al. eLife 2021;10:e60176. DOI: https://doi.org/10.7554/eLife.60176 5 of 32Research article Evolutionary Biology
Figure 2 continued
used. A source file of Fv/Fm jitter plot, time course of oxygen concentration, and longevity analysis are available in
Figure 2—source data 1–3, respectively.
The online version of this article includes the following source data and figure supplement(s) for figure 2:
Source data 1. Summarized data of Fv/Fm and oxygen generation activity analysis of P.
Source data 2. Raw data of oxygen concentration dynamics.
Source data 3. Summary of the longevity of analyzed P. ocellatus individuals used for Figure 2D.
Figure supplement 1. Light-dependent oxygen generation by P. ocellatus.
Supplementary file 1; Figure 3—figure supplements 1–3). The mtDNA sequence was almost iden-
tical to the previously sequenced P. cf. ocellatus mtDNA (Figure 3—figure supplement 3B;
Greve et al., 2017). The sequenced kpDNAs corresponded to those of the predominant kleptoplast
donors of PoB (Maeda et al., 2012), i.e., Rhipidosiphon lewmanomontiae (AP014542; hereafter
‘kRhip’) and Poropsis spp. (AP014543; hereafter ‘kPoro’; Figure 3B; Figure 3—figure supplement
4).
To determine whether kpDNA gene repertoires were similar to green algal chloroplast DNAs
(cpDNAs), H. borneensis cpDNA was sequenced, and 17 whole cpDNA sequences were obtained
from public databases (Figure 3C; Figure 3—figure supplements 5 and 6). PoB kpDNAs contained
all the 59 conserved chloroplastic genes in Bryopsidales algae (e.g., psbA and rpoA), although they
lacked four to five of the dispensable genes (i.e., petL, psb30, rpl32, rpl12, and ccs1; Figure 3C).
To test whether kpDNAs contained no additional photosynthetic genes, a dataset of 614 photo-
synthetic genes was then used (hereafter the ‘A614’ dataset), which were selected from the algal
transcriptomic data and public algal genomic data (Supplementary files 2 and 3). A tblastn homol-
ogy search using A614 obtained no reliable hits (E-value < 0.0001) against the kpDNA sequences,
except for the chlD gene, which resembled the kpDNA-encoded chlL gene (Figure 3D,E). A positive
control search against an algal nucDNA database (Caulerpa lentillifera; https://marinegenomics.oist.
jp/umibudo/viewer/info?project_id=55; Arimoto et al., 2019) found reliable matches for 93% (575/
614) of the queries (Figure 3D,E), suggesting that the method has high sensitivity. Hence, it was
concluded that kpDNAs lack multiple photosynthetic genes (e.g., psbO) as general green algal
cpDNAs.
Are there horizontally transferred algal genes to the PoB nucleic
genome?
To determine whether the PoB nucleic genome contains algae-derived genes (i.e., evidence of
HGT), we sequenced the nuclear genome of PoB. A search for algae-like sequences in gene models,
genomic sequences, and pre-assembled short reads were conducted. The genome assembly con-
tained 927.9 Mbp (99.1% of the estimated genome size; 8647 scaffolds; N50 = 1.45 Mbp; 77,230
gene models; Supplementary file 4; Figure 4—figure supplements 1–3). Benchmarking Universal
Single-Copy Orthologs (BUSCO) analysis using the eukaryota_odb9 dataset showed high coverage
(93%) of the eukaryote conserved gene set, indicating that the gene modeling was sufficiently com-
plete to enable HGT searches (Supplementary file 4). The constructed gene models were deposited
in INSD (PRJDB3267) and FigShare (DOI: 10.6084/m9.figshare.13042016) with annotation data.
Searches of PoB gene models found no evidence of algae-derived HGT. Simple homology
searches (blastp) against the RefSeq database found 127 PoB gene models with top hits to Cyano-
bacteria or eukaryotic algae. Eighty-two of the 127 top hits encoded functionally unknown protein
(annotated as ‘hypothetical protein’ or ‘uncharacterized protein’; Supplementary file 5). Viridiplantal
Volvox was the most abundant source of algae of the top-hit sequences (17 genes), and cryptophy-
tan Guillardia was the second most abundant source (10 genes). However, the prediction of taxo-
nomical origin using multiple blast-hit results (Last Common Ancestor [LCA] analysis with MEGAN
software; Huson et al., 2007) denied the algal origin of the genes (Supplementary file 5). A blastp
search using the A614 dataset, which contains sequences of the potential gene donor (e.g., tran-
scriptomic data of H. borneensis), also determined no positive HGT evidence (Supplementary file
5).
Maeda et al. eLife 2021;10:e60176. DOI: https://doi.org/10.7554/eLife.60176 6 of 32Research article Evolutionary Biology
A B
0 kb
80 Dasycladales
Trichosolen myura
Ostreobiumm quek
quekettii
uekett
uek ettiiii
ett
Derbesia marinaina
Derbesia tenuissima
Pedobesia
Bryopsidineae
Codium
Pseudoderbesia sp.
Bryopsis pennatula ula
kRhip Bryopsis muscosa
cosaa
cos
20 Bryopsis pennatanata
nat
89 kbp Bryopsis myosuroides
suroid
sur oides
oid es
AP014542 Bryopsis foliosa
Bryopsis vestita
0 kb Bryopsis corticulans
ulansns
Bryopsis hypnoides
hypnoi
hyp noides
noi des
60 Bryopsis maxima ima
80 Bryopsis plumosa
mosaa
mos
0.02 Bryopsis corymbosa
ymbosa
ymb osa
Bryopsis africana
icanana
Bryopsis vestita
tita
Dichotomosiphon tuberosus osuss
osu
Pseudochlorodesmis furcellata
Rhipilia-Rhipiliopsis
40 Flabellia petiolata
20 Pseudocodium floridanum
kPoro Siphonogramen abbreviata
87 kbp Caulerpa verticillata
Photosynthesis Caulerpella ambigua
AP014543 Caulerpa okamurae
Transcription Caulerpa lentillifera
Caulerpa taxifolia
Translation Caulerpa racemosa
Caulerpa nummularia
60 Caulerpa sertularioides
Other plastidial function Caulerpa racemosa
Caulerpa brachypus
Intron Caulerpa subserrata
Caulerpa scalpelliformis
Caulerpa prolifera
Caulerpa webbiana
Bryopsidales
40 Caulerpa cupressoides
Boodleopsis pusilla
C Tydemania expeditionis
62 59 Number of coresponding genes Udotea flabellum
Conservation in 60 Poropsis sp. HV1774
Bryopsidales 53 Dispensable genes kPoro
Penicillus lamourouxii
Core gene lacking on kpDNAs Penicillus dumetosus
Halimedineae
40 ycf20 Penicillus pyriformis
Dispensable gene psb30 Udotea conglutinata
ycf47 ccsA Rhipidosiphon sp.
ycf62 ccs1 rpl12 Udotea glaucescens
Rare gene cemA rpl32 Udotea conglutinata
20
12 petL tilS Udotea cyathiformis
8 5 Rhipocephalus oblongus
Numbers of plastid-encoded genes in each species
3 3 2 2 1 1 1 1 1 1 1 1 1 1 1 Rhipocephalus phoenix
0 Udotea unistratea
Penicillus capitatus
Cyme Udotea spinulosa
Vali Chlorodesmis fastigiata
Chre Rhipidosiphon javensis
Desp Rhipidosiphon lewmanomontiae
Code Rhipidosiphon lewmanomontiae
Cosp kRhip
Rhipidosiphon lewmanomontiae
Bryopsidales plastids
Laan Section Opuntia
Brsp Section Pseudo-opuntia
Brhy Section Halimeda
Brpl Halimeda cryptica
Cacl Halimeda pygmaea
Cale Halimeda micronesica
Cara Halimeda fragilis
Cama Halimeda monile
Halimeda simulans
Habo Halimeda incrassata
Rhpe Halimeda cylindracea
Tyex Halimeda macroloba
Halimeda kanaloana
kPoro Halimeda heteromorpha
kRhip Halimeda melanesica
Chfa Halimeda borneensis
Halimeda borneensis
100 0 Halimeda borneensis
Halimeda borneensis
D E
Query source
í
7(1%) Chre Cale Habo Brhy
kPoro 614 rbcS log10E-value
psbQ
psbP -4
chlD 7(1%)
Database
Query gene
psbO -50
614 psaO
kRhip
psaH -100
psaG
575 psaF
(93%) psaD -200
nCale 614 chlD
cabI1
nCale
kPoro
kRhip
nCale
kPoro
kRhip
nCale
kPoro
kRhip
nCale
kPoro
kRhip
í í í 0
Hit query
log10“top-hit E-value”
No-hit query Target genome
Figure 3. Gene composition of PoB kpDNAs. (A) Gene map of two kpDNAs from PoB. Gene positions are described in circles colored according to the
gene’s functional category (see keys in the box). Genes on the outside and inside of each circle are transcribed in the clockwise and anticlockwise
directions, respectively (for detailed maps, see Figure 3—figure supplements 1 and 2). (B) Phylogenetic positions of sequenced kleptoplasts among
green algal plastids. The original ML tree (Figure 3—figure supplement 4) was created based on rbcL genes (457 positions) and converted to the tree.
Figure 3 continued on next page
Maeda et al. eLife 2021;10:e60176. DOI: https://doi.org/10.7554/eLife.60176 7 of 32Research article Evolutionary Biology
Figure 3 continued
Red indicates sequenced kpDNA or cpDNA in the present study. Underlines indicate algal species used in RNA-Seq sequencing. (C) An UpSet plot of
plastid gene composition. Species abbreviations are defined in Figure 3—source data 1. The horizontal bar chart indicates the gene numbers in each
species. The vertical bar chart indicates the number of genes conserved among the species. Intersect connectors indicate the species composition in a
given number of genes (vertical bar chart). Connections corresponding to no gene were omitted. Connectors were colored according to the gene’s
conservation level in Bryopsidales: Core gene, conserved among all analyzed Bryopsidales species; Dispensable gene, retained more than two
Bryopsidales species; Rare gene, determined from a single or no Bryopsidales species. Gray shading indicates non-Viridiplantae algae, and magenta
shading indicates PoB kleptoplasts. Cyme (C. merolae) and Vali (V. litorea) had more than 100 genes that Bryopsidales does not have (e.g., left two
vertical bars). (D) Box-plots of tblastn results. The vertical axis shows the database searched (kPoro and kRhip, PoB kpDNAs; nCale, nucDNA of C.
lentillifera). Each dot represents the tblastn result (query is the A614 dataset). Red dots show the result using the chlD gene (encoding magnesium-
chelatase subunit ChlD) as the query sequence; this sequence is similar to the kleptoplast-encoded chlL gene. The right pie chart shows the proportion
of queries with hits (E-value < 0.0001). (E) Heat map of tblastn results of representative photosynthetic nuclear genes (a subset of data in D). The source
species of the query sequences are described on the top. The source files of plastid gene composition and tblastn analysis are available in Figure 3—
source data 1 and 2.
The online version of this article includes the following source data and figure supplement(s) for figure 3:
Source data 1. Plastid gene composition.
Source data 2. Tblastn analysis of kleptoplast/chloroplast DNA.
Figure supplement 1. Gene map of a P. ocellatus kleptoplast DNA sequestered from Rhipidosiphon lewmanomontiae.
Figure supplement 2. Gene map of a P. ocellatus kleptoplast DNA sequestered from Poropsis spp.
Figure supplement 3. Mitochondrial gene map of the P. ocellatus type black.
Figure supplement 4. Bryopsidales ML tree made by RAxML (a -x 12345 p 12345 -# 300 m GTRGAMMAI) based on 457 positions of rbcL genes.
Figure supplement 5. Gene map of the H. borneensis chloroplast DNA.
Figure supplement 6. Gene compositions of 18 algal cpDNAs and P. ocellatus kpDNAs.
Figure supplement 7. Read coverage depth of the constructed P. ocellatus genomic assemblies.
Figure supplement 8. Annotation procedure of H. borneensis transcripts.
Figure supplement 9. Annotation procedure of B. hypnoides transcripts.
Figure supplement 10. Annotation procedure of C. lentillifera.
Using LCA analysis for all PoB gene models, some genes were predicted to originate from spe-
cies other than Lophotrochozoa. These genes may be due to HGT, but no photosynthesis-related
genes were found from them. MEGAN predicted that 20,189 of the PoB genes originated from
Lophotrochozoa and its subtaxa. The prediction also assigned 5550 genes to higher adequate taxa
as Lophotrochozoa (e.g., Bilateria). MEGAN assigned the 2964 genes to Opisthokonta other than
Lophotrochozoa (e.g., Ecdysozoa) and 312 genes derived from proteobacteria as promising horizon-
tally transferred genes. However, these 3276 genes contained no photosynthetic gene. Many of the
PoB genes assigned as promising horizontally transferred genes encoded reverse transcriptase. For
the remaining 48,215 genes, MEGAN assigned no species. A homology search against the public
database annotated 41,203 of the no-taxon-assigned genes as functionally unknown genes (Fig-
Share; DOI: 10.6084/m9.figshare.13042016). Other no-taxon-assigned 7012 genes were not associ-
ated with photosynthesis, except one gene (p288c60.92) annotated to ‘photosystem I assembly
protein ycf3’. However, this annotation to p288c60.92 was not reliable because it seems to be
derived from incorrect annotations on public databases. Our reannotation via blastp search against
the RefSeq database indicated the similarity of the PoB gene (p288c60.92) to ‘XP_013785360,
death-associated protein kinase related-like’ of a horseshoe crab. The details of the analyses are
summarized in Supplementary file 6. MEGAN-based analysis, hence, indicated that several non-
photosynthetic genes might have originated from proteobacteria or other organisms but provided
no evidence of algae-derived HGT.
In gene function assignment with Gene Ontology (GO) terms, no PoB gene model was annotated
as a gene relating ‘Photosynthesis (GO:0015979),” although the same method found 72 to 253 pho-
tosynthesis-related genes in the five referential algal species (Figure 4A). Six PoB genes assigned to
the child terms of ‘Plastid (GO:0009536)’ were found (Figure 4A; Supplementary file 7). However,
an ortholog search with animal and algal genes did not support these six genes’ algal origin (Fig-
ure 4—figure supplement 5). It was considered that the sequence conservation beyond the king-
dom caused these pseudo-positives in the GO assignment. The function of these six genes had no
relationships to photosynthesis (Supplementary file 7); six genes relate proteasome (p2972c65.3),
arginine kinase (p197c68.18), DNA-binding response regulator (p234c64.89), chromatin structure
Maeda et al. eLife 2021;10:e60176. DOI: https://doi.org/10.7554/eLife.60176 8 of 32Research article Evolutionary Biology
A C
Mollusk Algae
Cyme
PoB
3
Density
Aca
Habo
Chre
Bgl
Cale
Brhy
P911 A614
GO description and ID 1
Positive regulation of photosynthesis: 1905157
100 Protein translocase subunit SecA
Child terms of Photosynthesis (GO:0015979)
Negative regulation of Calvin cycle: 0080153
Averaged pident (%)
PS stoichiometry adjustment: 0080005 Deoxyribodipyrimidine photo-lyase
PSI assembly: 0048564
PSI stabilization: 0042550
PSII stabilization: 0042549 90
Dark reaction: 0019685
Light reaction: 0019684
Calvin cycle: 0019253
Photosynthesis: 0015979 Peptidyl-prolyl cis-trans isomerase
PSII O2 evolving complex: 0010270 80
PS II assembly: 0010207 1 10 100 1000 10000
PS II repair: 0010206 MMSeq2 hit read based transcripts per million
Photoinhibition: 0010205
Regulation of photosynthesis: 0010109 D
NADP+ reduction: 0009780 $OJDHGHULYHGĺ
Electron transport in PS I: 0009773 1000 Aca Bgl
Electron transport in PS II: 0009772
Light harvesting in PS I: 0009768
3URNDU\RWHGHULYHGĺ
Electron transport chain: 0009767 500
Light harvesting: 0009765
Plastid part: 0044435
Chloroplast part: 0044434 0
Starch grain: 0043036
Plastid nucleoid: 0042646
Chloroplast nucleoid: 0042644 -500
Chloroplast membrane: 0031969
Integral component of Cp outer mem.: 0031359
Integral component of Cp inner mem.: 0031357
h-index
-1000
Chloroplast photosystem I: 0030093
Apicoplast: 0020011
Stromule: 0010319
Plastoglobule: 0010287 1000 PoB Cale
Child terms of Plastid (GO:0009536)
Chloroplast envelope: 0009941 2
Cyanelle: 0009842
Cp endopeptidase Clp complex: 0009840 500
Chloroplast outer membrane: 0009707
Chloroplast inner membrane: 0009706
0
Chromoplast stroma: 0009575
Proplastid stroma: 0009571
Chloroplast stroma: 0009570
Number Chloroplast starch grain: 0009569
Chloroplast thylakoid lumen: 0009543 -500
of genes Proplastid: 0009537
Plastid: 0009536
100 Cp thylakoid membrane: 0009535 -1000
Chloroplast thylakoid: 0009534
Chloroplast stromal thylakoid: 0009533 -1000 -500 0 500 1000 -1000 -500 0 500 1000
Plastid stroma: 0009532 hA-index
10 Plastid inner membrane: 0009528 E
Plastid outer membrane: 0009527
P. ocellatus RNA-Seq data
Plastid envelope: 0009526 T1-DeP 1 56 2 40 8
T2-DeP 1 1 1 1 66 3 3 1 53 8
PSII associated LHC II: 0009517 T3-DeP 29 30 13
1 Etioplast: 0009513 A1-DeP 44 41 13
0 Chromoplast: 0009509 T1-DG 9 8 10
Plastid chromosome: 0009508 T2-DG 31 25 9
Chloroplast: 0009507 4 T3-DG 2 2 2 18 1 1 21 4
Thylakoid light-harvesting complex: 0009503 A1-DG 1 1 1 30 28 14
A1-He 1 1 1 1 1 59 1 1 1 46 12
Amyloplast: 0009501 A1-Pe 1 1 1 44 45 12
Plastid small ribosomal subunit: 0000312 A1-Pa 44 4 4 31 12
B1-DeP 20 1 1 20 9
B B1-Pa 45 1 49 9
B. hypnoides H. borneensis B1-DG 54 1 1 1 46 3
EG 2 8 2 2 4 2 1 1 78 1 1 1 4 10 1 1 2 54 15
C. lentillifera C. reinhardtii C. merolae
FAN protein
FAN protein
FAN protein
Proline--tRNA ligase
Proline--tRNA ligase
Average of P911
Total read count (million reads)
Chloroplast-associated SecA
Protein translocase subunit SecA
Protein translocase subunit SecA
Protein translocase subunit SecA
Retinol dehydrogenase 12
Protein translocase subunit SecA
Peptidyl-prolyl cis-trans isomerase
Proline--tRNA ligase
RuBisCO small subunit
PSI subunit V
Proline--tRNA ligase
Deoxyribodipyrimidine photo-lyase
Deoxyribodipyrimidine photo-lyase
Protein translocase subunit SecA
Protein translocase subunit SecA
Number
of hit read
Alignment score per aligned bp
6 Deoxyribodipyrimidine photolyase
(p855c67.9) >70
Phosphoglycerate kinase
(p105c62.89)
4
10
2
1
0
0 20 40 60 80 100 Chre Habo Cale Cyme Behy
Covered query length (%) Query protein
Figure 4. Search for horizontally transferred algal genes in the PoB genome. (A) Heatmap of the number of genes assigned to photosynthesis- or
plastid-related GO terms. The abundance of photosynthesis- or plastid-related genes was compared among PoB, two non-kleptoplastic mollusk
species (Aca, A. californica; Bgl, B. glabrata), and five algal species (see abbreviations in Figure 3, Figure 3—source data 1). A color scale was
visualized in the box on the left. (B) Scatter plot of the Exonerate results, the alignment of the A614 gene set (query sequences) to the PoB genome.
Figure 4 continued on next page
Maeda et al. eLife 2021;10:e60176. DOI: https://doi.org/10.7554/eLife.60176 9 of 32Research article Evolutionary Biology
Figure 4 continued
The enlarged view with the tblastn results; Figure 4—figure supplement 5. The dot color shows the source algae of each query sequence (see keys in
the box). The horizontal axis shows the percentage of the query length aligned to the hit sequences (PoB genome). The vertical axis shows the similarity
of the aligned sequences between the query and PoB genome; alignment score (the sum of the substitution matrix scores and the gap penalties)
divided by aligned length (bp). Dashed lines are thresholds for a credible query hit (i.e., a hit covering >60% of the query sequence and a normalized
Exonerate alignment score of >2). (C) Scatter plot of MMseq2 results for the A614 dataset (algal photosynthetic genes, red) and P911 reference dataset
(PoB single-copy genes, blue) used as query sequences against the database of pre-assembled read sets from paired-end DNA libraries of PoB. The
top panel shows the probability density distribution of the number of hit reads (normalized with TPM: transcripts per kilobase million; x-axis) versus the
averaged ‘pident’ value (percentage of identical matches) from the hit reads (y-axis). (D) Scatter plot of HGT indices (hA-index versus h-index) for genes
in PoB, the two non-kleptoplastic mollusk species (Aca and Bgl), and one algae species (C. lentillifera [Cale]). Each dot represents a gene. A high hA-
index or h-index value means the possibility of algal or prokaryote origin, respectively. Dashed red lines represent the conventional threshold for HGT
( 100 for h-index and 100 for hA-index). Three red arrowheads indicate PoB genes exceeding the thresholds. (E) Heatmap of the results of searches for
algae-like RNA fragments in the PoB RNA-Seq data. Pa, parapodium; EG, egg; He, head; Pe, pericardium. The blue gradient indicates the number of
RNA-Seq reads assigned as algae-like fragments (see key). The y-axis labels show the RNA-Seq library name and analyzed tissue types. The x-axis
labels indicate the query protein; the queries having no corresponding reads were omitted from the figure. For queries using the P911 reference
dataset, the mean of the hit-read counts from each library was described. The total number of reads for each library is given on the far right. The source
files of homology-based algal gene searching analysis using Exonerate, MMseq2, and blastp are available in raw data Figure 4—source data 1.
The online version of this article includes the following source data and figure supplement(s) for figure 4:
Source data 1. Algal gene detection from PoB genome.
Figure supplement 1. Genome size estimation of P. ocellatus type black by flow cytometry.
Figure supplement 2. Genome assembling and gene modeling approach for the P. ocellatus genome analysis.
Figure supplement 3. Annotation procedure for the genomic gene models of P. ocellatus type black.
Figure supplement 4. ML tree for the candidate HGT genes with algal and molluscan homologous genes.
Figure supplement 5. Summary of Exonerate and tblastn results.
Figure supplement 6. ML tree for the orthologous group ‘65’ by SonicParanoid.
Figure supplement 7. ML tree for the orthologous group ‘501’ by SonicParanoid.
Figure supplement 8. ML tree for the orthologous group ‘456’ by SonicParanoid.
Figure supplement 9. Sequence similarity between g566.t1 (C. lentillifera) and p310c70.15 (P. ocellatus).
Figure supplement 10. Overview of the sample preparation for P. ocellatus type black transcriptomic analysis.
Figure supplement 11. Agarose gel electrophoresis image displaying extracted P. ocellatus DNA for the nuclear genome sequencing with two
fragment size markers.
Figure supplement 12. Read depth of the P. ocellatus genome assemblies.
Figure supplement 13. Dot-plot of the referential kleptoplast DNAs and PoB genomic scaffolds determined as the kleptoplast DNA (kpDNA).
Figure supplement 14. Dot plot of the two referential kleptoplast DNAs.
Figure supplement 15. Dot plot of the referential mtDNAs and one scaffold determined as mtDNA sequence.
(p466c59.83), mitochondrial inner membrane translocase (p503c65.126), and functionally unknown
protein (p45387c41.1).
To confirm that the gene modeling did not overlook a photosynthetic gene, the A614 dataset
against the PoB and C. lentillifera genome sequences was directly searched using tblastn and Exon-
erate software (Slater and Birney, 2005). Against the C. lentillifera genome (positive control), 455
(tblastn) and 450 (Exonerate) hits were found; however, using the same parameters, only 1 (tblastn)
and 2 (Exonerate) hits against the PoB genome were detected (Figure 4B; Figure 4—figure supple-
ment 5). The three PoB loci contain the genes encoding serine/threonine-protein kinase LATS1
(p258757c71.5, Figure 4—figure supplement 5), deoxyribodipyrimidine photolyase (p855c67.9,
Figure 4B), and phosphoglycerate kinase (p105c62.89, Figure 4B). A phylogenetic analysis with
homologous genes showed the monophyletic relationships of these three genes with molluskan
homologs (Figure 4—figure supplement 6–8). This result indicated that the three PoB loci contain
molluskan genes rather than algae-derived genes. It was thus concluded that the PoB genome
assembly contains no algae-derived photosynthetic genes.
To examine whether the genome assembly failed to construct algae-derived regions in the PoB
genome, a search for reads resembling photosynthetic genes among the pre-assembled Illumina
data was performed. From 1065 million pre-assembled reads, 1698 reads showed similarity against
261 of the A614 dataset queries based on MMseq2 searches. After normalization by query length,
the number of matching reads against algal queries was about 100 times lower than that against
PoB single-copy genes: the normalized read count (mean ± SD) was 25 ± 105 for the A614 dataset
and 2601 ± 2173 for the 905 PoB single-copy genes (pResearch article Evolutionary Biology
Figure 4C). This massive difference indicated that most algae-like reads come from contaminating
microalgae rather than PoB nucDNA. For six algal queries (e.g., peptidyl-prolyl cis-trans isomerase
gene), the number of matching reads was comparable between PoB and the A614 dataset
(Figure 4C; the normalized read count was higher than 100). However, the presence of homologous
genes on the PoB genome (e.g., p310c70.15) suggests that the reads were not derived from an
algae-derived region but rather resemble molluskan genes. For example, a simple alignment showed
that the C. lentillifera-derived g566.t1 gene (encoding peptidyl-prolyl cis-trans isomerase) was par-
tially similar to the PoB p310c70.15 gene, and 76% (733/970) of reads that hit against g566.t1 were
also hitting against p310c70.15 under the same MMseq2 parameter (Figure 4—figure supplement
9). Hence, it was considered that no loss of algal-derived HGT regions occurred in the assembly
process.
Changing the focus to HGT of non-photosynthetic algal genes, the indices for prokaryote-derived
HGT (h-index; Boschetti et al., 2012) and algae-derived HGT (hA-index; see Materials and methods)
were calculated for PoB and two non-kleptoplastic gastropods (negative controls;
Supplementary file 8). Three PoB gene models as potential algae-derived genes were detected
(Figure 4D); however, two of these encoded a transposon-related protein, and the other encoded
an ankyrin repeat protein with a conserved sequence with an animal ortholog (Figure 4—source
data 1). Furthermore, non-kleptoplastic gastropods (e.g., Aplysia californica) had similar numbers of
probable HGT genes (Figure 4D). Taking these results together, it was concluded that there is no
evidence of algae-derived HGT in the PoB genomic data.
The presence of algae-like RNA in PoB was then examined, as a previous study of another sea
slug species E. chlorotica hypothesized that algae-derived RNA contributes to kleptoplasty
(Bhattacharya et al., 2013). This previous study used short-read-based blast searches and reverse
transcription PCR analyses to detected algal mRNA (e.g., psbO mRNA) in multiple adult E. chlorotica
specimens (no tissue information was provided; Bhattacharya et al., 2013). To analyze the algal
RNA distribution in PoB, 15 RNA-Seq libraries were constructed from six tissue types (digestive
gland [DG], parapodium, DG-exenterated parapodium [DeP], egg, head, and pericardium; Fig-
ure 4—figure supplement 10), and MMseq2 searches were conducted (Figure 4C). Although
almost all (594/614) of the A614 dataset queries matched no reads, 19 queries matched 1–10 reads
and the C. lentillifera-derived g566.t1 query matched more than 10 reads (Figure 4E). This high hit
rate for g566.t1 (peptidyl-prolyl cis-trans isomerase in Figure 4E), however, is due to its high
sequence similarity with PoB ortholog, p310c70.15, as mentioned above. A previous anatomical
study showed the kleptoplast density in various tissues to be DG > parapodium > DeP = head =
pericardium >>> egg (Hirose, 2005). Therefore, the amount of algae-like RNA reads did not corre-
late with the kleptoplast richness among the tissues. Enrichment of algae-like RNA was only found in
the egg (Figure 4E). The PoB egg is considered a kleptoplast-free stage and is covered by a mucous
jelly, which potentially contains environmental microorganisms (Figure 4—figure supplement 10).
Hence, it was presumed that these RNA fragments are not derived from kleptoplasts but from con-
taminating microalgae. The searches for algae-like RNA in PoB found no credible evidence of algae-
derived RNA transfer and no correlation between algal RNA and kleptoplasty.
What kind PoB genes are reasonable candidates for kleptoplasty-
related genes?
Because the PoB genome was found to be free of algae-derived genes, it was considered that a neo-
functionalized molluskan gene might contribute to kleptoplasty. To find candidate kleptoplasty-
related molluskan (KRM) genes, we assessed genes that were up-regulated in DG (the primary klep-
toplasty location) versus DeP in the RNA-Seq data described above. As a result, 162 DG-up-regu-
lated genes were found (false discovery rate [FDR] < 0.01, triplicate samples; Figure 5A; Figure 5—
figure supplements 1 and 2; Supplementary file 9). By conducting GO analysis, the functions of 93
DG-up-regulated genes were identified. These up-regulated genes are enriched for genes involved
in proteolysis (GO terms: ‘Proteolysis,’ ‘Aspartic-type endopeptidase activity,’ ‘Cysteine-type endo-
peptidase inhibitor activity’, and ‘Anatomical structure development’), carbohydrate metabolism
(‘Carbohydrate metabolic process’, ‘One-carbon metabolic process’, ‘Cation binding’, and ‘Regula-
tion of pH’), and immunity (‘Defense response’; Supplementary file 10). Manual annotation identi-
fied the function of 42 of the remaining DG-up-regulated genes. Many of these are also related to
proteolysis and immunity: three genes relate to proteolysis (i.e., genes encoding interferon-g-
Maeda et al. eLife 2021;10:e60176. DOI: https://doi.org/10.7554/eLife.60176 11 of 32Research article Evolutionary Biology
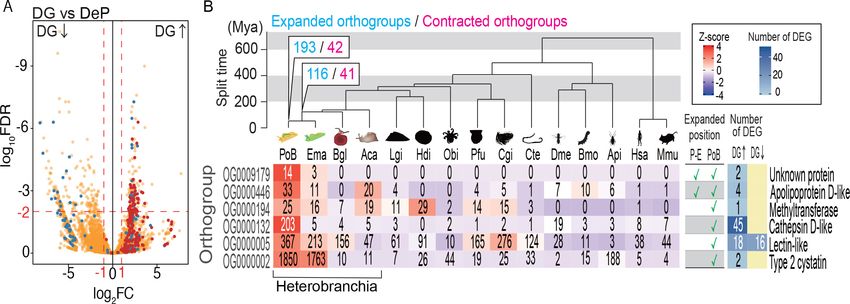
Figure 5. Probable KRM genes in PoB. (A) Volcano plot comparing gene expressions in DG and DeP tissues of PoB. Red, orthogroup OG0000132
(cathepsin D-like protease genes); blue, orthogroup OG0000005 (lectin-like genes); orange, other orthogroups (for details, see Figure 5—figure
supplement 2). Up and down arrows signify up- and down-regulation, respectively, in DG. (B) Orthogroups expanded on the P. ocellatus lineage and
containing DG-up-regulated genes. Ema, E. marginata; Bgl, B. glabrata; Lgi, Lottia gigantea; Hdi, Haliotis discus; Obi, Octopus bimaculoides; Pfu,
Pinctada fucata; Cgi, Crassostrea gigas; Cte, Capitella teleta; Dme, D. melanogaster; Bmo, Bombyx mori; Api, A. pisum; Hsa, Homo sapiens; Mmu. Mus
musculus. The phylogenetic tree was scaled to divergence time based on 30 conserved single-copy genes. Mya, million years. The numbers of rapidly
expanded (blue) and contracted (magenta) orthogroups on the lineages to PoB are provided at the nodes (for details, see Figure 5—figure
supplements 4 and 5). Below the tree is information for the six expanded orthogroups that contained DG-up-regulated genes. The left-side heatmap
shows the gene numbers (number in boxes) and Z-score of gene numbers (color gradient) for each orthogroup. The table shows the expanded/not
expanded status of each orthogroup (P–E, Plakobranchus-Elysia node; PoB, Plakobranchus node). The right-side heat map indicates the number of
DEGs between DG and DeP tissue in each orthogroup. Representative gene products are given on the far right. The source files of RNA-Seq analysis
and comparative genomic analysis are available in raw data Figure 5—source data 1 and 2, respectively.
The online version of this article includes the following source data and figure supplement(s) for figure 5:
Source data 1. KRM gene searching using RNA-Seq.
Source data 2. KRM gene searching using ortholog analysis.
Figure supplement 1. DG-up-regulated genes by the RNA-seq comparison with -DeP samples.
Figure supplement 2. Volcano plot of the cross-tissue comparison between DG and DeP samples.
Figure supplement 3. The procedure of gene family history analyses.
Figure supplement 4. CAFE-based all rapidly expanding/contracting genes on the sacoglossan linage.
Figure supplement 5. Z-score-based rapidly expanding/contracting genes on the P. ocellatus linage (Threshold: Z-score > 2).
inducible lysosomal thiol reductase, replicase polyprotein 1a, and phosphatidylethanolamine-binding
protein), and 21 genes contribute to natural immunity (i.e., genes encoding lectin, blood cell aggre-
gation factor, and MAC/perforin domain-containing protein; Figure 5—figure supplements 1 and
2). Manual annotation also found four genes encoding apolipoprotein D, which promotes resistance
to oxidative stress (Charron et al., 2008), and three genes involved in nutrition metabolism (i.e.,
genes encoding betaine-homocysteine S-methyltransferase 1-like protein, intestinal fatty acid-bind-
ing protein, and cell surface hyaluronidase). Because the analyzed slugs were starved for 1 month, it
was considered that DG-up-regulated genes contribute to kleptoplasty rather than digestion.
A comparative genomic analysis was then conducted to find orthogroups that expand or contract
in size along the metazoan lineage to PoB. The phylogenomic analysis showed that 6 of the 193
orthogroups that underwent gene expansion in this lineage contained DG-up-regulated genes
(Figure 5B; Figure 5—figure supplement 3–5; Supplementary file 11). This result supported the
notion that these DG-up-regulated genes play a role in kleptoplasty. The most distinctive
orthogroup in the six groups was OG0000132, which contained 203 cathepsin D-like genes of PoB.
Forty-five of the 203 genes were DG-up-regulated, and Fisher’s exact test supported the significant
enrichment of DG-up-regulated genes (pResearch article Evolutionary Biology
in PoB might reduce selection pressure to maintain function via redundancy and promote new func-
tion acquirement of the paralogs, as occurs in the well-known neofunctionalization scenario
(Conrad and Antonarakis, 2007). Significant enrichment of DG-up-regulated genes was also
detected in OG0000005 (18 genes) and OG0000446 (four genes; both p0.05). OG0000002 con-
tains DG-up-regulated gene for type two cystatin and various genes with reverse transcriptase
domains. This result suggested that the reverse transcriptase domain clustered the various genes as
one orthogroup, and the gene number expansion was due to the high self-duplication activity of the
retrotransposon in PoB. OG0009179 and OG0000194 contain DG-up-regulated genes of unknown
function. From the above results, 67 genes were finally selected as promising targets of study for
PoB kleptoplasty: 45 genes for cathepsin D-like proteins, 18 genes for lectin-like proteins, and 4
genes for apolipoprotein D-like protein (Supplementary file 9).
Evolution of candidate KRM genes
For a more detailed analysis of the evolution of KRM genes in sacoglossan lineages, a new draft
genome sequence of another sacoglossan sea slug E. marginata (previously included in E. ornata;
Krug et al., 2013) was constructed. PoB and E. marginata belong to the same family (Plakobranchi-
dae; Figure 1B). Both species sequester plastids from Bryopsidales algae; however, the kleptoplast
retention time is limited to a few days in E. marginata (Yamamoto et al., 2009). These features sug-
gested that their common ancestor obtained a mechanism to sequester algal plastids, but E. margin-
ata did not develop a system for their long-term retention. Hence, it was considered that comparing
gene expansion in these species would clarify the genetic basis of plastid sequestration and long-
term retention.
Using the same methods as described for PoB, one complete circular kpDNA, one complete
mtDNA, and 790.3 Mbp nucDNA (87.8% of the estimated genome size; 14,149 scaffolds;
N50 = 0.23 Mbp; 70,752 genes; Supplementary files 1, 4, 13, and 14) were sequenced for E. mar-
ginata. The constructed gene models covered 89.5% of the BUSCO eukaryota_odb9 gene set
(Supplementary file 4). No credible photosynthetic gene was detected from E. marginata nucDNA
(annotation data; DOI: 10.6084/m9.figshare.13042016).
The evolution of representative candidate PoB KRM genes (i.e., cathepsin D-like, apolipoprotein
D-like, and lectin-like genes) was then phylogenetically analyzed. In cathepsin D-like genes, sacoglos-
san (PoB and E. marginata) genes formed a specific subgroup in the OG0000132 phylogenetic tree
(Figure 6A), and gene duplication in OG0000132 seemed to be accelerated along the PoB lineage
(203 genes in PoB versus five genes in E. marginata; Figure 5B). All sacoglossan cathepsin D-like
genes belonged to a clade with several other heterobranchian homologs; this clade contained three
subclades (a, b, and g in Figure 6B). The basal a-clade contained three A. californica genes, one Bio-
mphalaria glabrata gene, and three sacoglossan genes. The b- and g-clades contained sacoglossan
genes only and an A. californica gene located at the basal position of the b- and g-clades. Almost all
duplicated PoB genes (201/203) belonged to the g-clade, including one E. marginata gene
(e8012c40.2). These phylogenetic relationships suggested that the g-clade has undergone dozens of
gene duplication events in the PoB lineage. Interestingly, all DG-up-regulated differentially
expressed genes (DEGs) belonged to the g-clade, and the PoB paralogs that belong to the a- and b-
clades showed different expression patterns from the g-clade paralogs; the gene p609c69.52 (a-
clade) was ubiquitously expressed in the examined tissues, and p374c67.53 (b-clade) was expressed
only in the egg (Figure 6B). The mammalian genes encoding cathepsin D and its analog (cathepsin
E) were ubiquitously expressed on various tissue types (Benes et al., 2008). Therefore, we consid-
ered that (1) the ubiquitously expressed p609c69.52 gene in a-clade is a functional ortholog of the
mammalian cathepsin D gene, (2) the p374c67.53 gene in b-clade relates sea slug embryo develop-
ment, and (3) the g-clade genes have been acquired with the development of plastid sequestration.
To test the positive or relaxed selection on the duplication event, the ratio of substitution rates at
non-synonymous (dN) and synonymous (dS) sites (w = dN/dS) was used. Longly alignable hetero-
branchian genes from OG0000132 were used and statistically tested using CodeML and RELAX soft-
ware (Supplementary file 12). The CodeML analysis (branch-site model) determined no significant
positive selection on the basal node of the g-clade (p>0.05, c2 test), but RELAX suggested that the
Maeda et al. eLife 2021;10:e60176. DOI: https://doi.org/10.7554/eLife.60176 13 of 32You can also read