Northern Rivers Regional Profile - NOVEMBER 2013 - APO
←
→
Page content transcription
If your browser does not render page correctly, please read the page content below
Northern Rivers Regional Profile
NOVEMBER 2013

 Northern Rivers Regional Profile 2013   i
Level 3 Rous Water Building
             218 Molesworth St
             PO Box 146
             LISMORE NSW 2480

                   tel:   02 6622 4011
                  fax:    02 6621 4609
                email:    info@rdanorthernrivers.org.au
                 web:     www.rdanorthernrivers.org.au

             Chief Executive Officer: Katrina Luckie

RDA–Northern Rivers would like to acknowledge the contributions of its officers Jamie Seaton, Kyllie Walker,
Katrina Luckie and Geof Webb in researching, analysing and communicating the data in this report.

Cover photo: Students at Brunswick Heads Public School © 2013 Verity Bee

© Regional Development Australia – Northern Rivers, October 2013

Citation: Regional Development Australia – Northern Rivers, Northern Rivers Regional Profile 2013,
RDA–Northern Rivers, 2013.

We respectfully acknowledge the Aboriginal peoples of the Northern Rivers – including the peoples of the Bundjalung,
Yaegl and Gumbaynggirr nations – as the traditional custodians and guardians of these lands and waters now known
as the Northern Rivers and we pay our respects to their Elders past and present.

Disclaimer
This material is made available by RDA – Northern Rivers on the understanding that users exercise their own skill and
care with respect to its use. Any representation, statement, opinion or advice expressed or implied in this publication
is made in good faith. RDA – Northern Rivers is not liable to any person or entity taking or not taking action in respect
of any representation, statement, opinion or advice referred to above. This report was produced by RDA–Northern
Rivers and does not necessarily represent the views of the Australian or New South Wales Governments, their officers,
employees or agents.

Regional Development Australia Committees are:
TABLE OF CONTENTS
INTRODUCTION ............................................................................................................................ 1
OVERVIEW OF THE REGION ........................................................................................................... 2
SOCIAL AND DEMOGRAPHIC PROFILE: OUR PEOPLE....................................................................... 9
        Population ...................................................................................................................................... 9
        Regional population structure ..................................................................................................... 10
        Indigenous population structure ................................................................................................. 11
        Population forecast ...................................................................................................................... 13
        Internal migration ........................................................................................................................ 14
        Cultural diversity .......................................................................................................................... 16
        Housing ........................................................................................................................................ 18
        Income ......................................................................................................................................... 25
        Crime ............................................................................................................................................ 30
        Health ........................................................................................................................................... 35
        Education ..................................................................................................................................... 39
        Socio-economic indexes for areas (SEIFA) ................................................................................... 43
SERVICES .................................................................................................................................... 44
        Infrastructure investment ............................................................................................................ 44
        Transport...................................................................................................................................... 45
        Information Technology and Communications ........................................................................... 47
        Education ..................................................................................................................................... 48
        Health ........................................................................................................................................... 49
        Retirement and aged care facilities ............................................................................................. 51
        Community, cultural, sport and recreation ................................................................................. 52
ECONOMIC PROFILE.................................................................................................................... 54
        Employment ................................................................................................................................. 54
        Business profile ............................................................................................................................ 56
        Industry growth and share ........................................................................................................... 60
        Gross regional product................................................................................................................. 61
        Regional competitiveness ............................................................................................................ 63
ENVIRONMENTAL PROFILE.......................................................................................................... 64
        Cultural heritage .......................................................................................................................... 65
        Biodiversity .................................................................................................................................. 67
        Protected areas ............................................................................................................................ 70
        Water resources........................................................................................................................... 72
        Energy resources .......................................................................................................................... 73
REFERENCES ............................................................................................................................... 77
ACRONYMS ................................................................................................................................ 81
AUSTRALIAN BUREAU OF STATISTICS POPULATION DEFINITIONS ................................................. 82

Northern Rivers Regional Profile 2013                                                                                                                     iii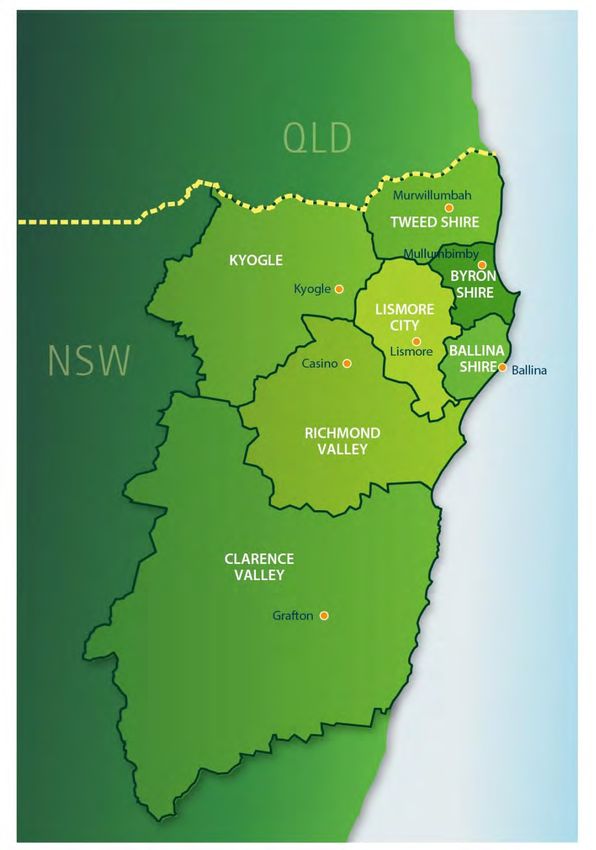
LIST OF TABLES

TABLE 1 – ESTIMATED RESIDENT POPULATION .......................................................................................9
TABLE 2 – POPULATION CHANGE 2001-2011.......................................................................................9
TABLE 3 – POPULATION FORECAST NORTHERN RIVERS AND NSW 2011-2031 .........................................13
TABLE 4 – POPULATION FORECAST FIGURES BY LGA 2011-2031 ...........................................................13
TABLE 5 – INTERNAL MIGRATION 2006-2011.....................................................................................15
TABLE 6 – CHANGES IN INTERNAL MIGRATION 2006 & 2011 .................................................................15
TABLE 7 – CHANGES IN INTERNAL MIGRATION BY AGE GROUP 2006 AND 2011 .........................................16
TABLE 8 – COUNTRY OF BIRTH ..........................................................................................................17
TABLE 9 – MEDIAN HOUSING COSTS 2012..........................................................................................19
TABLE 10 – TYPE OF HOUSING TENURE 2011 ......................................................................................22
TABLE 11 – HOMELESSNESS ESTIMATES: AUSTRALIA 2006 AND 2011 .....................................................23
TABLE 12 – NUMBER OF HOMELESS PERSONS 2011 .............................................................................24
TABLE 13 – WEEKLY PERSONAL INCOME 2011 ....................................................................................26
TABLE 14 – LABOUR FORCE DECEMBER 2012 .....................................................................................29
TABLE 15 – SELF-RATED HEALTH AS EXCELLENT, VERY GOOD OR GOOD ......................................................35
TABLE 16 – BURDEN OF DISEASE .......................................................................................................38
TABLE 17 – HEALTH INEQUALITIES .....................................................................................................38
TABLE 18 – HIGHEST LEVEL OF POST-SECONDARY EDUCATION ATTAINMENT ..............................................40
TABLE 19 –SEIFA SCORES AND RANKINGS ..........................................................................................43
TABLE 20 – PASSENGER VEHICLE, BUS AND MOTORCYCLE REGISTRATIONS PER 7,000 (NORTHERN RIVERS)......46
TABLE 21 – CHANGE IN PASSENGER NUMBERS FOR NORTHERN RIVERS AIRPORTS .......................................46
TABLE 22 – HEALTH SERVICES IN THE NORTHERN NSW LHD .................................................................49
TABLE 23 – PEOPLE AGED 65 YEARS AND OLDER ..................................................................................51
TABLE 24 – CULTURAL VENUES BY PURPOSE ........................................................................................52
TABLE 25 – ARTS ORGANISATIONS BY LGA .........................................................................................53
TABLE 26 – SPORTS INFRASTRUCTURE BY LGA .....................................................................................53
TABLE 27 – GROSS REGIONAL PRODUCT 2009-2010 ...........................................................................62
TABLE 28 – NATIONAL COMPETITIVENESS RANKINGS .............................................................................63
TABLE 29 – CLIMATE DATA: NORTH COAST BIOREGION .........................................................................64
TABLE 30 – DECLARED ABORIGINAL PLACES ........................................................................................66
TABLE 31 – NUMBER AND STATUS OF THREATENED SPECIES....................................................................67
TABLE 32 – PROTECTED TERRESTRIAL AREAS IN NSW BY REGION .............................................................70
TABLE 33 – NATIONAL PARKS AND NATURE RESERVES ..........................................................................71
TABLE 34 – STATE CONSERVATION AREAS ...........................................................................................72
TABLE 35 – WATER QUALITY ............................................................................................................73
TABLE 36 – RENEWABLE ENERGY GENERATED PER CAPITA ......................................................................74
TABLE 37 – SOLAR INSTALLATIONS BY POSTCODE ..................................................................................75
TABLE 38 – GREENHOUSE GAS EMISSIONS...........................................................................................76

iv                                                                              Regional Development Australia – Northern Rivers
LIST OF FIGURES

FIGURE 1 – NORTHERN RIVERS REGION ................................................................................................ 2
FIGURE 2 – NORTHERN RIVERS NATIONAL PARKS .................................................................................. 3
FIGURE 3 – NORTHERN RIVERS LGA BOUNDARIES ................................................................................. 4
FIGURE 4 – BALLINA LGA ................................................................................................................. 5
FIGURE 5 – BYRON SHIRE LGA ........................................................................................................... 5
FIGURE 6 – CLARENCE VALLEY LGA .................................................................................................... 6
FIGURE 7 – KYOGLE LGA .................................................................................................................. 6
FIGURE 8 – LISMORE CITY COUNCIL LGA ............................................................................................. 7
FIGURE 9 – RICHMOND VALLEY LGA ................................................................................................... 7
FIGURE 10 – TWEED SHIRE LGA ........................................................................................................ 8
FIGURE 11 – POPULATION STRUCTURE BY AGE AND SEX 2012 ................................................................ 10
FIGURE 12 – DEPENDENCY RATIOS 2011-2031 ................................................................................. 11
FIGURE 13 – INDIGENOUS POPULATION STRUCTURE BY AGE AND SEX 2011............................................... 12
FIGURE 14 – INDIGENOUS AND NON-INDIGENOUS POPULATION BY AGE.................................................... 12
FIGURE 15 – FORECAST POPULATION STRUCTURE BY AGE AND SEX 2036 .................................................. 14
FIGURE 16 – PERSONS PER HOUSEHOLD AS PROPORTION OF ALL HOUSEHOLDS 2011 .................................. 18
FIGURE 17 – HOUSEHOLD TYPES AS A PROPORTION OF ALL HOUSEHOLDS 2011 ......................................... 19
FIGURE 18 – WEEKLY RENTAL PAYMENTS 2011 .................................................................................. 20
FIGURE 19 – MEDIAN WEEKLY RENTS 2009-2013 .............................................................................. 20
FIGURE 20 – MEDIAN HOUSE SALE PRICES .......................................................................................... 21
FIGURE 21 – MORTGAGE AND RENT STRESS 2011 ............................................................................... 22
FIGURE 22 – DURATION OF HOMELESSNESS ........................................................................................ 24
FIGURE 23 – WEEKLY HOUSEHOLD INCOME 2011 ............................................................................... 25
FIGURE 24 – INCOME FROM ALL PENSIONS AND ALLOWANCES 2004-2010 .............................................. 27
FIGURE 25 – INCOME FROM PENSIONS 2004-2010 ............................................................................ 27
FIGURE 26 – UNEMPLOYMENT RATES 2008-2013 .............................................................................. 28
FIGURE 27 – EMPLOYMENT HOURS WORKED 2011.............................................................................. 29
FIGURE 28 – RATES FOR SELECTED OFFENCES ...................................................................................... 30
FIGURE 29 – CRIME RATES: ASSAULT, SEXUAL OFFENCES AND ROBBERY .................................................... 31
FIGURE 30 – CRIME RATES: BREAK AND ENTER, THEFT AND MALICIOUS PROPERTY DAMAGE .......................... 32
FIGURE 31 – CRIME RATES: ARSON, CANNABIS, WEAPONS, OFFENSIVE LANGUAGE AND WEAPONS OFFENCES ... 33
FIGURE 32 – CRIME RATES: LIQUOR, BREACHES OF AVOS AND RESIST/HINDER OFFICER OFFENCES ................. 34
FIGURE 33 – ADEQUATE PHYSICAL ACTIVITY ........................................................................................ 35
FIGURE 34 – FRUIT AND VEGETABLE CONSUMPTION ............................................................................. 36
FIGURE 35 – ALCOHOL CONSUMPTION .............................................................................................. 36
FIGURE 36 – ALCOHOL-ATTRIBUTABLE HOSPITALISATIONS ..................................................................... 37
FIGURE 37 – SMOKING PREVALENCE ................................................................................................. 37
FIGURE 38 – OVERWEIGHT OR OBESE PERSONS AGED 16 YEARS OR OLDER ................................................ 38
FIGURE 39 – SCHOOL LEAVER PARTICIPATION IN HIGHER EDUCATION 2012 .............................................. 39

Northern Rivers Regional Profile 2013                                                                                                   v
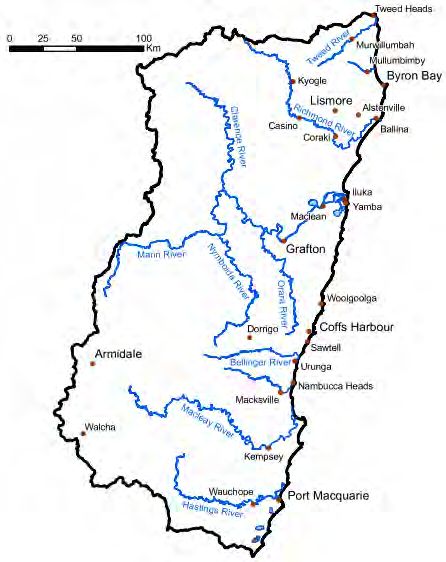
FIGURE 40 – HIGHEST SECONDARY SCHOOL ATTAINMENT ......................................................................40
FIGURE 41 – TERTIARY EDUCATIONAL ATTAINMENT BY POPULATION.........................................................41
FIGURE 42 – TERTIARY EDUCATIONAL ATTAINMENT BY QUALIFICATION .....................................................41
FIGURE 43 – HIGHEST SECONDARY SCHOOL COMPLETIONS .....................................................................42
FIGURE 44 – EDUCATIONAL ATTAINMENT AND LABOUR MARKET OUTCOMES ..............................................42
FIGURE 45 – REGISTERED MOTOR VEHICLES PER 1,000 IN MARCH 2010 ................................................45
FIGURE 46 – INTERNET CONNECTIVITY 2011 .......................................................................................48
FIGURE 47 – HOSPITAL BEDS PER 100,000 POPULATION .......................................................................50
FIGURE 48 – RESIDENTIAL CARE PLACES 2011 .....................................................................................52
FIGURE 49 – EMPLOYMENT BY OCCUPATION 2011 ..............................................................................54
FIGURE 50 – EMPLOYMENT BY INDUSTRY 2011 ...................................................................................55
FIGURE 51 – EMPLOYMENT BY INDUSTRY 2001, 2006 AND 2011 .........................................................56
FIGURE 52 – BUSINESSES BY NUMBER OF EMPLOYEES 2012 ...................................................................57
FIGURE 53 – BUSINESSES BY INDUSTRY SECTOR 2012 ...........................................................................57
FIGURE 54 – NUMBER OF BUSINESSES 2007-2011..............................................................................58
FIGURE 55 – BUSINESSES BY EMPLOYMENT SIZE 2007-2011 .................................................................58
FIGURE 56 – LOCATION QUOTIENT BY INDUSTRY 2011 ..........................................................................59
FIGURE 57 – LOCATION QUOTIENT BY INDUSTRY SUB-SECTORS 2011 .......................................................60
FIGURE 58 – INDUSTRY GROWTH AND SHARE 2006 - 2011 ...................................................................61
FIGURE 59 – NORTHERN RIVERS CATCHMENT MANAGEMENT AREA ........................................................65
FIGURE 60 – EXTANT VEGETATION ....................................................................................................69
FIGURE 61 – HABITAT RESTORATION 2011-2012 ...............................................................................69

vi                                                                            Regional Development Australia – Northern Rivers
INTRODUCTION
Welcome to the Northern Rivers Regional Profile 2013, which provides an update to the 2011 edition
and provides some new data, including the 2011 Census updates. It is one of a portfolio of six
documents that together comprise the Northern Rivers regional planning suite/documents. The
other documents are:
Northern Rivers Regional Plan 2013-2016
Northern Rivers Regional Industry and Economic Profile (2010 Update)
RDA–Northern Rivers Community Engagement Strategy (2013)
Northern Rivers Digital Economy Strategy (2013)
Northern Rivers Social Plan (in draft at the time of publication)
Purpose
This profile is intended to be a comprehensive snapshot of the NSW Northern Rivers region but is by
no means exhaustive. Its purpose is to provide data and trend information on a wide range of social,
economic and environmental features of the region. It can be used by government organisations,
businesses, not-for-profit and other community stakeholders as an aid to planning regional
development activities and services; to support advocacy efforts; and to provide an evidence-base
for applications for funding and other resources.
The data
Most of the data collated here is already in the public domain. Much is drawn from the Australian
Bureau of Statistics’ (ABS) Population of Census and Housing 2011. Generally the data are presented
for LGAs within the Northern Rivers and aggregated to present a picture of the region as a whole.
Where time series data are available, they have been used to identify trends and, depending on the
data source, the regional data is often compared to the rest of New South Wales and in some cases
Australia as a whole. A guide to ABS definitions is shown in the final chapter.
Some of the data have been drawn from other sources including the unpublished Northern Rivers
Community Wellbeing Survey 2013 (NRSDC/RDA-Northern Rivers, in press). Please see the references
section for the full list of data sources.
More information
The data sets from which most of the data in this document are taken, and copies of this document
and its companions from the Northern Rivers Regional Plan are all available to download from our
website: www.rdanorthernrivers.org.au/our-region/regional-data/
Northern Rivers Regional Profile 2013 1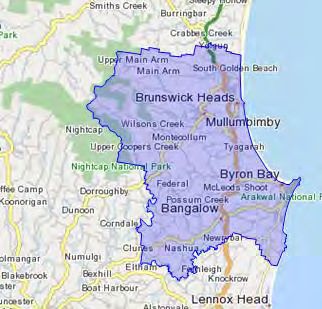
OVERVIEW OF THE REGION
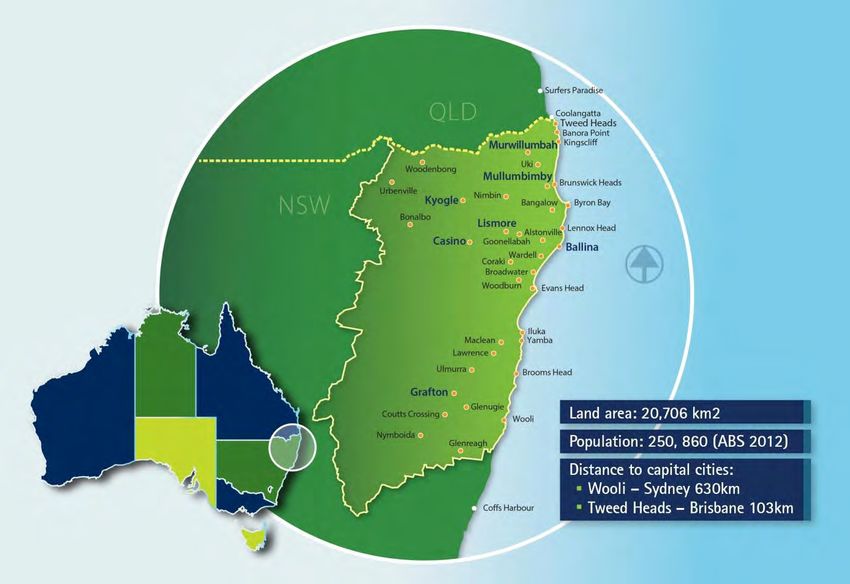
Geography, traditional ownership and key characteristics
The Northern Rivers region of NSW is situated in the far north-east of the state and covers 20,706
square kilometres (ABS 2012). It is bounded by the NSW state border to the north, the Great Dividing
Range to the west, the mid-north coast region to the south and more than 200 kilometres of
coastline to the east.
The Bundjalung, Yaegl and Gumbaynggirr Aboriginal nations are the traditional owners of the lands
within the region and they maintain important custodial links to it. Seven Local Government Areas
(LGAs) have been established in the region and these entities also play an important role in the
region’s development.
Figure 1 – Northern Rivers region
The population and social life in the region is vibrant and diverse. The region is well known for
tourism, creative industries, festivals and community activism that increase wellbeing within its
communities. Some examples of community events in 2012 that attest to the region’s rich social life
include the Byron Bay Surfing Festival, Grafton’s Jacaranda Festival, the annual Tropical Fruits Festival
and the Lismore rally against Coal Seam Gas. In terms of the Northern Rivers population per se, some
unique features distinguish it from the broader NSW population. These features include relatively
unusual proportions of young adults, older people and Aboriginal people, and the recent high
population growth observed in the region, which is now tapering off in most localities.
2 Regional Development Australia – Northern Rivers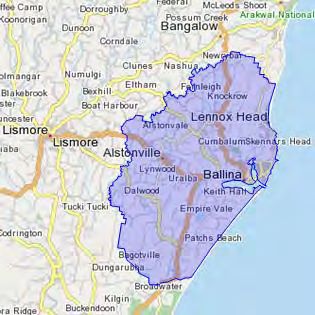
Like the social characteristics, the economic ones are similarly diverse, providing a degree of stability
against volatile macro-economic conditions. Tourism, retail, human services and agriculture underpin
the economic base of the region. Agriculture and horticulture remain important industries and
“diversification into value-added items (such as specialised botanicals and high quality timber
products) is contributing to the development of the region” (DEEWR 2012). Other large scale,
regional infrastructure projects including the Pacific Highway upgrade and construction of the new
$45 million wastewater treatment plant at West Ballina are providing new employment
opportunities.
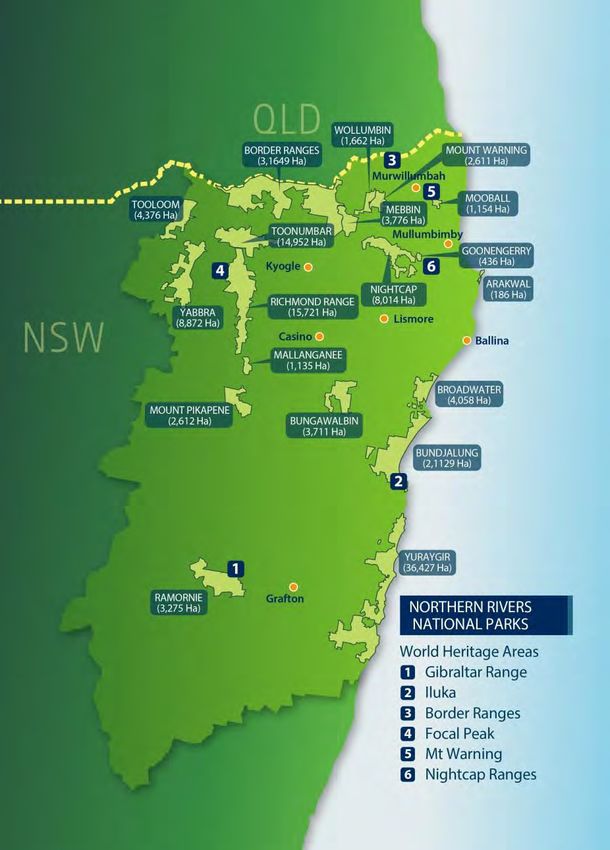
In terms of the environment, the region is characterised by attractive natural assets derived from its
sub-tropical climate. Above average rainfall, fertile soils and moderate temperatures throughout the
year provide ideal conditions for flora and fauna. The North Coast Bioregion, which incorporates the
Northern Rivers, is one of the most diverse in NSW (NSW Department Environment and Heritage
2011). The virtues of our natural environment are readily apparent across the region in the range of
marine parks including Cape Byron, national parks such as The Border Ranges and coastal ecosystems
including the Jerusalem Creek estuary system near Evans Head.
Figure 2 – Northern Rivers National Parks
Northern Rivers Regional Profile 2013 3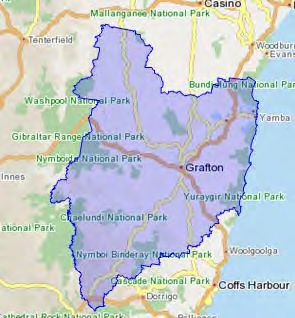
Local Government Areas
Seven Local Government Areas comprise the Northern Rivers – traditionally the home of the
Bundjalung, Yaegl and Gumbaynggirr nations – which has also been known as Sub-tropical NSW,
the ‘North Coast’, the ‘Summerland Region’ and the ‘Rainbow Region’.

                             Figure 3 – Northern Rivers LGA boundaries

4                                                           Regional Development Australia – Northern Rivers
Ballina Shire
Figure 4 – Ballina LGA
Population 39,274
Male 18,842
Female 20,432
Median age 45
Families 10,953
Average children per family 1.8
All private dwellings 18,024
Average people per household 2.4
Median weekly household income $930
Median monthly mortgage repayments
$1,733
Median weekly rent $290
Major employment industries
School education (6.7%)
Cafes and food services (5.0%)
Residential care services and hospitals (3.4%)
2
land area 484.7 Km
Byron Shire
Figure 5 – Byron Shire LGA
Population 29,209
Male 14,285
Female 14,924
Median age 42
Families 7,425
Average children per family 1.7
All private dwellings 14,455
Average people per household 2.4
Median weekly household income $885
Median monthly mortgage
repayments $1,684
Median weekly rent $350
Major employment industries
Cafes and food services (6.2%)
School education (4.7%)
Accommodation (4.5%)
land area 565.8 Km2
Northern Rivers Regional Profile 2013 5Clarence Valley
Figure 6 – Clarence Valley LGA
Population 49,665
Male 24,515
Female 25,150
Median age 46
Families 13,678
Average children per family 1.9
All private dwellings 23,881
Average people per household 2.4
Median weekly household income $768
Median monthly mortgage repayments $1,300
Median weekly rent $210
Major employment industries
School education (5.5%)
Cafes and food services (4.0%)
Residential care services (3.5%)
2
land area 1,0428.8 Km
Kyogle
Figure 7 – Kyogle LGA
Population 9,228
Male 4,642
Female 4,586
Median age 45
Families 2,510
Average children per family 1.9
All private dwellings 4,397
Average people per household 2.4
Median weekly household income $714
Median monthly mortgage repayments $1,083
Median weekly rent $170
Major employment industries
Sheep, beef cattle and grain farming (10.7%)
School education (6.7%)
Hospitals (3.8%)
2
land area 3,584 Km
6 Regional Development Australia – Northern RiversLismore City Council
Figure 8 – Lismore City Council LGA
Population 42,766
Male 20,904
Female 21,862
Median age 40
Families 11,244
Average children per family 1.9
All private dwellings 18,467
Average people per household 2.4
Median weekly household income $907
Median monthly mortgage repayments $1,495
Median weekly rent $224
Major employment industries
School education (5.9%)
Hospitals (5.5%)
Cafes and food services (4.5%)
2
land area = 1,287.8 Km
Richmond Valley
Figure 9 – Richmond Valley LGA
Population 22,037
Male 10,905
Female 11,132
Median age 42
Families 5,981
Average children per family 1.9
All private dwellings 10,019
Average people per household 2.4
Median weekly household income $789
Median monthly mortgage repayments $1,300
Median weekly rent $200
Major employment industries
Meat and meat product manufacturing (7.2%)
School education (5.4%)
Cafes and food services (3.7%) 2
land area = 3,047.4 Km
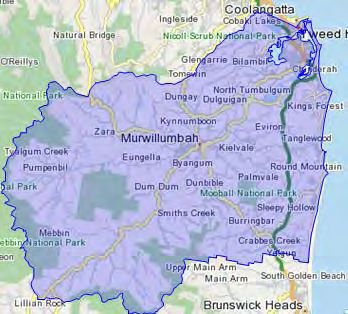
Northern Rivers Regional Profile 2013 7Tweed Shire
Figure 10 – Tweed Shire LGA
Population 85,105
Male 41,012
land area 1,307.4 Km2
Female 44,093
Median age 45
Families 23,297
Average children per family 1.8
All private dwellings 40,084
Average people per household 2.4
Median weekly household income $845
Median monthly mortgage repayments $1,733
Median weekly rent $295
Major employment industries
School education (5.1%)
Cafes and food services (5.1%)
Residential care services (3.9%)
8 Regional Development Australia – Northern RiversSOCIAL AND DEMOGRAPHIC PROFILE: OUR PEOPLE
The population maintains the Northern Rivers as a lively, attractive and welcoming region. The social
fabric is varied, comprising a mix of people with a diverse range of characteristics including Aboriginal
people, young and older people, those living with a disability, gay, lesbian and transgender people
and people from different ethnic and religious backgrounds.
Population
Table 1 shows that in 2011 on Census enumeration night, 277,284 people (approximately 4% of the
NSW population) were counted in the Northern Rivers (ABS 2012), which is fewer than the published
estimated resident population (ERP) of 287,809 (ABS 2012).
Table 1 – Estimated Resident Population
LGA/Region 2005 2006 2007 2008 2009 2010 2011
Ballina 39,857 40,293 40,411 40,534 40,650 40,693 40,753
Byron 30,614 30,700 30,641 30,860 30,952 30,924 30,825
Clarence
49,580 50,089 50,295 50,467 50,880 51,137 51,252
Valley
Kyogle 9,641 9,672 9,631 9,591 9,597 9,572 9,537
Lismore 43,617 44,166 44,305 44,283 44,284 44,267 44,282
Richmond
21,555 22,143 22,388 22,567 22,601 22,647 22,697
Valley
Tweed 81,549 83,089 84,126 85,965 87,356 88,063 88,463
Total NR 276,413 280,152 281,797 284,267 286,320 287,303 287,809
Total NSW 6,756,457 6,816,087 6,885,204 6,975,891 7,069,707 7,144,928 7,211,468
(source: ABS 2012a)
Table 2 – Population change 2001-2011
Population changes in the region have broadly been in
line with those in the rest of the State. With the Change 2001-2011
LGA/Region
exception of Kyogle, all Northern Rivers LGAs % No.
experienced growth between 2001-2011. Table 2 shows
Ballina 6.8 2,594
that growth in the Tweed increased by 18.6% during the
period; almost double the statewide figure. Richmond Byron 3.8 1,136
Valley (7.1%) and Ballina LGAs (6.8%) also experienced Clarence Valley 5.4 2,635
higher growth rates than other LGAs in the region. Kyogle -2.9 -280
Lismore 2.8 1,218
These figures underscore the dynamic nature of the
Richmond Valley 7.1 1,514
region’s population. Growth has been historically driven
Tweed 18.6 13,886
by coastal migration and counter-urbanisation – both
linked to the expired property boom which commenced Northern Rivers 8.6 22,703
a decade ago (Kelly et al 2005). NSW 9.7 636,251
(source: ABS 2012a)
Northern Rivers Regional Profile 2013 9Regional population structure
The region’s population has some distinct features compared to NSW (Figure 11). It has smaller
proportions of younger adults in the 20 to 39 years age cohorts, which may be due to a combination
of outward youth migration and the inward migration of older people. It is generally thought that
fewer individuals in the young adult age groups causes negative economic implications due to a
reduced labour pool. This scenario has not changed since the 2006 census.
Figure 11 – Population structure by age and sex 2012
85 and over
80 to 84
75 to 79
70 to 74
65 to 69
60 to 64 Male Female
55 to 59
50 to 54
Age Class
45 to 49 NSW
40 to 44
35 to 39 Northern
30 to 34 Rivers
25 to 29
20 to 24
15 to 19
10 to 14
5 to 9
0 to 4
10 8 6 4 2 0 2 4 6 8 10
Proportion of Population
(source: ABS 2013c)
Figure 11 also identifies relatively larger proportions of people in the older age cohorts and thus the
region’s population is generally older than the rest of NSW. Given that the needs and contributions
of individuals to their respective communities are influenced by their age, this attribute of the
Northern Rivers may have service (e.g. health, transport, accommodation) and employment
implications for the region.
An ageing population has implications for the social and economic dependency of our community.
The dependency ratio is an age:population ratio. It measures the number of people in the labour
force who are not working (those who are ‘dependent’) against those who are working (the
‘productive’ persons). A higher ratio indicates more dependent persons to productive ones, so if an
area has a dependency ratio of 100% then for every working person there is one dependent person.
Figure 12 highlights that the dependency ratio in the Northern Rivers was generally higher than the
NSW equivalent in 2011 (60.7% for NR and 50% for NSW). This is forecast to increase, reaching 88.3%
10 Regional Development Australia – Northern Riversby 2031 (compared to the NSW average of 63.5%) with the highest ratio of 98.2% in the Clarence
Valley.
Figure 12 – Dependency Ratios 2011-2031
100
90 Ballina
Dependency Ratio %
Byron
80
Clarence Valley
70 Kyogle
Lismore
60
Richmond Valley
50 Tweed
40 Northern Rivers
2011 2021 2031 NSW
Year
(Source: NSW Department of Planning and Infrastructure 2013)
Indigenous population structure
Aboriginal people comprise those from the Bundjalung and parts of the Gumbayngirr nation groups
(Horton, 1996) and those from other Indigenous groups who have settled here. On Census
enumeration night 2011, 11,3801 Indigenous people were counted in the region, accounting for 4.1%
of the total Northern Rivers population (ABS 2012).
The structure of the region’s Indigenous population (at their usual place of residence) is broadly in
line with that of NSW (Figure 13), however the Northern Rivers has slightly higher proportions of
those in the 10-19 age groups and fewer in the 20-29 year age groups.
1
Likely to be an under-estimation due to a number of people providing no response to the census question associated with this data.
Northern Rivers Regional Profile 2013 11Figure 13 – Indigenous population structure by age and sex 2011
65 years and older
60-64 years
55-59 years
50-54 years
Male Female
45-49 years
40-44 years NSW
Age Group
35-39 years
30-34 years
25-29 years Northern
20-24 years Rivers
15-19 years
10-14 years
5-9 years
0-4 years
15 10 5 0 5 10 15
Proportion of Indigenous Population (%)
(source: ABS 2012e)
The age structures of the region’s Indigenous population compared with the non-Indigenous
population (Figure 14) is interesting to note. The Northern Rivers’ Aboriginal population has a
relatively larger proportion of younger people (i.e. 0-24 years of age) and a relatively smaller
proportion in the older (over 45) age groups than their non-Indigenous counterparts, the most
significant variation occurring in the 65 years and older group with the non-Aboriginal population of
20.3% being proportionately five times greater than the Indigenous population of 4.2%.
Figure 14 – Indigenous and non-Indigenous population by age
65 years and older
60-64 years
55-59 years
50-54 years
45-49 years
40-44 years Male Female
Age Group
35-39 years
30-34 years Non-Indigenous
25-29 years Popn.
20-24 years Indigenous Popn.
15-19 years
10-14 years
5-9 years
0-4 years
25 15 5 5 15 25
Proportion by Population Group (%)
(source: ABS 2012e)
In terms of the geographical distribution Tweed and the Clarence Valley account for just more than
half of the region’s Aboriginal residents with about a quarter each in the Tweed (25.8%) and the
Clarence Valley (25.0%).
12 Regional Development Australia – Northern RiversPopulation forecast
Population forecasting enables planning for essential infrastructure and services. The figures in
Table 3 inform Government planning and indicate continued immediate growth, but a decline in the
growth rate from 2016-2031. Growth in the region is forecast to be lower than for the rest of the
State – whereas in the past regional population growth generally exceeded that of NSW. A
combination of factors including fertility, mortality, overseas migration and internal migration will
dictate our actual growth (ABS 2008). The latter of these factors has been particularly significant in
the past (refer Kelly et al., 2005).
Table 3 – Population forecast Northern Rivers and NSW 2011-2031
Northern Rivers NSW
Year
Number % Change Number % Change
2011 287,900 3.1 7,211,500 6.8
2016 296,900 3.1 7,701,000 6.8
2021 306,000 1.7 8,223,900 6.0
2026 311,300 1.2 8,716,400 5.5
2031 315,000 n/a 9,193,900 n/a
(source: NSW Department of Planning and Infrastructure 2013)
Table 4 indicates that the population in most LGAs in the Northern Rivers is predicted to increase
towards 2031 with Tweed accounting for the dominant share. Kyogle is the anomaly and its forecast
population decline has been a sensitive subject for the community. “[The] Kyogle community is
unhappy about suggestions that the town’s population will fall, based on the Department’s latest
local area population figures” (NSW Department of Planning 2011a). In response to queries regarding
their projections, the Department cited outward migration in the demographic of 18-39 years as
main reason for their projection, but also highlighted the LGA’s potential to support additional
industrial development due to its location on major transport routes with access to inter-state road
and rail networks that could enhance future growth (ibid.).
Table 4 – Population forecast figures by LGA 2011-2031
LGA 2011 2016 2021 2026 2031
Ballina 40,800 42,600 43,900 44,800 45,400
Byron 30,800 31,200 31,700 31,800 31,800
Clarence Valley 51,300 51,600 52,900 53,600 53,900
Kyogle 9,500 9,600 9,700 9,600 9,500
Lismore 44,300 44,900 45,500 45,500 45,300
Richmond Valley 22,700 23,300 24,100 24,500 24,800
Tweed 88,500 93,700 98,200 101,500 104,300
(source: NSW Department of Planning and Infrastructure 2013)
Northern Rivers Regional Profile 2013 13The projected 2036 population structure (Figure 15) highlights the potential for higher proportions of
people in the older age groups. In all age cohorts 70 years and older for instance, men and women
both are forecast to increase by at least 2% of the 2011 census figures (refer Figure 11). Viewed in its
entirety, this growth is significant. The cohorts 60-64 years and 65-69 years show moderate growth
from 2011 to 2036. The ageing population is a phenomenon expected across all Australia’s regions
“as the baby boom generation ages and life expectancy increases” (NSW Department of Planning
2008). However, this phenomenon is exacerbated in the region by migration.
A comparison of the 2036 Northern Rivers and NSW forecast populations indicates that the already
smaller proportions of young adults in the Northern Rivers (compared to the State) will further
contract by 2036.
Figure 15 – Forecast population structure by age and sex 2036
85+
80-84
75-79
70-74
65-69
60-64
55-59
50-54
Age Class
45-49 Male
40-44 Female
NSW
35-39
Northern Rivers
30-34
25-29
20-24
15-19
10-14
5-9
0-4
8 6 4 2 0 2 4 6 8
Proportion of Population (%)
(source: NSW Health Population Projection Series 1.2009)
Internal migration
Data from the 2001, 2006 and 2011 censuses provide an indication of migration of residents aged
five years and older, to and from the LGAs in our region. Table 5 presents the percentage of the
estimated resident population that lived at the same address or elsewhere in Australia for the
previous census. The region has a similar trend to NSW, with more residents in Kyogle and Richmond
Valley at the same address in 2006 and 2011, and less for the Byron and Tweed LGAs.
14 Regional Development Australia – Northern RiversTable 5 – Internal migration 2006-2011
Same usual Lived elsewhere Lived overseas
LGA/Region address in 2006 in Australia in 2006 in 2006
(% Residents) (% Residents) (% Residents)
Ballina 59.4 38.5 2.2
Byron 56.4 39.0 4.6
Clarence Valley 61.5 37.6 0.9
Kyogle 66.9 32.0 1.1
Lismore 60.0 38.2 1.7
Richmond Valley 62.5 36.8 0.7
Tweed 58.2 39.2 2.6
Northern Rivers 59.7 38.2 2.1
NSW 60.8 33.5 5.7
(source: ABS 2012)
Table 6 identifies an increase in the mobility of the population since the 2006 census. It should be
noted that it is not possible to ascertain if movements for people at the same address as five years
ago are within the region or LGA, and these figures do not account for multiple movements during
the inter-census period. In both 2006 and 2011 more people had moved to the Northern Rivers from
elsewhere in Australia than greater NSW. Conversely, Northern Rivers had fewer international
residents than greater NSW.
Table 6 – Changes in internal migration 2006 & 2011
2011 (% 2006 (%
Region Location Change
Residents) Residents)
Same usual address five years ago 59.7 72.7 -13.1
Northern
Lived elsewhere in Australia five years ago 38.2 25.4 12.8
Rivers
Lived overseas five years ago 2.1 1.8 0.3
Same usual address five years ago 60.8 73.6 -12.8
NSW Lived elsewhere in Australia five years ago 33.5 21.5 12.0
Lived overseas five years ago 5.7 4.9 0.8
(source: ABS 2001, 2006 and ABS 2012)
Table 7 provides an indication of the movements of different age cohorts, highlighting that people
aged 15-54 years are more mobile than people aged 55-74 years. The net outward migration of 1.8%
is higher for 35-54 year olds than the 1.1% for 15-34 year olds.
Northern Rivers Regional Profile 2013 15Table 7 – Changes in internal migration by age group 2006 and 2011
Address Age in years % Pop. 2011 % Pop. 2006 Change
5-14 7.1 10.4 -3.3
15-24 6.0 8.5 -2.6
25-34 2.8 5.1 -2.3
35-44 6.3 9.5 -3.2
Same address in the Northern Rivers
45-54 10.5 13.0 -2.5
five years ago
55-64 11.2 10.4 0.8
65-74 8.2 7.9 0.3
75-84 5.7 6.1 -0.4
85+ 2.0 1.9 0.1
5-14 6.3 4.0 2.4
15-24 5.3 3.3 2.0
25-34 5.9 4.1 1.9
35-44 6.4 4.2 2.1
Lived elsewhere in the Northern
45-54 5.3 3.5 1.8
Rivers five years ago
55-64 4.4 3.2 1.2
65-74 2.5 1.8 0.7
75-84 1.3 1.0 0.3
85+ 0.8 0.3 0.4
(Source: ABS 2001, 2006 and ABS 2012)
Cultural diversity
Ethnicity data from the 2011 census provides an indication of cultural diversity2 in the region. Table 8
shows the Northern Rivers has smaller proportions of overseas-born residents compared to NSW as a
whole. The largest proportions of our overseas-born residents have arrived from places dissimilar to
the NSW population including Europe. These data illustrate comparatively less cultural diversity in
our region.
2
Cultural diversity acknowledges the existence of broad cultural groups within Australia (NSW Public Service Commission 2011)
16 Regional Development Australia – Northern RiversTable 8 – Country of birth
Birthplace
Birthplace
Ranking* (proportion of
(proportion of NSW population)
Northern Rivers population)
1 Australia (87.8%) Australia (72.8%)
2 England (4.0%) England (3.5%)
3
3 New Zealand (2.0%) China, excl. SAR’s (2.4%)
4 Germany (0.5%) New Zealand (1.8%)
5 Scotland (0.5%) India (1.5%)
6 United Stated (0.4%) Vietnam (1.1%)
7 Netherlands (0.4%) Philipines (1.1%)
8 South Africa (0.3%) Lebanon (0.9%)
9 Philipines (0.3%) Italy (0.8%)
10 Italy (0.3%) Korea, Republic of (South) (0.6%)
(source: ABS 2012)
* ranking from largest to smallest percentage
3
The Special Administrative Regions of the People's Republic of China (SAR) are autonomous territories that fall within the sovereignty of
the People's Republic of China, which do not, however, form part of Mainland China
Northern Rivers Regional Profile 2013 17Housing
Household Size
The 2011 census recorded a larger proportion of one and two person households (+3.7% and +4.9%
respectively) in our region compared to the State (Figure 16) and a correspondingly lower proportion
of three to six person households. This pattern is reflected at LGA level, although Byron Shire has a
smaller proportion (+2% compared to NSW) of two person households.
Figure 16 – Persons per household as proportion of all households 2011
45%
40% 1 person
35%
2 persons
30%
% Households
25% 3 persons
20%
4 persons
15%
10% 5 persons
5% 6 or more
0% persons
Location
(source: ABS 2012)
Household composition
Compared to NSW, household composition in the Northern Rivers is quite distinct (Figure 17). A
smaller proportion of households in the region comprise couples with children (7% lower than NSW
as a whole) and a larger proportion of couples with no children (3.3% higher). Other family types are
similar to the NSW proportions.
At the LGA level, Byron Shire households have relatively smaller proportions of families with and
without children. This may reflect the transient nature of people in that LGA. The Clarence Valley
contains the highest proportion of families without children (28.3%) in the region and a smaller
proportion of families with children.
18 Regional Development Australia – Northern RiversFigure 17 – Household types as a proportion of all households 2011
50
45 One family household:
Couple with no children
Proportion of Households (%)
40
35 One family household:
30 Couple with children
25
One family household:
20 One parent family
15
One family household:
10 Other family
5
0 Multi family households:
Ballina Byron Clarence Kyogle Lismore Richmond Tweed Northern New all types
Valley Valley Rivers South
Wales Non-Family Other
households
LGA / NSW
(source: ABS 2012)
Housing affordability
Housing affordability is influenced by rent/mortgage payments and income. In instances where high
housing costs are coupled with low incomes, residents “may lack purchasing power for obtaining
other essentials such as food, clothing, education, transport and health care” (Kelly et al. 2005).
Housing costs vary across the Northern Rivers. Table 9 indicates that rents and property sale prices in
Ballina, Byron and Tweed are the highest in the region. Most significantly prices in Byron exceed
those in the rest of NSW. A useful comparison is drawn from examining Rest of NSW figures which
excludes the impact of Sydney housing costs and the high proportion of non-detached housing stock
reflected in State figures.
Table 9 – Median housing costs 2012
Rent for two Rent for three Sale price:
LGA/Region bedroom bedroom all properties
($ median) ($ median) ($’000 median)
Ballina 280 380 430
Byron 380 475 541
Clarence Valley 230 280 299
Kyogle 215 250 -
Lismore 230 300 310
Richmond Valley 195 270 330
Tweed 290 360 383
Northern Rivers 260 330 382
NSW (excluding Sydney) 235 300 315
NSW (including Sydney) 395 390 460
NB the Northern Rivers measurement is an average of the associated LGAs. Kyogle data not available due to small numbers.
(source: Housing NSW 2013)
Northern Rivers Regional Profile 2013 19The data in Figure 18 draws from a different and older data set than Table 9, but also indicates that
residents in the region generally pay higher weekly rents compared to the rest of NSW. They also
show this to be the case for Indigenous people who are renting.
Figure 18 – Weekly rental payments 2011
12
Northern Rivers
Proportion of People %
10 indigenous
population
8
NSW indigenous
6 population
4
Northern Rivers
2 total population
0
NSW total
population
Weekly Rental Amount
(source: ABS 2012)
Figures 19 and 20 show how rental and property prices have changed since 2009. They show that
median weekly rents are generally increasing in all areas. Sale prices for properties decreased in
Byron, Kyogle, Lismore and Tweed between 2012 and 2013, but increased in Ballina and Richmond
Valley, consistent with NSW trends.
Figure 19 – Median weekly rents 2009-2013
500
Median Weekly Rent (3 Bedrooms)
450
400
350
300 June 2009
250
200
June 2011
150
100
50 March 2013
0
LGA and NSW
Source: Housing NSW (2009), (2011), (2013)
20 Regional Development Australia – Northern RiversFigure 20 – Median house sale prices
700
Median Sale Prices (000s) 600
500
400 March 2009
300
March 2011
200
100 December
2012
0
LGA and NSW
Source: Housing NSW (2009), (2011), (2013)
Tenure
Type of housing tenure provides an indication of housing security. Those who live in owner-occupied
dwellings (especially those who own their home outright) generally enjoy a greater degree of
financial security and experience less housing stress than those who rent.
Table 10 illustrates that more people in the Northern Rivers own their properties outright when
compared to the broader NSW population. Home ownership with a mortgage is slightly lower for the
region when compared to the State, with the exception of Lismore.
Notable features of the tenure data are the comparatively lower proportions of people who rent in
the Clarence Valley and Kyogle and the higher proportion of renters in Byron, which likely reflects the
cost of buying property in these areas. The proportion of people in the region who rent social
housing, which includes public and community housing, is significantly lower than the proportion for
the whole of NSW. This highlights the lower stock levels in the region and is reflected in the social
housing waiting list data provided by Housing NSW on its Housing Pathways website. Waiting times
for two and three bedroom dwellings is 10+ years in the coastal areas of the region and between two
and 10 years in the rest of the region. Social Habitat (2012) also identifies less common tenure types,
such as caravans, manufactured homes, forms of rural land sharing and workers cottages. While they
were previously seen as successful, affordable housing solutions, some have lost institutional support
and legitimacy however they remain among a range of other low-cost housing solutions that have
been developed in the Northern Rivers.
Northern Rivers Regional Profile 2013 21Table 10 – Type of housing tenure 2011
Owned Owned with Private Rental Social Housing
LGA/Region
outright % a mortgage % % Rental %
Ballina 35.5 34.3 26.2 4.1
Byron 31.9 34.6 32.0 1.5
Clarence Valley 38.2 35.2 23.6 3.0
Kyogle 41.5 34.6 20.6 3.3
Lismore 31.4 39.9 25.1 3.6
Richmond Valley 33.4 36.8 25.5 4.3
Tweed 34.7 35.4 27.2 2.7
Northern Rivers 34.8 35.9 26.2 3.1
NSW 29.2 41.1 25.3 4.4
(source: ABS 2012)
Mortgage and rent stress
Mortgage and rent stress are two housing-related measures calculated on a per household basis. By
the Public Health Information Development Unit (PHIDU 2012) definitions, households earning less
than 80% of median income and spending more than 30% of income on mortgage repayments are
those which experience mortgage stress. Households earning less than 80% of median income and
spending more than 25% of income on rent are those which experience rent stress.
Figure 21 shows that there are higher proportions of households in the Northern Rivers experiencing
both rent and mortgage stress compared to NSW as a whole. Specifically, Byron Shire is relatively
disadvantaged, having larger proportions of households experiencing both rent (41.3%) and
mortgage (20.6%) stress than elsewhere. This is not surprising given the relatively high rental and
property costs, coupled with the low incomes of those living there.
Figure 21 – Mortgage and rent stress 2011
45
40
35
% Households
30
25
20
15 Rent Stress
10 Mortgage Stress
5
0
LGA / Region
2011 data for low income earners only4 (source: PHIDU 2012)
4 Households in the bottom 40% of income distribution with less than 80% of median equivalised income
22 Regional Development Australia – Northern RiversHomelessness
The Australian Bureau of Statistics released some data relating to this demographic at the State and
Territory scales following the 2011 census (see ABS 2012d), however this data is insufficient to
analyse the prominence of homelessness in the Northern Rivers. ‘Homelessness' is not directly
measured in the Census. Instead, estimates of the homeless population are derived using analytical
techniques based on the characteristics observed by Census collectors and assumptions about the
way people may respond to Census questions (ABS 2013a).
Table 11 shows an estimated increase in the proportion of the NSW population that were homeless
from 25.0% (in 2006) to 27.0% (in 2011) and, despite its geographical limitations, it is likely that at
least some of the patterns at the national level apply to the Northern Rivers. These patterns indicate
that men are more at risk of homelessness than women and there is a larger proportion of non-
Indigenous people estimated to experience homelessness.
Table 11 – Homelessness estimates: Australia 2006 and 2011
2006 2011
Variable Demographic estimate estimate
(% of pop.) (% of pop.)
Persons who are in improvised dwellings, tents or sleeping
8 6
out
Persons in supported accommodation for the homeless 19 20
Homeless
Persons staying temporarily with other households 20 17
category
Persons staying in boarding houses 17 17
Persons in other temporary lodging 1 1
Persons living in 'severely' crowded dwellings 35 39
Male 57 56
Gender
Female 43 44
Indigenous Indigenous 29 25
Status Non-Indigenous 64 67
(source: ABS 2012d)
Table 12 provides the number of persons counted as homeless in the 2011 Census for the Northern
NSW Local Health District and for the State overall. The category ‘persons who are in improvised
dwellings, tents or sleeping out’ is often referred to as rough sleeping and is typically what people
think of as homeless. Estimates drawn from the data in Table 12 indicate that 0.5% of the Northern
Rivers population were counted as homeless in the 2011 Census compared to 0.4% for the state
overall. Furthermore, ‘rough sleepers’ in our region made up 19.8% of the State’s rough sleeping
homeless population.
Northern Rivers Regional Profile 2013 23Table 12 – Number of homeless persons 2011
Homelessness category Northern NSW NSW
Persons who are in improvised dwellings, tents or sleeping out 342 1,726
Persons in supported accommodation for the homeless 271 4,460
Persons staying temporarily with other households 325 4,574
Persons staying in boarding houses 234 5,921
Persons in other temporary lodging 25 147
Persons living in 'severely' crowded dwellings 188 9,293
Total homeless population 1,385 28,209
Total population 287,809 6,917,656
(Source: ABS 2013a)
Results from the 2013 community wellbeing survey (RDA–NR and NRSDC, in press) provide further
insights into homelessness in the Northern Rivers, with 19.3% of respondents identifying they had at
some stage experienced homelessness5 or had stayed with friends or relatives because they had
nowhere else to go (Figure 22). The majority of respondents (30.5%) had been homeless for more
than three months or one to three months (29.0%).
Figure 22 – Duration of homelessness
35
who had experienced homelessness (%)
30
Proportion of Respondents
25
20
15
10
5
0
1 night to 1 week 1 week to 1 month 1 to 3 months More than 3
months
(source: RDA-NR and NRSDC in prep)
5
In this survey ‘homelessness’ was self-defined.
24 Regional Development Australia – Northern RiversYou can also read