CIRCULARITY GAP REPORT - THE - Platform for Accelerating the ...

Page created by Leroy Hamilton
 
CONTINUE READING
CIRCULARITY GAP REPORT - THE - Platform for Accelerating the ...
THE
CIRCULARITY
  GAP REPORT
               2020

 When circularity goes from bad to worse:
 The power of countries to change the game
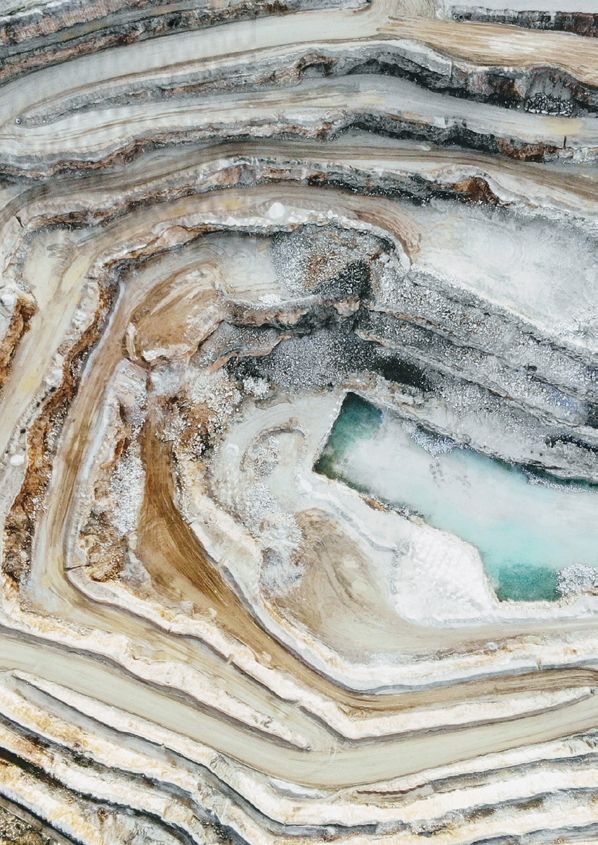
CIRCULARITY GAP REPORT - THE - Platform for Accelerating the ...
WHO WE ARE
                  We work to accelerate the transition
                  to a circular economy. As an impact
                organisation, we identify opportunities
                to turn circular economy principles into
                             practical reality.

               With nature as our mentor, we combine
              practical insights with scalable responses
                 to humanity’s greatest challenges.

                  Our vision is economic, social and
                  environmental prosperity, without
                compromising the future of our planet.

              Our mission is to connect and empower a
              global community in business, cities and
              governments to create the conditions for
                      systemic transformation.

   The Platform for Accelerating the Circular Economy (PACE) This report is
published as part of the Platform for Accelerating the Circular Economy (PACE).
  PACE is a public-private collaboration mechanism and project accelerator
dedicated to bringing about the circular economy at speed and scale. It brings
together a coalition of more than 70 leaders and is co chaired by the heads of
Royal Philips and the Global Environment Facility. It was initiated at the World
  Economic Forum and is currently hosted by the World Resources Institute.
CIRCULARITY GAP REPORT - THE - Platform for Accelerating the ...
IN SUPPORT O F T H E
C I R C U L A R I T Y G A P R EP O RT

                                      “The circular economy is a fundamental means to achieving
                                      sustainability and carbon neutrality. Yet to know if we’re getting
      CAROLINA SCHMIDT                there, we need to measure circularity. The series of Circularity
                Minister for the
                                      Gap reports have been illuminating, as they’re showing us
             Environment at the
                                      the –distressing– tendency of the past years. This third report
            Government of Chile
                                      sparks an alarm for all governments; we need to deploy all the
                                      array of policies to really catalyze this transformation.”

                                      “The circularity gap is widening, and with it, the climate and
                                      biodiversity impacts of our extractive economies. To confront
          G I N O VA N B E G I N      environmental challenges and deliver socio-economic
            Secretar y General at
                                      benefits, we must rethink how we consume and dispose
      ICLEI - Local Governments
                                      of materials. This report offers essential metrics to track
                for Sustainabilit y
                                      progress and underlines the key role played by cities and
                                      regions in bridging the gap.”

                                      “Despite two years of concentrated efforts and pockets
                                      of success, circularity’s global impact is not big enough.
                                      This report provides a clear roadmap for action. Countries,
     F R A N S VA N H O U T E N       cities and businesses can step up as change agents to
             CEO at Royal Philips     accelerate circularity locally and globally. But, governments
                                      and businesses alike must engage in far-reaching,
                                      cross-border collaborations for circular value chains
                                      and climate neutrality.”

                                      “Our current economic and financial systems are driving
                                      unsustainable consumption and degrading the natural
                                      environment. The circular economy provides a tangible
       C R I S T I A N N E C LO S E   framework for reducing our impacts, protecting ecosystems
    Leader at World Wildlife Fund
                                      and living within the means of one planet. Collaborating
                Markets Prac tice
                                      with business and civil society, governments can play an
                                      invaluable role in delivering positive change by implementing
                                      policies that encourage circularity and systems change.”

                                      “The transition to a global circular economy will continue
                                      requiring new data and metrics to enable public and private
        DAV I D B . M C G I N T Y     sector leaders to make the best decisions. This Circular Gap
      Global Direc tor at Platform    Report is another step forward, providing leaders with data
             for Accelerating the     and insights on how to understand national-level circularity
                Circular Economy      and possible ways to cluster, learn from similarly-situated
                                      countries, and better understand their individual and
                                      collective transitions.”

4
CIRCULARITY GAP REPORT - THE - Platform for Accelerating the ...
“The Circularity Gap Report conveys a compelling need for
                                          redesigning economic models. The North-South dilemma
                                          will not lead to the needed transition, businesses and
            R AC H N A A R O R A
                                          policy makers need to create an opportunity for the scale
             Deput y Team Leader &
                                          up. Although many thought leaders and countries have
                  Coordinator at the
       European Union - Resource          initiated action in terms of rising social inequity, declining
Ef f icienc y Initiative (EU - REI) at,   resources and national frameworks but further increase
          the Government of India         in the CE gap from 2018 to 2020 by 0.5% is threatening. We
                                          need accelerated action by investors, designers, businesses,
                                          researchers, consumers and policy makers to create an
                                          economic opportunity for CE, worldwide.”

          JA N E Z P OTO Č N I K          “Circular economy is becoming a widely recognised and
              Former European             accepted concept. But to make it real, as the report shows,
          Commissioner for the            will request many efforts and a system change also in our
      Environment and Co-chair            understanding of the circular economy. We need to embrace
      at the UNEP International           dematerialisation, rethink ownership concept and move from
                Resource Panel            resource efficiency to resource sufficiency.”

                                          “Business as usual is dead. We must commit to taking action
                                          at scale to make the circular economy reality. Measuring our
             PETER BAKKER                 individual and collective performance in the circular economy
                    CEO at WBCSD          is fundamental in knowing whether we’re decoupling resource
                                          consumption and financial performance at the rate which our
                                          planet is demanding of us.”

                                          “Broad awareness of the need to transition to a circular
                                          economy is now driving governments, companies and
                                          consumers to use resources more efficiently and minimize
           MUKHISA KITUYI                 waste. But how far have we come and how much further do
       Secretar y General at the
                                          we need to go? And beyond plastics and CO2 that make the
     United Nations Conference
                                          headlines, what other waste streams require our attention?
     on Trade and Development
                                          The Circularity Gap Report 2020 answers these important
                                          questions for us. It is required reading for all of us working to
                                          advance a circular economy.”

                                          “This report recognizes the critical role that countries play
                                          in closing the widening circularity gap, and underlines the
           FEIKE SIJBESMA                 urgent need for close collaboration. Companies that have a
                        CEO at DSM        global footprint also have a responsibility to embed circular
                                          thinking into their business models and processes. We must
                                          join forces to enable the transition to a circular economy.”

                                          ”The way we measure circularity is still not good enough.
                                          Circularity goes way beyond recycling. But the Circularity Gap
        ANDERS WIJKMAN                    Report conveys a strong message that we are still stuck in the
     Chairman of the Governing            linear production model. This has to change. The focus in the
       Board at Climate-KIC and           Report on developing countries is spot on. We have to help
     Former Co-president at the           them avoid repeating the linear production mistakes of the rich
                   Club of Rome           countries. If we succeed in that there is hope for the world.”

                                                         T h e Ci r c ul a r i t y G a p R e p o r t 2 02 0   5
CIRCULARITY GAP REPORT - THE - Platform for Accelerating the ...
E XEC U T I V E
SUMMARY

Today, the global economy is only 8.6% circular —           Some countries operate well within the ecological
just two years ago it was 9.1%. The global circularity      boundaries of our planet, but without satisfying
gap is widening. There are reasons for this negative        certain basic social needs. Conversely, other countries
trend, but the result remains the same: the news is         increasingly provide basic levels, but do so by
not just bad, it is worse. The negative trend overall       overshooting the sustainable means of the planet.
can be explained by three related, underlying trends:       Effectively, therefore, all countries are developing now:
high rates of extraction; ongoing stock build-up;           each starts from a different point on the map; many
plus, low levels of end-of-use processing and cycling.      share commonalities in their journey; but, all have a
These trends are embedded deep within the ‘take-
                                                            distance to go.
make-waste’ tradition of the linear economy — the
problems are hardwired. As such, the outlook to close
                                                            Different countries, common needs. In principle, all
the circularity gap looks bleak under the dead hand of
                                                            countries are unique when it comes to their ecological
business as usual. We desperately need transformative
                                                            footprint and ability to provide for their people. In
and correctional solutions; change is a must.
                                                            practice, some face similar barriers and many are
                                                            confronted with the same global trends. So, zooming in
Countries are critical facilitators of the circular
                                                            from the global footprint to look at satisfying national,
economy. This is not because of what they have
                                                            regional and local societal needs, this Circularity Gap
achieved in the past, but what they could deliver in
                                                            Report examines and extrapolates common challenges
the future. An initial cohort of countries have engaged
                                                            and opportunities experienced by distinct country
with the circular agenda, ranging from individual
                                                            groups. When circularity goes from bad to worse, we
nation states in Europe, to the giant economy of China.
                                                            explore the power of countries to change the global game.
Yet recent years have witnessed a steady stream of
new players adopting circular economy policies and
roadmaps.

The opportunity is real. The Circularity Gap Report will
provide on the ground examples across the globe to
illustrate how the practical implementation of circular
economy strategies and solutions is an everyday reality
— right now. This global groundswell of positive action
is happening bottom-up: from waste processing in
Nigeria, to a digital solution that empowers informal
trash collectors in Brazil. Today, we see entrepreneurs,
businesses and communities coming together with
city officials leading the way, followed by an increasing
number of countries and national governments that are
shaping their strategies to support investment towards
sustainable and specific circular economy agendas.

We are all developing countries now. Closing the
circularity gap serves the higher objective of preventing
further and accelerated environmental degradation
and social inequality. The end goal is to establish an
ecologically safe and socially just operating space for
mankind.1 As laid out in the Sustainable Development
Goals and the Paris Agreement, countries have an
important and pivotal role to play.

6
3 S TEPS TO BRIDGE THE
CIRCUL ARIT Y GAP THROUGH
LE ADERSHIP AND AC TION:

1. Foster global collaboration to collect and
share data. This will enable identification of
key data needed to measure and track circular
performance, plus provide the necessary
infrastructure and alliances to collect, retrieve and
share data.

2. Translate global trends into national
pathways. This will enable countries to set
goals, peer review, measure and benchmark
performance, plus track progress against their
ambitions; while still allowing them to formulate
practical pathways that are aligned to local
context, incentives, and mandates.

3. Build a global coalition for action that is both
diverse and inclusive. This will bring together
front-running businesses, governments, NGOs
and academics to collectively boost capacity and
capability to better serve societal needs more
sustainably.
CON-
 TENTS
1                                            6
    INTRO D U C TI O N                           B U ILD CO U NTRIE S
                                                 Small impac t , big oppor tunit y
    10 - 11
                                                 36 - 42

2                                            7
    G LO BA L CIRCU L A RIT Y
                                                 G ROW CO U NTRIE S
    W hen circularit y goes from
                                                 Rising impac t , huge potential
    bad to wor se

    12 - 17                                      43 - 50

3                                            8
    M E TRI C S F O R CIRCU L A RIT Y            S H IF T CO U NTRIE S
                                                 High impac t , get ting smar t
    T he Global Circularit y Metric &
    the circularit y gap
                                                 5 1 - 58

    18 - 21

                                             9
                                                 TH E WAY F O RWA RD

4
    TH E P OW ER O F CO U NTRIE S                59 - 6 1
    T he equaliser : we are all developing
    countries now

    22 - 2 5

5
    N OT TH E SA M E , B U T S IM IL A R
    Dif ferent countries , common needs

    28 - 3 4
1. INTRODUCTION

In a world where the only news seems to be bad,            The aspirational and holistic nature of these two
it would be nice to report that things are getting         frameworks is both inspiring and inclusive. Whilst
better in terms of global circularity. Sadly, they         the thinking is positively joined-up, the doing is
are not. The circularity gap is getting wider and          typically not. Particularly on Paris targets, policy
resources more scarce. As consumption spirals              implementation is proving incrementally slow and
upwards, the carrying capacity of the planet falls         collective action plainly inadequate. Symptomatic
and sustainability suffers. We desperately need            of this legislative lethargy, the UN COP25 climate
transformative and correctional solutions. So, what        gathering, held in Madrid, in December, saw 2019
the 2020 Circularity Gap Report aims to do is set          end with a whimper not a bang. Bogged down in
out the critical role to be played by one of the key       technicalities and fogged by compromise and fudge,
potential agents of positive change: Countries.            the talks proved the longest on record, yet achieved
                                                           little or no progress, or agreement.
ENGINE STUCK IN REVERSE
                                                           The irony is that the sense of urgency and appetite
Up until the relatively recent past, our world economy
                                                           for change amongst the general public has never
had been operating in a broadly circular manner. It was
                                                           been stronger, or greater worldwide. From Extinction
only around 200 years ago that things really took a turn
                                                           Rebellion and the Climate Emergency, to teenage
for the worse: this was when the Industrial Revolution
                                                           activist Greta Thunberg and the Friday school strikes,
pressed the ignition button on global growth. The
                                                           momentum is building fast — especially amongst
upside of what followed was improved prosperity
                                                           millennials who are literally taking to the streets to
for some people, in some parts of the world, for
                                                           protest against perceived political apathy, corporate
some time; the downside was that the twin forces
                                                           irresponsibility and social injustice.
of accelerated resource extraction and consumer
demand were unleashed worldwide, driving forward
                                                           A 1 . 5°C W O R L D I S C I R C U L A R
a new model of take-make-waste. Ever since, we have
been headed in the wrong direction on circularity. As a    There is good news in all of this, though; and it comes
result, the global engine of change is stuck in reverse.   in the form of the largely untapped potential of the
                                                           circular economy, as a means to an end that is both
So, what’s new? Well, it is not so much the message,       demonstrable and doable. The pathway to a low-
as the evidence. Evidence of environmental impacts is      carbon future is circular. In fact, the goal of the Paris
building; revealing the true extent to which our linear    Agreement to limit global warming to 1.5°C above
tradition is embedded deep within our society. In 2017,    pre-industrial levels can only be achieved by way of a
for example, our material resource use breached the        circular economy. The circular and low-carbon agendas
100 billion tonnes mark for the first time in history.     are complementary and mutually supportive.
Advances in scientific study are also painting a more
detailed, but bleaker picture of where we are headed.      T H E P OW E R O F C O U N T R I E S
In 2019, for instance, we received fresh reports of
                                                           Critical facilitators and core enablers of this circular
Greenland’s ice sheet melting seven times faster
                                                           economy are countries — not because of what they
than in 1990. 2
                                                           have achieved in the past, but what they could deliver
                                                           in the future. After an initial cohort of countries was
A FA LT E R I N G R E S P O N S E
                                                           seen engaging with the circular agenda — ranging
In response, policymakers, business and communities        from 133 individual nation states in Europe to the giant
worldwide have largely pinned their hopes for a            economy of China — recent years have witnessed
turnaround on two landmark pillars of strategic and        a steady stream of new players adopting circular
ambitious international collaboration: The United          economy policies and roadmaps. In 2019, for instance,
Nations Sustainable Development Goals (SDGs) and           Colombia launched its National Circular Economy
the Paris Agreement.                                       Strategy, 4 the first of its kind in Latin America.

10
These emerging national agendas can also provide            A I M S O F T H E 2020 C I R C U L A R I T Y
insights into why joint action is needed, as well — with    GAP REPORT
shared experiences helping build consensus. For
                                                            1.   Report on the progress of global circularity and the
example, when the European Commission’s Green
                                                                 gap by applying the Circularity Gap Metric to new
Deal launched in December 2019 with the ambition of
                                                                 data.
creating the first climate-neutral continent by 2050, it
was promptly adopted by almost all countries within         2.   Based on the above, identify key trends and
the European Union. In short, countries have circular            possible levers for transitioning to circularity at a
potential; and potential is power.                               global level by mid-21st century.

                                                            3.   Also, identify hardwired habits and business-as-
THE OPPORTUNIT Y IS REAL                                         usual behaviours with potential to form systemic
What the report will show is how examples on                     blockages.
the ground and right across the globe illustrate            4.   Analyse how 176 countries perform on their
that practical implementation of circular economy                Social Progress and Ecological Footprint to
strategies and solutions is an everyday reality, right           determine their distance to the safe and just
now. Moreover, it is just as much a positive reality as          operating space for humankind.
the one-step-forward-two-steps-back UN climate see-
                                                            5.   Identify key pathways for three distinct country
saw appears a negative one.
                                                                 groups to transition towards the safe and just
                                                                 space.
Furthermore, this global groundswell of positive action
is happening bottom-up. Ranging from start-ups to
cities, multiple innovators and disruptors are driving
the circular transition — and a growing number of           ABOUT THE CIRCUL ARIT Y
countries are responding and rising to the challenge        GAP REPORT
with bold vision and incentives to stimulate and            The first Circularity Gap Report presented the alarming
support the emerging market. From waste processing          statistic that our world economy was only 9.1% circular,
in Nigeria, to a courageous plastic ban in Rwanda,          leaving a massive circularity gap. The Report, launched
we see entrepreneurs, businesses and communities            in January 2018 during the World Economic Forum
coming together with city officials leading the way;        Annual Meeting in Davos, has since been updated and
followed by an increasing number of countries and           published every year, with this being the third edition.
national governments that are shaping their strategies      It aims to contribute to the emerging evidence base
to support investment towards sustainable and               that supports decision-makers in business, politics
specific circular economy agendas.                          and civil society with key insights and metrics to guide
                                                            their action in the most impactful way. In particular,
                                                            it seeks to move thinking on global circularity in the
N E E D TO S C A L E , N OW
                                                            direction of better measurement, so as to be able to
So, whilst the practical examples of circular economy       set targets uniformly and track progress consistently
are real and springing up all around the world, there       year-on-year. From 2020, the Circularity Gap Reporting
remains an urgent need to scale. What we have is more       initiative (CGRi) will also explore how data to inform
than mere proof of concept, it is a bona fide business      stakeholder decision-making can best be collected,
case and blueprint for action on every continent.           consolidated and made available globally. For updates
However, it is also still only a drop in the ocean; it      and contact details we encourage you to visit our
is simply not enough. Linear dependency is a great          website: circularity-gap.world
leveller: no country currently inhabits the safe and just
space; everyone must do more, fast. We live in a
world that is only 8.6% circular and nowhere near
1.5°C degrees. We are all developing countries, now.
For countries, this truly is their time.

                                                                          T h e Ci r c ul a r i t y G a p R e p o r t 2 02 0   11
2
GLOBAL
CIRCUL ARIT Y
When circularit y goes
f rom bad to wor se
Today, the global economy is only 8.6% circular — just          — improving the provision of services such as energy,
two years ago it was 9.1%. There are reasons for this           water, sanitation, communication and mobility. Of the
negative trend, but the result remains the same: the            materials entering the global economy every year the
news is not just bad, it is worse. This negative trend          majority (52.6 billion tonnes) are being used by society
can be explained by three key related, underlying               as short-lived Products that Flow,6 such as an apple
trends: high rates of extraction; ongoing stock build-          or a pair or a pair of jeans, reaching their end-of-use
up; and, increasing (but still low) levels of end-of-           typically within a year. The other 48.0 billion tonnes of
use processing and cycling. These underlying trends             materials enter into long-term stock,7 referred to as
are deeply embedded within the ‘take-make-waste’                Products that Last. 8 These come mainly in the form of
tradition of the linear economy — the problems                  buildings, infrastructure and capital equipment.
are hardwired. As such, the outlook for closing the
circularity gap looks bleak under the dead hand of              When materials, mostly minerals and ores, are invested
business as usual. We desperately need transformative           into stock in the form of buildings, infrastructure
and correctional solutions; change is a must.                   and heavy machinery, they become embedded and
                                                                unavailable as secondary feedstock for as long as they
For the first time in history, more than 100 billion tonnes     remain stored and in use. It is, therefore, paramount
of materials are entering the global economy every year.        that these buildings, roads and machines are designed,
The reasons for this are threefold. Firstly, it is because we   produced, maintained and reused in a circular manner.
rely predominantly on extracting virgin materials, rather       The 2019 Circularity Gap Report assessed in detail
than making better use of existing resources, to fuel           how such assets can move to circularity.9 While hard
growth. Data suggests that the rate at which extraction         numbers are lacking, we need to count on the circular
of resources increases, outpaces improvements in the            design of current stock build-up, thereby locking-in
recovery at end-of-use by a factor of two to three. The         future opportunities for the maintenance, repairability
second reason is that we are adding more materials to           and reusability of these assets.
build up our global housing stock, infrastructure and
heavy machinery — together being supplied to service            P R O C E S S I N G A N D C YC L I N G
the needs of a growing global population. Thirdly, our
                                                                On a positive note, we do see that, in parts of the world,
lack of end-of-life processing and cycling, as well as poor
                                                                recovery rates are on the increase. This is steered
design of products, contributes to a self-perpetuating
                                                                by comprehensive government policy and technical
linearity that only exacerbates demand for virgin
                                                                innovation and investment directed at increasing
materials, thereby starting the whole unsustainable
                                                                material efficiency, extending and intensifying use and
sequence all over again.
                                                                enabling end-of-life recovery. By way of illustration,
                                                                solid waste recovery in Europe between 2011 and 2016
M AT E R I A L E X T R AC T I O N
                                                                increased by an average of 11%, with countries such as
Material extraction has fuelled prosperity growth since         Sweden, Austria and Luxembourg leading the way with
the Industrial Revolution. In fact, over the last five          recovery rates above 80%. Recycling rates have also
decades, the global use of materials has more than              been improving over the years, representing a growing
tripled — increasing by a factor of 3.5, from 26.7 billion      proportion of solid waste (excluding emissions and
tonnes in 1970, to 92.0 billion tonnes in 2017. The             water) that gets recycled. The ever-increasing rate of
International Resource Panel (IRP) forecasts that               material extraction, however, means that these modest
by 2050 material use will amount to between 170 and             improvements in waste recycling are being overtaken
184 billion tonnes. 5 A proportion of these billions of         by the sheer volume of virgin materials being sourced
tonnes extracted comprises inherently non-circular and          and used to fuel our growth. The yield of secondary
non-regenerative materials — for example, oil derivatives       materials is, therefore, simply not sufficient to feed our
such as petrol, burned in combustion engines of vehicles.       hungry economy on its own.

S TO C K B U I L D - U P

Urbanisation, as a global phenomenon, is increasing and
accelerating demand for housing, so driving the stock
build-up dynamic worldwide. Additionally, the build-up of
physical assets in utility infrastructure is on the increase

                                                                              T h e Ci r c ul a r i t y G a p R e p o r t 2 02 0   13
7 S O C I E TA L N E E DS & WA NTS

     HOUSING AND                                   S E RV I C E S
     INFRASTRUCTURE
                                                   The delivery of services to society ranges
     The need that represents the largest          from education and public services, to
     resource footprint, with 38.8 billion         commercial services like banking and
     tonnes, is for construction and               insurance. The material footprint is modest
     maintenance of houses, offices, roads         in total and typically involves the use of
     and other infrastructure, especially in the   professional equipment, office furniture,
     developing world.                             computers and other infrastructure.

     NUTRITION                                     H E A LT H C A R E

     The second biggest category in terms of       With an expanding, aging and, on average,
     resource use is the need for nutrition.       more prosperous population, healthcare
     Agricultural products such as crops and       services are increasing globally. Buildings
     livestock require 21.3 billion tonnes per     aside, typical resource groups include use of
     year. Food products have short lifecycles     capital equipment such as X-ray machines,
     in our economy, being consumed quickly        pharmaceuticals, hospital outfittings (beds),
     after production.                             disposables and homecare equipment.

     MOBILIT Y                                     C O M M U N I C AT I O N

     A considerable resource footprint is          Communication is becoming an ever-
     taken up by our need for mobility.            more important aspect of today’s society,
     In particular, two resource types are         provided by a mix of equipment and
     used: the materials to build transport        technology ranging from personal mobile
     technologies and vehicles like cars, trains   devices, to data centres. Increased
     and airplanes; plus, predominantly, the       connectivity is also an enabler of the
     fossil fuels burned to power them.            circular economy, where digitisation can
                                                   make physical products obsolete, or
                                                   enable far better use of existing assets,
                                                   including consumables, building stock or
                                                   infrastructure.
     CONSUMABLES

     Consumables are a diverse and complex
     group of products - such as refrigerators,
     clothing, cleaning agents, personal-care
     products and paints - that generally have
     short to medium lifetimes in society.
     Textiles including clothing also consume
     many different kinds of resources such as
     cotton, synthetic materials like polyester,
     dye pigments, and chemicals.

14
T h e Ci r c ul a r i t y G a p R e p o r t 2 02 0   15
Newly updated, Figure 1 shows the volume of globally
TH E G LO BAL                                         extracted resources per year, which amounted to 92.0

MATE RIAL FO OTPRI NT                                 billion tonnes in 2017.10 These extracted resources
                                                      are complemented by 8.65 billion tonnes of cycled

BEHIND SATISF YIN G                                   resources, bringing total material inputs to 100.6 billion
                                                      tonnes. Apart from looking at how resource groups
KE Y SO CIE TAL NEEDS                                 satisfy societal needs, the figure also presents insights
                                                      into what happens to resources after use (End-of-use).

               Figure 1 The global resource footprint behind meeting key
               societal needs showing the numbers that indicate our global
               e c o n o m y i s o n l y 8 . 6 % c i r c u l a r.

16
Of the total material inputs of 100.6 billion tonnes,      In total, 32.6 billion tonnes of materials are collected as
48.0 billion tonnes were put into long-term stock. From    waste. The majority of this stream, 23.9 billion tonnes,
that same stock, 17 billion tonnes of materials were       is lost; being landfilled, incinerated, wasted at mining
removed, leaving a net addition of 31 billion tonnes in    operations or being unregistered waste fractions.
the year. In terms of the short-lived products that were   Of the materials classified as waste, only 8.65 billion
consumed by the global economy, a large share remains      tonnes or 8.6% of total material use of society is cycled.
unaccounted for and is assumed to be dispersed into
the environment as unrecoverable wastes.

                                                                        T h e Ci r c ul a r i t y G a p R e p o r t 2 02 0   17
3
METRIC S
 FOR

 CIRCU-
  L ARIT Y
  The Global Circularit y Metric
  & the circularit y gap
This section presents a measurement framework               In other areas, it supports making different choices as
and metrics for circularity. In the first edition of        to which data to include — for example, when deciding
the Circularity Gap Report we launched the Global           which residual resource streams to account for in
Circularity Metric (CGM). In last year’s 2nd edition        calculating global circularity. On our website,
we built on that work by applying the Circularity           www.circularity-gap.world/methodology, you can find
Metric to specific sectors and product groups.              more exhaustive background information, but, below,
In this 3rd edition, for the first time since the           we present the most profound changes and updates:
launch, we update the Global Circularity Metric.
                                                            •   Globally extracted resources have increased
This shows the real value of the Circularity Metric;
                                                                by 9% between 2015 and 2017, from 84.4 to
being able to track changes over time, measure
                                                                92.0 billion tonnes.10
progress and put trends into context. Ultimately,
consistent measurement frameworks should                    •   The end-of-use stage underwent a
inform governments and businesses alike to engage               re-categorisation of its main outflows: For instance,
in uniform goal-setting and guide future action in              this year we introduced a clear distinction between
the most impactful way.                                         emitted and dispersed materials, showing how
                                                                greenhouse gas emissions — measured in carbon
                                                                dioxide equivalent emissions — went up from
C O N C E P T UA L I S I N G G LO B A L M AT E R I A L
                                                                50.6 billion tonnes in 2015, to 53.3 billion tonnes
F LOW S A N D S TO C K S
                                                                in 2017..12 In pure carbon content this amounts to
As pointed out in the first chapter, a truly circular           14.6 billion tonnes in 2017. The amount of
economy is more than just a closed-loop system.                 material dispersed into the environment (as a result
This report introduces a strongly simplified conceptual         of undefined dissipative uses) amounted to
representation of the global metabolism — namely, the           22.4 billion tonnes.
materials flowing through and in (long-term) use by the
                                                            •   The total amount wasted went from 19.4 billion
economy. The approach adopted here builds on and is
                                                                tonnes in 2015 to 32.6 billion tonnes in 2017. This
inspired by, amongst others, the work of Haas et al.11
                                                                increase is again explained by a re-categorisation.
Then, taking material metabolism as our starting point,
                                                                In the previous report a lot of waste was reported
we explore and suggest a metric for global circularity.
                                                                as being dispersed where in the current report we
When we consider the four fundamentals page 20,
                                                                shed more light on how it ends up. For example,
it becomes apparent that the last one, the cycling of
                                                                we make explicit the mining waste, unregistered
materials, is the key factor. To capture this essential
                                                                waste and see a sizeable share of landfilled waste.
dynamic, we therefore suggest that the circularity
metric should measure the share of cycled materials as      •   Resources that are net added to stock have
a proportion of the total material inputs into the global       increased significantly from 21.5 billion tonnes in
economy every year.                                             2015, to 31 billion tonnes in 2017. The net stock
                                                                addition is calculated by deducting the figure for
As presented on page 16 and 17, the total resources             resources that are wasted from stock (17 billion
entering the economy account for some 100.6 billion             tonnes, up from 14.5 billion tonnes previously)
tonnes. These annual material inputs into our economy           from the total for resources added to stock, or
are composed of extracted resources, complemented               Products that Last (which rose from 36.013 billion
                                                                tonnes to 48 billion tonnes).7 It should be noted
by cycled resources. In 2017, 8.6 billion tonnes of
                                                                that these large changes are mostly related to
resources were cycled back into the global economy
                                                                improvements in the underlying datasets and do
and extracted material inputs amounted to 92 billion
                                                                not reflect actual trends. Fully referring to the
tonnes. Applying the definition to these numbers
                                                                new data available, net added stock was actually
results in a Global Circularity Metric of 8.6% for 2017.
                                                                1 billion tonnes larger in 2015. In fact, materials
                                                                being added to stock seem to have peaked in 2016
G LO B A L C I R C U L A R I T Y FA L L S
                                                                and entered a downward phase, whereas the flow
F R O M 9.1% TO 8 .6%
                                                                of materials wasted from stock is still on the rise.
Since the launch of the Circularity Gap Report back in          Overall this means that while the total size of the
2018, we have seen a significant body of new scientific         stock continues to grow, its rate may have started
publications and data sources updated. This allows for          to decline as more and more countries reach higher
the use of more accurate data, in some cases.                   levels of industrialisation.

                                                                        T h e Ci r c ul a r i t y G a p R e p o r t 2 02 0   19
•    Cycled resources went up from 8.4 billion tonnes                                                           Some 2.16 billion tonnes represent recovered
     to 8.65 billion tonnes — however, with new                                                                 waste from short-lived products, while 6.47 billion
     recovery rates applied globally for waste coming                                                           tonnes was recovered from stock depletion.
     from stock (2014) and to the EU only for waste
     from short-lived products (2016), this might prove                                                •        In summary, the amount of total resources
     a slight underestimate (with the actual figure                                                             entering the global economy increased by 8.4%
     probably closer to 9 billion tonnes).                                                                      from 92.8 billion tonnes to 100.6 billion tonnes.

                                                                                              Use

                                                                                                               Re
                                                                                                                    so
                                                                         ow                                              ur
                                                                    Fl                                        S               c
                                                                t                   t                        Ne toc
                                                                                 as                            t    k

                                                          a

                                                                                                                              e
                                                                             L                                   st d

                                                         th
                                                                         t                                         o

                                                                                                                                  ou
                                                                                                                     e
                                                                     a

                                                                                                                    c
                                                                                                                    m add
                                                                    th
                                                    ts

                                                                                                                     k

                                                                                                                                    tp
                                                                                                                       ol
                                                                s
                                                   uc

                                                                                                                          it tion
                                                              ct

                                                                                                                                    uts
                                                                                                                            io
                                                           du

                                                                                                                             i
                                                  Prod

                                                                                                                               n
                                                          Pro

                                                                                         S SOOCC II EETTYY
                                             Material                                                                         End-of-use
                                             inputs

                                                                                           Material
                                                                                            stocks                                        D
                                                                                                                                            is
                                                                                                                                          E    p
                                           ed s                                                                                            m erse
                                        ct
                                      ra ce                                                     1                                         Lo itte
                                                                                                                                                    d
                                                          T

                                                                                                                         P
                                   Ext our                           E                                                    A                 st    d
                                                              H

                              1     Res
                                                                             CI                                      G                                  2
                                                                                        RC                 Y
                                                                                             ULA       RIT
                                                                                             CYC LED

                                                                                               2
                                                                                                                                                        Figure 2 The Circularit y Gap

                           O B J EC T I V E S & S T R AT EG I E S
                      Based on this analysis and conceptual representation, four fundamental
                     dynamics of a circular economy can be identified. The first two describe the
                       objectives, whereas the latter two suggest the means to improvement:

             O
          1    BJECTIVE 1                                                                                        S
                                                                                                              1    T R AT E G Y 1

         Resource extraction from the lithosphere                                                            Utilisation of stocks is optimised, which
         is minimised and biomass production and                                                             means current stocks in use such as buildings
         extraction is regenerative.                                                                         and machinery are employed to their full
                                                                                                             potential, with most material in active use.
             O
          2    BJECTIVE 2                                                                                    This approach also entails limiting the stocks
                                                                                                             temporarily not in use (hibernating), or
         The dispersion and loss of materials is                                                             mobilising materials to re-enter the economy
         minimised, meaning all technical materials                                                          (urban mining).
         have high recovery opportunities, ideally
         without degradation and quality loss; and
                                                                                                                 S
                                                                                                              2    T R AT E G Y 2
         with emissions to air and dispersion to water
         or land prevented.                                                                                  Material cycling for reuse is optimised,
                                                                                                             requiring improved collection infrastructure
                                                                                                             and wide-scale adoption of best-available
                                                                                                             technologies for (re)processing of resources.

20
P R AC T I C A L C H A L L E N G E S I N C A LC U L AT I N G        As such, any quality loss and degradation in
AND INTERPRETING CIRCUL ARIT Y                                      processing goes unconsidered.

Back in 2018, with the launch of the first Circularity Gap     5.   Relative compared to absolute numbers.
Report, we wanted to introduce a year-zero baseline                 The GCM considers the relative size of cycled
measurement for the circularity of the global economy.              materials as a share of the total material input.
Now, for the first time, we can report how we are                   This means that as long as the amount of cycled
progressing, or not. In fact, circularity has gone down             materials improves relative to the extraction of
from 9.1% to 8.6% over the course of just two years.                new materials, we see the statistic improving,
To be able to interpret these numbers and associated                while more and more virgin resources are being
trends, it is helpful to provide some context for how the           extracted. The statistic in this case would show
metric might best be understood and used in guiding                 progress, despite a key objective of the circular
action. The Global Circularity Metric is a strongly                 economy not being met.
simplified measurement for a very complex system.
Calculating and interpreting the GCM has one core
strength (1) and at least four practical challenges (2-5):

1.   Monitoring progress. The real advantage of the
     GCM is its ability to consistently monitor progress
     over time for the globe. It remains the ambition to
     report on its value and underlying fundamentals
     every year.

2.   Ignorance of core traits. A circular economy is not
     the same as a system that optimises the recycling of
     materials. On the contrary, it is about retaining value
     and complexity of products as highly as possible,
     for as long as possible — ideally, without any
     degradation, or fallout. The GCM does not, however,
     explicitly consider individual strategies that are
     core to building a circular economy — such as asset
     sharing, lifetime extension or remanufacturing.
     These strategies extend the functional lifetime of
     products, whereby waste creation is prevented, thus
     ‘slowing down’ flows and lowering waste volumes.
     At the same time, they also reduce the requirement
     for new inputs to produce new products for
     replacement.

3.   Data quality. For the quantification of global
     material flows and stocks, data quality is variable.
     Data on material extraction and use are relatively
     robust. What happens to materials after they are
     discarded is generally less certain, because waste
     is heterogeneous in nature, geographically spread-
     out and its categorisations differ between statistical
     sources.

4.   Quality loss and degradation. The metric focuses
     on the end-of-use cycling of materials that re-enter
     the economic system. The GCM measures how much
     (in mass) materials are cycled, but does not consider
     in what composition, or to what level of quality.

                                                                            T h e Ci r c ul a r i t y G a p R e p o r t 2 02 0   21
4
 THE
 POWER
 OF

COUN-
 TRIES
 The e qualiser: we are all
 developing countries now
In this chapter, we explore how countries are                 M OV I N G TO A S A F E A N D J U S T S PAC E :
increasingly recognising the transformative power             WHERE COUNTRIES ARE ON THE MAP
of setting targets for circularity and developing
                                                              Overall, closing the circularity gap serves the higher
nationwide roadmaps. The precise starting point
                                                              objective of preventing further and accelerated
for each country to move to circularity will be
                                                              environmental degradation and social inequality.
different: some countries operate well within the
                                                              The transition towards circularity is, therefore, a means
ecological boundaries of our planet, but without
                                                              to an end. The end goal is to establish an ecologically
being able to satisfy certain basic human needs;
                                                              safe and socially just operating space for humanity.1
others are getting much closer to providing basic
                                                              In essence, then, the challenge faced is one of
levels, but doing so by overshooting the sustainable
                                                              achieving a high quality of life for close to 10 billion
means of the planet. Ultimately, the real challenge
                                                              people by mid 21st century, without destabilising
is to enable and equip all countries to reside
                                                              critical planetary processes. In order to steer action
sustainably within the ecologically safe and socially
                                                              towards this safe and just space in which all of
just space.1 At present, some countries are close,
                                                              humanity has the chance to thrive, deep
others are far away; each starts from a different
                                                              transformations will inevitably be needed.14
point on the map; but, all have a distance to go —
all countries are developing now.
                                                              As regards development progress to date, analysis
                                                              by O’Neil et al.15 has scored where over 150 countries
H OW C O U N T R I E S A D O P T A N D
                                                              stand in terms of operating in the safe and just space.
DRIVE CIRCUL ARIT Y                                           Taking this study as inspiration — but applying
As comprehensively laid out in the SDGs and the Paris         different proxies for the ecological safe and socially
Agreement, countries have a pivotal role to play in           just dimensions — we have now created an overview
the dynamic triple-charged forcefield of government,          for 176 countries. In this, the Social Performance
business and civil society. As such, countries are            of a country is indicated by its score on the United
leading change agents for the circular transition.            Nations Human Development Index (HDI). The HDI
                                                              is a measure of achievement in key dimensions
First and foremost, countries have the mandate to             of human development: a long and healthy life,
develop national legislation and create the enabling          being knowledgeable and having a decent standard
environment and incentives which drive the transition.        of living.16 The other axis assesses a country’s
Alongside this, as lead investors in infrastructure,          performance on its Ecological Footprint (EF), an
government buildings and assets, their procurement            indicator that accounts for human demand of global
strategy can kick-start circularity at scale. They are also   biological resources.17 To reside within the ecologically
the leading actors in supranational and multilateral          safe space, is defined by countries with an average EF
coordination, via alliances such as the United Nations,       score per person of less than the world’s biocapacity
the African Union and the European Union.                     available for each global citizen.18 For a country to
                                                              be in the socially just space an HDI above 0.8 out
Individually, the motivations for countries to establish      of 1 is needed, which indicates very high human
national roadmaps for circularity vary considerably,          development. Scoring all countries on both aspects
but drivers may include: creating a more competitive          allows us to determine how far they stand from the
national economy; tackling resource scarcity and              safe and just space.
ensuring supply security; complying with emission
reduction targets; or meeting the needs of a growing          One observation is already striking: no country resides
population, to drive better social outcomes. In               within the safe and just space today. Some countries
response, certain countries are taking a more                 are close, others are far away; each starts from a
adversarial stance, for example by imposing trade             different point on the map; but, all have a distance to
restrictions on secondary resource flows to protect           go — all countries are developing now.
their markets.

                                                                           T h e Ci r c ul a r i t y G a p R e p o r t 2 02 0   23
U N F O L D T O F I N D O U T H O W C LO S E
             YO U R C O U N T RY I S T O T H E S A F E
             A N D J U S T S PA C E F O R H U M A N I T Y

V I S I T:

w ww.
c ir cular i ty - g ap
. wor ld
F O R M O R E D ATA ,
I N T ER A C T I V E I N F O G R A P H I C S
A N D R E G U L A R U P D AT E S
O N T H E C I R C U L A R I T Y G A P.
24
M E A N S TO A N E N D : T H E C I R C U L A R                                  These scenarios may, for example, relate to how the
ECONOMY AS GAMECHANGER                                                          energy infrastructure is designed (centralised fossil
                                                                                fuel generation, versus distributed renewable); or, how
Closing the circularity gap serves the higher ambition
                                                                                advances in urban planning and construction support
of moving to an ecologically safe and socially just space.
                                                                                moving to adaptable, modular build methods, rather
Exactly how the circular transition can deliver more
                                                                                than retaining a traditional brick-and-block approach.
beneficial social outcomes is not a question with just
one right answer: There is no simple straight-line
                                                                                So, in summary, having established the material-flow
solution and the feedback loops in the system run
                                                                                linkages between resource use and societal needs,
in all directions.15
                                                                                plus having explored how countries as a whole are
                                                                                progressing (or not) on their journey towards the safe
Therefore, to systemise the transition dynamics,
                                                                                and just space, the remainder of this Report will focus
we need to think in three dimensions: how resource
                                                                                on identifying common country profiles, highlighting
use links to social outcomes via provisioning systems.
                                                                                individual examples and gathering actionable insights
Provisioning systems comprise both physical and
                                                                                around the creation and adoption of practical
social systems; the former include networks of
                                                                                transition pathways. These transition pathways can
infrastructure, technologies, and their efficiencies,19
                                                                                help move countries towards an achievable circular
while the latter encompass government institutions,
                                                                                economy in a complex and challenging global context.
communities, and markets. 20 Provisioning systems are
the essential link between biophysical resource use
and social outcomes. For example, different forms
of transportation infrastructure (railways versus
highways) generate similar social outcomes at very
different levels of resource use.15
                                                                                                                                                              6
In the following chapters, we will sketch out how we
see different provisioning systems driving similar
social outcomes and satisfying certain societal needs,                                                                                                        5

                                                                                                                                                                                                    (displayed in number of planets needed to sustain
but with (significantly) different resource-use profiles

                                                                                                                                                                                                                                                        the lifestyle of the countr y’s average citizen)
                                                                                                                                                                  Ecological Footprint per capita
(based on on-the-ground projects).
                                                                                                                                                              4

                                                                                                                                                              3

                                                                                                                                                              2

                                                                                                                                                              1
                                                                                                                                 Eco l o gica l l y
                                                                                                                                    s a fe a nd
                                                                                                                                 s o cia l l y ju s t
                                                                                                                                      s p a ce
                                                                                                                                                              0
                                                 0.2                      0.4                      0.6                     0.8                          1.0

                                                                                Human Development Index
                                                                                                 HDI

                                                 F i g u r e 3 S h o w s h o w 176 c o u n t r i e s s c o r e o n t h e H u m a n D e v e l o p m e n t
                                                 Index (HDI) and the Ecological Footprint (EF ) combined; three
                                                 countr y prof iles emerge with dif ferent distances to a safe and just
                                                 operating space for humanit y (the rec tangular box bot tom right).

                                                                                                   T h e Ci r c ul a r i t y G a p R e p o r t 2 02 0                                                                                          25
MAPPING COUNTRIES’                                                                                                                           Showing how 176 countries perform on the basis of both Social Performance
                                                                                                                                                  and Ecological Footprint, and thereby how far they are from operating in an

     DISTANCE FROM THE                                                                                                                            ecologically safe and socially just space for humanity: meeting basic human
                                                                                                                                                  needs while staying within the Earth’s biophysical boundaries. Some

     SAFE & JUST SPACE                                                                                                                            countries are close, others are far away: each starts from a different point
                                                                                                                                                  on the map; but all have a distance to go — all countries are developing.

                                                                                                                                                                                       Bu r u nd i

                                                                                                      Sierra
                                                                                                      L eo ne                                                                                                                                                        Bu r k ina Faso

                                                                                                                                                                                       Sw e d e n
                                                                                                                                                        R w and a                                                Nig e r ia
                                                                                                                                      Australia
                                                                                                                                                                                                                                     Zimbabw e

                                                                                                    M adagascar                                                                                                                                           T anz ania

                                                                                                                                                                                                                                                                                         Latv ia
                                             Ku wa i t                                L eso tho
                                                                                                                                                    Ant ig u a and
                                                                                                                                                    Antig                                                                                                                                                                           Mal i
                                                                                                                                                                                           Sw itz e r l and
                                                                                                                                        New          Bar bu
                                                                                                                                                          buda
                                                                                                                                     Zealand                                                                                     Gu ate mal a
                                                                                                                                                                                                                                                                                                        Syr ia
                                                                          Benin
                                                                                                                         To nga                                           P ar ag u ay                                                             C h ina
                                                                                                                                                                                                                 T imo r -
                                                                                                                                                                                                                  Le ste
                                                                                                 Netherlands                                                                                                                                                                                                            P ap u a
                                                                                                                                                                                                                                                                 Samo a
                                                                                                                                                                                                                                                                                                                        Ne w Gu ine a
                                                         Oma n
                                                                                                                                                                              Bah amas
                                                                                          Germany                                                                                                           Mau r itiu s                                                       I nd ia
                                                                                                                                                   Cy pr u s
                                                                                                                                                                                                                                 Mace d o nia
                                                                                                                                   D o minica
                                                                                      I srael
                                      Denm
                                      Denmaa rk                                                                                                                                                                                                                                             Jap an                                   Finl and
                                                                                                                                                                                                                                              E g ypt
                                                                                                                 Barbado s
                                                                          Ho nduras
                                                                                                                                                                                                                                                            Mo nte ne g r o
                                                                                                                                                                                        Me x ico                                                                                                      Fr ance                                                       Dj i b o u t i
            Ch ad
                                                                                                      Ukraine                                   V enezue l a                                                          R o mania
                                 U g a nda                                                                                                                                                                                                                                                                                                   Be l g
                                                                                                                                                                                                                                                                                                                                                  gii u m
                                                                                                                                                                                                                                                                        Uz b e k istan
                                                                   Co ngo                                                                                                                                                                                                                                     I tal y
                                                                                           M alay sia
                                                                                                                                      Peru                                                                                                       mbia
                                                                                                                                                                                                                                         C o l o mb ia
                                                                                                                                                                                                                                                                                  I nd o ne sia
                                                                                                                                                            C u ba                                               Sr i Lank a                                                                                        P o l and                       Saudi
                       Comoros                   Sou th Afri ca
                                                                                      Cro atia                                                                                                                                                            D o minican                                                                               Arabia
                                                                                                                   Jo rdan
                                                                                                                                                                                                                                                          Reppuub
                                                                                                                                                                                                                                                                bll ic
                                                                                                                                                                                                                                                                                           Hu ng ar y
                                                   Sl oveni a                                                                                                                                                                                                                                                            Su r iname
                                                                                                                                     Albania                                                                                           Ur u g u ay
                                                                            Ky rgy zstan
                        Tog
                        To g o                                                                                                                                                            a n d s o ci
                                                                                                            Algeria                                                               s   afe              al   ly                                                   Az e r b aijan
                                                                                                                                                                                                                                                                        baijan
                                                                                                                                                                                                                                                                                                                                                          Austria

                                                  Irel a nd                                                                                                                ll y                                                                                                                Turkey                      Unite d
                                                                                                                                                                                                                                                                                                                           K ing d o m
                                                                                                                                                                                                                 ju
                                                                                                                                                                      a
                                                                                                                                                                  gic

                                                                                                                                                                                                                  st

                                                                              Belarus
                                                                                                                                                                                                                    spa
                                                                                                                                                               Ec o l o

                                                                                                                                                                                                                      ce

Bahrain              S ud a n                     Bol i vi a                                                                                                                                                                                    C o sta                                                                                                   Liberia                    Qatar
                                                                                                          Serbia            Panama                                                                                                                                  Br az il                       T ajik istan             Gu yana
                                                                                                                                                                                                                                                R ica

                                                                                  I raq

                                                   Ru s s i a                                                                                                                                                                                                                                                              C ame r o o n
                                                                                                                                                                                                                                                                                               C h il e
                                                                                                                                                                            fo                   d
                                                                                                                I ran                                                              r h                                                                           Mo l d o v a                                                                             United States
                     Sene
                        eggal
                                                                                  Spain
                                                                                                                                                                                       u m ankin                                                                                                                                                          of America
                                                                                                                                     Geo rgia                                                                                          Ar me nia
                                               Ba ng l a des h                                                                                                                                                                                                                             Bo snia and                   Korea
                                                                                                                                                                                                                                                                                           He r z e g o v ina
                                                                                                                                                                                                                                                        P h il ip p ine s
                                                                                     V ietnam
                                                         N a mi
                                                             m i bi a                                                     Saint                                                                                                                                                                                     P ak istan                     Mozambique
                                                                                                                          L ucia                                                                                 Jamaica
                           Bel i ze                                                                                                                                  E cu ad o r                                                                                                  Nicar ag u a

                                                                 Za mbia                                                                                                                                                                Gr e nad a                                                            Sing apo r e
                                                                                                 Gabo n                                  Argentina
                                                                                                                                                                                                                                                                        Bo tsw ana
                                                                                                                                                                                                                                                                                                                                                itr e a
                                                                                                                                                                                                                                                                                                                                            E r itre
                                 Sol omon
                                     om on                                                                                                                 T u nisia                                        Bu l g ar ia
   Trin id ad an d                Is l a nds                                Keny a                        Po rtugal                                                                    T h ail and                                                                                                    Mal ta
          Tobago
          Tob ago                                                                                                                                                                                                                                           Gr e e ce                                                                                               Luxembourg

                                                                                      L ao s                                                                                                                                                                                                                                        Bh u tan
                                                                                                                              L ebano n                                                                                                                                                    Gh ana
                                                                                                                                                                                  Sl o v ak ia                                           C ap e V e r d e
                                     T u rkm eni s ta n
                                                                                           No rway                                        M o ro cco
                                                                                                                                                                                                                          Fiji                                                 Ne p al
                                                                                                                                                       E l Sal v ad o r                             Br u ne i
                                                                                                                                                                                                 D ar u ssal am                                                                                                          Gu ine a
                                                                                                   Equato rial                                                                                                                                                   Myanmar
                                                                Ha i ti                               Guinea

                                                                                                                                                        Ang o l a                                                                                    Sw az il and
                                                                                                               Sao To me and                                                               K az ak h stan
                                                                                                                                                                                                                                                                                                          D R C o ng o
                                                                                                                    Principe                                                                                                          Libya
                                                                    A fghanistan                                                         L ithuania
                                                                                                                                                                                                            C amb
                                                                                                                                                                                                              amboo d ia
                                                                                                                                                                            C z e ch
                                                                                                                                                                          R e pu
                                                                                                                                                                              p u bl
                                                                                                                                                                                  b l ic
                                        Mong ol i a                                                                                                                                                                                                                               Gu ine a-Bissau                             Nig e r
                                                                                               Esto nia

                                                                                                                Co te
                                                                                                            d'I vo ire                                                                                                                                 C anad a
                                                                                                                                                                                                                                     Gamb ia
                                                                                                                                   M auritania
                                                                                                                                                        M al aw i                                            E th io p ia
                                                                                                                                                                                        Ye me n

                                                                                                      So uth
                                                                                                                                                                                                                                                                  C e ntr al Af r ican
                                                                                                      Sudan                                                                                                                                                       R e pu
                                                                                                                                                                                                                                                                      p u bl
                                                                                                                                                                                                                                                                          b l ic

                                                                                                                                                                                   Unite d Ar ab
                                                                                                                                                                                    E mir ate s

     Ecological Footprint                                          within 1 planet                                                                                                                                                                                                                  0.8 to 1                     Social Performance
                                                                                          1 to 2 planets                                                                                                                                                                0.65 to 0.79                                            Measured by the United Nations’
     Measured in average Global
                                                                                                                                                                                                                                                                                                                                Human Development Index (HDI)
     Hectares (GHa) per person in
                                                                                                                        more than                                                                                                                  0.649 to 0
     relation to the earth's biocapacity
                                                                                                                         2 planets                                                                                                                                                                                                                  Higher = preferable
     Smaller = preferable

                                                                                                                                         Distance to Safe and Just space
                                                                                                                                                   Each orbit clusters countries that share a
                                                                                                                                                  similar distance to the safe and just space.

                                                                                                                                                           Closer to center = preferable
5
 N OT
 THE

SAME
 BUT

 SIMI-
   L AR
        Dif ferent countries ,
        common ne e ds
In principle, all countries are unique, when it comes         Based on the two dimensions of Social Progress and
to their ecological footprint and ability to provide          Ecological Footprint, therefore, we have been able
for their people. In practice, though, it is possible         to distinguish between countries falling into one of
to identify signs of commonalities and evidence               three broad profiles: namely, the Build, Grow, and Shift
of megatrends that are shared both within and                 country groups.
between these unique country profiles. Zooming
in from the global footprint to focus on satisfying           Whilst this classification is far from clear-cut and
national, regional and local societal needs, this             exhibits some overlap, it does underline how the
chapter explores some of the common challenges                discourse on transitioning to a circular economy needs
and opportunities experienced by distinct country             to account for both differences and commonalities,
groups. It then seeks to illustrate such patterns             if we are to arrive at a more strategic and instructive
and parallels by providing individual country                 analysis. It also allows us to highlight a set of key
examples. Common problems and shared solutions                themes that are likely to be central to the countries
help place unique profiles and individual issues in           that fall under the respective profiles.
context. Whilst recognising that no single country
can ever be a perfect match for all the criteria of           The first group comprises countries where large parts
any one group, it is important to join the dots of            of society lack the means to satisfy their basic needs
our understanding. This understanding then helps              and are therefore motivated to Build an economic
inform the development of comprehensive and                   system that is both inclusive and futureproof. The
custom implementation blueprints for the circular             second pathway relates to emerging economies that
economy strategies of each and every country.                 will need to continue to grow in a manner that satisfies
                                                              societal needs, but do so within planetary boundaries.
DIFFERENT COUNTRIES                                           Lastly, there are the countries that are typically home
                                                              to advanced, post-industrial economies, which are
The Map of Countries and scatter plot (Figure 3) in           under pressure to shift away from over-consuming the
the previous chapter positions countries in terms of          planet’s resources, in servicing their relatively affluent
where they are on the map, in terms of both their             and comfortable lifestyles.
Social Progress and Ecological Footprint. In part, their
various starting points explain the differences in
                                                              SNAPSHOTS
emphasis being placed on their development priorities.
For instance, a country with a severe deficit in terms        To demonstrate how the Build, Grow and Shift countries
of its Human Development Index (HDI) will prioritise          perform, we present a non-exhaustive list of statistics
the satisfaction of all its citizens’ societal needs — with   to help illustrate the orders of magnitude between
the recipe for this usually centred around economic           the country groups. For example, looking at indicators
growth. The circular challenge in this context is to          such as material consumption shows that Shift
design a pathway for inclusive growth that enables the        countries consume roughly 10 times more resources
economy to flourish, whilst staying within the planet’s       per person than Build countries. Zooming in on social
ecological capacity. By contrast, countries that are          indicators, for example, the share of workers employed
already achieving strong levels of citizen satisfaction,      in agriculture shows that in Build countries 1 in every
but doing so at a high ecological cost, are faced with        2 people is employed in agriculture, whereas for Grow
an immediate need to decarbonise their economies,             countries the figure is only 1 in 4 and for Shift, it is
reduce pollution of soil and water, consume resources         as low as 1 in 25. Access to infrastructure is another
more efficiently, plus reconsider their consumption           indicator that demonstrated differences between
habits altogether.                                            profiles: in Build countries approximately half of all
                                                              people have access to electricity; in Grow countries the
COMMON NEEDS                                                  proportion jumps to more than 90% whereas in Shift
                                                              countries, access has become a commodity.
Whilst no two countries are the same, there are still
obvious similarities between some of them, with
discernible development patterns and parallels in
evidence. Common problems and shared solutions
help place unique country identities and individual
issues in context.

                                                                           T h e Ci r c ul a r i t y G a p R e p o r t 2 02 0   29
CO U NTRY PRO F I LE S
PHYSIC AL , SO CIAL &
ECONOMIC D IMENSIONS

                                    BUILD    GROW       SHIFT

P O P U L AT I O N 22                                                   7.6 bil l ion peopl e worl dwide

M AT E R I A L
                                                                        11.3 tonnes per ca pita / yea r (worl dwide avera ge)
CO N S U M P T I O N 22

S TOC K B U I L D I N G 1 0                                             28.7 bil l ion tonnes of construction ma teria l s used wo r l dw i de

T R A D E V O L U M E 22                                                3 3 .7 tril l ion € a ggrega ted imports a nd ex ports worl d w i de

I M P O R T S 22                                                        17.0 tril l ion € imports for a l l countries worl dwide

E X P O R T S 22                                                        16.7 tril l ion € ex ports for a l l countries worl dwide

G R O S S DO M E S T I C
                                                                        60 .3 tril l ion € gross worl d product ( Consta nt 2010 € )
P R O D U C T 22

ELECTRICITY
                                                                        77.9 percent of popul a tion with a ccess to el ectricity
ACC E S S 2 2

E N E R G Y U S AG E 2 2                                                13 .1 bil l ion tonnes of oil equiva l ent/ yea r

R E N E WA B L E
ENERGY                                                                  25.0 percent renewa bl es in worl dwide energy consump ti o n
CO N S U M P T I O N 22

EMPLOYMENT IN
                                                                        3 0 percent of worl dwide empl oy ment
AG R I C U L T U R E 22

WA S T E
                                                                        2,0 10 mil l ion tonnes of worl dwide municipa l sol id wa s te / ye a r
G E N E R AT I O N 23

RECYCLING RATE23                                                        10.7 percent of wa ste recycl ed (worl dwide avera ge)

                              Figure 4 Presents key statistics for physical, social
                              and economic dimensions , to illustrate the orders of
                              magnitude on these topics across the three Build,
                              Grow and Shif t countr y groups .

30
MATERIAL FOOTPRINT: GLOBAL
TO COUNTRY (PROFILES)

Having introduced the idea of the global material
footprint behind satisfying key societal needs in Chapter
2, here, we take a closer look at how this applies across
the Build, Grow and Shift country groups. Doing so
helps to highlight some of the commonalities in the
way the different groups of countries extract, process,
produce, consume and treat materials at the end-of-
use stage. Ultimately, the way an economy functions,
also in relation to material handling, forms the point
of departure for countries in their trajectory towards
reaching a circular economy. At the same time, it is
worth mentioning that most countries are by no means
starting their journey from scratch — rather, the point
of departure refers to their baseline as of now.

Compared to the globe, performing a material footprint
analysis for a country (profile) means that the system
is not closed. Raw materials, semi-finished and
finished products are traded between countries. To
account for the material footprint of raw materials is
straightforward. With finished goods this can be very
different. Take a laptop computer for example. When
imported into a country it may be that the actual laptop
only weighs one kilogram. All the materials that were
needed to produce and transport the same laptop can
be as much as 3 to 5 kilograms. To represent actual
material footprints in the dynamic of trade — imports
and exports — we have applied so called raw material
equivalents (RMEs). This follows the reasoning that Circle
Economy also applied in its first ever analysis performed
for a country. The Circularity Gap Report Austria was
launched in spring of 2019. 2 4

                                                             T h e Ci r c ul a r i t y G a p R e p o r t 2 02 0   31
MATE RIAL FO OTPRI NTS
                          EXTRACTED, PRO-                                                                                                                     EXPORTED, STOCKED,
                          CESSED, PRODUCED                                                                                                                    WASTED, LOST OR
                          ELSEWHERE                                                                                                                           CYCLED ELSEWHERE

                            IMPORT                                                                                                                                              EXPORT
                                            IMPORT                                                                                                             EXPORT
                            FOOTPRINT                                                                                                                                           FOOTPRINT

                                   EXTRACTION                                                            N AT I O N A L E C O N O M Y                                               CONSUMPTION                              END OF USE
                                                                                                                                             S O C I E TA L
                                                                                                                                               NEEDS
                                                           T O TA L M AT E R I A L I N P U T

                                                                                                                                                               PRODUCTS
                                                                                                                                                               T H AT F L O W
                                                                                                                                                                                                                                               LOST

                                                                                                                                                                                                                                 END OF LIFE
                                                                                                                                                                                                          WA S T E F R O M
                                                                                                                                                                                                          STOCKS                               CYCLED
                                                                                                                                                               PRODUCTS
                                                                                                                                                               T H AT L A S T

                                                                                                                                                                                         M AT E R I A L
                                                                                                                                                                                          STOCKS

                           N AT I O N A L E C O N O M Y
 RESOURCES

                                                                                                                                          Figure 5 (Above and right page) The resource footprint over views
                                                                                                                                          f o r t h e B u i l d , G r o w a n d S h i f t c o u n t r i e s 10 b a s e d o n 2 017 d a t a
                              MINERALS       ORES         FOSSIL FUELS                                      BIOMASS
                                                                                                                                          from the WU Global Material Flow Database. Note: material
                                                                                                                                          stock and c ycled material flows are not scaled to propor tion.
S OC I E TA L N E E D S

                                       HOUSING                                                 C O M M U N I C AT I O N                 SERVICES                        CONSUMABLES

                                       MOBILITY                                                HEALTHCARE                               NUTRITION

  The figure above shows a schematic overview of the                                                                                                                        The materials are in turn processed and either applied
  material footprint of a country or group of countries.                                                                                                                    to satisfy societal needs such as nutrition, housing
  The left side shows four resource groups (minerals,                                                                                                                       and mobility, or they are exported. Of these materials
  ores, fossil fuels and biomass) that are the result of                                                                                                                    entering the national economy every year, the majority
  domestic extraction. The top section shows how many                                                                                                                       are utilized by society as short-lived Products that
  resources enter the national economy through import.                                                                                                                      Flow — reaching their end-of-use within a year. The
  Because the imported volumes are manufactured and                                                                                                                         end-of-use resources of these products are either
  transported to the country, the actual material import                                                                                                                    lost or cycled back into the economy. The remaining
  footprint is shown in the shaded colour. Together the                                                                                                                     aforesaid materials enter into long-term stock —
  domestic extraction and the import comprise the total                                                                                                                     referred to as Products that Last. These products are
  material input into the national economy.                                                                                                                                 namely capital equipment, buildings and infrastructure.

  32
You can also read