Contributions from renewable energy and energy efficiency activities - Narrowing the Emissions Gap: Contributions from renewable ...
←
→
Page content transcription
If your browser does not render page correctly, please read the page content below

+ 2°C

    Narrowing the Emissions Gap :
    Contributions from
    renewable energy and
    energy efficiency activities

    First Report | 2015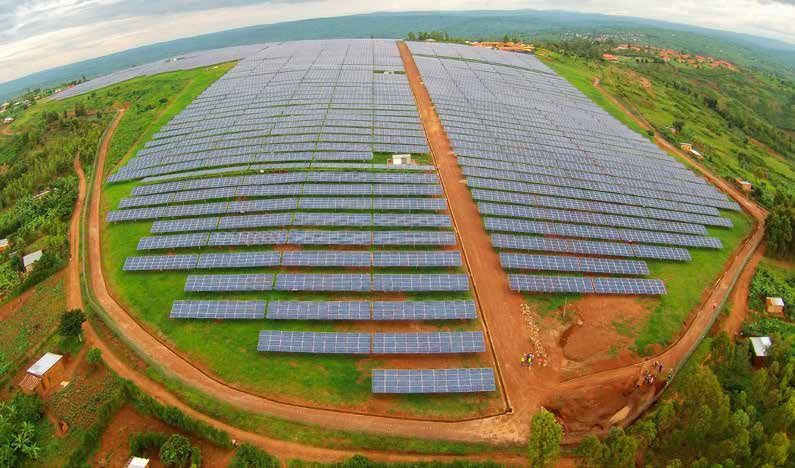
+ 2°C

                                                                         Narrowing the Emissions Gap :
                                                                         Contributions from
                                                                         renewable energy and
A digital copy of this report is available at 1gigatoncoalition.org      energy efficiency activities
Copyright © United Nations Environment Programme, 2015
This publication may be reproduced in whole or in part and in any
form for educational or non-profit purposes without special permission
from the copyright holder, provided acknowledgement of the source
is made. UNEP would appreciate receiving a copy of any publication
that uses this publication as a source.
No use of this publication may be made for resale or for any other
commercial purpose whatsoever without prior permission in writing
from the United Nations Environment Programme.

Disclaimer
The designations employed and the presentation of the material
in this publication do not imply the expression of any opinion
whatsoever on the part of the United Nations Environment Programme
concerning the legal status of any country, territory, city or area or
of its authorities, or concerning delimitation of its frontiers or
boundaries. Moreover, the views expressed do not necessarily
represent the decision or the stated policy of the United Nations
Environment Programme, nor does citing of trade names or
commercial processes constitute endorsement.

ISBN: 978-92-807-3499-7

Job number: DTI/1913/PA
+ 2°C
ACKNOWLEDGEMENTS TABLE OF CONTENTS
The 1 Gigaton Coalition was ACKNOWLEDGEMENTS. . . . . . . . . . . . . . . . . . . . . . . . . . . . . . . . . . . . . . . . . . 4
initiated and is supported by the
Government of Norway.
FOREWORD . . . . . . . . . . . . . . . . . . . . . . . . . . . . . . . . . . . . . . . . . . . . . . . . . . . . . 6
KEY FINDINGS. . . . . . . . . . . . . . . . . . . . . . . . . . . . . . . . . . . . . . . . . . . . . . . . . . . 7
EXECUTIVE SUMMARY. . . . . . . . . . . . . . . . . . . . . . . . . . . . . . . . . . . . . . . . . . 8
LEAD AUTHORS: PROJECT MANAGEMENT AND COORDINATION: 1 INTRODUCTION. . . . . . . . . . . . . . . . . . . . . . . . . . . . . . . . . . . . . . . . . . . . . 10 5 ANALYZING BILATERAL AND MULTILATERAL ENERGY
Angel Hsu (Yale University), Niklas Höhne (NewClimate Institute), Zitouni Ould-Dada (UNEP), Minori Lee (UNEP Consultant) EFFICIENCY AND RENEWABLE ENERGY ACTIVITIES
Yaping Cheng (Yale University), Amy Weinfurter (Yale University), 2 METHODOLOGICAL OVERVIEW IN DEVELOPING COUNTRIES. . . . . . . . . . . . . . . . . . . . . . . . . . . . . . . . . 34
Markus Hagemann (NewClimate Institute), Sebastian Sterl DESIGN AND LAYOUT: AND CHALLENGES . . . . . . . . . . . . . . . . . . . . . . . . . . . . . . . . . . . . . . . . . 12
(NewClimate Institute), Kaiyang Xu (Yale University), Andrew 5.1 OBJECTIVES. . . . . . . . . . . . . . . . . . . . . . . . . . . . . . . . . . . . . . . . . . . . . . . 35
weeks.de, Munich
Moffat (Yale University), Takeshi Kuramochi (NewClimate Institute) 3 DEVELOPING COUNTRIES’ ENERGY EFFICIENCY AND 5.2 SELECTED BILATERAL ACTIVITIES. . . . . . . . . . . . . . . . . . . . . . . . . . . . . 37
THE 1 GIGATON COALITION WOULD LIKE TO THANK AND RENEWABLE ENERGY CONTRIBUTION TO GLOBAL 5.2.1 Reporting structures. . . . . . . . . . . . . . . . . . . . . . . . . . . . . . 37
REVIEWERS: ACKNOWLEDGE THE INVALUABLE ASSISTANCE OF REN21, GREENHOUSE GAS EMISSION REDUCTIONS. . . . . . . . . . . . . . . . . 15 5.2.2 Quantitative impact. . . . . . . . . . . . . . . . . . . . . . . . . . . . . . . 39
Angela Kallhauge (IRENA), Carlin Rosengarten (Yale University), NAMELY:
5.3 SELECTED MULTILATERAL ACTIVITIES. . . . . . . . . . . . . . . . . . . . . . . . . 40
Christine Lins (REN21), Daniel Puig (UNEP DTU), Greet Maenhout
Hannah E. Murdock for data collection, and Lea Renalder for 4 DEVELOPING COUNTRIES’ EFFORTS AND 5.3.1 Development banks and funds. . . . . . . . . . . . . . . . . . . . 40
(European Commission), Hans Kolshus (Norwegian Environment
research support. Also, the following for contributing data through ACHIEVEMENTS IN ENERGY EFFICIENCY AND 5.3.2 Multi-stakeholder partnerships. . . . . . . . . . . . . . . . . . . 44
Agency), Hans Olav Ibrekk (Ministry of Foreign Affairs, Norway)
Hannah E. Murdock (REN21), Johanna Koolemans-Beynen (Center
REN21: RENEWABLE ENERGY . . . . . . . . . . . . . . . . . . . . . . . . . . . . . . . . . . . . . . . . 18
for Dialogue and Analysis on North America), John Christensen Camila Ramos (CELA – Latin America), Evan Musolino (Asia Pacific, 4.1 OBJECTIVES. . . . . . . . . . . . . . . . . . . . . . . . . . . . . . . . . . . . . . . . . . . . . . . 19 6 ASSUMPTIONS AND UNCERTAINTIES. . . . . . . . . . . . . . . . . . 48
(UNEP DTU), John Erik Prydz (Ministry of Climate and Environment, BRICS, MENA, Sub-Saharan Africa), Fabiani Appavou (Mauritius),
4.2 POLICY DEVELOPMENT in energy efficiency 6.1 SPECIFIC REPORTING CHALLENGES. . . . . . . . . . . . . . . . . . . . . . . . . . 49
Norway), Jusen Asuka (Tohoku University), Kjetil Roine (Differ), Ferdinand Larona (GIZ – Philippines), Hannes Reinisch (Directorate
and renewable energy in developing countries. . . . . . . . . 19 6.1.1 Accounting scope. . . . . . . . . . . . . . . . . . . . . . . . . . . . . . . . . 49
Mark Radka (UNEP), Melanie Slade (IEA), Nebojsa Nakicenovic of Energy and Climate Change – UAE), Lea Renalder (REN21
4.2.1 Targets. . . . . . . . . . . . . . . . . . . . . . . . . . . . . . . . . . . . . . . . . . . . . 19 6.1.2 Mitigation approach. . . . . . . . . . . . . . . . . . . . . . . . . . . . . . 50
(IIASA), Philip Drost (UNEP), Ritu Mathur (TERI), Sameer Akbar Secretariat – ECOWAS), Pierre El Khoury (LCECP – Lebanon), Quoc
(World Bank), Sven Teske (Greenpeace), Terje Kronen (Ministry Khanh Nguyen (Vietnam), Reem Ketait (Directorate of Energy & 4.2.2 Policy instruments. . . . . . . . . . . . . . . . . . . . . . . . . . . . . . . . . 22 6.1.3 Accounting timeframe. . . . . . . . . . . . . . . . . . . . . . . . . . . . 50
of Climate and Environment, Norway) William Agyemang-Bonsu Climate Change – UAE), Soumya Garnaik (ICFI – India), Taoufik 4.3 SUCCESS STORIES. . . . . . . . . . . . . . . . . . . . . . . . . . . . . . . . . . . . . . . . . . 23 6.1.4 Attribution of mitigation impacts in
(UNFCCC), Zhao Xiusheng (Tsinghua University). Laabi (Office National de l’Electricité et de l’Eau Potable – Morocco) case of co-financing. . . . . . . . . . . . . . . . . . . . . . . . . . . . . . 50
4.3.1 Chile: A comprehensive efficient lighting
Additionally, the following people reviewed or otherwise strategy. . . . . . . . . . . . . . . . . . . . . . . . . . . . . . . . . . . . . . . . . . . 24
INFORMATION AND DATA CONTRIBUTIONS FOR COUNTRY contributed to the collection of REN21 data: Abdelghani El Gharras 4.3.2 Rwanda: Solar power supports
7 CONCLUSIONS AND RECOMMENDATIONS. . . . . . . . . . . . . . 52
CASE STUDIES AND INITIATIVES: (OME), Alexander Fisher (BMUB), Alexander Ochs (Worldwatch), economic development. . . . . . . . . . . . . . . . . . . . . . . . . . . 26
Aiming Zhou (CEFPF), Andreas Zahner (REEEP), Angela Churie Ann Gardiner (Ecofys), Byron Chiliquinga (Olade), Curt Garrigan 4.3.3 The Philippines: Mapping opportunity and
Kallhauge (IRENA), Denis Rugege (Rwanda), Esther Wang’ombe (UNEP-SBCI), Dan Hamza-Goodacre (Climateworks), Emanuela reducing investor risk:
(Kenya), Eva Oberender (REEEP), Fatuma Mohamed Hussain (Kenya), Menichetti (OME), Emma Strong (UK Green Investment Bank), the Wind Energy Resource Atlas. . . . . . . . . . . . . . . . . . 28
Felix Bernabel Badillo (Peru), Gisele Umuhumuza (Rwanda), Greet Fabio Garcia (Olade), Frederic Gagnon-Lebrun (IISD), George 4.3.4 Kenya: Fine-tuning a feed-in-tariff for
Janssens-Maenhout (European Commission), Gunnar Wegner Kamiya (IEA), Hassan Abaach (OME), Jorge Asturias (Olade), Jorge renewable energy. . . . . . . . . . . . . . . . . . . . . . . . . . . . . . . . . 30
(EnDev), Gunter Fischer (GEEREF), Jiwan Acharya (CEFPF), Joeri Barrigh (Adap-T), Jorgen Villy Fenhann (UNEP DTU), Jyoti Painuly 4.3.5 Peru: Using innovative financing to drive
Rogelj (IIASA), John Tkacik (REEEP), Jorge Voto-Bernales (Peru), (UNEP DTU), Ketil Flugsrud (Norwegian Environment Agency), rural electrification. . . . . . . . . . . . . . . . . . . . . . . . . . . . . . . 32
Joy Goco (the Philippines), Juan Pedro Searle (Chile), Jyoti Painuly K.E.L. Morales (ECN), Ksenia Petrichenko (C2E2), Michel den Elzen
(SE4All), Martin Hiller (REEEP), Mario Marasigan (the Philippines), (PBL Netherlands Environmental Assessment Agency), Pablo
Nicola Borregaard (Chile), Omedi Moses Jura (Kenya), Patricio Bofill Garces (Olade), Pankaj Bhatia (WRI), Peter Wooders (IISD), Sandra Appendix I: RE and EE targets in developing countries. . . . . . . . 55
Escudero (Chile), Patrick Aquino (the Philippines), Patrick Blake Khananusit (ICFI), Steve Thorne (AfDB), Tom Baumann (GHG Appendix II: Reductions per project. . . . . . . . . . . . . . . . . . . . . . . . . . . . 60
(En.lighten, United for Efficiency), Quinn Refimesser (REEEP), Management Institute), Yuko Nagata (UNIDO)
Rosa Luisa Ebentreich Aguilar (Peru), Rose Mukankomeje (Rwanda), Glossary . . . . . . . . . . . . . . . . . . . . . . . . . . . . . . . . . . . . . . . . . . . . . . . . . . . . . . . . 67
Ruud Kempener (IRENA), Thibaud Voita (SE4All) Impressum. . . . . . . . . . . . . . . . . . . . . . . . . . . . . . . . . . . . . . . . . . . . . . . . . . . . . . 67
Sources. . . . . . . . . . . . . . . . . . . . . . . . . . . . . . . . . . . . . . . . . . . . . . . . . . . . . . . . . 68
Acronyms. . . . . . . . . . . . . . . . . . . . . . . . . . . . . . . . . . . . . . . . . . . . . . . . . . . . . . . 73
4 5
FOREWORD                                                                                                                       KEY FINDINGS
    Many countries have put in place renewable energy and energy efficiency initiatives, but most of them do not measure,          ENERGY EFFICIENCY AND RENEWABLE ENERGY ACTIVITIES IN DEVELOPING COUNTRIES IN THE LAST 10 YEARS
    report or receive acknowledgement for the resulting reductions in greenhouse gas emissions. Yet these reductions could
                                                                                                                                   WILL SIGNIFICANTLY REDUCE CO2 EMISSIONS FROM ENERGY USE BY 2020. This inaugural report of the
    add up to 1 gigaton per year by 2020, which would help close the emissions gap of 8 – 10 gigatons of carbon dioxide
                                                                                                                                   1 Gigaton Coalition is a first effort to assess how various renewable energy and energy efficiency initiatives
    equivalents that must be filled if we are to stay below the politically agreed target of 2°C.
                                                                                                                                   contribute to narrowing the 2020 emissions gap. This report surveys a sample of these activities to establish
    Initiated by the Government of Norway and coordinated by the United Nations Environment Programme, the 1 Gigaton
                                                                                                                                   a foundation of available information to measure and report greenhouse gas emission savings. It estimates,
    Coalition aims to make these savings visible by measuring emissions reductions, reporting successes and strengthening
    the case for a global scaling up of energy efficiency policies and renewable energy technologies.                              based on a sample of projects analyzed, that CO2 emissions could be reduced by 1.7GtCO2 a year by 2020.

    This first report comes in the critical window between the agreement of the 2030 Agenda for Sustainable Development
    and final negotiations on climate change at COP21. As well as examining the challenges of attributing reductions to            ATTRIBUTING EMISSION REDUCTIONS TO SPECIFIC ACTORS IS CHALLENGING, AS MANY ACTORS OFTEN
    individual actions, it provides an overview of energy efficiency and renewable energy activities in developing countries       CONTRIBUTE TO THE SAME PROJECTS. Overlaps between national activities, and bilateral, multilateral and
    and uses case studies to illustrate their impact on current emission levels.                                                   partner initiatives that collaborate to support renewable energy and energy efficiency projects in developing
    While this report clearly demonstrates significant benefits of renewable energy and energy efficiency in developing            countries make it very difficult to disentangle which emissions reductions should be attributed to individual
    countries, it also highlights untapped potential gains, which the Coalition aims to describe more fully in future reports.     actors.
    For example, REN21’s Global Status Report 2015 states that 164 countries have defined renewable energy targets in 2015,
    including 131 developing and emerging economies, meaning developing countries have a great capacity to contribute to
    emissions reductions. The extent to which this is being realized is of more than academic interest. Good examples and
                                                                                                                                   THERE IS INSUFFICIENT DATA AND NO COMMON METHODOLOGY TO QUANTIFY THE REDUCTIONS. This gap makes
    positive stories about renewable energy and energy efficiency are motivating more and more countries to take action.           it challenging to aggregate or compare GHG mitigation contributions between different actors. This report

    Bilateral and multilateral initiatives are making a big impact on narrowing the emissions gap, so the 1 Gigaton Coalition      outlines some suggestions on how to improve the reporting practices of renewable energy and energy
    will continue to work with its partners to improve data collection and develop a unified measurement and reporting             efficiency projects to better quantify their emissions’ savings.
    methodology that is aligned with IPCC and UNFCCC requirements. It will also continue to publish annual reports for
    use within the UNFCCC and the SE4ALL frameworks, and to provide a respected platform for countries to promote their            THE 1.7 GIGATON IS AN INITIAL ESTIMATE OF WHAT COULD BE ACHIEVED. Emissions savings to be achieved in
    emission reduction efforts and achievements in the energy sector.
                                                                                                                                   2020 could be higher than this initial estimate if challenges related to data collection and methodology are
    We are pleased at how fast the 1 Gigaton Coalition is growing. Since the official launch at COP20 in Lima, about 100           addressed. These improvements would enable countries to quantify their achievements, motivating them to
    partners have joined or expressed their interest in joining. The success of the Coalition will clearly depend on the active
                                                                                                                                   increase their ambitions to support further renewable energy and energy efficiency activities.
    involvement of its partners and the effective coordination with other initiatives and programmes. Our shared objective
                                                                     is clear: to become a driving force in promoting enhanced
                                                                     action for a sustainable low-carbon and climate resilient     THE 1 GIGATON COALITION IS WORKING TO ADDRESS THESE CHALLENGES TO QUANTIFY THE FULL REDUCTIONS
                                                                     future.                                                       GENERATED BY ENERGY PROJECTS. The 1 Gigaton Coalition will collaborate with stakeholders to develop
                                                                    We would like to thank all those who have contributed to       solutions for quantifying emission reductions from renewable energy and energy efficiency initiatives through
                                                                    this first report. It is our hope that through such credible   the Coalition’s work plan for 2016 and beyond.
                                                                    reporting, the Coalition will continue to motivate donors,
                                                                    initiatives and countries to scale up their efforts and help
                                                                    narrow the emissions gap.

    H.E. Børge Brende               Achim Steiner
    Minister of Foreign Affairs     UN Under-Secretary-General
    Norway                          and UNEP Executive Director

6                                                                                                                                                                                                                                                   7
EXECUTIVE SUMMARY g
EXECUTIVE SUMMARY EE and RE activities which developing countries have committed to
implement by 2020, and which constitute current policy trajectory,
Where data is available, attributing mitigation contributions
to individual actors is difficult. Many factors contribute to mea-
could result in emission reductions in the order of 4GtCO2 compared surable GHG emission reductions, but these are not readily distilled
to the baseline scenario. However, there remains a significant gap in a single number that quantifies abatement in tons of carbon. An
between the current policy trajectory and what is needed to limit EE or RE program’s successful implementation often depends on
The 1 Gigaton Coalition supports efforts to measure and report plemented by national governments and the business sector with
global temperature rise to 2°C (Figure 1). In addition, full implemen- capacity-building efforts and on institutional, financing, and tech-
reductions of greenhouse gas (GHG) emissions resulting from international assistance lower CO2 emissions from energy use on the
tation of developing countries’ 2020 pledges going beyond the cur- nological support. These efforts can all contribute to mitigation, but
renewable energy (RE) and energy efficiency (EE) initiatives. order of 4 Gt CO2 by 2020 compared to baseline scenarios. This pres-
rent policy trajectory would lower projected emissions by roughly are often financed by separate partners. It is therefore difficult to
Emissions from energy use comprise two-thirds of global GHG ents the upper limit of the possible impact of implemented activities
another 1 GtCO2 by 2020. attribute emission reductions to specific actors in a particular proj-
emissions,1 and this sector is crucial for determining the future to reduce the emissions gap.
ect, as many projects contribute to the same action.
global climate trajectory. The 1 Gigaton Coalition’s objective is to
Various activities contribute to overall reductions – attribu- MITIGATION ACHIEVEMENTS REMAIN UNMEASURED
quantify RE and EE contributions to narrowing the emissions gap –
tion to individual actors is complex and challenging. Several AND UNREPORTED WORK TO IMPROVE THE REPORTING PRACTICES OF
the difference between 2020 emission levels consistent with stay-
activities that sometimes overlap contribute to the overall reduc- Collecting data on greenhouse gas mitigation in developing RENEWABLE ENERGY AND ENERGY EFFICIENCY PROJECTS
ing within the 2°C climate limit, and the emissions levels expected
tions. Programs were analyzed in this report to provide an overview countries resulting from RE and EE projects is challenging. IS NEEDED.
in that year if country pledges and commitments are met.
of the relative impact of different developing country RE and EE There are significant gaps in data on reduced GHG emissions from The 1 Gigaton Coalition could be instrumental in addressing
This inaugural report of the 1 Gigaton Coalition is a first step RE and EE initiatives. In many instances, impact estimates are not these reporting challenges. The findings in this report reveal
activities. Due to data and methodology challenges, this analysis is
to measuring and reporting how RE and EE programs contrib- matched with details on project methodologies and assumptions common challenges in measuring and reporting emissions reduc-
indicative rather than comprehensive.
ute to narrowing the 2020 emissions gap. Decision 1 of COP19
used to make these estimates. Overlaps in data among bilateral, tions, including insufficient data and lack of a unified methodology.
(Decision 1/CP.19) called for all countries to enhance mitigation ef- Forty-two bilaterally-supported RE and EE projects, which received
multilateral and partner initiatives that collaborate to support RE The 1 Gigaton Coalition works to solve these problems, through its
forts to 2020, which is a central motivation for this report’s focus on US $2.6 billion in financial assistance between 2005 and 2012, will
and EE projects in developing countries further complicate the pic- planned activities for 2016 and beyond (including reports, work-
RE and EE efforts in developing countries, many of which have been save 6 MtCO2e in 2020. This modest estimate represents a fraction of
ture. Bilateral aid agencies frequently contribute towards multilat- shops, and meetings), and by assisting developing countries work-
conducted in collaboration with bilateral and multilateral partners. the total number of RE and EE efforts that developing countries are
eral development banks, and partner initiatives are often collabora- ing to better quantify emissions reductions resulting from RE and
These efforts have not previously been quantified or assessed for undertaking. Accounting for all bilaterally supported projects, which
tions between governments, private sector organizations, and civil EE programs.
their contribution to global climate mitigation. This report reveals received a total of US $24 billion in financial support between 2005
society. Disentangling how emissions reductions should be attribut-
data gaps, overlaps and challenges stemming from a lack of unified and 2012, could potentially increase the estimated impact to 58 Mt- ed to specific actors is complex and problematic.
methodologies, all of which make it difficult to accurately estimate CO2e in 2020. Given that US $730 billion was invested in renewable
emissions reductions from a range of programs and initiatives. power and fuels in developing countries from 2004 – 2014,2 the 42
Figure 1: CO2 emissions from energy use in developing countries, under different scenarios.
Mitigation from RE and EE programs in developing countries projects represent less than one percent of global financial invest-
is substantial. Developing countries are investing in RE generation, ment, and the total impact could be as great as 1.7 GtCO2 /year.
particularly solar, wind, and hydropower, and improving EE in many Emissions from energy use
In addition to assessing the emissions reductions achieved through in developing countries (GtCO2/year) Aggregated
sectors, from lighting to industry. These investments have allowed impact of all
bilaterally supported RE and EE activities, the report surveys oth- Total
developing countries to achieve substantial RE and EE expansion, as energy efficiency
er emissions impacts reported by other implementing actors. Four 25 required and renewable
their economies grow and their energy demand increases. reductions
multilateral development banks report that their RE and EE activi- energy activities in
This inaugural report provides an analysis of developing coun- Baseline (gap) developing countries
ties could result in reductions of 1 Gt of CO2 per year, but a com-
tries’ overall RE and EE initiatives, as well as specific projects prehensive aggregation of their efforts is not possible at this time.
and case studies that detail their countries’ implementation of National governments in developing countries implementing EE and
EE and RE programs. The report is a first endeavor to understand: RE policies and programs have not consistently quantified emission
1) how developing countries are undertaking RE and EE programs; reduction impacts. A comprehensive analysis of all national efforts 20 Current policy
2) the targets and policies used to implement RE and EE projects; 3) has not been performed – the total would make a substantial con- trajectory
the range of partner institutions supporting these efforts; 4) how tribution to global emission mitigation figures. This report is a first
different actors are measuring the GHG emissions mitigation re- Approximation
endeavor to quantify the level of EE and RE projects in developing of 2020 Impact of selected
sulting from these RE and EE initiatives; and 5) the contribution of pledges bi-lateral activities
countries.
countries’ emissions reductions to global climate mitigation. RE and Impact of
EE activities in developing countries are conducted in partnership The aggregate emissions reductions resulting from EE and RE selected funds
with a range of bilateral, multilateral, and cooperative groups. This activities in developing countries make a substantial reduction 15
Indicative
report surveys a sample of these activities to establish a foundation in the 2020 greenhouse gas emissions gap. The gap between 2°C Impact of
+ 2°C selected national
of available information to measure and report the individual and the “no new policy” baseline (i.e., assuming no additional efforts) in compatible activities
path
total contributions of these efforts to global climate mitigation. developing countries and what is compatible with a 2°C trajectory is
significant (Figure 1) 3. Note that this figure relates only to emissions
ENERGY EFFICIENCY AND RENEWABLE ENERGY from energy use in developing countries, not all sectors and gas-
PROJECTS IN DEVELOPING COUNTRIES SUBSTANTIALLY es. The 2°C trajectory is indicative as it depends on how reduction 10
REDUCE GREENHOUSE GAS EMISSIONS. efforts are shared between sectors and countries. The 2°C range is 2012
Reductions are significant. A rough scenario comparison reveals an estimate based on scenarios that start emission reductions as of 2010 2015 2020
that the current level of EE and RE in developing countries im- 2010, which were used to originally define the 2020 emissions gap.
Source: 1 Gigaton Coalition
8 9
1 INTRODUCTION g

     Chapter 1
                    In the context of the COP21 in Paris, and the recently-approved Sustainable Development Goals, countries are in
                    a unique position in history to combat climate mitigation. Current 2020 climate pledges made through the Cancun
                    Agreement fall 8 – 10 gigatons short of the emission reductions needed to keep global temperature rise below

     INTRODUCTION
                    2°C. The United Nations Environment Programme’s (UNEP) annual Emissions Gap assessments have emphasized
                    the urgency needed to close the emissions gap4. The most recent Intergovernmental Panel on Climate Change (IPCC)
                    report5 points to low-carbon energy sources, especially renewable energy generation and increased energy
                    efficiency, as essential solutions for achieving emissions pathways that will keep global warming below the 2°C
                    threshold. It is difficult to overstate the importance of renewable energy development and energy efficiency
                    measures.

                    Renewable energy (RE) and energy efficiency (EE) programs in          work to fill this data gap by measuring and reporting GHG emis-
                    developing countries make significant contributions towards           sion reductions resulting from RE and EE initiatives. The Coali-
                    closing the GHG emissions gap. Many of these efforts occur            tion’s mission is to comprehensively assess government, private
                    in the energy sector, which accounts for roughly two-thirds of        sector, and multi-stakeholder emission reduction initiatives that
                    global GHG emissions.6 Developing countries are investing in re-      align with national pledges.
                    newable electricity generation, particularly through solar, wind,
                                                                                          As a first step, this inaugural report quantifies the reduced GHG
                    and hydropower, and tackling energy efficiency in a range of
                                                                                          emissions resulting from RE and EE initiatives and programs in
                    sectors, from lighting to industry. Insufficient data, however, has
                                                                                          developing countries. The analysis is a first step towards under-
                    thwarted previous attempts to quantify these initiatives’ contri-
                                                                                          standing RE and EE projects in developing countries’ total impact
                    bution toward meeting global mitigation goals.
                                                                                          and the role of bilateral, multilateral, and partner initiative aid
                    The 1 Gigaton Coalition supports platforms to measure and re-         in these efforts. Due to data scarcity (particularly on EE) and
                    port GHG emission reductions resulting from renewable energy          the wide variability in measuring and reporting mechanisms, this
                    and energy efficiency programs so that these contributions are        report limits its conclusions to the projects and initiatives in-
                    recognized and counted. The Coalition focuses on cooperation          cluded in the analysis and does not suggest that these examples
                    between countries and on bringing developing countries’ im-           can be ascribed for all partner-supported RE and EE efforts in
                    pacts to light. This voluntary international framework focuses on     developing countries. To accomplish this level of attribution the
                    programs that are not fully understood due to a lack of quantifi-     methodology introduced in this report will need to be further
                    able information to assess their impact – these often overlooked      developed.
                    activities will save an estimated 1 GtCO2e by 2020.
                                                                                          This report is comprised of three main parts. First, the report
                    This report strives to document: 1) how developing countries          presents an overview of the methodological challenges to at-
                    are undertaking RE and EE efforts; 2) the range of targets and        tributing reductions to individual actors, whose work often
                    policies used to implement RE and EE projects; 3) the range of        overlaps (Chapter 3). It then assesses the impact that developing
                    partner institutions that support RE and EE efforts in developing     countries’ RE and EE efforts have had on these countries’ GHG
                    countries; 4) how different actors are measuring GHG emissions        emissions (Chapter 4). This analysis is followed by an overview of
                    mitigation impact resulting from these RE and EE initiatives;         developing countries’ RE and EE activities, based on a survey of
                    and 5) how these emissions reductions in developing countries         policies and targets from 62 countries (Chapter 5.1) and on five
                    contribute to global climate mitigation. This inaugural report        country case studies (Chapter 5.2). Finally, it analyzes the GHG
                    answers these questions through a high-level analysis of devel-       reductions of selected partner-supported activities that promote
                    oping countries’ overall RE and EE efforts, as well as an analy-      RE and EE in developing countries (Chapter 6). The report ends
                    sis of specific projects and case studies that explore developing     with recommendations for refining data collection and analysis
                    countries’ implementation of EE and RE programs.                      methods to assess these partnerships’ impact on RE and EE ef-
                                                                                          forts in developing countries.
                    With the aim of narrowing the emissions gap through emissions
                    reductions from the energy sector, the 1 Gigaton Coalition is a
                    voluntary international framework, launched at COP-20 in Lima
                    to build upon and intensify country efforts on climate miti-
                    gation to 2020, as specified in the COP19 decision (Decision/
                    CP.19 Further Advancing the Durban Platform). While RE and EE
                    programs’ impact in developing countries has been documented
                    anecdotally, most of their achievements either have not been
                    quantified or have been assessed using inconsistent and incom-
                    parable methods. The 1 Gigaton Coalition supports countries’

10                                                                                                                                                              11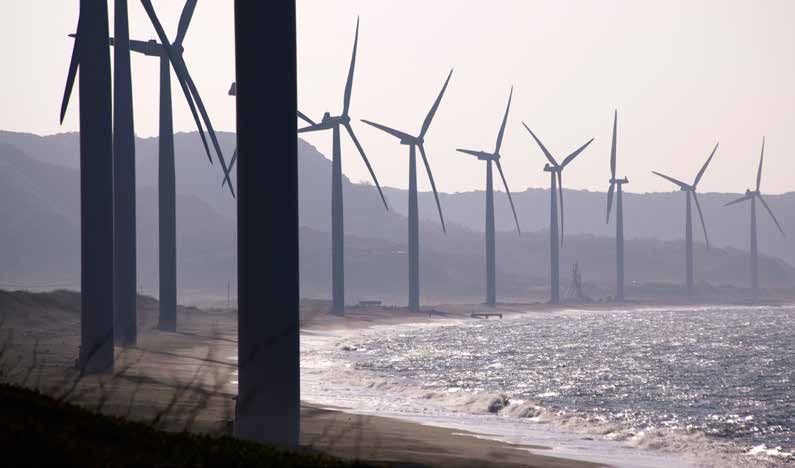
2 METHODOLOGICAL OVERVIEW AND CHALLENGES g

     Chapter 2
                               Attempts to estimate the emissions impact of renewable energy and energy efficiency measures in developing
                               countries encounter a number of challenges, including: overlaps in project reporting; the difficulties of creating
                               business-as-usual scenarios to measure policies against; a lack of publically-available information about

     METHODOLOGICAL OVERVIEW
                               renewable energy and energy efficiency projects; and un-harmonized data collection and reporting practices
                               among different project supporters and participants.

     AND CHALLENGES
                               Given these gaps, this report employs several strategies to assess renewable energy and energy efficiency
                               measures’ emissions impact. In Chapter 3, the report evaluates emissions reductions generated by all renewable
                               energy and energy efficiency activities in developing countries. Chapter 4 reviews broad trends in developing
                               country renewable energy and energy efficiency targets and policies. Five case studies of innovative renewable
                               energy and energy efficiency policies in developing countries help illustrate the strategies countries use to meet
                               these targets. Chapter 5 assesses the emissions mitigation reported by six country partners, the European
                               Commission, nine development banks, and seven initiatives.

                               Attempts to estimate the effects of renewable energy (RE) and       n   COUNTERFACTUAL DEVELOPMENT
                               energy efficiency (EE) measures on GHG emissions face several
                               challenges:
                                                                                                   To calculate emissions reductions, it is necessary to estimate
                                                                                                   what would have happened in the absence of bilateral, multilat-
                               n   OVERLAPS IN PROJECT REPORTING
                                                                                                   eral or partner collaborations on RE and EE projects. Such coun-
                                                                                                   terfactual development (i.e., what would have happened in the
                               It is not feasible to accurately attribute mitigation outcomes to   absence of such efforts) cannot be accurately determined due to
                               individual actors due to the cooperative and collective nature      the various assumptions involved in the quantification process.
                               of many RE and EE efforts and the vast field of actors working
                                                                                                   In most cases, partner countries face difficulties assessing the
                               to implement them. A wide range of actors supports RE and EE
                                                                                                   impact of their actions against the ‘business as usual’ scenario
                               initiatives in developing countries, often working in collabora-
                                                                                                   that would result had their activities not taken place (counter-
                               tion with each other. Efforts to implement RE and EE projects
                                                                                                   factual assessments). The Japan Bank for International Cooper-
                               often receive multilateral support from governments, develop-
                                                                                                   ation’s (JBIC) counterfactual evaluation of the Zafarana Wind
                               ment banks and funds, and from other organizations in public
                                                                                                   Power Plant Project provides an example of best practices and a
                               and private sectors.
                                                                                                   model for similar assessments.8
                               Disaggregating multilateral contributions is very difficult. The
                               Climate Investment Fund (CIF), for instance, works to mobilize
                                                                                                   n   DATA GAPS AND INCONSISTENCY
                               co-financing and to build policy support for climate projects.
                               CIF support is disbursed through multilateral development banks
                               (MDBs), making the separation of bilateral and multilateral         Data on many projects is not publicly available. Where data is
                               contributions to climate mitigation difficult to trace.7            available, inconsistent reporting makes it hard to collect infor-
                                                                                                   mation in a comparable manner.
                               These challenges are described in more detail in Chapter 6,
                                                                                                   Some projects provide reductions in terms of reduced GHG
                               Assumptions and Uncertainties.
                                                                                                   emissions, while others provide intermediate data, such as kilo-
                                                                                                   watt-hours (KWh) produced or saved or gigawatts (GW) of
                                                                                                   installed energy capacity. It requires further calculations to
                                                                                                   translate the intermediate data into GHG emissions mitigation
                                                                                                   and results may vary significantly based on assumptions (e.g.,
                                                                                                   emissions or capacity factors) involved in the calculations.
                                                                                                   Some bilateral, multilateral or partner initiatives provide an
                                                                                                   estimate for overall mitigation impact, but will not publish
                                                                                                   details on the calculation methodology employed, assumptions
                                                                                                   made, or implied uncertainties.
                                                                                                   Analyses adopt distinct assumptions when assessing greenhouse
                                                                                                   gas reductions. And in many instances, impact estimates are not
                                                                                                   given with comprehensive details on project methodologies and
                                                                                                   assumptions.

12                                                                                                                                                                     13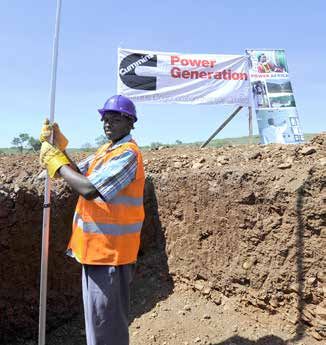
g    CHAPTER 2                                                                                                                                                       3 DEVELOPING COUNTRIES CONTRIBUTION g

                                                                                                                                                Chapter 3
     This report employed several strategies to overcome these            n   IMPACT OF SELECTED ACTIVITIES
     methodological challenges, all of which come with inherent
     advantages and disadvantages:                                        The report concludes by illustrating the potential for quan-

                                                                                                                                                DEVELOPING COUNTRIES’ ENERGY
                                                                          tifying RE and EE activities’ GHG reductions (R Chapter 5)
     n   OVERVIEW                                                         in developing countries. This chapter includes a review of the

                                                                                                                                                EFFICIENCY AND RENEWABLE ENERGY
                                                                          methodology used to calculate GHG emissions reductions. It ap-
     The report provides a broad picture of what GHG emission lev-        plies top-down assessments that draw from funder reports and
     els in developing countries would be without EE and RE initia-       self-reported estimates and bottom-up assessments that aggre-

                                                                                                                                                CONTRIBUTION TO GLOBAL GREENHOUSE
     tives driven by national governments with support from other         gate project-level data to understand RE and EE projects’ mit-
     countries, international funds and businesses (R Chapter 3). This    igation impacts in developing countries. This analysis suggests
                                                                          that the bottom-up methods yield a greater quantity of data,

                                                                                                                                                GAS EMISSION REDUCTIONS
     approach provides an overall estimate of RE and EE in develop-
     ing countries’ global impact without attempting to attribute the     as well as more reliable data, than top-town practices. Although
     reductions to any individual actor or projects.                      more onerous and time consuming, only a project-by-project
                                                                          analysis produced information that filtered quantifiable projects
                                                                          from those with only qualitative results (e.g., capacity building).
     n   SURVEY ON NATIONAL ACTIVITIES
                                                                          The bottom-up approach also provided details that enabled us
                                                                          to estimate an emissions impact if it was not directly reported
     The report describes developing countries’ EE and RE actions,        (e.g., kWh of power generated from a renewable energy project).
     based on a survey of targets and policies in over 120 countries
     (R Chapter 4.1). This analysis shows where developing countries
     have adopted RE and EE policies, targets and programs, high-         n   REVIEW OF ACCOUNTING METHODS
     lighting the strategies they are utilizing. Using data from the
     REN21 Renewables 2015 Global Status Report, as well as the           In R Chapter 6 an overview is provided of the different approaches
     REN21 survey conducted on EE for the 1 Gigaton Coalition.            that some international financial institutions have used to
     Chapter 4.1 provides a global picture of RE and EE activities in     measure their efforts’ GHG emission reductions.
     developing countries.

     n   COUNTRY CASE STUDIES

     Because data are still limited and incomplete, the report provides
     illustrative examples of EE and RE activities in five countries
     (R Chapter 4.2). These case studies give a narrative of specific
     projects and innovations developing countries are undertaking
     to increase energy efficiency and renewable energy. They are
     quantified to the greatest feasible extent, but the report does
     not attempt to measure their contribution to national or global
     mitigation goals.

14                                                                                                                                                                                                      15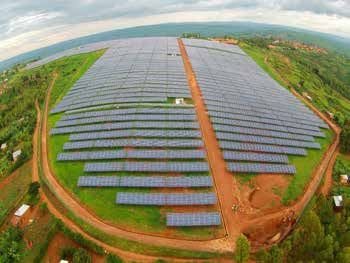
g CHAPTER 3 3 DEVELOPING COUNTRIES CONTRIBUTION g
The current level of energy efficiency (EE) and renewable energy (RE) activities by national governments and the The difference between the baseline and the current policy tra- The gap between the current policy trajectory and what is need-
business sector, along with efforts supported by international assistance, will lower CO2 emissions from energy jectory is an achieved emissions reduction of approximately 4 ed to limit global temperature rise to 2°C is still wide (approx-
use in developing countries substantially in 2020, compared to what emissions would otherwise have been. GtCO2e in 2020 with a full range of 0 to 6 GtCO2 (Figure 2). imately 10 GtCO2e in 2020 for all countries and all sectors and
Based on a comparison of the current trend in RE and EE rates with older no-policy reference scenarios from the roughly half this total for only energy use in developing coun-
EE and RE activities’ aggregate achieved reductions in develop-
IPCC database (the reference scenarios used in the 2015 UNEP Emissions Gap Report), the impact could be on tries14, Figure 2).
ing countries are substantial when compared to the total 2020
the order of 4 GtCO2 in 2020 (full range is 0 to 6 GtCO2). greenhouse gas emissions gap, i.e. the amount of emissions that The full implementation of developing countries’ 2020 pledges15
need to be reduced for a trajectory that is compatible with limit- would lower the projected emissions in 2020 by roughly 1 GtCO2
ing global temperature increase to 2°C or 1.5°C. The UNEP Emis- compared to the current policy trajectory.
This chapter provides a rough estimate of the realized aggregat- rapid developments. It is assumed that the additional produc- sions Gap Report 201411 states that gap between the no policy
EE and RE actions help developing countries implement their
ed GHG impact of energy efficiency (EE) and renewable energy tion capacity from renewables given by BNEF replace electricity baseline and what is compatible with 2°C12 for the global total
2020 pledges, and these efforts could even enable countries to
(RE) policies implemented in developing countries9 by comparing production by all fossil fuels by the same percentage without (not only developing countries, as above) and for all sectors (not
achieve emissions savings beyond their pledges, further narrow-
a current trends trajectory with a baseline. This quantification is altering the energy demand assumed by IEA. only for energy use, as above) is around 14 GtCO2e in 2020. This
ing the emissions gap.
not straightforward because it requires the calculation of what corresponds to a gap of around 9 GtCO2 when considering only
For the baseline, the report adopts the same approach as the energy use in developing countries13 (Figure 2). This report esti-
would have happened without these activities (the baseline). It
UNEP Emissions Gap Report series. It uses a range of scenarios, mates that EE and RE in developing countries has significantly
is relatively uncomplicated to estimate the expected emissions
which were collected for the IPCC Fifth Assessment Report. The narrowed this gap.
taking into account current activities. But determining what
scenarios are prepared with various models and employ many
emissions would have been without these initiatives requires ad-
assumptions, and therefore represent a wide range of possible
ditional assumptions. Developing countries also face challenges
outcomes. The main difference from the current policy trajecto-
of increasing energy access within their resources, which may
ry is that these scenarios do not include EE and RE policies and
increase GHG emissions.
activities that took place after 2005 and are therefore a good
The current trends trajectory includes all RE and EE policies im- comparison. The current policy trajectory may also include fuel
plemented in countries to date, and it uses the most recent trend switching from coal to gas, which would decrease emissions but
information. This approach is consistent with the definition of the is outside the scope of EE or RE and is assumed to have a small
“current policy trajectory” articulated in UNEP’s Emissions Gap effect. Finally, the baselines may use different assumptions on
Report 2015.10 The “current policy scenario” of the International economic growth, which would also manifest itself in differences
Figure 2: Contribution of EE and RE in developing countries to emission reductions from energy use.
Energy Agency’s World Energy Outlook of 2014 was used as the in emissions. This is assumed to have a small additional effect, as
basis. The more optimistic projections of renewable energy de- most of these scenarios already include the economic downturn
velopment in China, provided by Bloomberg New Energy Finance of 2008 and because the scenarios cover a wide range of models Emissions from energy use
in developing countries (GtCO2/year) Aggregated
(BNEF), were added to this scenario to take into account current and therefore a wide range of possible future economic growth. impact of all
Total energy efficiency
25 required and renewable
reductions energy activities in
Baseline (gap) developing countries
20 Current policy
trajectory
Approximation
of 2020 pledges
15
Indicative
+ 2°C
2°C
compatible
path
10
2012
2010 2015 2020
Source: 1 Gigaton Coalition
16 17
4 DEVELOPING COUNTRIES’ EFFORTS AND ACHIEVEMENTS g

     Chapter 4
                                       Developing countries have increased the ambition of their targets for both renewable energy and energy efficiency
                                       over the last decade, during a time when both the global economy and energy consumption have grown concurrently.
                                       Of the 164 countries that had established RE targets by mid-2015, 120 were developing countries. Nearly half

     DEVELOPING COUNTRIES’ EFFORTS
                                       (69 out of 150 countries) of developing countries with available data have both renewable energy and energy
                                       efficiency targets.

     AND ACHIEVEMENTS IN ENERGY
                                       Most energy efficiency targets are articulated in terms of energy savings or reductions in energy consumption,
                                       while most renewable energy targets relate to an increase in the share of renewables as a percentage of the

     EFFICIENCY AND RENEWABLE ENERGY
                                       overall energy mix, or in the installed capacity of a particular type of renewable technology.
                                       Five case studies of innovative renewable energy and energy efficiency programs in developing countries
                                       illustrate the strategies some developing countries are using to increase energy savings and expand renewable
                                       energy capacity.

                                       4.1      OBJECTIVES                                                       4.2  POLICY DEVELOPMENT IN EN-
                                                                                                                 ERGY EFFICIENCY AND RENEWABLE
                                       This chapter provides a high-level overview and deep-dive into the        ENERGY IN DEVELOPING COUNTRIES
                                       efforts of developing countries on renewable energy (RE) and energy
                                       efficiency (EE). Utilizing data collected from REN21, a multi-stake-
                                       holder global renewable energy and policy network, this report
                                                                                                                 In the past decade developing countries have rapidly expanded re-
                                       introduces a range of policies and targets many developing
                                                                                                                 newable energy (RE) and energy efficiency (EE) policies and targets,
                                       countries have adopted in the last few decades. The report also
                                                                                                                 as global energy consumption has increased and economic growth
                                       features illustrative efforts and achievements from five emerging
                                                                                                                 has taken off. Globally, 2014 saw a significant expansion in both
                                       economies: Chile, Peru, Rwanda, Kenya, and the Philippines. The
                                                                                                                 installed capacity and energy production, with renewable energy
                                       case studies provide representative examples of successful proj-
                                                                                                                 investments outpacing net investments in fossil fuel power plants.16
                                       ects that have led to measurable GHG mitigation in their respective
                                                                                                                 Renewable installed capacity, excluding hydropower, increased from
                                       locations.
                                                                                                                 560 GW in 2013 to 657 GW in 2014, with wind and solar the dom-
                                       These countries were selected based on their affiliation with the         inant sources.
                                       1 Gigaton Coalition, their leadership in pioneering ambitious and
                                                                                                                 This section characterizes the RE and EE targets and policies that
                                       innovative RE or EE programs, and their responsiveness to requests
                                                                                                                 have arisen in developing countries.
                                       for collaboration on this report. Areas of focus for each case study
                                       were determined based on independent research including coun-
                                       try representatives’ feedback on what programs would be most              4.2.1 TARGETS
                                       demonstrative. There are many other potential areas of focus, both
                                       within these countries and in other developing and emerging coun-         Targets for both renewable energy (RE) and energy efficiency (EE)
                                       tries. The case studies highlight the impacts and diversity of actions    have advanced over the last decade (Figure 3), helping to guide
                                       countries are taking to promote development through sustainable           policy creation and implementation. Of the 164 countries that had
                                       energy policies.                                                          established RE targets by mid-2015, 120 were developing countries.
                                                                                                                 While the majority of RE targets are related to electricity (Figure 4),
                                                                                                                 some developing countries have also adopted other RE targets that
                                                                                                                 have moved beyond the electricity sector.

                                                                                                                 China, Libya and Thailand all have illustrative examples of far-reach-
                                                                                                                 ing RE targets. China has RE targets, for instance, that address to-
                                                                                                                 tal final energy consumption, as well as heating and cooling and
                                                                                                                 transport. Libya has a RE target for total primary energy supply, and
                                                                                                                 Thailand has adopted RE targets for total final energy consumption,
                                                                                                                 electricity, heating and cooling, and transport. RE targets also have
                                                                                                                 taken many different forms, ranging from “simple government an-
                                                                                                                 nouncements to legally binding obligations with clear, quantifiable
                                                                                                                 metrics and specific compliance mechanisms.”17

18                                                                                                                                                                                         19
g CHAPTER 4.2.1 4 DEVELOPING COUNTRIES’ EFFORTS AND ACHIEVEMENTS g
Figure 3: Growth in renewable energy and energy efficiency targets from 2002 to 2015. Developing countries are increasingly adopting both EE and RE tar- Figure 5: Types of renewable energy targets adopted
gets. Nearly half (69 out of 150 countries) of developing countries by 110 developing countries.
with available data have targets for both RE and EE.
Number of
targets added EE Appliances/Equipment The data available to assess the adoption of RE and EE targets from Number of countries
30
EE Building 1975 to 2015 show a general increase in developing country activity, 110
EE Cross-sectoral with a peak occurring in 2013 (Figure 3). RE targets are focused 100
EE Electricity Generation
on the electricity sector, while EE targets apply to a range of sec-
EE Industry/Commerce
tors, from lighting to buildings to industry. Most EE targets in this
EE Lighting 80
25 dataset represent economy-wide, cross-sectoral goals. Targets are
EE Transport
found at multiple levels of government, from city and sub-national
RE Electricity 60
jurisdictions to regional and national levels, although for develop-
RE Final Energy
20 RE Heating/Cooling ing countries information on many EE targets are from the national
40
RE Primary Energy level. Some targets are legislated, while others are set by regulatory
agencies, ministries, or public officials. 20 22 20 27
20
15 Energy efficiency targets in developing countries span a broad
range of timelines, spatial coverage, and goals for efficiency gains. 0
Belize, for example, enacted a target to improve energy efficiency
Total Total Electricity Heating / Transport
by 1 percent per year from 2010 consumption levels by 2033. In Primary Primary Cooling
10 Energy Energy
2009, South Africa adopted a target to improve energy efficiency Supply Consump-
tion
by 12 percent by 2015. Botswana has adopted a target to make 100
percent of its lighting energy efficient by 2020. Many EE targets
5 are articulated in terms of energy savings or reductions in energy
consumption. Brazil, for instance, has a nationwide target to reduce
Data source: IRENA, 2015, REN21 Renewables 2015 Global Status Report
electricity consumption 10 percent by 2030.
0
2003 2005 2006 2007 2008 2009 2010 2011 2012 2013 2014 2015
Figure 6: Renewable electricity generation targets by target date and level of specificity.
Note that EE data was not available for 2015. Data source: REN21 Renewables 2015 Global Status Report and 1 Gigaton Coalition Survey. The categories specifying the increasing specificity, measurability, and binding character of RE targets is defined by
IRENA (2015) as 1) political announcements and vision statements; 2) energy strategies and scenarios;
3) detailed roadmaps and action plans; 4) legally binding renewable energy targets
Figure 4: Map of developing countries that have adopted only energy efficiency (EE) targets or
have both EE and renewable energy targets. Renewable Electricity Target
100%
Cook Island Iceland Costa Rica
Brazil
80%
60%
Burkina Faso Maledives Cape Verde Denmark
1 2 3 4
40%
Philippines China Mexico Germany
Saudi Arabia Turkey United Kingdom
Cuba Dominican Republic Italy
Japan Morocco
20%
Indonesia India Chile
Ukraine South Africa
0
Increasing specificity,
Developing countries with Renewable Energy Policies only Both 2020 - 2021 2023 - 2025 2030 - 2032 50 TWh 500 TWh measureability
Eneryg Efficiency Policies only No data and binding character
Data source: REN21 Renewables 2015 Global Status Report, 1 Gigaton Coalition Survey, and IRENA, 2015.18 Source: IRENA, 2015.
20 21g CHAPTER 4.2.2 4 DEVELOPING COUNTRIES’ EFFORTS AND ACHIEVEMENTS g
Most RE targets in developing countries set an increase in the share
4.2.2 POLICY INSTRUMENTS consumers to factor energy efficiency into their purchasing deci- above market price by the government, to make RE projects more
of renewables as a percentage of the overall energy mix, or in the sions. secure financial investments.22 (Premium payments can also be im-
installed capacity of a particular type of renewable technology. Al- plemented independent of FiTs). Egypt has FiTs for both solar and
Strong policy support for renewable energy (RE) and energy effi- Energy efficiency mandates or obligations target consumption
geria, for instance, has a target to generate 27 percent of its final wind power, while Malaysia has plans to introduce a FiT for geother-
ciency (EE) has contributed to growth in RE and improvements in EE patterns from a different angle, requiring consumers, suppliers,
electricity consumption from renewables by 2015. Gambia’s goal mal energy. Thailand also has implemented FiTs for rooftop solar PV
globally. Reductions in the cost of renewables, particularly for solar or generators of energy to meet a minimum and usually gradually
to generate 35 percent of its electricity from renewable sources installations. Biofuels mandates or obligations are another common
photovoltaic (PV) and wind power, have led to increases in trans- increasing, target for EE. These mandates often take the form of
by 2020 is on the more ambitious end of the targets reviewed. At RE policy for developing countries. These examples demonstrate
portation, electrification and heating applications. In developing energy efficiency portfolio standards (EEPS) and building codes or
the sub-national level, provinces and states are also undertaking the importance of economic and fiscal incentives to encourage the
countries, distributed renewable energy systems have the potential standards, which set minimum EE standards to guide the construc-
RE targets. The Guangdong province in China has set solar elec- growth of renewables in developing countries.
to facilitate countries’ transition to modern energy services.20 tion or retrofit of buildings and other structures.
tricity generation targets of 1 GW by 2015 and 4 GW by 2020. Not
all developing country RE targets, however, relate to solar or wind. Developing countries achieve their RE and EE targets in a variety of Energy audits analyze energy flows within an existing building,
India, for example, has set a target to generate 20 MW of electricity ways. The majority of EE policies fall into the “long-term strategic process or system, to identify ways to reduce energy use without
4.3
from waste-to-energy systems. To date, RE targets overwhelmingly planning” (Figure 6) category, which indicates a strategy to achieve negatively affecting outputs. Similarly, monitoring energy use helps
address the electricity sector; very few relate to other sectors, such energy savings of a specified period of time, includes specific goals establish a basis for energy management, both within the building SUCCESS STORIES
as transport or industry. and typically spans all major sectors. Botswana, for instance, has industry and in other sectors. Many countries also focus on increas-
implemented an energy efficiency strategy, while China has had a ing efficiency in transportation, often through vehicle fuel economy
The level of implementation of these RE and EE targets remains un-
national energy conservation law in place since 2008. standards, which specify the minimum fuel economy of automo- See following pages.
clear. Many countries do not regularly report information on their
biles to reduce energy consumption.
progress towards achieving these goals. Many developing countries, Efficiency targets comprise the second-most commonly used policy
moreover, do not give specific numeric targets and timelines. As tool for developing countries. Efficiency targets can be cross-sec- For RE policies, the most commonly used instruments are fiscal in-
illustrated in Figure 6, Cuba and Burkina Faso have relatively modest toral or sector-specific. In 2011, for example, Viet Nam identified centives (e.g., reductions in sales of non-RE energy, a value-added
goals in terms of RE electricity generation and are just beginning efficiency targets for the lighting sector, to be achieved by 2030. or other form of taxation; see Figure 5 for more details). Mali ex-
the process of determining the measurability, specificity and bind- Honduras implemented energy efficiency projects to target the in- empts solar panels, solar lamps, and other renewables from import
ing nature of their targets. In contrast, Chile and Costa Rica aim dustrial and business sectors in 2005. levies and duties. India also exempts off-grid rooftop solar PV from
to generate 100 percent of their electricity from renewable energy taxes. Most of these fiscal incentives use tax reductions or credits
Countries also often turn to standards and labelling programmes,
by 2023 and 2025 respectively. These goals include specific, mea- to encourage the adoption of renewable energy.
which enhance the efficiency of appliances and other products. In
surable and binding targets, similar to those of leading renewable
2014, 81 countries had implemented these kinds of programs.21 La- Many developing countries have also opted to introduce feed-in
electricity generation developed countries, including Denmark, Ger-
belling programs often target specific sectors, such as industry or tariffs or premium payments. Feed-in tariffs (FiTs) guarantee re-
many, the United Kingdom, and Italy.19
transport. Countries have implemented both voluntary and manda- newable energy producers a connection to the electric grid, often
tory versions of these labelling schemes in their efforts to enable through a long-term contract, and a premium payment rate set
Figure 7: Types of renewable energy policies for 69 developing countries Figure 8: Types of energy efficiency policies found in 62 developing countries.
Number of RE policies Number of EE policies
212
200 200
146 160
150 150 140 143
113 116
100 100
99 108
62 76
54 55 42 44
50
9 23 29 50
22 31
10 16
0 0
he n/
es
St nom l/
an y/
rd
r
C
g
m atio t
an n/
te
g
at qu c
/R a
PS
be y/
g
pa ctio y
ym n
t
St ectond
da l
s
g
da s
or gra al
s
re nt
te
n r
s
cr tax
its
Pla trat erm
g
Vi c
n
nv t ic
tm d
t
m atio ls
an n/
-in te
pa miu f/
Re yme m
nt
CO , en s in
ot2 , VA rgy,
r t or
es
an ra
he
tio t o
lig ea
en
en
rd
an de
rd
et
lig y tri
u g
n/ egi
ion ot
n
rin
lin
in
in
es an
sio
ion co ue
RE
lig ue
e f
c i en bl
, t
La tor
da
Sc atio
ba
da
da
m
ax
od er
pr ari
ed
iti
S ta
idy pi
he T
rg
er
er
ob H
Ot
St Co
ob ilit ec
les ion
e
uc en
bli em Pu
iss E le/F
S T
ito
ob Biof
pr En
bs Ca
ble
d
da
Ta
-t
et
nd
uc
ng
ut El
Au
lig
od m
g
on
sa uct
tm
an
ic
da
od
Te
in
cy
pr vest
Lo
Ob
h
M
M
ild
ed
d
Tra
ien
Pr
Ve
Ne
Pu cur
su
In
Bu
Fe
fic
o
pr
Em
Ef
Data source: REN21 Global Status Report, 2015. Data source: REN21, 1 Gt Coalition Survey, 2015.
22 23You can also read