Digital Commons @ Michigan Tech - Michigan Technological University
←
→
Page content transcription
If your browser does not render page correctly, please read the page content below
Michigan Technological University
                                                      Digital Commons @ Michigan Tech

Dissertations, Master's Theses and Master's Reports

2021

Blind Direct Walking Distance Judgment Research: A Best
Practices Guide
Crystal Massoglia
Michigan Technological University, camassog@mtu.edu

Copyright 2021 Crystal Massoglia

Recommended Citation
Massoglia, Crystal, "Blind Direct Walking Distance Judgment Research: A Best Practices Guide", Open
Access Master's Report, Michigan Technological University, 2021.
https://doi.org/10.37099/mtu.dc.etdr/1223

Follow this and additional works at: https://digitalcommons.mtu.edu/etdr
BLIND DIRECT WALKING DISTANCE JUDGMENT RESEARCH: A BEST
                    PRACTICES GUIDE

                                     By

                           Crystal A. Massoglia

                                A REPORT

    Submitted in partial fulfillment of the requirement for the degree of

                         MASTER OF SCIENCE

                           In Computer Science

             MICHIGAN TECHNOLOGICAL UNIVERSITY

                                    2021

                        c 2021 Crystal A. Massoglia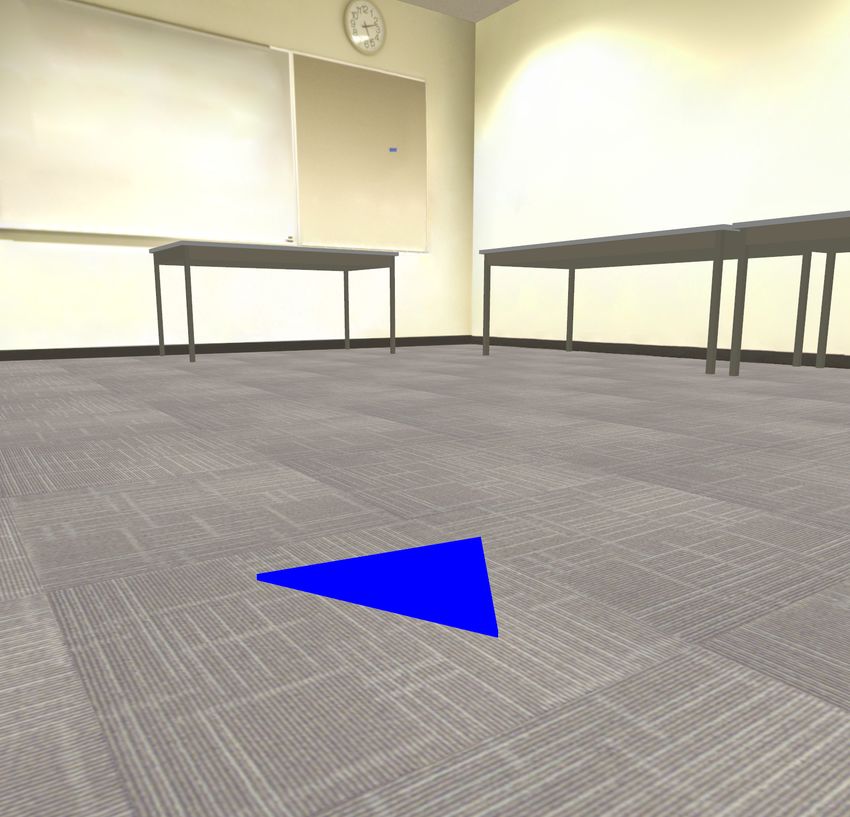
This report has been approved in partial fulfillment of the requirement for the Degree
of MASTER OF SCIENCE in Computer Science.

                                                   Department of Computer Science

                Report Advisor:        Dr. Scott Kuhl

            Committee Member:           Dr. Charles Wallace

            Committee Member:           Dr. Will Cantrell

              Department Chair:         Dr. Linda Ott
To my family.
Table of Contents
Contribution . . . . . . . . . . . . . . . . . . . . . . . . . . . . . . . . . . . . vi
Preface . . . . . . . . . . . . . . . . . . . . . . . . . . . . . . . . . . . . . . . vii
Abstract . . . . . . . . . . . . . . . . . . . . . . . . . . . . . . . . . . . . . . . viii
1 Introduction . . . . . . . . . . . . . . . . . . . . . . . . . . . . . . . . . . . 8
2 Why Blind Direct Walking? . . . . . . . . . . . . . . . . . . . . . . . . . . 9
3 Experimental Design Decisions . . . . . . . . . . . . . . . . . . . . . . . . 12
3.1 Experimental Conditions . . . . . . . . . . . . . . . . . . . . . . . . . 12
3.2 Design Structure . . . . . . . . . . . . . . . . . . . . . . . . . . . . . 12
4 Experimental Design Components . . . . . . . . . . . . . . . . . . . . . . . 14
4.1 Experimental Location . . . . . . . . . . . . . . . . . . . . . . . . . . 14
4.1.1 Real . . . . . . . . . . . . . . . . . . . . . . . . . . . . . . . . 14
4.1.2 Virtual . . . . . . . . . . . . . . . . . . . . . . . . . . . . . . . 15
4.1.3 Pre-Experiment . . . . . . . . . . . . . . . . . . . . . . . . . . 17
4.2 Hardware . . . . . . . . . . . . . . . . . . . . . . . . . . . . . . . . . 18
4.2.1 HMD . . . . . . . . . . . . . . . . . . . . . . . . . . . . . . . . 18
4.2.2 Tracking System . . . . . . . . . . . . . . . . . . . . . . . . . 21
4.2.3 Calibration . . . . . . . . . . . . . . . . . . . . . . . . . . . . 23
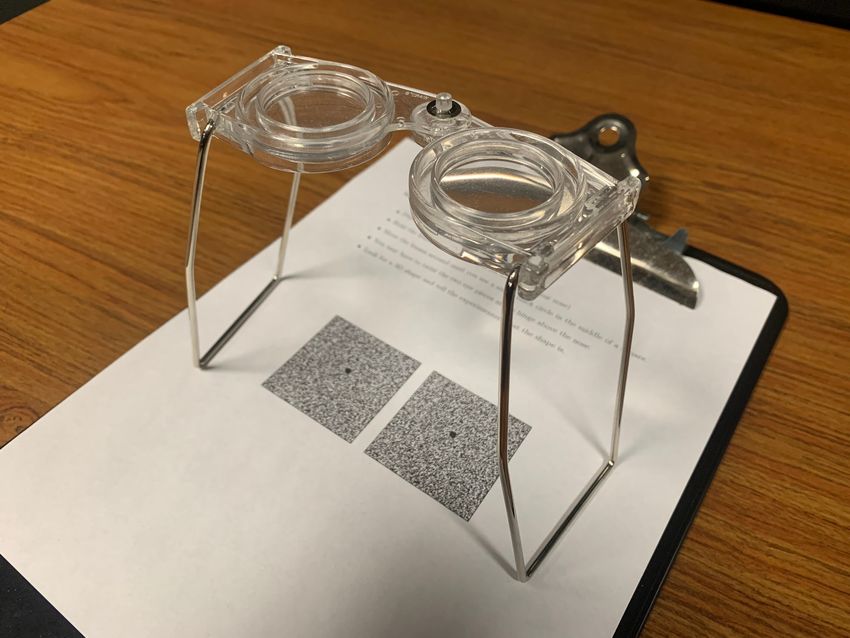
4.2.4 Masking Noise . . . . . . . . . . . . . . . . . . . . . . . . . . . 26
4.2.5 Communication . . . . . . . . . . . . . . . . . . . . . . . . . . 28
4.3 Avatars . . . . . . . . . . . . . . . . . . . . . . . . . . . . . . . . . . 28
4.4 Targets and Distances . . . . . . . . . . . . . . . . . . . . . . . . . . 29
5 Experimental Design Procedures . . . . . . . . . . . . . . . . . . . . . . . 33
5.1 Positioning and Measurement . . . . . . . . . . . . . . . . . . . . . . 33
5.1.1 Initial Position . . . . . . . . . . . . . . . . . . . . . . . . . . 33
5.1.2 Measurement . . . . . . . . . . . . . . . . . . . . . . . . . . . 35
5.2 Participants . . . . . . . . . . . . . . . . . . . . . . . . . . . . . . . . 37
5.3 Safety and Cleanliness Procedures . . . . . . . . . . . . . . . . . . . . 41
6 Pre-Experiment Procedures . . . . . . . . . . . . . . . . . . . . . . . . . . 44
6.1 Consent Forms . . . . . . . . . . . . . . . . . . . . . . . . . . . . . . 44
6.2 Instructions . . . . . . . . . . . . . . . . . . . . . . . . . . . . . . . . 45
6.3 Pre-Questionnaires . . . . . . . . . . . . . . . . . . . . . . . . . . . . 46
6.4 Putting on Wearables . . . . . . . . . . . . . . . . . . . . . . . . . . . 47
6.5 Practice Blind Walking . . . . . . . . . . . . . . . . . . . . . . . . . . 47
47 During Experiment Procedures . . . . . . . . . . . . . . . . . . . . . . . . 50
7.1 Other Helpful Procedures . . . . . . . . . . . . . . . . . . . . . . . . 50
7.2 Real-World Comparison . . . . . . . . . . . . . . . . . . . . . . . . . 51
7.3 Return to the Initial Position . . . . . . . . . . . . . . . . . . . . . . 54
8 Feedback . . . . . . . . . . . . . . . . . . . . . . . . . . . . . . . . . . . . . 55
9 After Experiment Procedures . . . . . . . . . . . . . . . . . . . . . . . . . 56
9.1 Post-Questionnaires . . . . . . . . . . . . . . . . . . . . . . . . . . . . 56
9.2 Transfer Effects and Debriefing . . . . . . . . . . . . . . . . . . . . . 57
9.3 Reporting Results . . . . . . . . . . . . . . . . . . . . . . . . . . . . . 58
10 Conclusions . . . . . . . . . . . . . . . . . . . . . . . . . . . . . . . . . . . 58
11 References . . . . . . . . . . . . . . . . . . . . . . . . . . . . . . . . . . . . 59
Appendix A. Checklist . . . . . . . . . . . . . . . . . . . . . . . . . . . . . . . 67
5Contribution
The idea and general outline for my report was collaboratively developed by myself
and my advisor, Dr. Kuhl. I surveyed the existing literature on distance judgment
research in VR, organized the information, and drafted my report. Dr. Kuhl and I
collaboratively edited and improved my report.
6Preface
Prior to the COVID-19 pandemic outbreak, this report was originally Distance Judg-
ments on Shallow Slopes in Real and Virtual Environments. For this research topic,
I was going to investigate the differences, if any, in how people judge distances on
a shallow slope in a real environment and a replica virtual environment. The slope
was located on the second floor of the SDC building and had an incline of around
three degrees. Unfortunately, the pandemic struck and the school closed part way
through this project. Since I planned on graduating in Fall 2020 and the school was
not going to reopen or allow in-person human subjects research in the foreseeable
future, with the help of my advisor, Dr. Kuhl, I changed my project to Blind Direct
Walking Distance Judgment Research: A Best Practices Guide. Here, I present a
review of past research pertaining to distance perception, particularly experiments
using blind direct walking. Using this and Dr. Kuhl’s laboratory procedures as evi-
dence, I wrote up a research procedures guide aimed at new researchers conducting
blind direct walking distance judgment experiments.
7Abstract
Over the last 30 years, Virtual Reality (VR) research has shown that distance per-
ception in VR is compressed as compared to the real world. The full reason for this
is yet unknown. Though many experiments have been run to study the underlying
reasons for this compression, often with similar procedures, the experimental details
either show significant variation between experiments or go unreported. This makes
it difficult to accurately repeat or compare experiments, as well as negatively impacts
new researchers trying to learn and follow current best practices. In this paper, we
present a review of past research and things that are typically left unreported. Using
this and the practices of my advisor as evidence, we suggest a standard to assist
researchers in performing quality research pertaining to blind direct walking distance
judgments in VR.
1 Introduction
Virtual reality (VR) has proven to be useful for many things, including research,
entertainment, training, and engineering. For example, VR may be used to model
a true-scale building or mine for future real-world implementation. However, if a
supporting structure is placed at an incorrect distance relative to neighboring sup-
porting structures, the real-world building or mine could collapse. Making virtual
environments that closely resemble real environments, including the ability to judge
distances, is therefore paramount. It is widely known that distances are accurately
estimated in real environments, but virtual environments tell a different story.
As nearly 30 years of past work has shown, distances are often compressed in VR.
The full reason for this is unknown. Past research has studied many things such as
eye height (Leyrer et al., 2011; Leyrer et al., 2015), physical qualities of vision such
as peripheral vision (Jones et al., 2011), field of view (FOV) and brightness in the
periphery (Li et al., 2016; Li et al., 2018; Li et al., 2015), and how participants are
allowed to view the environment (Lin et al., 2011a), the quality or type of the graphics
(Grechkin et al., 2010; Kunz et al., 2009; Thompson et al., 2004), the calibration of
the head-mounted display (HMD), the image (Kuhl et al., 2006; Kuhl et al., 2009;
Li et al., 2014; Li et al., 2015; Zhang et al., 2012), and the horizon line (Messing
and Durgin, 2005), the affects of avatars (Leyrer et al., 2011; Lin et al., 2011a; Lin
et al., 2011b; Ries et al., 2008), physical properties of the HMD (Buck et al., 2018;
Grechkin et al., 2010; Willemsen et al., 2004; Willemsen et al., 2009), environmental
context (at least in real environments) (Lappin et al., 2006; Witt et al., 2007) and
richness (Nguyen et al., 2011), and the effects of feedback (Mohler et al., 2006). Some
of these factors, such as FOV and brightness in the periphery (Li et al., 2016; Li et
al., 2018; Li et al., 2015; Lin et al., 2011a), have been shown to significantly affect
distance perception in VR but do not account for all of the observed compression.
8Other factors, such as the quality of the graphics (Grechkin et al., 2010; Kunz et
al., 2009), have not shown a significant effect on the observed compression, at least
for blind direct walking. Some factors, such as the physical properties of the HMD,
have shown inconclusive results; specifically Willemsen et al., (2004) and Grechkin
et al., (2010) have shown that this does significantly affect distance judgments while
Willemsen et al., (2009) and Buck et al., (2018) showed otherwise. This research and
the conclusions are detailed and summarized, at least up to the year 2013, in the
paper by Renner et al., (2013).
Much of this research lacks complete documentation of the procedures, such as hard-
ware calibration processes, the inclusion or exclusion of practice, given instructions,
and other procedural and practical details, used during the experiment. Excluding
such details, due to their perceived unimportance or inclusion expanding papers be-
yond page limits, makes it difficult to accurately reproduce or compare experiments.
However, if there was an agreed-upon standard, researchers could instead direct peo-
ple to the standard they followed rather than include detailed procedural sections in
publications.
The purpose of this paper is to give guidelines for all of the things that typically
go unreported. New researchers to the field may be unaware of some of the details
that established research laboratories regularly do but do not explicitly report. In a
sense, this is a “best practices guide” that suggests a standard by which to conduct,
specifically, blind direct walking experiments. We want to provide a guide so that all
researchers may perform quality research.
2 Why Blind Direct Walking?
Blind direct walking, illustrated in Figure 1, is when a participant is shown a target for
some amount of time, is blindfolded, and then attempts to walk to where she believes
the target was. This distance judgment method has a couple important advantages.
Figure 1: Blind direct walking is when a person looks at a target for some time,
puts on a blindfold, and attempts to walk to that target.
9First, it is performed in action space, or the space between two and thirty meters from
an observer (Cutting and Vishton, 1995). Some distance judgment research has been
done in personal space, or the space less than two meters from an observer, and in
vista space, the space beyond thirty meters from an observer (Cutting and Vishton,
1995). These different space-types are represented in Figure 2. Action space is the
Figure 2: These are the three different types of space coined by Cutting and Vishton,
(1995). Personal space is defined as the space less then two meters from a person.
Action space is defined as the space between two and 30 meters from a person. Vista
space is defined as the space beyond 30 meters from a person.
most commonly used space for distance judgment research, as well as for personal
gaming and entertainment purposes, which makes it well documented and relevant to
real life. Additionally, much past work has shown that egocentric distance judgments
are accurate up to 25 meters in real environments when blind direct walking was
employed (Renner et al., 2013), implying that it is a good measure of perception
of common real-world distances. Second, Renner et al., (2013) stated that it is the
most common and useful type of egocentric distance judgment method as it is easily
reproducible and simple to accomplish in HMDs. For these reasons, this paper focuses
on blind direct walking.
Despite the advantages blind direct walking has, there are some key disadvantages.
For instance, increased walking speed has shown to cause significant inaccuracies in
estimations (Renner et al., 2013). Cognitive influences, such as counting steps or cal-
culating the number of reference objects between the participant and the target, may
instead measure cognition rather than perception. Further, longer distances are diffi-
cult to accomplish due to limited laboratory space, cable length limitations, or other
technological or physical limitations, and participants could trip and fall on uneven
terrain. Fortunately, there are ways to reduce or eliminate these disadvantages.
Other types of distance judgment methods, which will be briefly discussed next, in-
clude verbal reports, blind triangulated walking, timed imagined walking, affordance
judgments, blind throwing, reaching, and perceptual matching tasks (Renner et al.,
2013). Starting with verbal reports, the participant states aloud the estimate of the
10distance between himself and the target. Philbeck and Loomis, (1997) showed that,
for real environments, both blind direct walking and verbal reports measure distance
perception in a proportionate way. However, significant concerns remain about what
verbal reports actually measure, the desired perception or the undesired cognition
(Renner et al., 2013). Further, people may not fully understand how long the dis-
tance unit, such as feet or meters, is and may default to measuring in round numbers.
This can be mitigated through the presentation of a reference measurement or en-
couraging rounding to a specific decimal length; though ideally, the participant should
not require any further hints or instructions. As mentioned, blind direct walking is
also susceptible to certain cognitive influences, but there are ways to avoid these in-
fluences. Thus, verbal reports are useful as an additional test to study perception
differences or when space is limited (Renner et al., 2013).
Figure 3 shows blind triangulated walking, where a participant views a target for
some amount of time, is blindfolded, walks obliquely to the target until told to stop,
then turns and either takes a few steps or points toward the target. The distance is
Figure 3: Blind triangulated walking is when a person looks at a target for some
time, puts on a blindfold, walks obliquely to the target until told to stop, turns, then
either takes a few steps or points toward the target.
calculated via triangle calculations. This method attempts to eliminate the potential
cognitive influences found in blind direct walking, can be done in a limited space,
and has been shown to be accurate up to 20 meters in real environments (Renner
et al., 2013). However, this method produces more variance in measurements than
blind direct walking (Renner et al., 2013) since it depends on the participant accu-
rately updating the location of the target relative to the walking path. If incorrectly
updated, the resulting slight deviation in desired turning angle would correspond to
a large error in distance and not accurately reflect the desired distance indication of
the participant.
The remaining methods are timed imagined walking, where a stationary participant
starts a stopwatch, imagines walking to a previously seen target, and stops the stop-
11watch when she imagines that he is standing on the target, blind throwing, where
a blindfolded participant throws an object to a previously seen target (Sahm et al.,
2005), perceptual matching tasks, where a participant uses a reference object to deter-
mine the size of or distance to some target object, reaching tasks, where a participant
places her finger or hand where a target was previously shown, and affordance judg-
ments, where a participant determines if an action is possible after being shown a
situation. Though these methods may be useful in small spaces, none of them are
frequently used (Renner et al., 2013). Further, each has its own key disadvantage. As
noted by Renner et al., (2013), some people may be better at imagining environmental
updating than others when imagining a walk, meaning that undesirable variables are
introduced in timed imagined walking; perceptual matching tasks may be less prone
to cognitive influences but are difficult to accomplish in VR since only memorized or
virtual reference objects may be used; reaching tasks are accurate in personal space
but are impractical in action space; affordance judgments are the least useful of all
methods and Renner et al., (2013) recommends against using them.
3 Experimental Design Decisions
3.1 Experimental Conditions
The most obvious and crucial consideration when setting up the experimental design is
the conditions of the research. This includes determining what exactly is being tested,
if a control or comparison needed, and the best way to accomplish the research. All
design and experimental decisions should be based on the conditions of the experiment
and what exactly is being tested. Though we intend this paper to help shorten
procedure sections, important deviations may require detailed explanations in the
final report.
3.2 Design Structure
Experiments often test a control condition and one or more other experimental condi-
tions, implying that participants must be split among the conditions in some unbiased
manner. There are three main experimental structures - within-subjects, between-
subjects, and a combination of within- and between-subjects techniques, which we
will call combo. Each presents significant advantages and disadvantages and is ap-
propriate for certain experimental types.
Charness et al., (2012) and Greenwald, (1976) define the within-subjects design as
the design structure in which all participants test under multiple or all conditions
of an experiment. They state that the main advantage of this design structure is
the statistical power it affords since many data points across all conditions may be
captured with fewer total participants. Further, all conditions have the same number
12of participants, which may aid in analysis and comparison. They also state that this
eliminates the need to randomly assign participants to conditions. However, there are
some serious disadvantages. Charness et al., (2012) and Greenwald, (1976) state that
participants who test many conditions may guess what is being tested for and alter
their behavior to reflect what they believe the experimenter desires or deliberately
make different choices based on previous trials. They add that some testing orders
may show this effect more significantly than other orders. Finally, they mention
that previous trials act as practice for subsequent trials, though they acknowledge
that allowing sufficient time to pass between conditions may help remedy this. Even
so, these disadvantages are severe enough that both Charness et al., (2012) and
Greenwald, (1976) recommend against the within-subjects design structure.
Charness et al., (2012) and Greenwald, (1976) define the between-subjects design
as the design structure in which each participant completes testing under only a
single condition. They state that the main advantage of this design is that it does
not expose data to the biases and carry-over effects present in the within-subjects
design. However, the between-subjects design structure still has some disadvantages.
Charness et al., (2012) state that more subjects are required to improve statistical
power since, by nature, this design only captures one data point per subject. They
add that this may create noisy data and miss important trends. Further, they mention
that this design structure requires that participants be randomly and evenly separated
among conditions as to not bias the results. These disadvantages are often minor
and easier to deal with than those for within-subjects designs. Due to this coupled
with the advantages presented, both Charness et al., (2012) and Greenwald, (1976)
recommend using the between-subjects design.
Charness et al., (2012) and Ziemer et al., (2009) define the combo design as the
design in which all possible permutations of conditions are generated, and participants
complete all conditions in one randomly assigned permutation order. This implies
that many data points per participant are possible with fewer subjects and statistical
power is high, just as for the within-subjects design, since all participants complete
all conditions, and the first condition tested from each permutation constitutes a
between-subjects experiment. Charness et al., (2012) recommends using the combo
design structure for experiments with a small number of conditions because there will
be a low number of total permutations. This design structure is impractical for a
large number of conditions because a very large number of participants is required in
order to sufficiently test all permutation orders.
For more about each design, as well as an analysis method for the combo design,
we refer the reader to Greenwald, (1976), Charness et al., (2012), and Erlebacher,
(1977). We generally use the between-subjects design due to the advantages stated
above. Ultimately, it is up to the experimenter to consider which design structure
will work best for the research project.
134 Experimental Design Components
4.1 Experimental Location
4.1.1 Real
As of the writing of this paper we cannot fully virtualize our bodies, so a real-world
environment (RE) is required to complete any experiments. A suitable RE supports
action space and any necessary equipment, which will be discussed next, as well as
a good initial real position, which will be discussed later. As blind direct walking
experiments are completed in action space, distances in some range between two and
30 meters must be supported. Moreover, though distances are compressed in VR,
some participants will overestimate when walking (Buck et al., 2018; Grechkin et al.,
2010), necessitating extra “safety meters.” If no safety meters are allotted, overes-
timating participants must be physically stopped by the experimenter, which may
cause them to become overly cautious for the remaining trials. Due to the cognitive
inconsistency, it is most conservative to throw this biased data out. Therefore, if
a good space is found but the distance between one well-defined edge of a space to
another well-defined edge, denoted wall-to-wall distance, is not long enough to allow
for safety meters, try using the distance from one well-defined corner of the space to
the opposite well-defined corner, denoted diagonal distance, since the diagonal of a
space is longer than the wall-to-wall distance.
Similarly, the space must be wide enough to account for possible veer. Though veer
seems to generally be unconcerning (Philbeck and Loomis, 1997), it is safest to take
extra precautions to avoid collisions. There are creative solutions to help participants
self-correct if the space is not physically wide enough, such as hanging a curtain one
meter away from a wall (Philbeck and Loomis, 1997) or increasing the volume of
the noise in the ear corresponding to the potential collision side (Grechkin et al.,
2010; Nguyen et al., 2008). To our knowledge, there are no studies detailing the
consequences of the use of self-correction methods. However, these methods still
suggest to the participant that he is walking incorrectly, which may exhibit the same
negative side effects detailed above. As such, the more cautious option is to use a
space that is physically wide enough and avoid using self-correction methods.
The ideal RE allows for setup and use of any necessary equipment, including HMDs,
tracking system parts, computers, measuring devices, and other equipment needed
during experiments. Further, since transporting equipment for every experiment is
impractical and may damage the equipment, the RE should have an on-site or nearby
storage location. Because of these requirements, the most ideal RE in terms of size
and reduced distractions may be unsuitable for virtual-world experiments, but it
could still be used for real-world experiments. In the case that two different REs are
used, it is most conservative to maximize consistency between the spaces to avoid
introducing undesirable variables in the experiments.
14There may be other factors that impact the choice of RE, including the amount of
light entering the space, time of day, temperature, ambient noise, amount of foot
or vehicle traffic, mechanical operations or failures, and many other things. All of
these factors may distract or perturb participants. Some things, such as window
glare, can be easily taken care of. Unfortunately, many of these things, such as the
temperature of the room and mechanical operations, are difficult to control. We
recommend addressing the problems that can be controlled, but otherwise, there is
not much that can be done.
4.1.2 Virtual
The virtual environment (VE) could simply be a modeled replica of the RE. This
would automatically make the VE long and wide enough, as well as provide maxi-
mum consistency between real-world and virtual-world tests, assuming a real-world
experiment will be done. Often, VEs are not replicas of the RE, so the type of VE
must be carefully considered. For starters, consider the terrain of the real location,
both the texture, such as slope and bumps, and the type, such as grass, gravel, or
tiles. Matching the terrain of the VE to that of the RE avoids confusing partici-
pants based on foot-feel and possibly enhances immersion. If experimental conditions
dictate otherwise, then matching at least the texture may help prevent injury. For
example, showing a participant a steep, gravel decline rather than a flat, gravel road
may cause the subject to trip if she forgets he is walking on a flat, grassy field.
Similarly to the RE, the VE should support at least the same action space range
as the RE, along with a few safety meters, so that the participant does not believe
she will run into a virtual obstacle. This is especially important if not using a size-
matched replica of the real space, which should already have enough room. Further,
we recommend modeling a space that could realistically exist. Wide open spaces,
such as infinite grassy planes, and spaces with a myriad of depth cues, objects, and
patterns are not common real-world places and could be overwhelming to participants.
Some spaces that could realistically exist include a standard classroom, a city block,
or a cabin. Additionally, though we recommend modeling spaces that could exist
in reality, they need not be photorealistic as the quality of the graphics does not
contribute to the observed compression when blind direct walking is used (Grechkin
et al., 2010; Kunz et al., 2009). As will be explained in Section 4.2.1, high-quality
models may be the most desirable anyway. However, since many research laboratories
may not have the time or ability to make realistic or high-quality models, publishing
any good models for use by other research laboratories would be helpful.
There may also be some special considerations that depend heavily on the context of
the research when deciding on the VE, such as the size of the VE versus the size of
the RE and nonpictorial, pictorial (Cutting and Vishton, 1995), and environmental
depth cues (Renner et al., 2013). To begin, a VE of a greater size than the RE has the
15advantage of assuaging participant concerns about running into virtual, and hence
perceived real, obstacles and improving confidence while walking blind. Further, size-
different VEs may not have a significant effect on distance estimates (Nguyen et al.,
2008). However, people may tend to overestimate distances if aspects of the VE, such
as familiar targets, are minified since familiar size cues dictate that smaller objects
imply longer distances (Nguyen et al., 2008). This should not be concerning if the
RE is long enough.
Cutting and Vishton, (1995) described nonpictorial depth cues as clues from our own
physicality that we use to determine distances, including accommodation, conver-
gence, and motion parallax. Since the eyes of a person must focus, or accommodate,
on the lenses of the HMD to view the image, but also converge on the perceived three
dimensional image, the conflicting accommodative and convergent senses may cause
visual discomfort (Hoffman et al., 2008; Kramida, 2016; Lambooij et al., 2009). Ad-
ditionally, the 24 hour study by Steinicke and Bruder, (2014) showed that prolonged
exposure to HMDs can make the accommodation sense appear to distort the image
and increase simulator sickness to unbearable levels after periods of motion. Though
there is research being done to help alleviate this problem (Kramida, 2016), cur-
rently only changes to the graphics can help reduce this sensory conflict, specifically
by introducing various reliable depth cues to decrease the influence of accommoda-
tion (Hoffman et al., 2008). Most research should not last long enough that sensory
conflicts become problematic.
Cutting and Vishton, (1995) described pictorial depth cues as distance clues resulting
from static objects in the environment and their positions relative to an observer
and other objects. These include occlusion, relative size and density, the angle of
declination, and aerial perspective; examples are shown in Figure 4. The more of
these objects that exist in the VE, the more complex the VE becomes. Nguyen
et al., (2011) found that participants appear to judge distances more accurately in
less complex environments, but due to potential biases in their test environment,
more research is needed to confirm these results. Contrarily, Renner et al., (2013)
summarized many past works that showed that complex environments with vertical
lines or regularly patterned floors garnered better results than simple, sparse, or
grassy environments. Considering that the quality of the graphics does not seem to
affect distance estimates for blind direct walking, the complexity or simplicity of the
environment may not be a breaking factor for research. As before, we recommend
using a space, including the pictorial depth cues, that could realistically exist.
Environmental context may affect distance perception (Lappin et al., 2006; Norman et
al., 2018; Witt et al., 2007). For instance, in a real-world bisection study by Lappin et
al., (2006), participants performed better in an open lawn (simple environment) than
a lobby (complex environment) or hallway (familiar size and linear perspective cues,
but a poor FOV). In contrast, Norman et al., (2018) found that both younger and
16(a) The closer car occludes the further (b) The closer set of flowers appears
away car. larger and farther apart than the further
set of flowers.
(c) The angle of declination.
(d) In aerial perspective, the further
mountains appear bluer and paler.
Figure 4: Examples of the pictorial depth cues as described by Cutting and Vishton,
(1995).
older adults perform better in indoor environments than outdoor. Witt et al., (2007)
showed that when targets were placed the same distance away from an observer,
the targets with empty space beyond them appeared closer than those with a wall
beyond them, but only if both types of targets were viewed. Though these were for
the real-world only and, to our knowledge, no similar virtual-world experiments have
taken place, these results imply that certain environmental depth cues may require
consideration.
4.1.3 Pre-Experiment
We normally perform all pre-experimental procedures, including completion of con-
sent forms, pre-screening procedures, instructions, pre-questionnaires, putting on
wearable items, and practice blind walking (see Section 6 for more), in a location
other than the main laboratory space. This could mean completing them in a dif-
ferent room, in the hallway outside of the main laboratory with the door shut, or in
another location entirely. We do this for two main reasons. First, subjects who view
the laboratory space before beginning experiments may get a sense of how large the
space actually is and their location in the space, which could bias results. Second, it
is common practice for experimenters to disallow participants from viewing the lab-
oratory space before virtual experiments. Since virtual participants do not view the
laboratory space before trials begin, neither should real participants for consistency.
174.2 Hardware
4.2.1 HMD
Several options for display hardware are available, including Display Walls, HMDs,
CAVE, stereoscopic desktop monitors, and BOOM2C (Renner et al., 2013). Due to
infrequency of use (Renner et al., 2013) and immobility, the CAVE, desktop monitors,
and BOOM2C will not be discussed here. Display Walls are made up of several tele-
vision screens or computer monitors put together to create a giant wall that displays
the virtual environment. One major advantage to having a wall of displays is the wide
FOV it affords, much larger than HMDs (Grechkin et al., 2010). Further, Display
Walls do not require observers to wear equipment, so this system allows observers fully
unencumbered and wireless motion, unlike wired HMDs. Additionally, these systems
can be sterescopic or not, depending on the type of screen used. Despite these advan-
tages, however, there are some major disadvantages. First, Display Walls are not as
widely used as HMDs (Renner et al., 2013), making reproducing experiments more
challenging. Display Walls must also be moved into place for viewing and removed for
every blind direct walking trial (Gaines and Kuhl, 2020). This adds an undesirable
time delay between viewing the targets and the start of the walk. Depending on the
size of the Display Wall, moving it alone or with only a few experimenters could be
dangerous, necessitating additional coordination in experiment time slots. Further,
Grechkin et al., (2010) noted that participants completing a timed imagined walking
task significantly underestimated distances for closer targets, indicating that they
may have been hyper-aware of the Display Wall. This suggests that Display Walls
may be more prone to immersion breaks. Moreover, implementing motion parallax is
difficult since participants must wear some head-tracking apparatus, and a separate
tracking system that is not blocked by the wall is required. Most importantly, the
size of the Display Wall is antagonistic to portability.
The most well-known and widely used (Renner et al., 2013) display hardware system
is the HMD, which is a helmet-like system worn on the head with lenses near the
eyes that present the virtual world to the user. Ideally, this system is “light-tight”
and does not allow light or other outside stimuli from entering the edges of the sys-
tem through gaps, ensuring a more immersive experience. This system has many
important advantages. One major advantage is that since HMDs are widely used in
research, reproducing and comparing experiments is easier. Further, many systems
are relatively cheap and easily available for research, training, and entertainment
purposes. Many manufacturers are currently creating wireless versions, meaning that
movement is less inhibited and less prone to tangling as compared to their wired coun-
terparts. Additionally, motion parallax and stereoscopic vision are easily achieved in
HMDs. Lastly, they are portable and often come with a tracking system built-in,
meaning that HMDs can be used in a variety of REs. Due to the importance of these
advantages, we recommend using a HMD to present the VE to participants.
18Despite these major advantages, HMDs still have several limitations, including the
accommodation convergence conflict, which was detailed in Section 4.1.2, a limited
FOV, possible light in the periphery, certain physical properties of the HMD, connect-
ing wires, graphics quality, motion parallax limitations, latency, and interpupillary
distance (IPD) capacities. Some of these have been shown to cause a significant ef-
fect on distance estimates, while others have not, and others may be mitigated or
eliminated entirely. Starting with the FOV, as illustrated in Figure 5 normal human
peripheral vision allows over a 200-degree FOV whereas HMDs provide a FOV of
between 60 degrees, in older models, and 110 degrees, in contemporary models. This
Figure 5: Humans have 200+ degrees of peripheral vision normally while HMDs
afford only 60 to 110 degrees of peripheral vision.
restriction has shown significant effects on distance estimates in VR (Li et al., 2016;
Li et al., 2018; Li et al., 2014; Li et al., 2015) and possibly the real world (Li et al.,
2015), though Creem-Regehr et al., (2005) found that a restricted FOV has no affect
on distance estimates if head movement is allowed. However, Li et al., (2014) and Li
et al., (2015) showed that a properly calibrated, wide-FOV HMD may allow partici-
pants to more accurately judge distances in VR without any further manipulations.
Further, peripheral light, such as from brightening the peripheral area of the display
(Li et al., 2018) or from light that leaks in through gaps between the HMD and the
face of the user (Jones et al., 2013; Jones et al., 2011), can affect distance estimates.
Blocking windows and turning the RE lights off helps mitigate light leakage. There
are cases where the HMD seal is good, but this may cause dry eyes (Steinicke and
Bruder, 2014). Fortunately, experiments often are short enough that this is not a
problem.
Since HMDs are placed on the head and require many electrical and optical compo-
nents, they exert excess force and differing moments of inertia on the head, as shown
in Figure 6, which may contribute to the compression seen in VR (Grechkin et al.,
2010; Willemsen et al., 2004), at least when coupled with the restricted FOV (Buck
et al., 2018; Willemsen et al., 2009). A lighter, more compact, or wireless system
may aid distance estimation. Currently, wireless HMDs are beginning to take the
spotlight. They boast enhanced maneuverability and safety due to the lack of wires,
which may improve immersion. On the other hand, wireless systems may be more
prone to network connection issues, which could be detrimental to presence in the
virtual environment. Gonçalves et al., (2020) showed that participants experienced
19Figure 6: The center of mass of the head while wearing a HMD is approximately
centered between left and right but is more forward than the normal human head.
similar levels of presence in both wired an wireless HMDs, but they did note some
important factors, such as a fear of tripping over wires and network instability, that
may require additional study. Further research on the differences between wired and
wireless HMDs may help draw more definitive conclusions.
Screen resolution in HMDs is lower than retinal resolution, meaning that, regardless
of the photorealism of the scene, the quality of the graphics viewed in HMDs is lower
than what our eyes are capable of seeing. Fortunately, past studies (Buck et al.,
2018; Grechkin et al., 2010; Kunz et al., 2009; Thompson et al., 2004) suggest that
the quality of the graphics does not affect distance judgments when blind direct or
triangulated walking is employed. There is a question, however, on how the graphics
quality influences the sense of presence in VEs. Zimmons and Panter, (2003) found
no significant effect of the quality of the graphics on the sense of presence in their
pit room VE citing that the sense of danger looking over a six meter pit may have
eclipsed the desired factor. Contrarily, Slater et al., (2009) did find that the quality
of graphics had a significant affect on the sense of presence in a similar pit room VE.
More research must be done on a wider variety of VEs to make further conclusions.
Since VR attempts to replicate reality, it may be most useful to use as realistic of
graphics as the modeler is capable of creating. Also, as mentioned, publishing good
models for use by other research laboratories would be helpful.
HMDs do allow for motion parallax, though depending on the setup, motion parallax
can be missing or distorted in VR, which is not necessarily a bad thing. According
to Cutting and Vishton, (1995), the effectiveness of motion parallax as a depth cue
decreases with distance. Additionally, Jones et al., (2008) showed that motion par-
allax does not contribute to the observed compression in VR. Since VR attempts to
replicate reality, the inclusion of motion parallax is desirable, but it is not necessarily
detrimental if it is distorted or missing all together.
Latency, or the time delay between when a person moves and when that motion ap-
pears in the display, can affect performance in VR (Ellis et al., 1999). Lower latency,
or shorter delay times, correspond to higher presence in the VE (Meehan et al., 2003).
20Since frames refresh at a fixed rate, which is around 80 Hz or better for contemporary
systems, motion delay times should ideally match the frame refresh rate, but some lag
in latency is acceptable. Latency lag of 15 ms, the average detectable latency differ-
ence threshold provided by Mania et al., (2004), or longer may necessitate additional
manual improvements to avoid performance degradation.
Finally, the IPD is often static in HMDs, but some HMDs do allow for adjustments.
Since the lenses are collimated, so long as the eyes are mostly centered, the user
should be able to see the image. Additionally, current evidence suggests that the
ability or disability to adjust the IPD of the HMD does not affect distance judgments
(Buck et al., 2018).
With all of the limitations and potential fixes detailed, and the fact that HMD tech-
nology is rapidly improving and has become cheaper and more widely available, which
HMD is the “best” for research? There are plenty of options when deciding which to
use. A study by Buck et al., (2018) compared several HMD systems and found that
newer, commercially available systems outperformed the older models. More specifi-
cally, their results showed that the weight of the HMD and the FOV likely contribute
to the observed compression in VR, but the screen resolution, IPD, and refresh rates
of HMDs likely do not. Though the specifications are an important factor, repro-
ducibility of experiments in research is arguably more important. The most effective
way to assure this is to use a popular system that is widely available and has good
specifications, even if not the “best” specifications.
4.2.2 Tracking System
The real world appears to move and change according to the position and orienta-
tion of an observer within it. If the displayed image is not a panorama or other
static image, the same should happen to the virtual world displayed in a HMD. The
tracking system monitors the movements and orientation of a user and sends that
data to the program, which will update the display image accordingly. Contempo-
rary HMDs come with a tracking system built into the headset, which holds two
major advantages. First, only one system is needed to both display and update the
image during an experiment. Second, the built-in tracking system will monitor the
real-world eye position of the participant. This is important because the eyes take in
visual information, so distance perception begins at the eyes. Therefore, any targets
should be placed or rendered their specified distance as measured from the eyes of the
participant, and the final position after the walk also corresponds to the eye position.
Measuring from and to the eye position is difficult in reality, so more about this will
be discussed in Section 5.1.2.
The major disadvantage to a built-in tracking system, demonstrated in Figure 7,
is that the tracking area is often too small to cover the required walking distance,
21so the final position of the participant cannot be automatically taken. Instead, the
Figure 7: The built-in tracking system of the HMD may be too small to track the
full walking distance.
experimenter could physically measure the distance the participant walked, which
presents its own difficulties that will be discussed in Section 5.1.2. Further, since
a participant is wearing a HMD, a tracking system would provide a more accurate
final location measurement. As such, a secondary tracking system, such as the wall-
mounted system represented in Figure 8a, used to monitor only position may be
employed. This separate tracking system will likely require the use of tracking dots,
(b) A visualization of how the tracking
dots may be placed on the HMD, as well
(a) A secondary tracking system
as the offset between the dots and the
mounted on a wall may cover the entire
eyes.
walked area.
Figure 8: A secondary tracking system may help with tracking the designated target
area, but extra tracking dots may need to be added to the outside of the HMD.
which, as shown in Figure 8b, are attached to the outside of the HMD and will
be offset from the eyes of the participant. This minor disadvantage is eliminated by
carefully calculating the offset between the position of the dots and the position of the
eyes. If the experimenter chooses to use a secondary tracking system, we recommend
using a system that will work best for the purposes of the research.
224.2.3 Calibration
It is important to properly calibrate the hardware used in an experiment. If factors
such as tracking system correctness, eye height, the horizon line, the optical lenses,
and the FOV are improperly calibrated, distorted images, deterioration of presence
in the virtual world, and avoidable inaccuracies in distance estimations may result.
For starters, to ensure that the tracking system is correct, first check the tracking
grid. The tracking grid is an invisible grid structure inside of which the tracking
system accurately monitors the position and orientation of the HMD. This grid will
have an origin and an orientation with respect to the room. Figure 9 represents a
tracking grid that is properly oriented and placed with respect to the room. When
(a) Front view. (b) Side view.
Figure 9: An example of correct alignment of the tracking grid with respect to the
room and floor.
the HMD is being worn by a user, the HMD should be some reasonable distance off of
the ground and the same everywhere in the tracked space. We check this by placing
the HMD at various predetermined heights in different locations within the tracking
grid. If the measured height is unreasonable, as it would be in either grid location in
Figure 10, or varies anywhere in the tracking grid, as it would in Figure 11b, then we
reposition the grid so that the height of the grid is as close to the ground plane as
possible. Further, if any position of the HMD with respect to the origin of the grid
(a) The height of the HMD will be neg- (b) The height of the HMD will be posi-
ative if below this grid. tive even if placed on the ground.
Figure 10: Examples of the tracking grid floating above and sinking below the floor.
is unexpected, as would be the case if the grid appeared as Figure 11a, we tweak the
position of the tracking area until it is properly aligned.
If a separate tracking system is required, calculate the offset between the tracking
dots and the eyes of the user. This is very important because the tracking system
23(a) The tracking grid is not aligned with
respect to the room.
(b) The tracking grid is not aligned with
respect to the floor.
Figure 11: Examples of how the tracking grid may be twisted with respect to the
direction it is expected to face.
will trace the markers rather than the eyes. For example, if the tracking system
markers are ten centimeters above the eyes, it could cause the software to render
the graphics as if the user were ten centimeters taller than he actually is, which, as
detailed below, is detrimental to distance estimates in VR (Leyrer et al., 2011; Leyrer
et al., 2015). In addition to this vertical error, similar errors can occur horizontally
or forward and backward in depth. This problem can be easily tested if the origin
of the tracked space is well-defined and known in the real world. First, imagine the
three-dimensional point in the HMD representing the bridge of the nose between
the eyes of a user. Then, set the HMD on the ground so that this point is directly
above the origin. Verify that an appropriate value with some small height above the
origin is obtained. If the system is properly calibrated, rotating the HMD 90 degrees
repeatedly should result in a similar position value from the tracking system after
each rotation.
It is important that the camera height in the virtual world be correct. If the camera
height is too high for a particular user in the virtual world, then the observer will view
the world as taller than she actually is and distances will be significantly shortened
(Leyrer et al., 2011; Leyrer et al., 2015). Curiously, Bian and Andersen, (2013)
found that a 1.1 meter increase in eye height in the real world expanded distance
judgments rather than shortened them. To our knowledge, this discrepancy has yet
to be addressed. Also in the virtual world, if the camera height is too low, then
the observer will view the world as shorter than he actually is and distances will be
significantly expanded during blind direct walking tasks (Leyrer et al., 2015). This
expansion is not seen for verbal reports (Leyrer et al., 2011), but since this paper
deals with blind direct walking, it is important that the height be correct. If the
tracking system is calibrated, the height value from the tracking system can be used.
In some cases, an experimenter may wish to measure the eye height of a user prior
to the experiment to verify that the eye height values from the tracking system are
accurate. To accurately measure eye height, first place a long piece of tape vertically
24on a real wall, as shown in Figure 12. Next, have the participant stand very close to
Figure 12: Have a participant stand close to a vertical piece of tape on the wall
with his head level, and place a line on the tape at her eye height.
the wall with normal posture and look straight ahead with her head level. Place a
pencil mark on the tape corresponding to the height of the center of the eyes. Measure
this height with a tape measure and compare to the height measured by the tracking
system.
The horizon line, if visible, should similarly be at a the eye height of a particular
person. For example, you can create an artificial horizon in a real room by measuring
the eye height of a user and placing a horizontal piece of tape on the walls at that
eye height. If the user then viewed a virtual scene in the HMD while standing up,
the virtual horizon should align with the artificial horizon in the real room. The
correctness of the horizon line is important for scenes that have few other available
depth cues, such as infinite grassy planes. We recommend avoiding such environments,
unless low-cue environments are being studied specifically, as they do not commonly
occur in real life. But if one will be used, we refer the reader to Messing and Durgin,
(2005) who provide a method to properly render a horizon line when it is impossible
to render an infinite plane in the software.
The pitch of the HMD was not found to be a contributor to the underestimation of
distances in VR (Kuhl et al., 2009), but we recommend that the pitch be properly
calibrated to ensure maximal accuracy and correctness of the image. Calibration of
the yaw and roll may also be important but, to our knowledge, have not been studied
in the distance judgment literature. This calibration is particularly important if an
orientation sensor will be attached onto the HMD and it is uncertain if the orientation
sensor and the optical axis of the HMD are aligned. If the orientation sensor is
integrated with a widely used consumer HMD, it is likely safe to assume that the
manufacturer has handled this calibration. Otherwise, we refer the reader to Kuhl
et al., (2009) who provide a full procedure to properly calibrate the pitch of the HMD.
The correction will be slightly different for different users, but most individual values
will hover around the averages.
25Pincushion distortion is when the image appears to bend inward toward the center of
the display, such as when pins are placed in a pincushion, and is most evident near the
edges of the image. According to Kuhl et al., (2009), pincushion distortion does not
contribute to the compression in VR, but they recommend correcting it anyway since
our eyes do not have this distortion during real vision, and correction will provide
a more realistic image. We refer the reader to Kuhl et al., (2009) for correction
details. The authors state that pincushion distortion must be corrected before the
FOV is calibrated, described next, since the distortion is nonlinear. However, most
modern consumer HMDs, such as the Oculus Rift or HTC Vive, come with software
development kits that automatically include pincushion distortion correction.
There are two FOV numbers that VR developers need to be aware of. The first is
the FOV used to render the graphics, which is sometimes called geometric FOV or
GFOV, and the second is the fixed FOV of the display device, denoted DFOV. It is
important that developers set the GFOV to match the DFOV. If the GFOV is smaller
or larger than the DFOV, the image will be minified or magnified, respectively (Kuhl
et al., 2006; Kuhl et al., 2009; Li et al., 2014; Li et al., 2015). We refer the reader
to Kuhl et al., (2009) who detail a method to calibrate the horizontal and vertical
FOV of the display and to Li et al., (2015) who provide a similar method of cali-
brating the horizontal FOV. The default FOV settings provided by manufacturers of
mass-produced consumer devices are likely correct. However, manufacturer supplied
DFOVs made by smaller manufacturers may be less reliable since they have fewer
users double-checking the values. In addition, confirming that the graphics rendered
on the screen are correct through a calibration process can help catch cases where a
programming mistake unintentionally changed the GFOV in a significant way.
Once the HMD is properly calibrated, make sure the program and tracking system
recognize the initial position and properly measure target distances. To do this,
choose a target and a distance (see Section 4.4 for more). Starting from the initial
real position (see Section 5.1.1), measure the distance in the RE and place the chosen
target on the ground. Stand with the eyes over the initial real position, and display
the VE in the HMD along with the corresponding target and distance. Repeatedly lift
and lower the HMD to view the real target and the virtual target, as shown in Figure
13. If the two targets do not align on the same position, recalibrate the tracking
system as necessary.
4.2.4 Masking Noise
Uninhibited auditory cues, such as echoes, footsteps, ventilation systems, or the voice
of the experimenter, may assist participants in localizing their position in the real
world. Though we found no studies about the benefits or drawbacks of drowning out
ambient noise, it is believed to be important to reduce or eliminate these cues through
the use of headphones with masking noise, noise-canceling headphones, ear plugs,
26Figure 13: Calibrate the virtual target distance by repeatedly lifting and lowering
the HMD and ensuring the real and corresponding virtual targets align. In this case,
the dotted ‘x’, or the remembered virtual target position, is not aligned with the real
target.
over-ear hearing protectors, or any other noise-blocking or noise-canceling apparatus.
We use headphones with some masking noise since they allow the participant to hear
verbal instructions and are easy to use during both virtual and real testing.
Many contemporary HMDs come with built-in headphones, making it easy to play any
noise file directly from the computer. If the HMD comes with built-in headphones,
using them is easiest since removing them is challenging and may break the headset.
However, some HMDs do not come with headphones, and real-world experiments
do not use HMDs. In these cases, we use a separate pair of headphones or noise-
canceling headphones that are either the over-ear or on-ear style. Ear buds could
also be used but may be difficult to clean between participants. If these separate
headphones are wired, they cannot be connected to the computer since they would
impede movement. Instead, connect wired headphones to a portable media player
playing the masking noise, which will then be clipped to the clothing or held in the
pocket of the participant. The wire may then be tied to the HMD wires, if applicable,
or moved in some way as to not distract the participant.
Each RE will have a unique ambient noise, so unless noise-canceling headphones are
practical and sufficiently mask the ambient noise, we recommend creating a unique
masking noise file that suits the RE. We find that white noise is a good starting
point. If this noise does not sufficiently block the ambient noise when played at a
comfortable volume, try other colors of noise, like brown noise or pink noise, and use
whichever one works best. Using the created masking noise file for all experiments,
real and virtual, will also help maximize consistency between experiments.
Some studies, such as Razzaque et al., (2001), programmed noise or instructions so
that it appeared to be coming from a radio within the virtual world in an attempt to
improve immersion. However, creating a realistic radio that properly interacts with
the VE is difficult, as is obtaining the same masking effect in the real world using a
real radio. Real-world experiments will still require headphones to make the masking
27effect consistent. Since headphones will be used in both types of experiments, playing
a masking noise without a radio seems to be the easiest approach.
4.2.5 Communication
Communicating with the participant during the testing phase is crucial for both the
success of the research and the safety of the participant. The headphones worn by
the participant for acoustic masking (see Section 4.2.4) can also be used to deliver
verbal instructions via a microphone. If the headphones are connected to the HMD,
then the microphone may be connected directly to the computer. Otherwise, the
microphone may need to be connected in some manner to the participant, meaning
the experimenter may have to walk around with the participant as to not hinder
movement. Alternatively, the experimenter could talk loudly enough so that the
participant can hear the experimenter over the masking noise. If the experimenter is
following the participant throughout the experiment, more on this in Section 5.3, the
participant will not be able to use the voice of the experimenter as a localizing cue.
This simple alternative also reduces wires, the number of things that can go wrong,
and microphone and volume setup time.
Other methods of communication exist, including playing prerecorded instructions
(Razzaque et al., 2001) or displaying text on the HMD screen (Steinicke et al., 2009).
These are as easy as pressing a key. However, these communication methods might
be insufficient to handle emergency or unforeseen circumstances. For example, an
experimenter may wish to remind the participant about a specific experiment in-
struction after he makes a mistake. Further, these communication methods, partic-
ularly displaying instructions to users, are infeasible during an analogous real-world
experiment.
4.3 Avatars
Participants are often encouraged to look around in the virtual environment when
viewing targets. This may include looking straight down to where a body should be.
Figure 14 illustrates three possible views. Looking straight down reveals the body
Figure 14: When looking down, the body of the person is viewed in the real world
while the body of an avatar, if used, is viewed in the virtual world (left). If no avatar is
used, then looking down in VR results in viewing nothing (center) or a collar (right),
if one is used.
of the person in the real world, but this is not true in VR. If an avatar, or virtual
28You can also read