Global Campus Innovations - Volume II - Curriculum Advances ETR-27 - World ...
←
→
Page content transcription
If your browser does not render page correctly, please read the page content below

WEATHER CLIMATE WATER

                        Global Campus Innovations

                        Volume II – Curriculum Advances

                        ETR-27
WEATHER CLIMATE WATER

                        Global Campus Innovations

                        Volume II – Curriculum Advances

                        ETR-27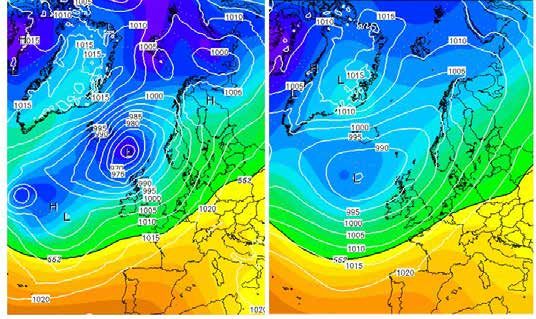
CONTENTS
Introduction ...................................................................................................... 2
Patrick Parrish

1. Approach to conducting a top-level learning needs analysis for the
   operational meteorology profession at the Met Office...........................................3
Anna Stones

2. Three paradoxical reasons to learn intuitive statistics in operational meteorology .... 9
Anders Persson

3.  Educational strategies to achieve global awareness of climate change and
    its impact.................................................................................................... 21
Rahul Chopra, Anita Nagarajan, Aparna Joshi, Nathalie Fomproix and
L.S. Shashidhara

4. Teaching programming to meteorology students with functional sections of code
   instead of traditional methods ........................................................................ 28
Marcial Garbanzo-Salas and Diana Jimenez-Robles

5. Aligning the teaching of computing across meteorology programmes ................... 37
Christopher E. Holloway and Andrew J. Charlton-Perez

6.  Education and training of personnel for the provision of meteorological services to
    civil aviation in the Russian Federation ............................................................ 41
Svetlana Bykova, Alla Yurova and Maria Mamaeva

7. Enhancing student learning through weather forecasting activities: The University
    of Reading approach ..................................................................................... 44
Peter Inness

8. Meteorology for the geography educator (pilot e-course) ................................... 49
Andrea Sealy, Rebecca Chewitt-Lucas, Kathy-Ann Caesar and David Farrell

9.  Aeronautical Continuing Professional Development (AeroCPD) course of
    the Caribbean Institute for Meteorology and Hydrology ...................................... 57
Kathy-Ann Caesar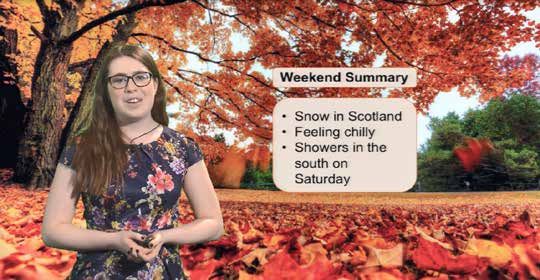
Introduction

Patrick Parrish

Our workplaces are changing. Whether you work in operations, administration or in
academia, you are facing rapid changes in what knowledge and skills are required to be
successful in your work. The audiences requiring a higher level of knowledge in the
sciences are also growing. This section describes several innovations in curricula, or in
how curricula are being designed and updated:

1.     Stones tells the story of an innovative needs assessment conducted to identify
       the needs of current and future operational meteorologists at the Met Office.

2.     Persson makes a strong case for using new arguments and methods in teaching
       “intuitive statistics”, background knowledge required for all forecasters who need
       to include information on uncertainty in their forecasts.

3.     Chopra et al. have developed a compelling strategy to offer resources for
       teaching elements of climate science across the curricula at secondary education
       and undergraduate levels in order to raise awareness of the challenges faced in a
       changing climate.

4.     Garbanzo-Salas and Jimenez-Robles describe an innovative way to teach critical
       programming skills focused on functional sections of code rather than
       programming languages.

5.     Holloway and Charlton-Perez also address the need to develop programming skills
       in higher education, introducing innovations to align and better integrate how
       programming is taught across the meteorology, climate and environmental
       physics curricula.

6.     Bykova et al. describe how a university collaborates with the labour market to
       design a curriculum that prepares students for faster integration into the aviation
       industry.

7.     Inness offers an engaging and practical programme to prepare students of
       meteorology for the communication tasks required of contemporary weather
       forecasters.

8.     Sealy et al. present their online programme designed to give geography
       educators in secondary schools some background knowledge in meteorology.

For a general introduction to the entire publication and to innovation processes, please
refer to Volume I.

                                            2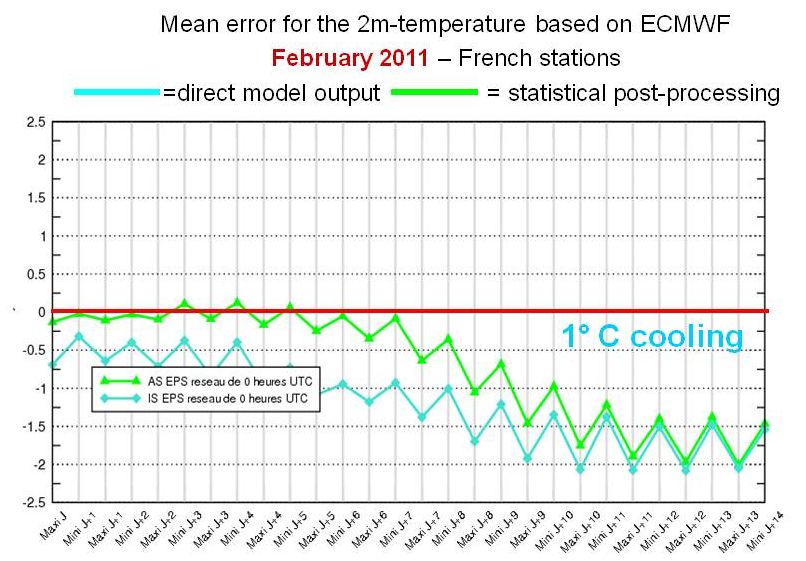
1. Approach to conducting a top-level learning needs analysis for the
   operational meteorology profession at the Met Office

Anna Stones, Met Office College, United Kingdom

Abstract

The Met Office is currently renewing its portfolio of Continuing Professional Development
(CPD) learning opportunities for operational meteorologists. As part of this project, we
identified a need to analyse the learning requirements of the profession, specifically
looking at projected future requirements of Met Office customers, new technology, and
the role of operational meteorologists relative to these. In the next five years, we expect
a continuing trend towards working alongside the customer and supporting the customer
in the interpretation and analysis of large datasets. As numerical weather prediction
(NWP) capabilities improve, there will be an increasing demand to extend forecast lead
times and better communicate uncertainties based on ensembles. In parallel to these
changing parameters, there exists a necessity to ensure our meteorologists maintain
expert meteorological knowledge to provide meaningful interpretation of data;
communicate background, context and impacts to customers; and maintain credibility.

To produce the analysis, we collected information from a range of sources, including
interviews with senior leadership to discuss the future direction of the organization, and
customer feedback to understand what we do well now and the customers’ perception of
what we could do better. A survey was sent to all operational meteorologists to assess
current gaps in the skills, knowledge and understanding from their point of view; the
survey response rate was approximately 50%. We analysed results from the senior
operational meteorologist promotion exams to find specific gaps in theoretical knowledge
and understanding. We collated and mapped this information against the existing skills
framework for the profession, giving increased priority to those areas deemed most
significant in the future, to identify those gaps best suited to be addressed by learning
interventions. This allowed us to write a set of top-level learning outcomes, which we
subsequently used to provide a prioritized structure for the development plan. The
learning consultants are working using an Agile approach, meaning that detailed learning
outcomes are developed with learner involvement as part of the design process to allow
flexibility during this time of change, both for the business and the profession.

Keywords: operational meteorology, profession, training, learning needs analysis, TNA,
professional development, CPD, e-learning

1.1        Introduction

The goal of this ongoing needs analysis is to provide sustainable access to resources for
the professional development of operational meteorologists (Op Mets) that enable the
delivery of the best possible services to customers. As with other meteorological
agencies, there are many changes currently in motion, both internally and externally.
Internally, we are working to improve the efficiency of our services, including reducing
the number of forecast products produced by Op Mets and improving the way we access
our data. Externally, people are changing how they learn, with an increasing number
accessing learning remotely and learning in bite-size chunks via apps on phones and
tablets. These changes are ongoing; hence it is vital that new resources are adaptable,
and that content can be clearly linked to its purpose through updates that are as simple
and focussed as possible.

                                             3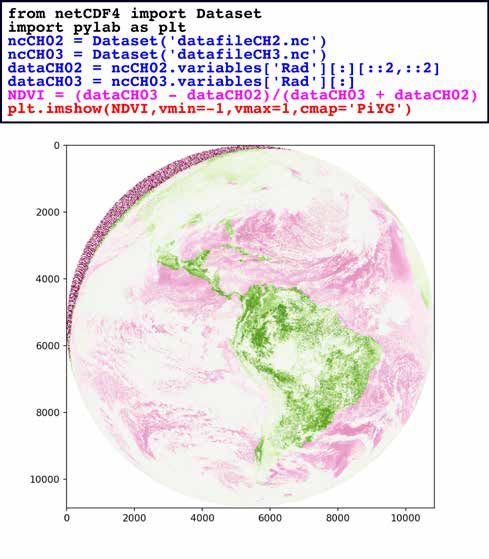
The intended outcome of this analysis is to create a set of prioritized learning outcomes
on which to base the design of the new portfolio of continuing professional development
(CPD) learning interventions. The learning outcomes should be direct and unambiguous,
directly relating to trends in data and taking into account the future needs of the
business. At this stage, it will also be useful to indicate anticipated relative time spent
developing learning material per unit of time spent learning. We will endeavour to spend
more time developing material for higher priority learning outcomes and less time on
those that are likely to become less important or expire over time. This information can
be derived from the same sources of data collected for this training needs analysis (TNA).
It will be important to consider business priorities and the rate of refresh (due to updates
in technology, such as remote sensing products), as well as the potential usefulness of
the learning intervention in five years’ time and beyond.

1.2         Methodology

As a baseline for the skills, knowledge and competencies required for the role, we
employed the Met Office Operational Meteorologist Skills Framework. This document
gives a description of the skills, knowledge and competencies required for the different
levels of operational meteorologist. At the UK Met Office (UKMO), these are Trainee Op
Met, Op Met, Senior Op Met, Expert Op Met and Principal Op Met. The framework is
broadly split into eight categories:

Skills        Description
Framework
Category

1             Meteorological Insight and Independence

2             Underpinning Meteorological and Technical Skills, Experience and
              Knowledge

3             Strategic Thinking

4             Leadership, Coaching and Mentoring

5             Communication

6             (Application of) Operational Systems

7             Operational Priority

8             Services and Customer Collaboration

Before use in this analysis, the framework was updated by the Head of the Op Met
Profession at (UKMO) to ensure it was up to date and fit for purpose.

The next step was for us to gather information from Op Mets, their managers, key
internal stakeholders and a range of customers. We then coordinated a team to collate
all the gaps in the skills, knowledge and competencies found in the various streams of
data, in line with the Skills Framework, in order to assess the combined size of the skills
gap. The information was sourced as follows:

                                             4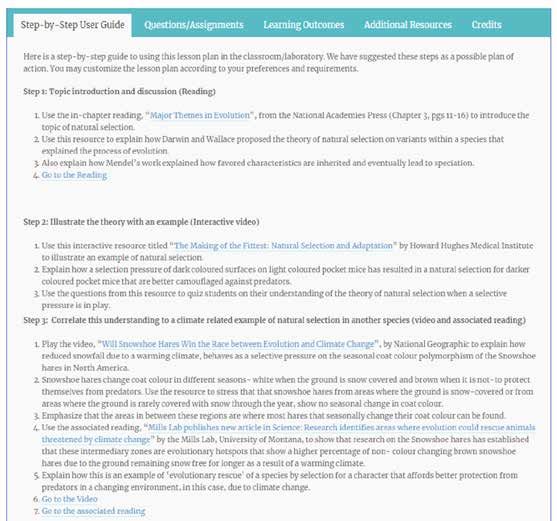
1.2.1      Surveys

Surveys were sent to all Op Mets, including their line managers, using Office 365 Forms.
The questions focussed on the key areas of the Skills Framework and included multiple
opportunities for free text entry to avoid the propagation of preconceptions. The survey
also asked questions about the individual forecasting benches and locations; details from
these responses are now being used when designing each learning intervention, which
are designed for a specific forecasting task or set of tasks when efficiencies make this
possible. Approximately half of all Op Mets responded to the survey (totalling 161), with
an average of 32 minutes spent on each survey. Approximately a third of surveys were
completed by Op Met line management, with separate questions to be answered from a
manager’s point of view, when applicable, in the second half of the survey. The tick-box
answers and text boxes were analysed together and mapped to the amended version of
the Skills Framework.

1.2.2      Existing data

We used three main streams of existing documentation for the analysis. Firstly, we
filtered a large database of customer feedback to find specifics relating back to
meteorologists, either directly or indirectly. We then mapped points to the amended
Skills Framework. Secondly, we incorporated trends in the results from recent Senior Op
Met promotion exams to highlight knowledge gaps with the same methodology applied
to the customer feedback. Finally, in order to capture the activities on as many
benches/locations as possible, we collected utilization reports which give detailed
information on tasks carried out on shift.

1.2.3      Stakeholder interviews

To provide input on priorities for operational teams both now and for the future, we
interviewed representatives from relevant Met Office management teams and the
Guidance Unit consisting of Expert and Principal Op Mets. These interviews provided
perspectives from all forecasting areas including defence, civil aviation, marine, media,
natural hazards and public service forecasting. Again, we mapped the points made in
each interview against the Skills Framework where appropriate and stored this
information for later design and development work.

Some data, such as tick-box answers in the survey, were simple to map against the
Skills Framework, since they were built into the design of the survey. Other data were
much more subjective, hence a team of learning consultants and Op Mets came together
to map the data to the most appropriate category. To give visual clarity and encourage
discussion, we divided a meeting room into eight columns, each headed by one of the
eight Skills Framework categories. The skills gap statements were written on post-it
notes and placed under the headings. The group and the room in use can be seen in
Figure 1.1.

                                             5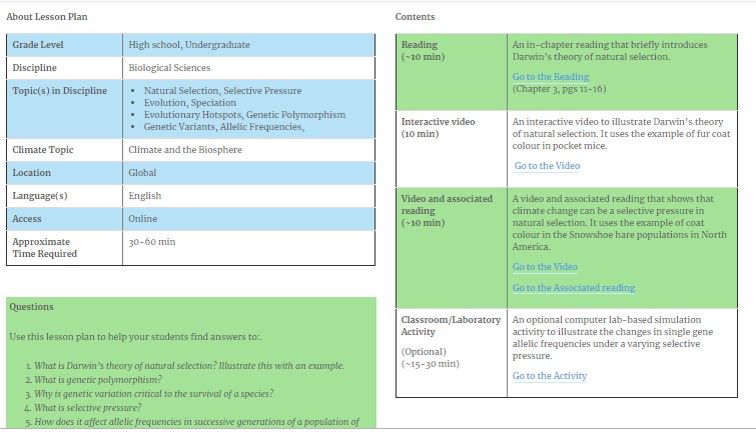
Figure 1.1. The training needs analysis (TNA) room used to map data to
                         categories of the Skills Framework

1.3         Results and next steps

1.3.1       Combining data sources to show trends in skill gaps

Without taking into account the specialist elements of different Op Met jobs within the
network, it is possible to identify some trends in skills gaps using the amended Skills
Framework as a baseline.

Three of the largest skills gaps identified were:

1.      Communication skills ;
2.      Underpinning meteorological knowledge;
3.      Application of operational systems.

We then combined the data from all sources to write a set of top-level, prioritized
learning outcomes. On the basis of these learning outcomes we have planned the design
and development of the new learning interventions for Op Mets.

Some examples of these learning outcomes are:

 “Maintain up-to-date knowledge of foundation-level meteorological theory and be
 able to explain most aspects to a range of audiences.”

 “Apply an appropriate breadth and depth of meteorological knowledge and
 understanding to elements of the customer’s business that could be significantly
 impacted.”

 “Maintain up-to-date knowledge of how our Unified Model works; how primary
 fields are calculated and how other fields are derived. Relate this to knowledge of
 the current strengths and weaknesses of the model to understand how and why
 value can be added to model output.”

 “Using knowledge of the customer’s geographical areas of activity, be able to
 explain and apply knowledge of meteorological effects in these areas.”

                                              6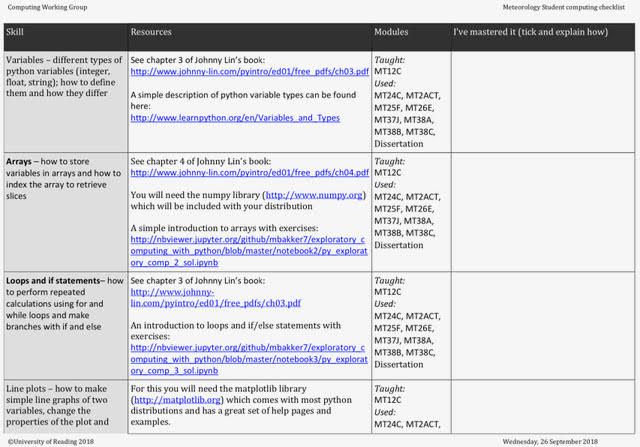
The data also highlighted a growing need for new ways to deliver CPD. Before this
analysis, most formal learning was delivered face-to-face in the College at Met Office HQ.
It has become increasingly difficult to coordinate the desired amount of training in this
way given working patterns and the cost and carbon emissions due to travel. Moreover,
face-to-face training does not align with current trends in online learning and delivery in
bite-sized chunks.

1.3.2       Moving to the design phase

When scheduling work on the design and development of the new learning resources,
several factors had to be considered: the availability of meteorological subject matter
experts (SMEs), access to skilled online training designers and ensuring that training on
seasonal weather phenomena became available when these would be most likely to
affect customers. We also needed to develop and release the online learning
interventions as soon as possible due to the increasing logistical constraints of face-to-
face training. Addressing these points, we decided on the following:

1.      Use of an Agile approach to develop and release training in a fixed time window.

2.      Use of the ABC Learning Design toolkit from University College, London.

3.      Tasking learning consultants with most of the development work on online
        learning interventions using the Met Office learning management system (LMS).

The main benefit of using Agile methodologies is that it has allowed us to release
learning interventions for testing and use as soon as they are drafted. It also has
encouraged innovation through taking risks and not being afraid to learn from failures.
The alternative, which was to commence work on the whole portfolio of learning, would
have resulted in a wait of over 15 months for any training, by which time some of the
earlier development might have needed updating.

The ABC design toolkit, by separating decisions regarding delivery mode from learning
methods, helps people who have experience in teaching, but not necessarily in online
training design, to produce online training materials that use effective learning methods.

Our learning consultants are experts in classroom teaching and particular elements of
operational meteorology but are not yet expert in online learning design. The ABC design
toolkit was key to ensuring that the team was able to effectively and efficiently design
the learning packages. This method also obviated the need for frequent and potentially
lengthy conversations and reduced misunderstandings between the learning
technologists and learning consultants. Carrying out the development work was then
relatively straightforward for the team of learning consultants, using built-in tools within
Moodle, the learning management system used by the college.

The learning technologists, who are specialists in online learning design, completed the
final stage of the development work by applying a “house style” to ensure consistent and
professional-looking presentation, changing some of the more technical settings within
the package and enrolling testers and users on the courses.

1.3.3       Current progress

For the winter season, two learning packages were designed, developed and released for
Op Mets around the themes of fog and minimum temperature forecasting. Each can be
completed in chunks taking 20–30 minutes, with a variety of learning methods used for
each section, including audio clips, social learning, quiz questions and scenarios. When

                                             7
all sections are complete, the user obtains a badge for that particular topic. An example
from the fog package is shown in Figure 1.2. Concepts are brought together in the final
section and framed in a scenario.

      Figure 1.2. Screenshot from the fog forecasting online learning package

1.3.4      Feedback

Feedback on the new online learning resources, which must be submitted by the users
before they obtain the badge at the end, has been collected via the Moodle feedback tool.
Although this new style and delivery method of learning and instruction has been well-
received in general, some users have reported that they would prefer to learn in even
smaller chunks so that they can fit it around their operational work. Others have
requested increased use of audio and video options. These comments have been taken
into account in the next planned window of design and development time.

1.4        Summary

The Met Office College team conducted a comprehensive, forward-looking review of the
ongoing learning and development needs of the Met Office operational meteorologists,
providing an evidence base for our future Learning and Development portfolio. We have
adopted an Agile approach to accelerate delivery of useful, quality learning interventions
while involving experts and Op Mets themselves to ensure that we understand and
address their needs. The results of our work so far have been well received and are
improving meteorologists’ engagement with learning and career development.

© Crown Copyright 2019, the Met Office.

                                            8
2. Three paradoxical reasons to learn intuitive statistics in operational
meteorology
Anders Persson, Geocentrum, Uppsala University, Uppsala, Sweden
Abstract
This chapter argues for the need to teach intuitive statistics to operational weather
forecasters to help them better make the transition to producing forecasts with implicit
uncertainty information. Drawing from the work of the economist Daniel Kahneman, the
chapter offers three paradoxes that must be understood to develop a deeper
understanding of the qualities and benefits of probabilistic information. Several examples
are offered that can be useful for teachers of statistics and forecasting to help their
students develop a stronger and more intuitive feel for statistics.
2.1 Introduction
Because meteorology is a branch of physics, its teaching naturally involves the dynamics
and physics of the atmosphere (radiation, cloud physics, turbulence theory, etc).
However, any science based on numerical values regulated by physical laws must have
these values organized, analysed, interpreted and presented. This requires an intuitive
feeling for mathematical statistics. Such an education is still lacking in meteorology.
The dominant thinking in operational weather forecasting has, for historical reasons,
always been physical or deterministic, in other words, perfect observations and perfect
mathematical methods or models will ideally yield perfect forecasts. But already in the
1860s, at the start of weather forecasting, meteorologists relied on "intuitive statistical
thinking" (and still do) without really being aware of it. Perhaps this is what is hiding
behind the vague term "forecast experience"?
The concept of intuitive statistics was introduced to a broader public by Daniel
Kahneman, who was awarded the Nobel Prize in Economics in 2002, in his book
Thinking, Fast and Slow (Kahneman, 2011). Most of the book applies to our science and
can easily be translated into meteorological vocabulary. The aim of this chapter is to
suggest that operational weather forecasters would benefit from being trained to take a
conscious intuitive statistics approach. The chapter will present three paradoxes
regarding probabilistic thinking that would be helpful to include in forecaster training
programmes.
2.2 The three paradoxes
In line with the main theme in Kahneman's book, meteorologists can be divided into
"fast" and "slow" thinking groups. Weather forecasters and communicators, who work
under time constraints, have to make quick decisions, whereas climate scientist and
numerical weather prediction (NWP) modellers can take their time. The receivers of the
weather forecasts may be categorized as both "fast" and "slow" thinkers. For each of
these three groups we can formulate three paradoxical statements.
The first paradox was coined by Professor Tim Palmer at the European Centre for
Medium-range Weather Forecasts (ECMWF). It applies primarily to meteorologists
dealing with statistical verifications and validations: what looks good can be bad, what
looks bad can be good. As we will see, even seemingly simple equations can be difficult
to interpret.
9The second paradox applies mainly to the users of weather forecasts: It is not necessary
that the weather forecasts are good as long as they are useful. The value of a forecast
lies in the decisions that follow from it whatever the verifications will eventually indicate
(Katz and Murphy, 1997).
Finally, the third paradox, which applies to weather forecasters, reminds them that in
situations with forecast uncertainty they not only can make their best contribution to
society, but also have the best opportunity to fully demonstrate their knowledge and
experience.
2.2.1 Paradox 1: What looks good can be bad, what looks bad can be good
Although NWP modellers and climate scientists, unlike weather forecasters, can take
their time, there are still statistical pitfalls they may stumble into due to mathematically
simple equations that may be difficult to interpret.
2.2.1.1 Systematic forecast errors are not only biases
The most trivial of equations, the arithmetic mean, harbours a lot of redundant data and
confusion. Figure 2.1 shows 2-m temperature forecasts for Tromsö in northernmost
Norway. The forecasts are clearly too cold, they have a cold bias. But the mean error
varies, it is not a "flat bias".
Figure 2.1. Observed (dots) and forecast (dashed line) 2-metre temperature for
Tromsö, N Norway, in winter 2011. The full line is the result of a statistical
adaptive correction based on a 2-dimensional Kalman filter algorithm, used to
correct the most recent forecast recursively in light of the performance of
previous forecasts.
But forecast errors can be systematic without constituting simple flat biases. A closer
look reveals that the error depends on the forecast, smaller for mild conditions, larger
for cold.
102.2.1.2 False systematic errors
Any NWP model has its own climate, in other words, average values and variability of
meteorological parameters. In an ideal NWP model, these values agree with
corresponding values of the real climate. The model climate should also be stable, i.e.
not change during the forecast lead time. However, verifications might sometimes
misleadingly appear to indicate a model drift, with mean errors increasing with forecast
time (Figure 2.2).
Figure 2.2. Verification statistics for the ECMWF model from Météo France in
February 2011, with an apparent systematic error in the 2-metre temperature
forecasts developing after a few days and increasing to an average 1.5–2 °C
cooling (blue curve). Intriguingly the systematic cooling appears also when
some statistical bias correction has been applied (green curve).
But there might NOT be a problem with the model. Instead it might be due to the so
called "regression to the mean effect" (Kahneman, 2011, pp. 175 ff).
When forecasts at longer ranges lose skill, in an increasingly random manner they
scatter around the model climate, which, as mentioned above, for a good model is the
same as the real climate. This implies that over long verification periods the mean of the
forecast errors is zero. But over shorter time spans, weeks or even months, this might
not be the case if the weather is abnormal. For example, in February 2011, the mean
temperature in France happened to be 1.5-2 degrees warmer than the normal climate
(and the model climate). Consequently, the forecasts for longer ranges, scattering
around the model climate, as they should, gave an impression of a gradual cooling, or a
false model drift. It looks bad, but in fact it is good.
There is much more to say about the "regression to the mean effect" in operational
meteorology. As well as constituting a devious statistical artefact, it can also appear as a
positive mechanism, for example, the gradual movement of the NWP ensemble mean
towards the climate average for longer forecast ranges.
112.2.1.3 Larger errors = better forecasts?
Another paradox is that a good NWP model may on average not necessarily have lower
forecast errors than a bad model. To show this, we will analyse the properties of the
common verification parameter, the Root Mean Square Error (RMSE): in other words, the
forecast (f) minus observations (o) summed and averaged over time (and/or place) after
which the square root is calculated.
If we square the RMSE, the mathematics will be more tangible and can be decomposed
around climate (c) into three terms, each having its own story to tell (Figure 2.3).
Figure 2.3. A decomposition of the square of RMSE (left) into terms of model
and atmospheric variability (middle) and the covariance of the forecast and
observed anomalies (right)
The Root Mean Square Error (the term on the left) is dependent not only on the
predictive skill of a model (the term on the right) but also on the variability of the
atmosphere and model (the two middle terms). In an ideal NWP model these two terms
should be the same. A deficient model that has lower variability than the atmosphere
may therefore yield a lower RMSE for the wrong reason. What looks good is in fact bad.
2.2.1.4 Correlations and "jumpy" NWP output
Not only meteorologists but also the general public, in consulting their apps, for
example, tend to judge the reliability of the automated forecasts from their steadiness. If
they jump or wobble from one run to the other, they are considered less reliable. But
this applies human moral criteria to soulless machines!
Assume we are interested in the weather three days ahead. If the first forecast we get is
for dry weather, but the following two forecasts predict rain, we are more confident that
rain will come than after a sequence that wobbles between dry and rainy weather
(Figure 2.4).
12Figure 2.4. Schematic representation of cases with rather consistent and
"jumpy" forecasts. Rain is slightly more likely after "jumpy" forecasts.
Verifications of the ECMWF and UK Met Office model output have shown that, contrary to
popular belief, it is quite irrelevant if the last two forecasts are jumpy or not. The
reliability is about the same or perhaps even slightly higher in the jumpy case. What
looks bad is good.
This brings in the importance of correlations. There is always a temporal correlation
between successive NWP runs because of inertia inherent in the data assimilation. The
forecast agreement between two NWP forecasts only 6 or 12 hours apart should not be
overestimated compared to an agreement between two NWP forecasts 24 hours apart,
which are less correlated.
2.2.2 Paradox 2: It is not necessary that the forecasts are good as long as
they are useful
How bad forecasts can be good can be demonstrated by analysing weather forecasts
from a private weather company, Krick Weather Service (KWS) in 1930s California. At
the time, it successfully challenged the US Weather Bureau (USWB) forecasts and
earned large amounts of money by issuing, by most standards, poor rain forecasts.
Nevertheless, they were very useful for important sectors of society (Lewis, 1994, p.73-
74).
2.2.2.1 Rain forecasts in the 1930s California
The relevant statistics from this case are lost, so what follows is a reconstruction where
we (for pedagogical reasons) assume a rather wet climate for California, with three rainy
days out of 10. We further assume that USWB in those days issued rain forecasts with
the same frequency as the rain occurred, and one day ahead correctly forecast rain in
2/3 of the cases (Figure 2.5).
13Figure 2.5. The forecast verification matrix assumed to reflect the skill of the
USWB one-day rain forecasts in the 1930s. (Fc = forecast, Ob = observed)
The KWS relied on two important and money-rich clients: the Hollywood movie industry
and the Californian hydraulic power companies. The former was sensitive to rain—if they
had arranged an outdoor shooting scene with thousands of extras and it rained, they
would lose a large sum of money invested in salaries. To them, the KWS provided
forecasts which heavily over-forecast rain.
The power companies were in the opposite situation—if they used their water power
faster than the stream flow coming in, the level of the water in the reservoir went down
and the energy they could get out of each drop of water also went down. If they thought
it was going to rain and it didn't—that was very bad. To them, the KWS provided
forecasts which heavily under-forecast rain.
So KWS had these two prime sets of clients. The verifications of these heavily biased
forecasts might have looked something like this (Figure 2.6):
Figure 2.6. The possible verification matrices of the KWS over-forecast of rain
(left) for the movie industry and under-forecast of rain (right) for power
companies. In the former case, rain was forecast almost twice as often as it
occurred, in the latter, rain occurred only in 1/3 of the cases.
The clients didn't bother about the over-all statistical skill of the forecasts. The movie
industry wanted perfect forecasts for when dry weather was predicted, the power
industry perfect forecasts when rainy weather was predicted.
142.2.2.3 How the US Weather Bureau could have fought back
It is not known what USWB did to challenge the competition. What follows is a
counterfactual speculation to show what actions could have been taken. The US Weather
Bureau could, for example, have decided not to issue weather forecasts on occasions
when they were uncertain, about 40% of the time. This sounds ridiculous, but let us see
what it leads us to (Figure 27).
Figure 2.7. The USWB forecast matrix when the Bureau abstains from making
forecasts (indicated by "???") 40 days out of 100.
The movie industry’s moguls and the power industry's tycoons might then have reasoned
like this: “To be on the safe side, let us interpret '???' in our own interest, as if 'no rain'
or 'rain' respectively had been forecast.” In the case of the movie industry this would
have resulted in the forecast matrix in Figure 2.8a.
Figure 2.8a. The movie industry interprets the "???" forecast as if rain is
possible and acts accordingly.
The power industry, on the other hand, in the absence of forecasts, would have taken
action as if "no-rain" had been forecast and this would have resulted in the forecast
matrix in Figure 2.8b.
15Figure 2.8b. The power industry interprets the "???" forecast as if rain is not
likely and acts accordingly.
By comparing Figures 2.8a and 2.8b with Figure 2.6, we can see that the USWB, with
this hilarious approach, would have been able to provide the movie and power industry
customers with information of equal value as the KWS—and probably for free!
It is, however, not a very attractive policy for a weather service to abstain from giving
forecasts just because the atmospheric situation is difficult to predict. Therefore, USWB
could have gone one step further and asked their weather forecasters to specify
uncertainty in more detail, to break it down into categories of "almost certain", "fairly
certain", "uncertain" and "highly uncertain". A probability value could then be attached
to each category and we would have the right-hand matrix in Figure 2.9.
Figure 2.9. The break-down of purely categorical yes-no forecasts into
forecasts of increasingly non-categorical (probabilistic) nature
The US Weather Bureau would then, in a short period of time, have been able to
abandon the approach of abstaining from making forecasts and instead issue probability
forecasts in a spectrum of 0%, 20%, 40%, 60%, 80% and 100%. The movie industry
would then have been free, if it so wanted, to act only on 100% probability forecasts,
the power industry only on 0% probability forecasts. Other customers, or the general
public, could, depending on their specific interest, have reacted at other probability
values.
16It is worth noting that probability forecasting has old roots in American forecasting,
having been championed by the former chief of USWB, Cleveland Abbe (1838-1916),
among others.
2.2.2.4 The need to over-forecast extreme events
We saw that the movie and power industry, when provided with categorical forecasts,
were best served if "their" weather was over-forecast. It is a general rule that if weather
forecasters, for one reason or another, cannot issue probability forecasts, the best way
to provide useful information about significant or extreme weather events is to over-
forecast them. It may be better to issue one too many warnings than one too few.
Venn diagrams, named after their inventor John Venn (1834–1923), are a useful tool for
intuitive statistics and help to clarify this. In Figure 2.10 the green circle represents the
(rare) frequency of bad weather in a region. The equally sized red circle represents
forecasts which are "well-tuned", in other words, they are issued with the same overall
frequency as the bad weather but misplaced in time or location.
Figure 2.10. A typical Venn diagram with circles representing bad weather and
two types of forecast
Only a fraction of bad weather cases are precisely captured. By over-forecasting (the
larger red circle) most cases are caught, but at the price of many false alarms. Since bad
weather is harmful to society, this over-forecasting may be beneficial and justified.
2.2.2.5 The difference between "probable" and "typical"
According to Kahneman (2011, pp 156 ff), humans have difficult distinguishing between
the terms "typical" and "probable". Some meteorologists tend to have more confidence
in full-scale deterministic NWP forecasts, which look realistic, than in smooth ensemble
mean maps, which look unrealistic, although the predicted values in the latter are more
"probable", in other words, more likely to be closer to the truth (Figure 2.11, left).
17Figure 2.11. The NWP forecast map (left) depicts a "typical" weather situation
in the medium range. Values taken from the "atypical" ensemble mean map
(right) are actually more likely or "probable".
Anyone who strives to make a "perfect forecast" should choose the full-scale
deterministic forecast, because it is not impossible that it turns out to be correct!
However, another strategy is to always make forecasts that contain as few errors as
possible, which would favour the use of the smooth forecast.
2.2.2.6 More from Kahneman's book
There are other examples of intuitive statistics relevant for operational meteorology. The
"availability error" (Kahneman, 2011, pp. 129 ff), the ease with which instances come to
mind, might explain why forecasts of afternoon thunderstorms by humans seem to be
better 18–24 hours ahead than 6–12 hours ahead. The former are made in the afternoon
the day before, when there often are a lot of thunderstorms "available". The 6–12 hour
forecasts are made in the early morning with mist and low stratus often covering the
sky, making the forecaster concentrate on forecast of visibility and cloud bases.
Another example is the "framing effect" (Kahneman, 2011, pp. 363 ff), which explains
why the statement "the glass is half full" tends to be regarded as more favourable than
the mathematically equivalent formulation "the glass is half empty". Framing may help
meteorologists present probability forecasts or help users make correct interpretations. A
major city in Britain was once warned about a 20% probability of a severe thunderstorm
on its specific location. No action was taken, in contrast to a later, meteorologically
similar occasion when forecasters issued the equivalent forecast of a 70% probability of
a severe thunderstorm somewhere in the region.
When forecasting rare events, it may be helpful to know the climatological probability or
"base rate" (Kahneman, 2011, pp 146 ff). A forecast of 20% for an event with "base
rate" 2% will get more attention if presented as "10 times more likely than normal".
The "confirmation bias", the "halo effect" and the "primacy effect" (Kahneman, 2011,
pp.79 ff) explain the tendency to base decisions on the NWP that arrives first, and then
judge the following NWP forecasts in the light of the first one, particularly when it comes
from a model with a high reputation.
182.2.3 Paradox 3: It is in uncertain situations that the weather forecaster
can excel
It always impresses people when someone takes personal responsibility. This is also true
of the public with regard to weather forecasters. Forecasters ought to treat irritating
problems with jumpy computer forecasts, misleading statistical interpretations or
missing data as internal matters of the forecast office.
Jumpy, inconsistent and diverging NWP forecasts are likely a reflection of a difficult
weather situation. Such situations, not the technical details, greatly interest the public
and the end users. Therefore, from operational experience, the following communication
approaches regarding uncertainty have proved useful.
1. Invite the customer/public to share your inside information by giving a brief
description of the complexity of the weather situation, avoiding discussion of the
technical details of NWP jumpiness, misleading statistics and missing data.
2. Formulate the uncertainty in an appropriate way, from using expressions such as
"probable" and "possible" to providing numerical probabilities for those who can make
use of them.
3. If appropriate, couch the forecast in more concrete, possible actions in general terms
such as "If I were you...I wouldn't risk . . .", for example.
The TV forecaster in Figure 2.12 avoids the Scylla of overconfidently and categorically
promising no thunderstorms without falling into the Charybdis of appearing helpless by
referring to contradictory computer guidance.
Figure 2.12. By taking personal responsibility, this forecaster displays her
knowledge of convective processes and long experience of summertime
weather. Her qualitative probability forecast provides a good basis for decisions
because it can be understood by everybody.
This way of communicating is facilitated by insights into elementary intuitive statistics.
Since the start of weather forecasting in the 1860s, meteorologists have more or less
knowingly applied intuitive statistics. It should improve the forecasters’ self-confidence
to know that their forecast experience has support in mathematical theories.
2.3 Summary and prospects
The science of meteorology displays some paradoxical features, often against common
sense. It has been shown that verification statistics are sometimes highly deceptive, that
19weather forecasts can be less useful when they are accurately formulated than when
they are less precise and, finally, that it may be when weather forecasters feel they are
in trouble because of highly uncertain situations that they have the best opportunities to
excel.
These paradoxes are not explained by shortcomings in the science of meteorology, but
by limitations in our human common sense. As Daniel Kahneman shows in his book
about intuitive statistics, we also run the risk of misleading ourselves in other walks of
life.
Education programmes in intuitive statistics for meteorologists are not supposed to train
expert statisticians, but to produce well-informed users of statistical information. Such
studies will help forecasters not only to better understand how to draw the right
conclusions from their experience, but also how to make their forecasts more useful, to
understand how their customers react to their forecasts and, of course, how to better
communicate with them.
Acknowledgements
Most of the ideas presented in this chapter derive from my own experience as an all-
round forecaster at the Swedish Met Service (SMHI) and a senior scientist at ECMWF
and, in particular, from discussions with colleagues at the British Met Office during my
time there (2008–2010). The idea of meteorologists as intuitive statisticians was first
presented in an interview published in the ECMWF Newsletter (Persson, 2011, see also
Persson 2014a and b). See also Doswell III (2004) for views similar to those expressed
in this chapter.
References
Doswell III, C.A., 2004: Weather forecasting by humans—Heuristics and decision making.
Weather and Forecasting, 19, pp. 1115–1127.
Kahneman, D. 2011: Thinking, Fast and Slow. London, Penguin Books.
Katz R.W. and A.H. Murphy, 1997: Economic Value of Weather and Climate Forecasts.
Cambridge, New York, Cambridge University Press.
Lewis, J. M., 1994: Cal Tech's Program in Meteorology: 1933–1948. Bulletin of the
American Meteorological Society, 75:1, 69–81.
Persson, A. 2011: Increasing trust in medium-range weather forecasts. ECMWF
Newsletter, 129, Autumn 2011, pp. 8–12.
Persson, A., 2014a: Los Meteórologos no podemos escapar de las probabilidades.
Tiempo y Clima, 44, pp. 32-37 (also available in English: We meteorologists cannot
escape probabilities!, pp. 38–43).
Persson, A., 2014b: The weather forecaster as an "intuitive statistician". The European
Forecaster, 19, pp. 10–16.
203. Educational strategies to achieve global awareness of climate change and its
impact
Rahul Chopra, Trans-disciplinary Research Oriented Pedagogy for Improving Climate
Studies and Understanding (TROP ICSU) and Indian Institute of Science Education and
Research (IISER), Pune, India; Anita Nagarajan and Aparna Joshi, Indian Institute of
Science Education and Research (IISER), Pune, India; Nathalie Fomproix and L.S.
Shashidhara, International Union of Biological Sciences (IUBS), Paris, France. This has
been submitted on behalf of all the partners of the TROP ICSU project.
Abstract
Climate change constitutes a global challenge with significant adverse impacts on
sustainable and equitable development. A critical step to address this challenge is to
increase the awareness of climate change and the understanding of climate science in
current and future generations. Education will help increase the knowledge required to
identify appropriate mitigation and adaptation actions that could minimize or even
reverse the impacts of climate change at global, regional and national levels. The Trans-
disciplinary Research Oriented Pedagogy for Improving Climate Studies and
Understanding (TROP ICSU) project provides educational resources that can be used by
teachers to increase the awareness of the causes and effects of climate change among
students at high-school and at the undergraduate level. The TROP ICSU project has
collated and curated a repository of teaching resources that can be used by educators to
teach a topic in a discipline by using examples, case studies and activities related to
climate change. The project demonstrates a novel way of integrating climate change
education with the existing curriculum. The TROP ICSU digital resources, while being
globally relevant, can be easily adapted to local contexts. The use of these teaching aids
is a novel form of pedagogy that can create an interactive and engaging learning
experience. This methodology will help in the development of critical thinking and
reasoning skills among students while, at the same time, enhancing their conceptual
understanding of topics in the discipline. This is an incentive built into these modules so
that a large number of teachers would use them globally. Detailed lesson plans that can
serve as guidelines for teachers at high-school and undergraduate levels have been
developed under this project. These have been reviewed and validated by subject
experts for scientific correctness and by teachers for ease of use in their teaching.
Keywords: education, climate change, climate change education, curriculum, digital
pedagogy, teaching resources, lesson plan
3.1 Introduction
Climate change is one of the most significant issues of our times. Its impacts include
increased temperatures, rise in ocean levels, ocean acidification, loss of terrestrial and
marine biodiversity, increased health risks and reduced agricultural productivity.
Potential solutions to address impacts of climate change require an awareness of the
risks it poses to humanity. Considering that future generations are likely to be more
affected by climate change than the current generation, education has to equip all
learners to address the challenges posed by climate change. To this end, there is a need
to create, employ and adopt educational modules that are effective in imparting climate
change-related awareness to students.
213.2 Climate change education today
Most of the resources available for climate change awareness have been developed as
extra-curricular content.1 They are reviewed in Chopra et al. (2020) and listed on the
TROP ICSU website at https://tropicsu.org/un-resources/ and https://tropicsu.org/
educational-resources/. As core curriculum, climate and climate change education is
currently under-represented in most parts of the world (Wise, 2010). It is most
commonly offered only at the undergraduate level and typically as part of the Earth
Sciences or Environmental Sciences majors; many countries offer specialized, skills-
oriented courses at the graduate level. Thus, the current curricular structures severely
restrict the number of learners of climate science and climate change.
Climate change adaptation and mitigation require local solutions that may or may not be
scalable or adaptable to different parts of the world. Thus, people and experts from all
over the world should be involved in addressing this issue systematically and
innovatively. For this to happen, a large number of people across the world must be
competent and sensitive to the problems of climate change. Therefore, it is vital that the
education system allows increased opportunities for learning about this critical issue.
While significant changes to the curricular structures in different countries can often be
challenging and time-consuming, new pedagogical interventions are more acceptable.
The challenge lies in ways of training teachers, who are teaching their discipline-specific
topics, to introduce climate-change related content in their classrooms.
3.3 The TROP ICSU project: Integrating climate change education with
existing curriculum
The Trans-disciplinary Research Oriented Pedagogy for Improving Climate Studies and
Understanding is a global project funded by the International Science Council (ISC), led
by the International Union of Biological Sciences (IUBS) and co-led by the International
Union for Quaternary Research (INQUA). The project partners include several other
international science unions, national academies of several countries, national research
centres, and United Nations agencies. The project aims to increase the awareness of
climate science, climate change and related impacts among all high-school and
undergraduate students globally.
The TROP ICSU project has developed, collated and curated, as well as validated, novel
pedagogical tools that are easy for any high-school or undergraduate teacher to use
without deviating from their regular discipline-specific teaching. Detailed information and
lesson plans provided by the TROP ICSU project explain how a climate change topic can
be used as an example, case study, assignment or activity for better explanation of a
discipline-specific topic. This approach allows high-school and undergraduate teachers of
different disciplines to continue to teach using their existing syllabi in the curriculum of
their respective countries. Additionally, the use of TROP ICSU resources will lead to
increased awareness of climate change among students in their classrooms. This
approach strengthens the educational system by providing students with greater clarity
of core curriculum concepts and increased opportunities to develop and enhance their
1
Available educational resources for climate change include: Science Education Resource Center at Carleton
College (https://serc.carleton.edu/climatechange/index.html), NASA’s Global Climate Change
(https://climate.nasa.gov/resources/education/), Climate Literacy & Energy Awareness Network
(https://cleanet.org/index.html), University Corporation for Atmospheric Research
(https://scied.ucar.edu/climate-change-activities), The Teacher-friendly Guide to Climate Change
(https://teachclimatescience.wordpress.com/chapters/), the UN CC: e-Learn resources
(https://unccelearn.org/), MetEd resources of the COMET program (https://www.meted.ucar.edu/index.php),
WMOLearn from the WMO Global Campus portal (https://public.wmo.int/en/resources/training/wmolearn), and
individual faculty teaching webpages (for example, David Archer http://forecast.uchicago.edu/index.html).
22critical thinking and analytical abilities. Thus, this novel method, which integrates climate
education with the core curriculum, can have a positive impact on learning outcomes of
our current educational system by further enhancing the general preparedness of the
future generation in addressing problems of climate change.
3.4 TROP ICSU resources for teachers: Teaching tools and lesson plans
The TROP ICSU website contains the suite of collated, curated and reviewed digital
educational resources described above. These include teaching tools and lesson plans
that a teacher from a particular discipline can use to teach a topic using a climate-
related example, activity or case study, thereby integrating climate education into their
existing syllabi. All resources collated or developed under this project have been
reviewed and validated by subject experts for scientific correctness and by teachers for
ease of use in their teaching. To ensure that the resources are useful globally, subject
experts and teachers in various countries were involved in the feedback and review of
the teaching tools and lesson plans through a series of face-to-face workshops. A
detailed description of the methodology, which includes a multi-stage review process,
can be found at https://tropicsu.org/project/methodology/.
3.4.1 Teaching tools
The TROP ICSU website currently contains approximately 150 computer-based teaching
tools (https://tropicsu.org/resources/pedagogical-tools-examples/) that can be used to
teach a topic in a particular discipline with the help of a climate-related example. The
teaching tools are organized under the following categories: Discipline, Tool Type,
Climate Topic, Grade Level, Region, and Language.
Currently, the teaching tools cover the following disciplines: Biological Sciences,
Chemistry, Earth Sciences, Economics, Environmental Sciences, Geography, Humanities,
Mathematics, Physics, Social Sciences, and Statistics.
A selected list of topics in Mathematics that can be taught using climate-related
examples is shown in Figure 3.1. A complete list of topics from all disciplines that can be
integrated with climate education can be found at https://tropicsu.org/resources/
pedagogical-tools-examples/pedagogical-tools/, organized under the respective
disciplines.
Figure 3.1. A snapshot of different teaching tools that a mathematics teacher
can use to teach topic(s) in their curriculum using a climate-related example.
Topics in this image include calculus, trigonometry, functions, polynomial
differentiation, numerical modelling, mathematical modelling, computer
programming and more.
23For each teaching tool, the topic(s) that can be taught using the tool, a summary of how
the tool integrates climate understanding for the learner, questions to assess student
learning, and detailed information about the tool are provided. Figure 3.2 shows a
sample teaching tool in Mathematics.
Figure 3.2. Sample tool for teaching introductory calculus by using atmospheric
CO2 concentrations (this tool was developed by Thomas Pfaff and is available at
http://sustainabilitymath.org/calculus-materials/. See the description of this
teaching tool at https://tropicsu.org/mauna-loa-yearly-average-co2/.)
Teaching tools are of different types such as classroom/laboratory activity, reading,
video, audio, game, visualization, e-learning course and teaching module. They are also
mapped to climate topics and grade levels. Location-specific tools and tools in different
languages are also provided.
3.4.2 Lesson plans
The TROP ICSU website contains detailed lesson plans that integrate several topics in
Biological Sciences, Chemistry, Earth Sciences, Economics, Environmental Sciences,
Geography, Humanities, Mathematics, Physics, Social Sciences, and Statistics with
climate-related topics. These lesson plans, each with a detailed step-by-step guide, show
teachers how different digital teaching tools can be used to integrate a topic in their
discipline with a climate topic.
Each lesson plan contains the following sections:
1. Introduction: highlighting the topic(s) in a discipline and the link to a climate
topic;
2. About the Lesson Plan: including the approximate time required and grade level;
3. Contents: listing the different digital teaching tools used in the lesson plan;
4. Step-by-step User Guide: consisting of a detailed set of instructions on different
digital tools used to explain the topic in a given discipline while integrating it with
climate science or climate change;
245. Questions/Assignments;
6. Learning Outcomes;
7. Additional Resources;
8. Credits/Acknowledgements of the authors.
Each lesson plan is provided as a template, and individual teachers can customize it to
best suit their requirements.
Figure 3.3 shows an example of a lesson plan from Biological Sciences. A complete list of
lesson plans can be found at https://tropicsu.org/resources/lesson-plans/ under the
respective disciplines.
25Figure 3.3. A sample lesson plan describing how a biology teacher can teach
natural selection using climate-related examples.
3.5 Results, challenges and future work
The TROP ICSU team has been conducting workshops with high-school and
undergraduate teachers and climate experts in several countries. So far, workshops have
been conducted for teachers in India, Uganda, Bhutan, South Africa, Egypt and Australia.
The aim of these workshops is to introduce participants to the teaching tools and lesson
plans. Additionally, participants carry out several group activities such as online reviews
of teaching tools and lesson plans from their discipline for appropriateness and ease of
use in their classrooms, and the development of lesson plans that integrate topics in
their discipline with a climate topic. Group discussions help in the review of teaching
resources and the exchange of ideas across disciplines. Several interesting lesson plan
ideas from workshop participants have been developed into lesson plans published on
the TROP ICSU website. These lesson plans submitted by teachers can be found at
https://tropicsu.org/resources/lesson-plans/teachers-lesson-plans/.
Preliminary results of the feedback received from teachers indicate that most teaching
tools and lesson plans are effective in explaining one or more topics in different
disciplines and in integrating these topics with climate science. According to most
teachers, use of these teaching tools and lesson plans will increase the awareness of
climate change among their students. A majority of the teachers intend to use the
teaching tools and lesson plans in their classrooms after slight modifications. They also
26You can also read