Visualization of metastatic melanoma cells by fluorescence microscopy and MRI using a novel glycogen nanoprobe
←
→
Page content transcription
If your browser does not render page correctly, please read the page content below
Visualization of metastatic melanoma
cells by fluorescence microscopy and
MRI using a novel glycogen nanoprobe

                               Synnøve Nymark Aasen

This thesis is submitted in partial fulfilment of the requirements for the degree of Master in
                      Medical Biology – Biomedical Image Sciences

                                Department of Biomedicine
                                    University of Bergen
                                         June 2014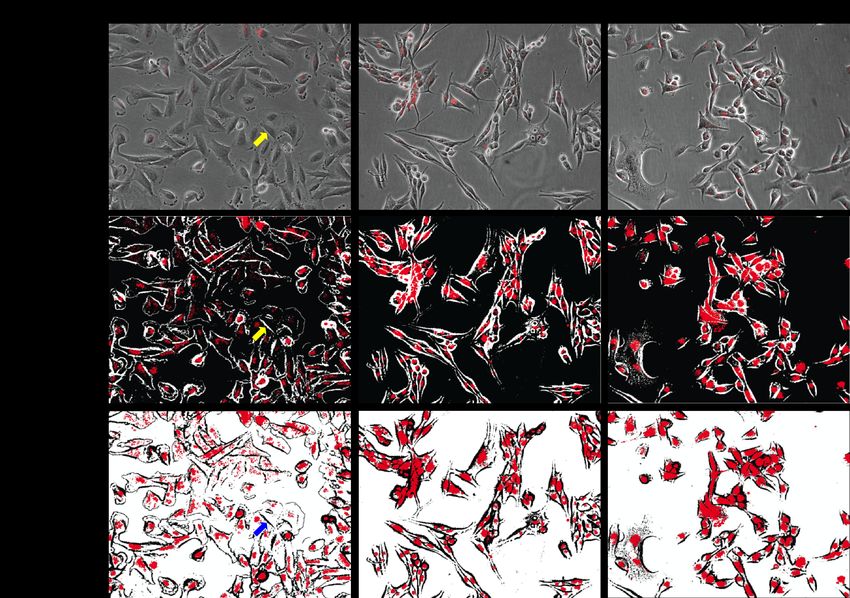
II
Acknowledgements

First of all, I am very grateful to Professor Frits Thorsen at the Translational Cancer Research
Group, for excellent supervision during the work of this thesis and for introducing me to a
very exciting field of research. Thank you for all your time and help in your busy days, I
would recommend any new Master student to chose you as a supervisor. Also, thanks to my
former co-supervisor Kai Ove Skaftnesmo, for sharing some of your outstanding lab skills
with me.

I also give my greatest gratitude to Aneta Pospisilova and the others at the Institute of
Macromolecular Chemistry in Prague for providing us with the glycogen nanoprobe.

Great thanks go to Tilo Eichler for all your support and interest in this project during the last
year and for useful input on confocal experiments.

Thanks to Endy Spriet and Hege Dale for all your help on the microscopes and Anne Karin
Nyhaug for sectioning and staining of tumor samples. Thanks to Hrvoje Miletic for
interpreting our histology samples. Thanks to Ingrid, Tove and Halala for your help in the lab.

Great thanks to all hard-working PhD students and postdocs on the sixth floor, who lucky for
me, has been around on late evenings or weekends and helped me with occasional challenges:
Eskil, Hilde-Elise and Lina. And thanks to Jonathan for clearing up some confusing statistical
numbers for me.

I would also like to thank my visually challenged family for all your support and for being
test subjects on whether or not all the figures in the thesis were possible to see. Great thanks
to Steffen for all your support, help and encouragement. Finally, thanks to Ronja, Line,
Ragnhild and Elah for being excellent reading room buddies!

Synnøve, May 2014

                                                I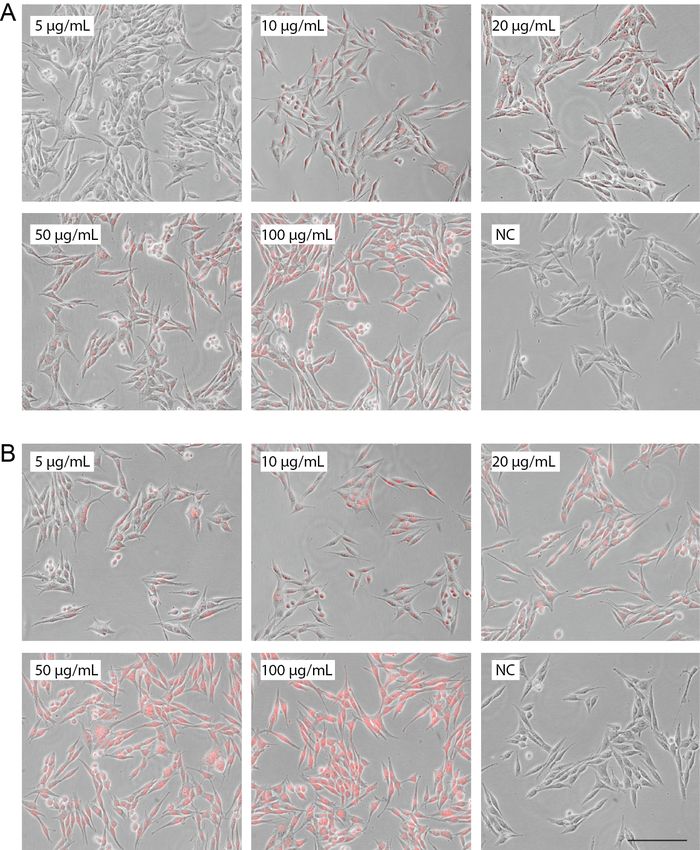
II
Abstract

The incidence of malignant melanoma has increased steadily during the last decades. Large
portions of individuals with this particular skin cancer develop multiple brain metastases,
which is associated with a particular poor prognosis, and thus new therapeutic approaches are
needed. Increased attention has been given lately in literature to the establishment of
functional nano-scaled materials for applications in combined cancer therapy and diagnostics,
a field termed «theranostics» or «theragnosis» (therapy + diagnostics).

Recently, a collaborator at the Institute of Macromolecular Chemistry (Academy of Sciences,
Prague) developed a multimodal nanoprobe, consisting of a backbone of glycogen. Two
different contrast agents were encompassed in this, namely Dyomics-615-NHS ester, a
fluorescent marker and Gd-DOTA, a well-known magnetic resonance imaging contrast agent.
The nanoprobe can also be loaded with positron emission tomography tracers and therapeutic
substances, and targeting may be achieved by loading the probe with antibodies. The
nanoprobe has a great potential for being a theranostic probe, as the backbone consists of
glycogen, which is regarded nontoxic to human cells. Further, magnetic resonance imaging
and positron emission tomography may be used to evaluate drug uptake and treatment effects.

Since this nanoprobe is completely new, it has not been tested previosly on human cell lines
in vitro and in vivo. The main aim of the current Master thesis was thus to perform toxicity
and viability studies in vitro, to determine the usefulness of the nanoprobe. The usability of
the nanoprobe was evaluated on three different metastatic melanoma cell lines in vitro.
Fluorescence microscopy and high throughput imaging revealed a high cell labeling efficacy
with an optimal uptake period at 24 hours incubation time. Reduced cell viability was not
found after labeling with the nanoprobe. In vitro magnetic resonance imaging studies of
labeled cells casted in agar phantoms revealed that the nanoprobe also can be used as a
contrast agent by this modality. The preliminary in vivo data indicated that tumor contrast
uptake could be achieved in a subcutaneous tumor model. The promising results reported in
this thesis may indicate that this nanoprobe can be used also for other cancer cell lines.
Potentially, the nanoprobe can offer further benefits over established contrast agents used in
magnetic resonance imaging, as pharmaceuticals attached to the probe can be traced
simultaneously as the progression of disease and treatment are monitored.

                                              III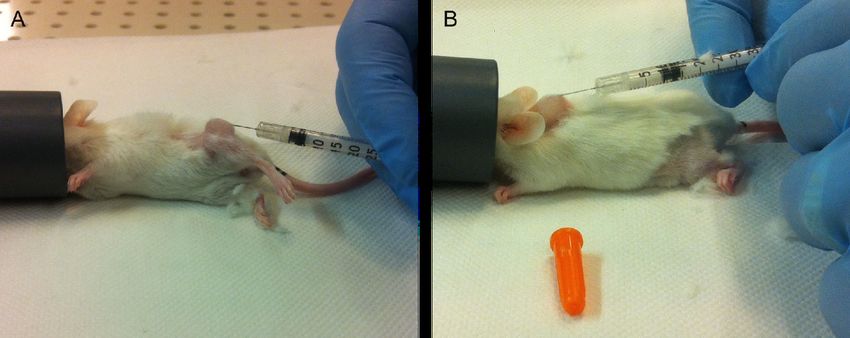
Abbreviations

Abbreviation    Full name
BBB             Blood-brain barrier
BLI             Bioluminescent imaging
BP              Bandpass
CA              Contrast agent
CCD             Charged-couple device
CNS             Central nervous system
CT              Computer tomography
DLS             Dynamic light scattering
DMEM            Dulbeccos Modified Eagles Medium
DMSO            Dimethyl sulphoxide
DNA             Deoxyribonucleic acid
DOTA            1,4,7,10-tetraazacyclododecane-1,4,7,10-tetraacetic acid
Dyo-615         Dyomics-615-NHS ester
ECM             Extracellular matrix
EMT             Epithelial-to-mesenchymal transition
EPR             Enhanced permeation and retention
FA              Flip angle
FACS            Fluorescence activated cell sorting
FCS             Fetal calf serum
FDA             Food and Drug Administration
FOV             Field of view
G1P             Glucose-1-phosphate
G6P             Glucose-6-phosphate
Gd              Gadolinium
GFP             Green fluorescent protein
HTI             High throughput imaging
HTS             High content screening
ISA             Image sequence analysis
LD50            Lethal dose 50 %

                                IV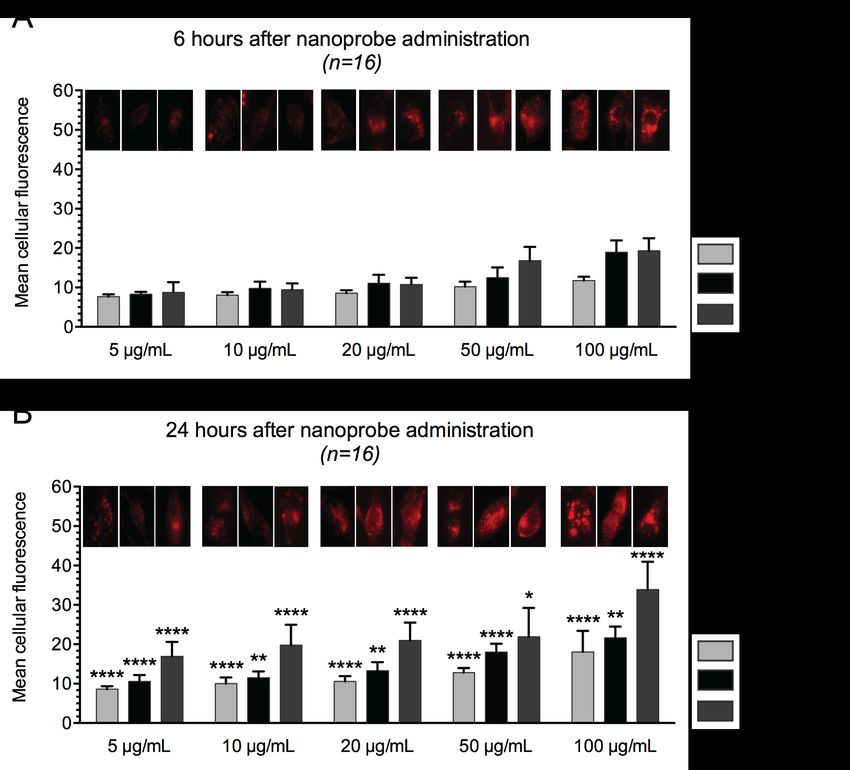
Abbreviation   Full name
LP             Longpass
LUT            Look-up table
Melanoma       Malignant melanoma of the skin
MMP            Matrix metalloproteinases
MRI            Magnetic resonance imaging
msec/ms        Millisecond
NaCl           Sodium chloride
NC             Negative control
NEX            Number of Excitations
Nod/scid       Nonobese-diabetic/severe combined immunodeficient mouse
NS             Not significant
PBS            Dulbeccos phosphate-buffered saline
PET            Positron emission tomography
PFA            Paraformaldehyde
PMT            Photomultiplier tube
RH             Dynamic radius
Resazurin      7-Hydroxy-3H-phenoxazin-3-one 10-oxide
RF             Radiofrequency
ROI            Region of interest
RPM            Rotations per minute
SD             Standard deviation
T              Tesla
T1             Relaxation time of longitudinal magnetisation
T2             Relaxation time of transverse magnetisation
TE             Echo time
TR             Repetition time
TSP-1          Thrombospondin-1
VEGF           Vascular endothelial growth factor
wt%            Weight percent

                               V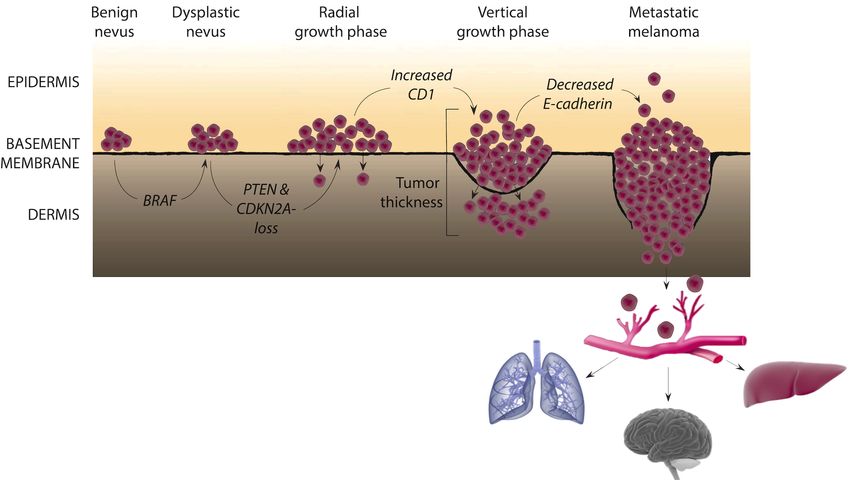
List of figures
Figure 1.1 Melanoma progression. Created with symbols from Somersault.
Figure 1.2 Formation of brain metastases. Modified from Eichler et al., 2011.
Figure 1.3 Cell culture illustration. Created with symbols from Somersault.
Figure 1.4 The principle of fluorescence. Adapted from Ishikawa-Ankerhold, 2012.
Figure 1.5 Relaxation after an RF pulse. Modified from Currie, 2013.
Figure 1.6 Illustrations of the contrast agents encompassed in the glycogen nanoprobe. A
modified from Chen, 2013. B modified from Czerney, 2011.
Figure 3.1 Subcutaneous tumor cell injections into five nod/scid mice.
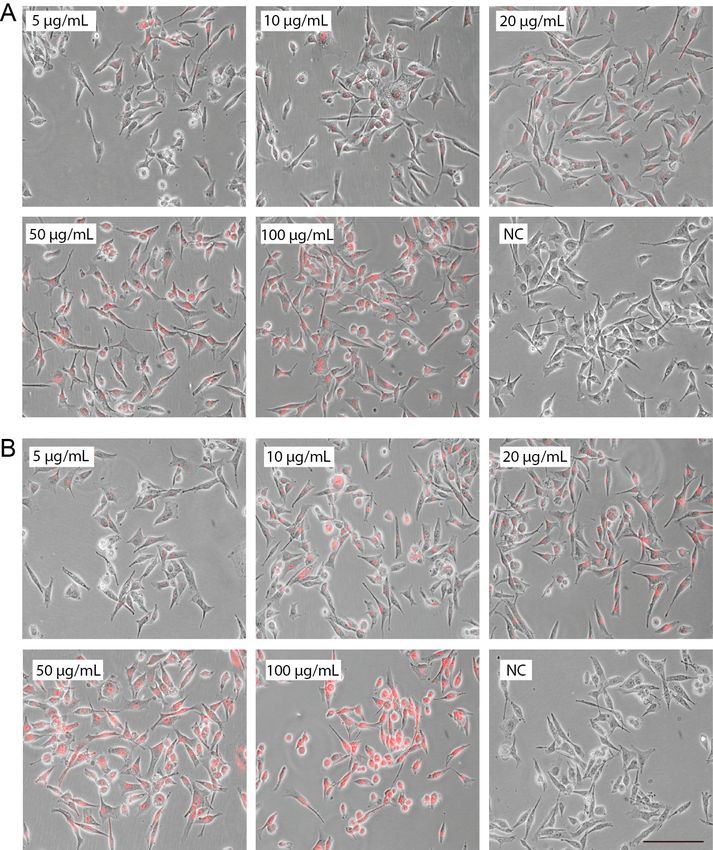
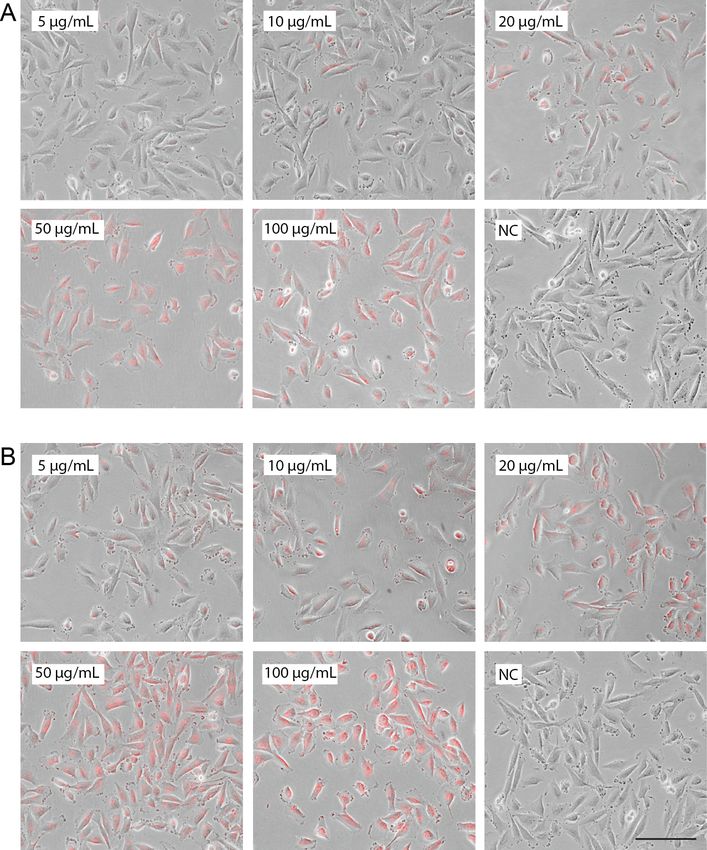
Figure 4.1 Micrographs of Melmet 1 pGF1 cells labeled with glycogen nanoprobe for six
(A) and 24 hours (B).
Figure 4.2 Micrographs of Melmet 5 pGF1 cells labeled with glycogen nanoprobe for six
(A) and 24 hours (B).
Figure 4.3 Micrographs of H1_DL2 cells labeled with glycogen nanoprobe for six (A)
and 24 hours (B).
Figure 4.4 Fluorescence intensity graphs of Melmet 1 pGF1, Melmet 5 pGF1 and
H1_DL2.
Figure 4.5 Binary images of Melmet 1 pGF1, Melmet 5 pGF1 and H1_DL2.
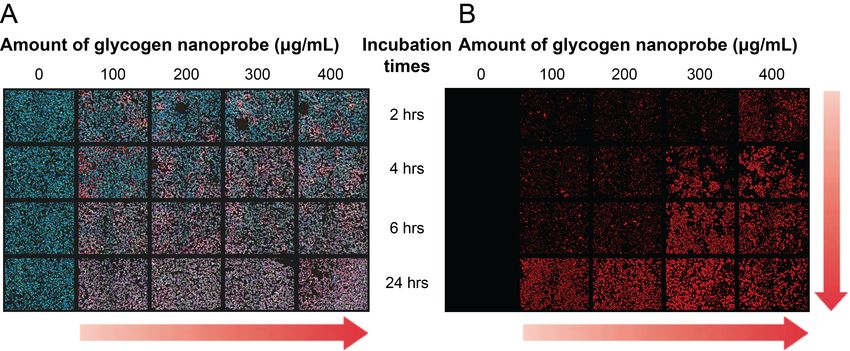
Figure 4.6 Representative overview of part of the 96-well plate layout used for the HTI
experiment of Melmet 5 pGF1 (A) and the red image channel for H1_DL2 (B).
Figure 4.7 Intensity graphs on Dyo-615 fluorescence for Melmet 1 pGF1.
Figure 4.8 Intensity graphs on Dyo-615 fluorescence for Melmet 5 pGF1.
Figure 4.9 Intensity graphs on Dyo-615 fluorescence for H1_DL2.
Figure 4.10 Confocal images of a single H1 cell.
Figure 4.11 Cell metabolism graphs of Melmet 1 pGF1 with increasing exposure times
with the glycogen nanoprobe in multiple 96 well plates.
Figure 4.12 Cell metabolism graphs of Melmet 5 pGF1 with increasing exposure times
with the glycogen nanoprobe in multiple 96 well plates.
Figure 4.13 Cell metabolism graphs of H1_DL2 with increasing exposure times with the
glycogen nanoprobe in multiple 96 well plates.
Figure 4.14 Representative monolayer wound healing micrographs of Melmet 1 pGF1
cells.
VI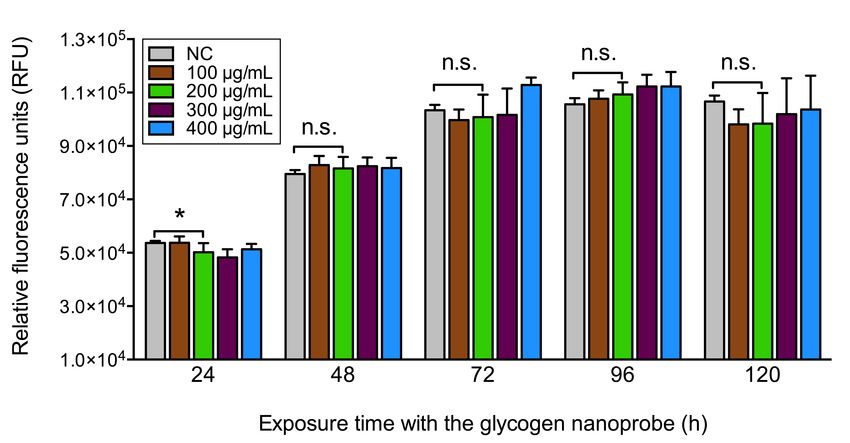
Figure 4.15   Quantification of monolayer wound healing.
Figure 4.16   Representative microscopy images for Melmet 1 pGF1 (A-E), Melmet 5 pGF1
              (F-J) and H1_DL2 (K-O) up to five days after staining the cells with the
              glycogen nanoprobe.
Figure 4.17   Temporal changes in mean cellular fluorescence intensity measured at the
              timepoints indicated on the x-axis in hours.
Figure 4.18   Cell proliferation and death for Melmet 1 pGF1.
Figure 4.19   Cell proliferation and death for Melmet 5 pGF1.
Figure 4.20   Cell proliferation and death for H1_DL2.
Figure 4.21   Representative images of Melmet 1 pGF1 (A), Melmet 5 pGF1 (B) and
              H1_DL2 (C) colonies.
Figure 4.22   Five nod/scid mice injected with 1·106 H1_DL2 cells two weeks prior to BLI.
Figure 4.23   Five mice injected with 1·106 H1_DL2 cells four weeks earlier.
Figure 4.24   T1 relaxation times for Melmet 1 pGF1 phantoms containing various cell
              concentrations as indicated on the x-axis.
Figure 4.25   T1 relaxation times for Melmet 5 pGF1 phantoms containing various cell
              concentrations as indicated on the x-axis.
Figure 4.26   T1 relaxation times for H1_DL2 phantoms containing various cell
              concentrations as indicated on the x-axis.
Figure 4.27   T1 weighted MRI images before (left) and after (middle and right) contrast
              agent administration of glycogen nanoprobe.
Figure 4.28   T1 weighted MRI images before (left) and after (middle and right) contrast
              agent administration of Omniscan.
Figure 4.29   T1 intensity measurements of the flank tumor in T1 weighted images before
              and after contrast agent administration at repetition times (TR) 600 and 1 000/1
              200 ms.

                                             VII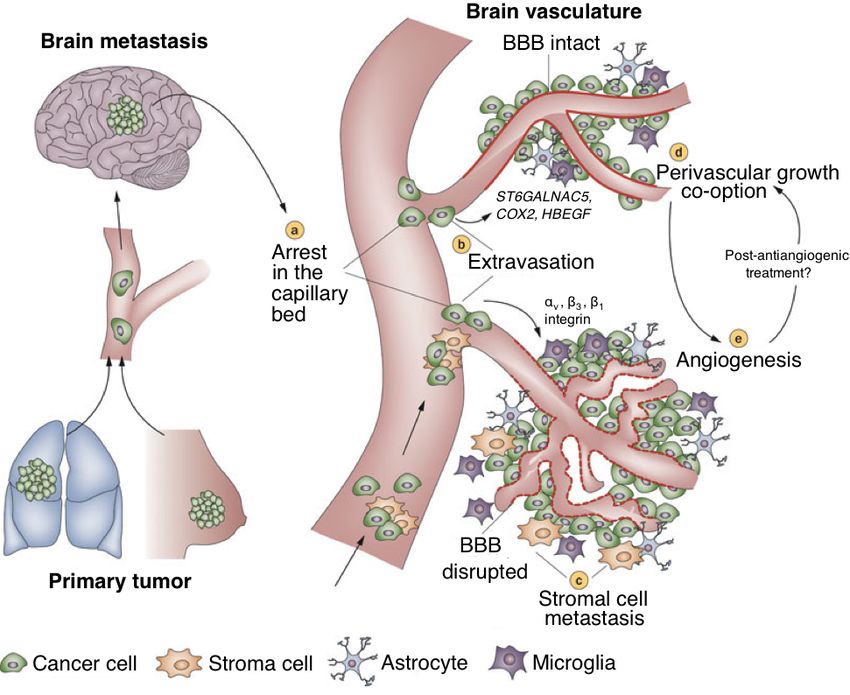
Table of contents

1.
   Introduction ......................................................................................................................... 1

   1.1 Malignant melanoma: Incidence and biological aspects .................................................. 1

   1.2 The metastatic process with emphasis on brain metastases ............................................. 2

   1.3 Model systems to study cancer......................................................................................... 5

       1.3.1 In vitro cell culture .................................................................................................... 5

       1.3.2 Animal tumor models ................................................................................................ 7

   1.4 In vitro cell viability assays .............................................................................................. 7

   1.5 Preclinical cancer imaging ............................................................................................... 8

       1.5.1 Light and fluorescence microscopy........................................................................... 8

       1.5.2 High throughput imaging (HTI) ................................................................................ 9

       1.5.3 Magnetic Resonance Imaging (MRI) ...................................................................... 10

       1.5.4 MRI phantoms ......................................................................................................... 12

   1.6 Nanomedicine................................................................................................................. 12

       1.6.1 Novel glycogen nanoprobe...................................................................................... 13

2.
   Aims .................................................................................................................................. 15

3.
   Materials and methods ...................................................................................................... 16

   3.1 General cell culture work ............................................................................................... 16

   3.2 In vitro imaging experiments ......................................................................................... 17

       3.2.1 Pilot project: Cellular internalization of the nanoprobe .......................................... 17

       3.2.2 HTI experiments: Determination of suitable nanoprobe doses ............................... 18

       3.2.3 In vitro MRI: Verification of nanoprobe doses from HTI experiments .................. 20

       3.2.4 Confocal imaging: Intracellular location of the nanoprobe .................................... 21

       3.2.5 Monolayer wound healing assay: Cellular migration ............................................. 22

       3.2.6 Duration of cellular fluorescence: Nanoprobe clearance ........................................ 22

       3.2.7 Soft agar assay: Investigation of the cells in a 3D environment ............................. 23

   3.3 Resazurin assay: Cell viability ....................................................................................... 24

   3.4 Pilot in vivo experiments ................................................................................................ 24

4.
   Results ............................................................................................................................... 26

   4.1 Pilot project: Cellular internalization of the nanoprobe ................................................. 26

   4.2 HTI experiments: Determination of suitable nanoprobe doses ...................................... 31

   4.3 Confocal imaging: Intracellular location of the nanoprobe ........................................... 33


                                                                      VIII
4.4 Resazurin assay: Cell viability ....................................................................................... 34
4.5 Monolayer wound healing assay: Cellular migration .................................................... 36
4.6 Duration of cellular fluorescence: Nanoprobe clearance ............................................... 37
4.6.1 Cell proliferation and death ..................................................................................... 38
4.7 Soft agar assay: Investigation of the cells in a 3D environment .................................... 40
4.8 Bioluminescent imaging (BLI): Tumor take and development ..................................... 41
4.9 MRI ................................................................................................................................ 42
4.9.1 In vitro MRI: Verification of nanoprobe doses from HTI experiments .................. 42
4.9.2 Pilot in vivo experiment........................................................................................... 44
4.10 Histology ...................................................................................................................... 45
5.
Discussion ......................................................................................................................... 46
5.1 Cellular fluorescence experiments ................................................................................. 47
5.2 Cell viability ................................................................................................................... 53
5.3 Cellular migration .......................................................................................................... 54
5.4 MRI experiments ............................................................................................................ 55
5.5 Concluding remarks ....................................................................................................... 59
5.6 Future perspectives ......................................................................................................... 60
References ................................................................................................................................ 62
IX1. Introduction
1.1 Malignant melanoma: Incidence and biological aspects
Malignant melanoma of the skin, hereafter referred to as melanoma, is an aggressive type of
cancer, which originates from melanocytes located in the epidermis of the skin (1). During the
past 50 years, a steadily increasing occurance has been detected globally and in 2008, the
annual incidence was estimated to be 200 000 individuals worldwide (2). A considerable
portion of these cases is manifested in fair-skinned populations in developed countries where
USA, Australia and the Nordic countries present with the highest rates. In developed
countries, melanoma is the sixth most frequent type of cancer, and 46 000 deaths are
registered as a consequence of the disease every year (3). Although melanoma only accounts
for 5 % of all skin cancers, it is responsible for 80 % of skin cancer related deaths (4, 5). The
growing occurrence has been attributed to more frequent exposure to sun radiation, however
this environmental risk factor is accompanied by skin phenotype and family history of certain
inherited mutations (6).
In general it often appears that the incidence of cancer occurs more frequently with increasing
age (7). In Norway, individuals within the age group 50–70+ are most often afflicted (8). This
is in orchestra with the statement above, conceivably due to an accumulation of somatic
mutations and immune system regression with growing age (9, 10). In the case of melanoma
however, the incidence in Norway unveils a peak at the age 15–49 for women and 25–49 for
men (8). This suggests that a younger population is affected, which is in disagreement with
the traditional idea of cancer mainly influencing the elderly.
As in general carcinogenesis, melanoma is also presumed to develope in a stepwise pattern
from a focal origin such as a precursor neoplasm. It has been suggested that the onset of
malignancy is dependent on multiple mutations in several cell signaling pathways (Figure 1.1)
(11). In melanoma development, it is often distinguished between radial and vertical growth
phases as illustrated in Figure 1.1 (12). Radial growth is characterized by an in situ lesion
with melanocytic growth occuring by cell proliferation horizontally in the basal layer of the
skin (4). At this stage the cells have not transformed, and therefore do not have any cancer
cell-related properties such as angiogenesis or ability to metastasize. Provided enough time,
this phase may be substituted by vertical growth (Figure 1.1). During this juncture, the
1neoplasm grows downward and penetrates dermis and a nodular or palpable lesion on the skin
often occurs (4, 13). Accompanied with the vertical growth phase is an accumulation of
multiple mutations (14), which challenges the prognostic power of genetic expression (15).
The prognosis of melanoma is therefore dependent on clinical manifestation at the primary
site, histological findings as well as the number, size and placement of secondary tumors (15).
Figure 1.1: Melanoma progression. Subsequent of melanocytic proliferation, atypical nevus may
form in the epidermis layer. This is an abnormal growth of melanocytes, which can result in a pre-
malignant lesion. Melanocyte proliferation will then take place horizontally in the skin, characterized as
a radial growth phase, where tumor growth rarely occurs deep into dermis. After several possible
cellular mutations, a vertical growth phase may take place, in which malignant melanoma cells invade
the basement membrane while proliferating vertically. Subsequently, the melanoma cells can acquire
further malignant properties enabling them to spread to distant organs such as lungs, brain and liver.
Figure created with items from Somersault (16) and American Association for Cancer Research (17).
Tumor thickness, as illustrated in Figure 1.1, was introduced by Alexander Breslow in 1970
and measures the depth of the melanoma lesion in mm (18). In this system, the expected
prognosis is reduced with increasing tumor thickness or depth. This is still used in the clinic
today, as it is a reliable predictor of tumor invasiveness, metastatic potential and prognosis
(4).
1.2 The metastatic process with emphasis on brain metastases
Metastasis can be described as a series of linked sequential steps in which cancer cells
disseminate from their origin to a secondary site. A very frequently reported outcome for
melanoma patients (75 %) is the formation of multiple brain metastasis (19-21), displaying
2the highest tendency of any cancer to disseminate to the central nervous system (22). With a
median survival estimated to a few months, secondary tumors to the brain consequently
correlate with a low prognosis (19, 23).
As melanoma neoplasms grow beyond ∼1 mm3, they depend on vascularization to receive
oxygen and nutrients (24). At this point, hypoxia often occurs as a result of tumor growth,
which triggers angiogenesis. Vascularization can be obtained by several mechanisms of which
vascular co-option through pre-existing blood vessels and angiogenic sprouting from pre-
existing vessels are two examples (25-28). The initiation of tumor vascularization is a balance
between proangiogenic and inhibiting factors, where vascular endothelial growth factor
(VEGF) and thrombospondin-1 (TSP-1), respectively, are representative examples. Further
vessel development depends on yet other proangiogenic factors, such as angiopoietin and Tie-
R (29). In addition to further tumor growth, angiogenesis also provides access to the
vasculature which subsequently allows tumor cell dissemination (24). Prior to local invasion
into dermis, migrating melanoma cells often acquire an epithelial-mesenchymal transition
(EMT)-like phenotype characterised by altered cell-cell interaction properties (1). Normally,
E-cadherins mediate melanocyte contact with five to eight surrounding keratinocytes.
However, during melanoma progression this contact is lost by downregulation of E-cadherin
(1, 30). In addition to this detachment of melanoma cells from its surroundings, altered
cellular adhesive features are obtained, which enable them to attach to new sites (30). Local
invasion includes the employment of different proteases to degrade extracellular matrix
(ECM), such as matrix metalloproteinases (MMPs). Several components are involved in the
simultaneous movement of melanoma cells, such as interacting integrins, components of the
actin cytoskeleton and focal adhesion complexes (31). During degradation of ECM, cell
motility and cell morphology is constantly altered (32). Melanoma cells often intravasate to
the lymphatic or hematogenous circulatory system (33), in which they are subjected to
immunological and mechanical barriers during transport to distant organs.
Although melanoma cell dissemination can occur through lymphatogenous and hematogenous
paths, the cells have to gain access to the blood circulatory system in order to extravasate into
brain tissue. Once a subset of a migrating cell population reach a secondary organ, such as the
brain, they may be trapped in for instance vascular branch points due to size restrictions or
reduced flow in capillaries (Figure 1.2 A) (28).
3Figure 1.2: Formation of brain metastases. Once a subset of the primary tumor manages to
approach the brain, they are caught in vascular beds (a). Following extravasation (b), secondary
tumors may grow further by preexisting blood vessels (c) or by employing angiogenesis (d). Adapted
from Eichler, A.F. et al., 2011 (28), modified with larger fonts.
Subsequent passage across the blood-brain barrier (BBB) depends on cellular adhesion to
local endothelium before extravasation into the brain parenchyma is possible (33). The BBB
is situated at the level of cerebral capillaries, and separates circulating blood from
cerebrospinal fluid surrounding neuronal tissue. Movement of solutes and cellular elements
are thus restricted from entering the brain parenchyma by this protective impediment. Despite
this, certain types of cancer cells, such as from melanoma, manage to extravasate and
subsequently create secondary tumors within the brain (34). After attaching to endothelial
cells in the brain microvasculature, a remodeling of the capillary network occurs, and the
tumor cells transmigrate through BBB and thus extravasate into the brain parenchyma (24,
35). The exact mechanism for this is not known (36), but it has been suggested that the BBB
might have a sustaining function in the formation of brain metastases (34). Previously, it has
been reported that migrating melanoma cells located in capillaries often express the Ig family
cell adhesion molecule L1CAM (37), mainly expressed in neuronal and cancerous tissue (38).
Additionally, the sialyltransferase ST6GalNaC5 (39) has also been identified as a mediator of
tumor cell transmigration through BBB (37, 40). Other proteins targeting specific organs
might also be expressed by the tumor cells (36). Additionally, activation of integrins has been
4proposed to influence endothelial tumor cell adhesion (28). Thus, extravasation of migrating
melanoma cells through blood vessels may occur. Subsequent extravasation, secondary
macrotumors may begin to form (Figure 1.2 B), termed colonization (24).
Colonization in the new milieu is dependent on paracrine or autocrine signaling of the tumor
cells to stimulate further proliferation, in which the «seed and soil theory» postulated by Paget
is relevant. This theory proposes that the occurrence of brain metastases is not random, but
instead certain tumor cells, «the seed», have an attraction or affinity to the new environment,
«the soil». If the host tissue allows for tumor growth and cell proliferation continues,
angiogenesis is induced by the same mechanisms as for primary site tumors (Figures 1.2 D
and E) and the lesion grows further (41). For brain metastasis, secondary tumors either
employ angiogenesis or grow along pre-existing blood vessels by co-option (28). In addition
to secondary tumors to the central nervous system (CNS), other common sites secondary to
melanoma are subcutaneous tissue, lymph nodes, lungs, liver and bones (42).
1.3 Model systems to study cancer
In order to study cancer cell dissemination and solid tumor growth, suitable model systems
are necessary. Such systems should represent tumor growth seen in patients as close as
possible. Several in vitro and in vivo culture systems have been developed in the past, and a
few of these are described in this chapter.
1.3.1 In vitro cell culture
The current understanding of cancer has partly been derived from tumor cell lines developed
from primary and secondary tumors (43). Such cultured cells have been extensively used
within the field of biomedicine for a number of reasons: Essential cancer cell features such as
proliferation and an abnormal karyotype are maintained, and the method can easily be
implemented in different research layouts with varying purposes (22). By growing cells in a
monolayer in cultured conditions, a controlled growth environment is provided, which
enables regular observation of the sample (Figure 1.3 left). Despite these advantages, and the
fact that the technique is easy to use and repeat, certain limitations of this in vitro assay
should be emphasised. Because cell behaviour to a great extent depends on interactions within
a 3D environment, this aspect is compromised when growing cells in monolayer on flat dishes
(44-47). Still, cancer research is excessively reliant on monolayer or 2D cell culture (43, 48),
5and it can be considered a good starting point for cell based research as well as standardized
methods for drug screening. To address some of the limitations associated with monolayer
culture such as altered protein expression (47), cell proliferation (45) and metabolism (44,
46), 3D cell cultures or spheroid models can be implemented in experiment designs. These
have been described as superior compared to monolayer cultures (43). Instead of adhesion and
migration occuring in only 2D, cells cultured in 3D layouts have the ability to adhere,
proliferate and migrate in an additional dimension (Figure 1.3 right) (48).
Figure 1.3: Cell culture illustration. The left column illustrates how cellular growth in media occurs
flat on a plastic dish, constricted to the x-y plane of a culture flask. The right column shows how cells
seeded in for instance a two-layered agar layout are provided a 3D environment, which results in
altered cell shape and growth pattern. Figure created with symbols from Somersault (16).
Various 3D cell culture experiment designs exist (43), where the additional dimension is
accompanied by an improved modeling of the real in vivo situation. It has been shown that
cell signaling, cellular stiffness and shape differs between the two layouts, and it can be stated
that 3D cultures offer more physiological conditions, more similar to an in vivo situation, for
cell lines compared to monolayer cultures. For continous cancer cell lines, this implies that
true tumor cell characteristics are mimicked for cellular spheroids with impaired access to
oxygen and nutrients centrally, surrounded by adhered aggregates or clusters of additional
cells (49). Several issues related to how the additional dimension in 3D cultures provide
altered conditions, still remain to be properly explained. Still, it is known that
6microenvironmental factors promote cell function, and these are modulated by different
means in 2D and 3D cultures (48).
1.3.2 Animal tumor models
To study tumor development and predict therapeutic efficiency of novel pharmaceuticals in
cancer research, several pre-clinical animal tumor models have been developed, mostly based
on the use of small rodents. To grow tumors in mice for instance, extractions of tumor
material such as continous cell lines are regularly injected into animals, either subcutaneously,
into the organ of which the cells originated from (orthotopic) or into the blood stream
(ectopic). Also, genetically engineered mice holding a particular genotype are often used as
model systems (50). The discovery of T- and B-cell-deficient mice, nonobese diabetic severe
combined immunodeficiency (nod/scid) (51), permits the transplantation of established in
vitro cell lines or tumor biopsy material into immuno-deficient model mice, to efficiently
reassemble solid tumors after a lagtime of a few weeks (50). Although such preclinical
models mimic a real situation more closely than in vitro cell cultures (52), there are several
factors that retain such techniques from being ideal. For instance, tumors often form more
rapidly in animal models with a smaller latency period compared to a cancer patient in a
clinical setting. Also, the use of nod/scid mice in itself can be a disadvantage, as tumor
development after xenograft in immunedeficient organisms differs from cancer patients (52).
Nevertheless, the combined knowledge of studies on animal tumor models have added
increased understanding of the cancerous progression, given that the most suitable model
system for the specific scientific problem is chosen (24).
1.4 In vitro cell viability assays
A variety of methods to assess viability of cultured cells and cytotoxity of certain compounds
of interest exist (53). These should be sensitive, rapid and inexpensive (53-55), and are often
subdivided into four groups depending on the method of measurement: Colonogenic,
radioactive, colorometric and fluorometric (53, 56). Resazurin, which has been used since the
1950s (55), has the advantage of being non-toxic (57), and it can be used both as a
colorometric and fluorometric assay, of which it has been indicated that the latter gives more
precise measurements (55). Resazurin holds a major change in perceived hue when used as an
indicator on oxidation–reduction in human cells. Resazurin is intrinsically a weak fluorescent
of purple color, but is reduced to the highly fluorescent pink resorufin. This transformation
only occurs in metabolically active and thus viable and proliferating cells. Dead cells do not
7have the same ability to perform this activity, and on this basis, the colored product correlates
with viable cells in culture. It is therefore possible to use this assay to predict cytotoxicity of
any compound of interest by reading off the results at wavelength 530-560 nm excitation and
590 nm emission (54, 55, 57, 58).
1.5 Preclinical cancer imaging
The field of image sciences has proven to be incredibly valuable in cancer research, and has
together with clinical observations contributed greatly to our comprehension of the
development and treatment of malignancies (59-61). A large amount of preclinical imaging
techniques to visualize cancer cells and tumors exist, ranging from in vitro methods at cellular
levels, to sub-millimeter in vivo approaches. Each modality has its benefits and disadvantages,
and a single technique alone does not posess all the required capabilities for complete
detection. Therefore, the possibility of dual or multimodal signal reading from one common
probe enables visualization of samples with more than one modality (62, 63). In the
following, the imaging modalities used in this project will be discussed briefly.
1.5.1 Light and fluorescence microscopy
Varying microscopic approaches are widely used in cell biological research. The non-invasive
nature of light microscopy together with the feasibility to introduce fluorochromes makes it
the technique of choice for live-cell imaging (64). Light microscopes can be used to
determine cell viability as well as depicting pathological cell conditions.
In all its simplicity, light microscopes consist of a light source, magnifying lenses and often
also an image acquisition unit (64). In addition, mercury lamps are often incorporated in
widefield microscopes for excitation of fluorochromes and subsequent induction of emission.
A bandpassfilter located between the light source and the cell sample efficiently restricts the
range of excitation light. Because the emitted light has a longer wavelength than the excited,
an emission filter (bandpass or longpass) is necessary between the detector and the cell
sample. The excitation light is thus blocked, and the final image is prevented from distortions.
The images are often detected by a charged couple device (CCD), and displayed on a
computer screen (64).
Fluorescence is a molecular characteristic of certain substances where light of a given
8wavelength is absorbed, which transfers electrons to an orbital of higher energy, introducing
an excited state. As electrons fall back into original energy states, excess energy is released by
means of light at a longer wavelength and thus lower energy (Figure 1.4). The emitted light
can be detected with the aid of optical filters in customized microscopes (64).
Figure 1.4: The principle of fluorescence. When light of a given wavelength is absorbed, an atomic
electron is transferred to an orbit of higher energy. After the lifetime of the fluorescence agent, this
excited state is substituted by the original state as the electron falls back into its previous energy level.
As this happens, excess energy is given off by means of a light photon at a different wavelength.
Adapted form Ishikawa-Ankerhold, 2012 (64).
Fundamentally, fluorescent agents or fluorochromes are used as potent contrast enhancers in
microscopic imaging (64). Multi-fluorescent imaging is considered a significant tool to
analyse cellular and biological events, which is further amplified by the expanding range of
available fluorochromes (65). As emitted fluorescent light can be amplified to the microscopy
detector, cellular structures can be visualized more easily than without fluorochromes. This
relies on the effectivity of the system to pass light to either a CCD or photomultiplier tube
(PMT), and simultaneously block excited light. Examples of fluorescent substances are green
fluorescence protein (GFP), a reporter molecule that is intrinsically fluorescent, and Hoechst
33342, often used to analyse DNA.
Visualization of fluorescent agents can also be enabled with confocal microscopy. Laser
scanning techniques are commonly used, in which a laser beam is focused onto the sample
and scanning in the x-y plane occurs line-by-line. What sets confocal techniques aside from
conventional fluorescence microscopes is a pinhole used to eliminate scattered light.
Ultimately this provides high-resolution micrographs with the entire sample in focus (66).
1.5.2 High throughput imaging (HTI)
HTI, sometimes also referred to as high content screening (HTS), was introduced in the late
91990s, and established a potential for live-cell microscopy of large quantities of cell samples
(e.g. in 96-well plates), implemented in automatic image acquisition sequences (65). HTI has
the capability to acquire data on multi-parametric samples, such as several fluorescent
markers, and also enables repeated image acquisitions over a defined time-span. Large-scale
drug-screening research is often based on high throughput approaches, thereby improving the
productivity dramatically (67). HTI techniques can thus acquire data on large numbers of
samples in a less time-consuming process compared to conventional fluorescence
microscopic methods, without losing valuable information at the level of single cells.
1.5.3 Magnetic Resonance Imaging (MRI)
MRI can be regarded a superior imaging modality, due to excellent soft tissue contrast. It is
also considered a risk-free procedure for the patient, as MRI does not use ionizing radiation.
The essential source of the MRI signal is based on the hydrogen nuclei or protons, which are
abundantly present in tissue. Each proton is positively charged, and is also constantly
spinning around its own axis. According to physics theory, a moving electrical charge of this
kind generates a current, which in turn creates a magnetic field. Stated in other words, each
proton generates its own magnetic field, and can be considered a small magnet. This magnetic
field is also referred to as a magnetic moment. The orientations of all these protons in tissue
are usually randomly directed, creating a net magnetic moment, which is zero. However,
when an object such as a patient or animal is placed within the main magnet of an MRI
system, the protons will align either parallell or anti-parallell with the main magnet field, B0,
inside the scanner. The majority of protons will align parallell, as this requires the least
energy. The difference between the number of protons aligned parallell and the number of
protons aligned anti-parallell is usually very small. However, this difference increases with
elevated magnetic field strength, and is the source for generating a signal which in the end is
reconstructed to become part of the MR image (68).
When the protons are put inside the strong magnetic field B0, they will move in a way called
precession. This movement is similar to what is seen in a spinning top, as the protons wobble
but do not fall over during spinning. Thus the sum magnetic field from these protons, which is
now regarded a single vector M0, rotates around B0 with a precession frequency determined
by the magnetic field, termed the Larmor frequency (69).
10In order to detect a signal from the precessing protons, the protons need to be manipulated.
Radiofrequency (RF) pulses are then switched on and off, with the purpose of forcing the
protons to fall out of the alignment with B0. The disturbance occurs when energy with the
same frequency as the precession frequency is applied to the tissue, a phenomenon called
resonance. The net magnetic moment will as a consequence move out of alignment with B0,
and the protons are moved into the transverse plane, or the x-y plane (Figure 1.5 B) (68).
Figure 1.5: Relaxation after an RF pulse. The hydrogen protons are initially aligned with the main
magnetic field, B0 (A). After the introduction of an RF pulse which manipulates the protons, the
longitudinal magnetism will decrease and transverse magnetism (in x-y plane) is increased (B). When
the RF puse is switched off, the protons will start to fall out of phase, and as the transverse
magnetisation decreases, longitudinal magnetisation increases (C). The precession continues
throughout recovery of longitudinal magnetisation (D). Regain of longitudinal magnetism is called T1
recovery, and loss of transverse magnetism is called T2 decay. Adapted from Currie, 2013 (68),
modified with figure text.
The use of an RF pulse will move some of the protons from the parallell to the anti-parallell
state, resulting in a reduction in overall longitudinal magnetism. Also the RF pulse makes the
protons move in the same direction, or phase. The result is that a magnetisation occurs in the
transverse plane, moves at the Larmor frequency and thus generates an alternating voltage
that can be detected in antennas or RF coils placed within close proximity. This results in the
formation of an MRI signal. When the RF pulse is deactivated (Figures 1.5 C and D), the
protons will start to move out of phase and lose energy, termed «proton relaxation». This
takes place in two ways; transverse magnetism is referred to as T2 or spin-spin relaxation, and
longitudinal magnetism returns to the initial situation called T1 or spin-lattice relaxation. The
speed at which T1 relaxation occurs is dependent on the properties of the surroundings.
Therefore, different tissues or arrangements with hydrogen to other substances will produce
different T1 relaxation times. The time constant T1 is the time it takes until longitudinal
magnetism is regained to 63 % of its final value. T2 relaxation describes loss of in-phase
11protons due to inhomogeneities within the local tissue and within B0. The time constant T2
describes the time it takes before transverse magnetism is reduced to 37 % (68).
Varying combinations of RF pulses and imaging parameters constitute different imaging
sequences, broadly categorized into spin-echo and gradient-echo sequences. In this way,
tissues can be weighted by different means, dependent on the purpose of the image sequence.
The images are constructed with the aid of gradients in three dimensions: The slice-selection
gradient, GSS, is applied in a short bandwidth of frequencies matching the larmor frequency. A
slice within the biological object is then excited, the thickness of which is dependent on the
steepness of the gradient. For spatial signal encoding, phase (GPH) and frequency (GFR)
gradients are employed. The application of these enables the detection of signal in phase and
frequency for location within the selected slice. This is repeated in several steps for the entire
slice, with the GPH altered for each step. Thus, multiple signal echoes are acquired and stored
in a raw data matrix termed K space, before this is Fourier-transformed to the spatial content
of MR images (68). The image reconstruction process for MRI signal is a complex matter
(70), of which a further description is beyond the scope of this thesis.
1.5.4 MRI phantoms
MRI phantoms can be used to evaluate the application of novel contrast agents (71).
Favourable features of such phantoms include comparable relaxation times to biological
tissue, temporal stability, low costs and that they are easily available and simple to handle
(71). A range of different materials for this purpose exists, and water, agar and agarose, which
is a purified form of agar, remain the most common (71, 72). Phantoms mimicking biological
relaxation times can according to Yoshimura (2003) be obtained using concentrations of agar
and agarose at 1.5-3 % and 0.8-4 %, respectively (73). Based on acquired image series of
such phantoms, it is possible to calculate the MRI signal through signal equations, as well as
T1 and T2 relaxation constants (71).
1.6 Nanomedicine
Normally, single image modalities such as for instance MRI or computer tomography (CT)
with Gd or iodine-based contrast agents, respectively, are used to diagnose and study tumor
progression. Nanomedicine, on the other hand, is the application of materials of nano-scale
size, either for therapeutic or diagnostic purposes (74-76). Depending on the particular
12nanomaterial used, several advantages may be obtained compared to conventional approaches
in diagnostics and therapy: Multiple contrast agents or optical tracers can be integrated into
one common probe, thereby featuring detectable agents during their biological paths when
injected into model animals or patients. Also, by modifying such nanoprobes with for instance
antibodies, they can be targeted to specific locations. It is also possible to use nanoprobes for
enhanced therapeutic delivery. Therapeutic agents such as doxorubicin might be packed onto
nanoprobes constructed to respond to certain stimuli, exemplified by acidic pH, to release
drugs (74, 77). Thus, drug-delivery may be optimized, while undesirable effects of the
treatment, such as toxicity, are minimized (63, 64).
Recently, the term «theranostics» or «theragnosis» has been implemented to describe the
combination of therapy and diagnostics using common nanomaterials, thereby introducing a
new dimension in cancer research (62, 63, 74, 77). Combining signal detection by means of
biomedical imaging with localized drug delivery is unique for nanomaterials (62). Varying
substances are used to construct such probes, ranging from organic to non-organic materials
(62, 74). Targeted nanomaterials are modified with surface peptides or antibodies specific for
the target-cell, whereas passive nanomaterials are constructed so that their size does not
contradict the enhanced permeation and retention (EPR) effect, which is often the targeting
mechanism for passive nanomaterials (74). EPR is the result of the irregular vascularization
and morphology of tumors, and thus abnormal transport dynamics. This often results in
molecules of nano-scale size accumulation inside tumors (78).
1.6.1 Novel glycogen nanoprobe
In 2012, Filippov and colleagues at the Institute for Experimental Medicine in Prague
developed a nanoprobe that consists of biodegradable glycogen (63). The present glycogen
material originates from oyster and the nanoprobe is through dynamic light scattering (DLS)
experiments found to have a dynamic radius (RH) of 54.4 nm. After initial construction of the
probe, it was subsequently modified to encompass 3.19 weight percent (wt%) of the MRI
contrast agent Gadolinium-DOTA (Gd) in addition to 0.33 wt% of the fluorescent marker
Dyomics-615-NHS ester (Dyo-615). Gd is a paramagnetic contrast agent and the governing
type used in clinical MRI (79). It has seven unpaired electrons, and because electrons have a
great charge-to-mass ratio, Gd produces a major magnetic moment. It is a T1 agent, which
means it produces bright areas of contrast enhancement in T1 image sequences. Gd is useful in
13diagnostics of brain tumors, as the blood-brain barrier (BBB) often is compromised in the
tumors and T1 agent thus leaks into the lesions (80). To reduce the toxic nature of Gd, it is
chelated to different ligands, such as for instance DOTA used in our glycogen nanoprobe. Gd
will affect the T1 value according to Figure 1.6 A.
Figure 1.6: Illustrations of the contrast agents encompassed in the glycogen nanoprobe. A: MR image
contrast expected to be found with the glycogen nanoprobe (T1 agent). Adapted from Chen, 2013 (77).
Modified with ”no contrast” and larger fonts. B: Emission and excitation spectrum of Dyo-615. Adapted
from Czerney, 2011 (81). Modified with larger fonts.
The second segment of the probe, Dyo-615 is an indirect fluorochrome that emits light at
wavelength 643 nm when excited by light with a shorter wavelength, and therefore higher
energy, in accordance with Stokes shift (Figure 1.6 B). Thus, the probe can be used in a
multimodal setting due to compatibility between MRI and fluorescence microscopy imaging.
Furthermore, it is possible to attach therapeutic agents to the nanoprobe, which gives it
potential as a theranostic unit. Although biodegradable, glycogen is not affected by amylases
in the bloodstream, and the probe can thus be used as a passive nanomaterial via intravenous
injection routes.
142. Aims
Melanoma can be regarded a global and contemporaneously a national source of difficulty
among relatively young individuals often awaiting a poor prognosis. It can thus be argued that
further attention should be paid to the investigation of tumor spread and therapeutic
efficiency. For this purpose the Translational Cancer Research Group at Department of
Biomedicine, University of Bergen have developed animal models where cell lines derived
from human melanoma metastases are injected into immunodeficient mice. This system
closely mimics the dissemination observed in patients. Appropriate contrast agents are
essential in this context, either to visualize single cancer cells or tumors within model
animals. The superior goal of this Master thesis will thus be to describe applications of the
theranostic glycogen nanoprobe presented in Chapter 1.6.1 for use in a metastatic melanoma
model, which has not been done previously. Several imaging modalities will be used for this
purpose, such as fluorescent light microscopy, high throughput imaging and MRI. If
successful, this nanoprobe can offer additional advantages over established contrast agents in
MRI, as it is possible to use it in a theranostic setting. Thus, by tracing the glycogen
nanoprobe within a model animal or patient by MRI, it is possible to visualize where
therapeutic agents attached to the probe are localized and also to monitor the progression of
therapy.
Four subaims have been defined within the work with this thesis:
1. Use microscopy to demonstrate cellular internalization of the considered nanoprobe
and subsequently conclude with an optimal dose for in vitro use
2. Investigate cell viability after labeling cells with the nanoprobe, and study nanoprobe
clearance from intracellular sites
3. Verify the selected nanoprobe dose by scanning MRI phantoms with prelabeled cells
to demonstrate reduced T1 relaxation times
4. If time permits, test the nanoprobe on immunodeficient mice with tumors as part of a
pilot in vivo experiment with nanoprobe doses matching Gd agents commonly used in
a clinical setting
153. Materials and methods
3.1 General cell culture work
Three different metastatic melanoma cell lines were used in this project: Melmet 1 pGF1
originates from a subcutaneous tissue extraction of a 36 year old female. Melmet 5 pGF1 is
derived from a lymph node metastasis in a female at 56 years of age (82) and H1_DL2 is
derived from a secondary tumor in the brain of a 38 year old female (52). All three cell lines
were transduced with the genes for green fluorescent protein (GFP), whereas H1_DL2 also
was transduced with the Luciferase Firefly gene. For confocal imaging as described in
Chapter 3.2.4, H1 cells without GFP and Luciferase were used (52). Solutions and
disposables frequently used for cell culture are listed in Table 1.
Table 1: Equipment used for cell culture
NAME SUPPLIER
ALT DMEM:
450 mL Dulbeccos Modified Eagles Medium Sigma-Aldrich Inc., MO, USA
50 mL Heat inactivated fetal calf serum (FCS) Fischer Scientific, MA, USA
10 mL L-Glutamine, 200 nM BioWhittaker, Verviers, Belgium
10 mL Penicillin/Streptomycin (PEN-STREP), 100 µL/mL BioWhittaker
16 mL Non essential amino acids 100X BioWhittaker
0,1 mL Plasmocin 25 mg/mL Invivogen, CA, USA
Dulbeccos phosphate-buffered saline (PBS) Sigma-Aldrich Inc.
Trypsin EDTA, 0.25 % BioWhittaker
Freezing solution 1:
9 mL ALT DMEM + 1 mL FCS
Freezing solution 2:
8 mL 1xPBS + 2 mL 100 % dimethyl sulphoxide (DMSO) Sigma-Aldrich Inc.
Disposable pipettes: 5, 10 and 25 mL Sigma-Aldrich Inc.
The cell lines were cultured in monolayer with ALT DMEM growth medium and kept in an
incubator at 5 % CO2 and 100 % humidity at 37° C. During experiment periods, the cells were
regularly trypsinated and subcultured when almost confluent: After removing the old growth
medium, the cells were washed with 0.03 mL/cm2 PBS followed by trypsination with 0.03
mL/cm2 trypsin for approximately three minutes. Equal amounts of ALT DMEM were then
added to inhibit further trypsin effects. For subculturing, approximately a third of the
suspension was transferred to new culture flasks with blue filtered caps (25, 75 or 175 cm2,
Nunc AS, Roskilde, Denmark) containing a total cell suspension/growth medium volume at
0.2 mL/cm2. For storage over longer periods, the cells were cryopreserved and kept in liquid
nitrogen at -196° C: After trypsination, 0.03 mL/cm2 ALT DMEM was added and the solution
was resuspended before transferred to a 15 mL tube (Sigma-Aldrich Inc.). The cells were then
16centrifuged at 900 rpm for four minutes. The supernatant was removed, and freezing solution
1+2 described in Table 1 were added and the cell pellet resuspended. The cell solution was
evenly divided between several 1 mL cryotubes (Thermo Scientific Inc., MA, USA). The
tubes were kept at -80° C before they were placed in the nitrogen tank after 24 hours. For cell
thawing, the cryotubes were retrieved from the nitrogen tank, spun down, the freezing
solution was removed and the cells were placed in 25 cm2 culture flasks with 10 mL fresh
growth medium. All work with cultured cells was done in sterile conditions, in a laminar flow
cabinet bench.
3.2 In vitro imaging experiments
Despite the seeming multimodal advantage of the nanoprobe, it had not been tested
previously on cancer cell lines. Different methods were thus developed for cell labeling with
the nanoprobe prior to varying imaging experiments with microscopy and MRI. For all in
vitro experiments, the glycogen nanoprobe was mixed 1:1 with autoclaved water (milliQ) to
yield a stock solution of 1 mg/mL. All imaging experiments were performed using equipment
at the Molecular Imaging Center (MIC), Department of Biomedicine, University of Bergen.
3.2.1 Pilot project: Cellular internalization of the nanoprobe
The Melmet 1 pGF1, Melmet 5 pGF1 and H1_DL2 cells were seeded in duplicate six-well
plates (Nunc AS), each well with 105 cells in 2 mL ALT DMEM. The cell numbers were
determined using a Countess Automated Cell Counter (Invitrogen, Paisley, UK), according to
the manufacturers instructions. For each cell line, the cell suspension was diluted and
distributed into each well of the six-well plate, and thereafter placed in a CO2 incubator. The
next day the cells were labeled with the nanoprobe at concentrations 5, 10, 20, 50 or 100
μg/mL. Cells in the remaining well in the six-well plate were not labeled and thus used as
negative control (NC). After six hours of labeling in the CO2 incubator, the labeling solution
was removed, and all wells washed with 2 mL preheated ALT DMEM. The cells were then
fixed by adding 2 mL 4 % paraformaldehyde (PFA, Thermo Scientific Inc.) in PBS to each
well. The PFA was removed after 20 minutes, and replaced by 2 mL PBS. The same
experimental setup as described above was used for the second plate after an incubation time
with the nanoprobe for 24 hours.
The six-well plates were then examined using a Nikon TE2000 inverted microscope (Nikon
17Instruments Inc., NY, USA). A consistent study design was provided using the same objective
magnification (20X), constant halogen illumination and the same setting on the correction
collar (1.6) throughout the experiment. Observation of fluorescence signal from Dyo-615 was
enabled through emissionMAX at 638 nm. The following exposure parameters were then used
for the optical agents depicted: Fluorescence: Exposure time 2 000 ms and gain 1.7. Bright
filter: Exposure time 2 ms and gain 1.2.
The micrographs acquired during the pilot project were processed using Photoshop CS5
(Adobe Systems Inc., CA, USA). To provide a realistic rendering of the images, the two
layers were separated using NIS Elements Viewer (Nikon Instruments Inc.), which is the
original software on the microscope. One image from each sample well was processed and
presented in a collage created in Adobe Illustrator (Adobe Systems Inc.). Further, a method
modified from Miller to study cellular fluorescence intensity was used (83). The fluorescence
signal of four cells from four representative micrographs obtained in the pilot project were
measured in Photoshop CS5 one by one. The bright field and fluorescence layers were opened
in the software simultaneously. However, the lasso tool was used on the former layer alone to
mark the region of interest, before the fluorescence layer was made visible in the same
window. The histogram intensity value ranging from 0-255 for 8-bit images was then noted
from the histogram overview. Cell morphology was also studied during image processing.
Further we investigated whether cellular internalization of the nanoprobe occurred for all or a
subset of cells in each sample. The images acquired during the pilot project were therefore
investigated cell-by-cell, to detect fluorescence signal. Binary images were then created to
demonstrate the findings. Appropriate threshold values were sequentially found for the
brightfield and fluorescence layers in Matlab (The MathWorks Inc., MA, USA) for
micrographs of each cell line captured of samples labeled with 5 μg/mL incubated for six
hours. The Matlab command im2bw was used to find usable threshold values. Further, noise
was removed from fluorescence micrographs of Melmet 1 pGF1 using the command
bwareaopen. The resulting binary layers were then superimposed in Photoshop.
3.2.2 HTI experiments: Determination of suitable nanoprobe doses
All three cell lines were grown in 175 cm2 culture flasks until ∼80 % confluence. The cells
were trypsinated and counted as previously described. For each cell line, 100 μL cell solution
18You can also read