Oil: The Next Revolution - THE UNPRECEDENTED UPSURGE OF OIL PRODUCTION CAPACITY AND WHAT IT MEANS FOR THE WORLD
←
→
Page content transcription
If your browser does not render page correctly, please read the page content below

The Geopolitics of Energy Project

Oil: The Next Revolution
THE UNPRECEDENTED UPSURGE OF OIL PRODUCTION
CAPACITY AND WHAT IT MEANS FOR THE WORLD

Leonardo Maugeri

                    June 2012
Discussion Paper #2012-10

Geopolitics of Energy Project
Belfer Center for Science and International Affairs
John F. Kennedy School of Government
Harvard University
79 JFK Street
Cambridge, MA 02138
Fax: (617) 495-8963
Email: belfer_center@harvard.edu
Website: http://belfercenter.org

Copyright 2012 President and Fellows of Harvard College

The author of this report invites use of this information for educational purposes, requiring only
that the reproduced material clearly cite the full source: Maugeri, Leonardo. “Oil: The Next
Revolution” Discussion Paper 2012-10, Belfer Center for Science and International Affairs,
Harvard Kennedy School, June 2012.

Statements and views expressed in this discussion paper are solely those of the author and do not
imply endorsement by Harvard University, the Harvard Kennedy School, or the Belfer Center for
Science and International Affairs.

Cover image: In this Friday, July 17, 2009 file photo, an Iraqi worker operates valves at the
Nahran Omar oil refinery near the city of Basra, 340 miles (550 kilometers) southeast of
Baghdad, Iraq. Iraq's central government warned authorities in the semiautonomous Kurdish
region on Monday that their oil deals with Turkey must have Baghdad's approval. (AP Photo)
OIL: THE NEXT REVOLUTION
THE UNPRECEDENTED UPSURGE OF OIL PRODUCTION
CAPACITY AND WHAT IT MEANS FOR THE WORLD

LEONARDO MAUGERI

                     JUNE 2012
ACKNOWLEDGEMENTS
It is always difficult to keep track of the individuals who contributed to a research work like this,
whether by a quick exchange of opinions, data, comments, or a well-articulated set of
suggestions.

I have an abiding debt to many people of different oil companies who helped me get data and
interpret them correctly. Yet the list of them is too long to be reproduced here.

I have a debt of gratitude for the help and advice I received from some professors of the Harvard
Kennedy School and the Belfer Center for Science and International Affairs, starting with
Meghan O’Sullivan who invited me to join the Geopolitics of Energy Project at the Harvard
Kennedy School and supported me during my first period here, and others along with her, who
agreed to review this paper in spite of their busy schedule: Graham Allison, Henry Lee, and
William Hogan. I also owe a special gratitude to Donald Paul, Bijan Mossavar-Rahmani, and
Jonathan Hine, Jr. who also read the paper and suggested important clarifications and additions.

If I failed to capture the depth of the observations of my reviewers or to correct some point I
alone am to blame.

I owe a special thanks to BP for its funding of the Geopolitics of Energy Project that made my
study possible.

I have a debt towards Leah Knowles, who carefully edited the final version of the paper, and
Amanda Sardonis, who took care of putting the paper in its final form and provided the policy
brief. As always, I could never have begun or finished this work without the sweet support of my
wife Carmen.

For all the help that others gave me, they are certainly not party to any mistakes I might have
made. Even when they expressed some doubt about certain notions or data, they always left me
free to consider or reject their points. I therefore remain the only person responsible, in every
way, for the ideas expressed in this paper – along with any mistakes it might contain.
TABLE OF CONTENTS

    List of Abbreviations and Terms ................................................................................................. i

Executive Summary ...................................................................................................................... 1

Introduction ................................................................................................................................... 8

I. A Global View .......................................................................................................................... 11

    1. Not Running Out of Oil: How Hydrocarbon Resources Evolve ........................................... 11

    2. Methodological Problems in Evaluating Future Supply ....................................................... 16

    3. A Mounting Wave of Underestimated Supply ...................................................................... 20

    4. Adding New Production to Old ............................................................................................ 32

II. The U.S. Shale/Tight Oil ........................................................................................................ 41

    5. From Shale Gas to Shale and Tight Oil ................................................................................ 41

    6. Herald of the Revolution: the Bakken Shale case ................................................................. 46

    7. A Broader View of the U.S. Shale/Tight Oil Potential ......................................................... 51

    8. The Problems Looming over U.S. Shale Oil......................................................................... 55

    9. Shale and Tight Oil & Gas versus the Environment ............................................................. 58

III. Conclusions............................................................................................................................ 64

    10. What is Really Ahead? ........................................................................................................ 64

Appendix A .................................................................................................................................. 70

    A Note on Methodology ........................................................................................................... 70
LIST OF ABBREVIATIONS AND TERMS Barrel – 42 gallons of oil (about 159 liters) Bcf – Billion cubic feet Bd – Barrels per day BOE – Barrels of oil equivalent. It assumes that one 42 gallon barrel of oil is equivalent to 5,800 cubic feet of natural gas, that it holds the same energy content of one barrel of standard crude oil. BOEd – Barrels of oil equivalent per day Btu – British thermal unit CERA – Cambridge Energy Research Associates Cheap oil – The expression “cheap oil” has not exact boundaries. Generally, in the oil literature it is used in reference to the cheap oil prices prevailing over the second half of the 20th Century, when oil price in real terms (2000 U.S. dollars) ranged between $ 20-30 per barrel, with some noteworthy exception (such as during the period of the oil shocks in the 1970s and early 1980s, when the price of oil largely exceed $ 100 per barrel in real terms). CO2 – Carbon Dioxide Depletion rate – The natural decline of an oilfield’s output after years of production. It could be partially offset by reserve growth. DOE – (U.S.) Department of Energy EIA – (U.S.) Energy Information Administration EOR – Enhanced Oil Recovery EUR – Estimated Ultimate Recovery GDP – Gross Domestic Product GtL – Gas to Liquids IEA – International Energy Agency IOCs – International Oil Companies Oil: The Next Revolution i
IOR – Improved Oil Recovery

IRR – Internal Rate of Return

MEND – Movement for the Emancipation of the Niger Delta

MBtu – Million British thermal units

Mbd – Million barrels per day

MIT – Massachusetts Institute of Technology

NDDMR – North Dakota Department of Mineral Resources

NGLs – Natural Gas Liquids. These include ethane, propane, butane, pentane, and natural gasoline.
Like crude oil, they are considered as part of oil production and oil production capacity.

OECD – Organization for Economic Cooperation and Development

OPEC – Organization of Petroleum Exporting Countries. It is formed by 12 countries: Algeria,
Angola, Ecuador, Iran, Iraq, Kuwait, Libya, Nigeria, Qatar, Saudi Arabia, United Arab Emirates,
and Venezuela.

OPP – Original oil in place. The total estimated amount of oil in an oil reservoir, including both
producible and non-producible oil. Because of reservoir characteristics and limitations in petroleum
extraction technologies, only a fraction of this oil can be brought to the surface, and it is only this
producible fraction that is considered to be reserves. The ratio of producible oil reserves to total oil
in place for a given field is often referred to as the recovery factor.

PADD – Petroleum Administration for Defense Districts. These districts are the geographical
aggregations used by the US government to collect petroleum data. PADD 1 is the east Coast
region, PADD 2 is the Mid- Continent and Midwest, PADD 3 is the Gulf Coast region, PADD 4 is
the Rocky Mountain region, and PADD 5 is the West Coast.

SPM – Single Point Mooring (a floating oil export terminal)

Spare capacity – The difference between the total oil production capacity (usually referred to a
country, or the world) that can be reached within 30 days – and sustained for 90 days – and the
actual production. As a consequence, it represents an unused oil capacity that can be activated in a
very short period of time.

ii                                                                            Oil: The Next Revolution
Reserve growth – The estimated increases in crude oil, natural gas, and natural gas liquids that
could be added to existing reserves through extension, revision, improved recovery efficiency, and
the discovery of new pools or reservoirs connected with a reservoir that is already producing oil. In
other words, it refers to the upgrading of already discovered reservoirs, and not to the discovery of
brand-new fields.

U.K. – United Kingdom

Unconventional oil – According to the EIA definition, conventional crude oil and natural gas
production refers to oil and gas “produced by a well drilled into a geologic formation in which the
reservoir and fluid characteristics permit the oil and natural gas to readily flow to the wellbore”. By
converse unconventional hydrocarbon production doesn’t meet these criteria, either because
geological formations present a very low level of porosity and permeability, or because the fluids
have a density approaching or even exceeding that of water, so that they cannot be produced,
transported, and refined by conventional methods.

U.S. – United States

U.S. Mid-Continent – Includes the states of North Dakota, South Dakota, Nebraska, Kansas, and
Oklahoma

U.S. Midwest – Includes Minnesota, Iowa, Missouri, Wisconsin, Michigan, Illinois, Indiana, Ohio,
Kentucky, and Tennessee

USGS – U.S. Geological Survey

WACC – Weighted Average Cost of Capital

WEC – World Energy Council

WTI – West Texas Intermediate

Oil: The Next Revolution                                                                           iii
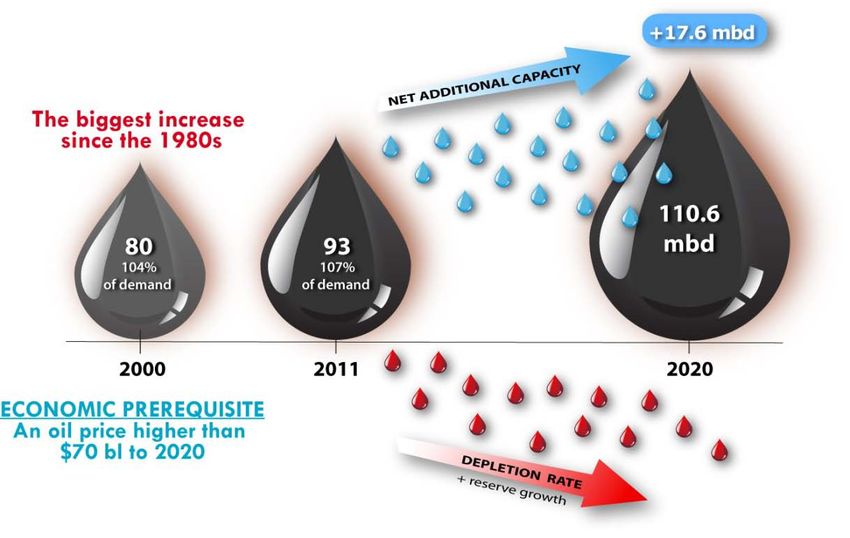
EXECUTIVE SUMMARY

Contrary to what most people believe, oil supply capacity is growing worldwide at such an
unprecedented level that it might outpace consumption. This could lead to a glut of
overproduction and a steep dip in oil prices.

Based on original, bottom-up, field-by-field analysis of most oil exploration and development
projects in the world, this paper suggests that an unrestricted, additional production (the level of
production targeted by each single project, according to its schedule, unadjusted for risk) of more
than 49 million barrels per day of oil (crude oil and natural gas liquids, or NGLs) is targeted for
2020, the equivalent of more than half the current world production capacity of 93 mbd.

After adjusting this substantial figure considering the risk factors affecting the actual
accomplishment of the projects on a country-by-country basis, the additional production that
could come by 2020 is about 29 mbd. Factoring in depletion rates of currently producing oilfields
and their “reserve growth” (the estimated increases in crude oil, natural gas, and natural gas
liquids that could be added to existing reserves through extension, revision, improved recovery
efficiency, and the discovery of new pools or reservoirs), the net additional production capacity
by 2020 could be 17.6 mbd, yielding a world oil production capacity of 110.6 mbd by that date –
as shown in Figure 1. This would represent the most significant increase in any decade since the
1980s.

Figure 1: World oil production capacity to 2020
(Crude oil and NGLs, excluding biofuels)

Oil: The Next Revolution                                                                           1
The economic prerequisite for this new production to develop is a long-term price of oil of $70
per barrel. Indeed, at current costs, less than 20 percent of the new production does not seem
profitable at prices lower than this level.

Only four of the current big oil suppliers (more than 1 mbd of production capacity) face a net
reduction of their production capacity by 2020: Norway, the United Kingdom, Mexico, and Iran.
For the latter two, the loss of production is primarily due to political factors. All other producers
are capable of increasing or preserving their production capacity. In fact, by balancing depletion
rates and reserve growth on a country-by-country basis, decline profiles of already producing
oilfields appear less pronounced than assessed by most experts, being no higher than 2 to 3
percent on a yearly basis.

This oil revival is spurred by an unparalleled investment cycle that started in 2003 and has
reached its climax from 2010 on, with three-year investments in oil and gas exploration and
production of more than $1.5 trillion (2012 data are estimates).

As shown in Figure 2, in the aggregate, production capacity growth will occur almost
everywhere, bringing about also a “de-conventionalization” of oil supplies. During the next
decades, this will produce an expanding amount of what we define today as “unconventional
oils” * – such as U.S. shale/tight oils, Canadian tar sands, Venezuela’s extra-heavy oils, and
Brazil’s pre-salt oils.

After considering risk-factors, depletion pattern and reserve growth, four countries show the
highest potential in terms of effective production capacity growth: they are, in order, Iraq, the
U.S., Canada, and Brazil. This is a novelty, because three out of four of these countries are part of
the western hemisphere, and one only – Iraq – belongs to the traditional center of gravity of the
oil world, the Persian Gulf.

The most surprising factor of the global picture, however, is the explosion of the U.S. oil output.

Thanks to the technological revolution brought about by the combined use of horizontal drilling
and hydraulic fracturing, the U.S. is now exploiting its huge and virtually untouched shale and
tight oil fields, whose production – although still in its infancy – is already skyrocketing in North
Dakota and Texas.

*
  According to the EIA definition, conventional crude oil and natural gas production refers to oil and gas
“produced by a well drilled into a geologic formation in which the reservoir and fluid characteristics permit
the oil and natural gas to readily flow to the wellbore”. By converse unconventional hydrocarbon
production doesn’t meet these criteria, either because geological formations present a very low level of
porosity and permeability, or because the fluids have a density approaching or even exceeding that of
water, so that they cannot be produced, transported, and refined by conventional methods.

2                                                                                  Oil: The Next Revolution
Figure 2: Country-by-country evolution of oil production capacity to 2020
     (First 23 countries)
14

                                                                                                                                                                  Production Capacity 2011
12
                                                                                                                                                                  Production Capacity 2020
10

 8

 6

 4

 2

 0

                                                                                                                                       Qatar

                                                                                                                                               Mexico
                                    Iraq

                                                                     Iran

                                                                                                       Nigeria

                                                                                                                                                        Algeria
                                                    Brazil

                                                                                                                                                                                     Azerbaijan
                                                                            Kuwait

                                                                                                                                                                                                  India
                                                                                                                                                                            Norway
                                                                                                                                                                  Libya**
      Saudi Arabia

                                                                                           Venezuela

                                                                                                                                                                                                          Indonesia
                           Russia

                                                             China

                                                                                                                          Kazakhstan

                                                                                                                                                                                                                      UK
                                                                                                                 Angola
                                           Canada

                                                                                     UAE
                     USA

     The U.S. shale/tight oil could be a paradigm-shifter for the oil world, because it could alter its
     features by allowing not only for the development of the world’s still virgin shale/tight oil
     formations, but also for recovering more oil from conventional, established oilfields – whose
     average recovery rate is currently no higher than 35 percent.

     The natural endowment of the initial American shale play, Bakken/Three Forks (a tight oil
     formation) in North Dakota and Montana, could become a big Persian Gulf producing country
     within the United States. But the country has more than twenty big shale oil formations,
     especially the Eagle Ford Shale, where the recent boom is revealing a hydrocarbon endowment
     comparable to that of the Bakken Shale. Most of U.S. shale and tight oil are profitable at a price
     of oil (WTI) ranging from $50 to $65 per barrel, thus making them sufficiently resilient to a
     significant downturn of oil prices.

     The combined additional, unrestricted liquid production from the aggregate shale/tight oil
     formations examined in this paper could reach 6.6 mbd by 2020, in addition to another 1 mbd of
     new conventional production. However, there remain obstacles that could significantly reduce the
     U.S. shale output: among them, the inadequate U.S. oil transportation system, the country’s
     refining structure, the amount of associated natural gas produced with shale oil, and
     environmental doubts about hydraulic fracturing, one of the key technologies for extracting oil

     Oil: The Next Revolution                                                                                                                                                                             3
from shale. After considering risk factors and the depletion of currently producing oilfields, the U.S. could see its production capacity increase by 3.5 mbd. Thus, the U.S. could produce 11.6 mbd of crude oil and NGLs by 2020, making the country the second largest oil producer in the world after Saudi Arabia. Adding biofuels to this figure, the overall U.S. liquid capacity could exceed 13 mbd, representing about 65 percent of its current consumption. The principal difficulty concerning shale gas is the effect of hydraulic fracturing on the environment, which is perceived as contributing to water and land contamination, natural gas infiltration into fresh water aquifers, poisoning of the subsoil because of the intensive use of chemicals, and even minor earthquakes. Even if those problems cannot be eliminated, after more than one million hydraulic fracturing operations in the United States since 1947 (hydraulic fracturing is not a new technology), the evidence shows that only a tiny percentage of these accidents occurred, and that they can be managed with appropriate best practices and adequate enforcement, rather than by over-regulating the activity. It is worth noting that the U.S. shale revolution cannot be easily replicated in other areas of the world – at least in a short period of time – due not only to the huge resource base of shale/tight oil plays existing in the U.S., but also to some unique features of the U.S. oil industry and market, such as the private ownership of mineral rights, the presence of thousands independent companies – oftentimes small – that historically played the role of pioneering new high-risk, high-reward targets, the huge availability of drilling rigs and other exploration and production tools, a very active financial market that supply money for new ventures. With the exception of Canada, these key features are foreign to other parts of the world, and they make the U.S. and Canada a sort of unique arena of experimentation and innovation. The analysis in this paper is subject to a significant margin of error, depending on several circumstances that extend beyond the risks in each project or country. In particular, a new worldwide recession, a drastic retraction of the Chinese economy, or a sudden resolution of the major political tensions affecting a big oil producer could trigger a major downturn or even a collapse of the price of oil, i.e. a fall of oil prices below $70 per barrel (Brent crude). The oil market is already adequately supplied. Global oil spare capacity (the difference between the world’s total oil production capacity that can be reached within 30 days – and sustained for 90 days – and the actual global production), is probably at about 4 mbd, † which seems capable of † In the first quarter 2012, average world oil production consistently reached or surpassed 91 mbd. At the same time, consumption has been lower than 89 mbd. This means that huge inventories of oil have accumulated, particularly in Saudi Arabia. For Saudi Arabia, I considered an oil production capacity of 12.3 mbd (slightly less than Saudi official figure of 12.5 mbd), even though part of that capacity (about 800,000 bd) would need at least three months to be activated. During the first quarter 2012, the Kingdom produced more than 10 mbd on average, with a peak of 10.5 mbd in some days. This could mean that the 4 Oil: The Next Revolution
absorbing a major disruption from a big oil producer such as Iran. In fact, the mere dynamics of
supply, demand, and spare capacity cannot explain the high level of oil prices today. At more
than $100 per barrel, the international benchmark crude Brent is $20 to $25 above the marginal
cost of oil production. Only geopolitical and psychological factors (above all, a major crisis
related to Iran) and a still deep-rooted belief that oil is about to become a scarce commodity, can
explain the departure of oil prices from economic fundamentals.

Coupled with global market instability, these features of the current oil market will make it highly
volatile until 2015, with significant probabilities of an oil price fall due to the fundamentals of
supply and demand, and possible new spikes due to geopolitical tensions. This will make difficult
for financial investors to devise a sound investment strategy and allocate capital on oil and gas
companies.

A hypothetical oil price downturn would have a significant impact, albeit short-lived, if it
occurred before most of the projects considered in this paper had advanced significantly - that is,
before 2015.

Conversely, if an oil price collapse were to occur after 2015, a prolonged phase of overproduction
could take place, because production capacity would have already expanded and production costs
would have decreased as expected, unless oil demand were to grow at a sustained yearly rate of at
least 1.6 percent for the entire decade.

The opposite could also happen. A sudden rebound of the world economy could strain the
equilibrium of oil demand and supply, particularly if accompanied by geopolitical tensions. This

Kingdom’s spare capacity – that is, the unused production capacity – over that period has been lower than
Saudi Arabia’s official target of 2.5 mbd, probably because part of that spare capacity was produced and
stored in view of a steep decline in Iranian exports. This analysis is consistent with data from JODI (Joint
Organizations Data Initiative, which includes both OPEC and OECD countries), according to which Saudi
Arabia had already accumulated 266 million barrels of oil inventories by the end of February.
Because of this accumulation of inventories, Saudi Arabia’s spare capacity over the first months of 2012 sat
at about 1.8 mbd or less. True, other experts deem the Kingdom’s effective spare capacity to be lower,
because they calculate it against a Saudi production capacity of 11.5 mbd, instead of 12.3 mbd. Even taking
this number as the lower limit of Saudi oil potential, this would have left Saudi Arabia with an average
spare capacity of about 1.2 mbd during the first quarter, or 1.8 mbd if 12.3 mbd is correct. Also, China’s
record oil import levels during the last months of 2011 and the first quarter 2012 were aimed at strategic
stockpiling, as confirmed by China’s National Petroleum Corporation. However, it’s not clear how many
oil inventories China has built up so far. During that same period, I observed that about 600,000 bd from
other countries did not go onstream mainly because of maintenance problems in OECD and Persian Gulf
countries. This would make the world production capacity slightly less than 94 mbd, against a consumption
of 88.5-89 mbd. To be prudent, I set the world production capacity at the end of 2011 and in the first
quarter of 2012 at 93 mbd, slightly less than what I consider to be the actual figure. This means that the
world had a kind of spare capacity of about 4 mbd, formed either by pure spare capacity, or by an unusual
accumulation of inventories – that represents “silent” production ready to be delivered to the market.

Oil: The Next Revolution                                                                                  5
scenario, however, would support an even stronger rush to develop new oil reserves and
production.

Whatever the future, the analysis reported in this paper reveals some important points:

    •    Oil is not in short supply. From a purely physical point of view, there are huge volumes
         of conventional and unconventional oils still to be developed, with no “peak-oil” in sight.
         The real problems concerning future oil production are above the surface, not beneath it,
         and relate to political decisions and geopolitical instability.

    •    Other things equal, any significant setback to additional production in Iraq, the United
         States, and Canada would have a strong impact on the global oil market, considering the
         contribution of these countries to the future growth of oil supply.

    •    The shale/tight oil boom in the United States is not a temporary bubble, but the most
         important revolution in the oil sector in decades. It will probably trigger worldwide
         emulation over the next decades that might bear surprising results - given the fact that
         most shale/tight oil resources in the world are still unknown and untapped. What’s more,
         the application of shale extraction key-technologies (horizontal drilling and hydraulic
         fracturing) to conventional oilfield could dramatically increase world’s oil production.

    •    In the aggregate, conventional oil production is also growing throughout the world at an
         unexpected rate, although some areas of the world (Canada, the United States, the North
         Sea) are witnessing an apparently irreversible decline of the conventional production.

    •    The age of “cheap oil”‡ is probably behind us, but it is still uncertain what the future level
         of oil prices might be. Technology may turn today’s expensive oil into tomorrow’s cheap
         oil.

    •    The oil market will remain highly volatile until 2015 and prone to extreme movements in
         opposite directions, thus representing a major challenge for investors, in spite of its short
         and long term opportunities. After 2015, however, most of the projects considered in this
         paper will advance significantly and contribute to a strong build-up of the world’s
         production capacity. This could provoke a major phenomenon of overproduction and lead
         to a significant, stable dip of oil prices, unless oil demand were to grow at a sustained
         yearly rate of at least 1.6 percent for the entire decade.

‡
  The expression “cheap oil” has not exact boundaries. Generally, in the oil literature it is used in reference
to the cheap oil prices prevailing over the second half of the 20th Century, when oil price in real terms
(2000 U.S. dollars) ranged between $20 to $30 per barrel, with some noteworthy exception (such as during
the period of the oil shocks in the 1970s and early 1980s, when the price of oil largely exceed $100 per
barrel in real terms).

6                                                                                    Oil: The Next Revolution
• A revolution in environmental and emission-curbing technologies is required to sustain
the development of most unconventional oils – along with strong enforcement of existing
rules. Without such a revolution, a continuous clash between the industry and
environmental groups will force the governments to delay or constrain the development
of new projects.
• Some of the major geopolitical consequences of the oil revolution include Asia becoming
the reference market for the bulk of the Middle East oil, and China becoming a new
protagonist in the political affairs of the whole region.
• At the same time, the Western Hemisphere could return to a pre-World War II status of
theoretical oil self-sufficiency, and the United States could dramatically reduce its oil
import needs.
• However, quasi oil self-sufficiency will neither insulate the United States from the rest of
the global oil market (and world oil prices), nor diminish the critical importance of the
Middle East to its foreign policy. At the same time, countries such as Canada, Venezuela
and Brazil may decide to export their oil and gas production to markets other than the
U.S. for purely commercial reasons, making the notion of Western Hemisphere self-
sufficiency irrelevant.
• It’s also true, however, that over the next decades, the growing role of unconventional
oils will make the Western hemisphere the new center of gravity of oil exploration and
production.
Oil: The Next Revolution 7INTRODUCTION Quite unnoticed, a big wave of oil production is mounting worldwide, driven by high oil prices, booming investments, private companies’ desperate need to restore their reserve, and the misguided but still prevalent perception that oil must become a rare commodity. The year 2012 will likely set a new historic record, with more than $600 billion to be spent worldwide in oil and gas exploration and production. For the first time, new areas of the world – from sub-equatorial Africa to Asia and Latin America – are being targeted for mass exploration, and unveiling the potential for significant conventional oil production over the next years. Furthermore the combination of high oil prices, advanced technologies that were once uneconomical, and restricted access to conventional oil resources in the major oil-producing countries is pushing private oil companies to explore and develop unconventional oils on a broader scale. This effort is concentrated in Canada, the United States, Venezuela, and Brazil. The U.S. shale/tight oil appears to be a potential “paradigm-shift” for the entire world of unconventional oils. The unexpected and rapid increase of oil production from the forerunner of shale/tight oil (the Bakken Shale formation in North Dakota) is astonishing: production has grown from a few barrels in 2006 to more than 530,000 barrels in December 2011. 1 This development seems consistent with the best study ever conducted on the geological features and potential productivity of Bakken (Price, 1999), which estimated the maximum Original Oil in Place of the whole formation at more than 500 billion barrels, with a probable recovery rate of about 50 percent. If confirmed, those figures would make Bakken a “game-changer” of the oil business, and one of the largest oil basins ever discovered. And Bakken is only one out of more than twenty shale/tight oil formations in the U.S., that so far have been virtually untouched. While opinion-makers, decision-makers, the academy, and the financial market seem to be caught up in the “peak-oil” mantra and an excessive enthusiasm for renewable energy alternatives to oil, oil prices and technologies are supporting a quiet revolution throughout the oil world. If this “oil revolution” is true, it may change the way most people think about energy and geopolitics. This paper examines the extent of this revolution. Part I focuses on the evolution of the global oil production up to 2020, which is articulated in four Sections. 8 Oil: The Next Revolution
Section 1 describes the fundamental concepts concerning oil resources, reserves, recoverability,
depletion, and reserve growth. It shows that our planet still holds huge oil resources yet to be
developed or discovered and that no “peak-oil” era is imminent. This section also explains why
prices, technologies, and political decisions are key in increasing or decreasing the availability of
oil.

Section 2 deals with the major methodological problems and pitfalls affecting the evaluation of
the future production of oil, particularly when based on econometric models. The Section also
explains the reasons that support a bottom-up analysis of future production, based on a global
field-by-field evaluation of all investments underway in the world and their targeted production—
like the one carried-out in this paper. Although not exempt from a high margin of error and
arbitrary assumptions, a field-by-field analysis more precisely assesses the developing supply
over a ten year period.

Section 3 details the initial results of the field-by-field analysis conducted for this paper. It reports
the assessment concerning the big wave of new production of under-development or re-
development, showing both the additional unrestricted production (the additional production
targeted by all current investments, with no associated risk factor) and the additional adjusted
production (that is the additional unrestricted production considering risk factors) due to come
on board by 2020. The evolution of oil production from already producing fields is not considered
in this section (it will be taken into account in Section 4) to give the reader a precise sense of all
new oil developments occurring worldwide. A special focus is devoted to data concerning the 11
most relevant countries in terms of future production growth.

Section 4 completes the analysis reported in Section 3, including the additional adjusted
production (estimated in Section 3) to the future supply to be extracted from already producing
fields, adjusted for depletion and reserve growth. The result is a detailed picture of the big leap
forward of the world’s total oil production capacity by 2020. A detailed analysis is devoted to the
23 most important oil producing countries of the world (the ones with a current capacity of future
production higher than 1 million barrels per day).

Part II of the paper analyzes the most surprising factor of the world’s oil production upsurge—
the U.S. shale and tight oil revolution—and its long-term consequences for the U.S. and the
world. This part is articulated in five Sections starting with Section 5, which deals with the
parallelism between the shale gas and shale oil phenomena in the U.S. It then defines shale and
tight oils, and explains the differences between shale oil and oil shale. This Section also offers an
historical account and a description of the primary features of horizontal drilling and hydraulic
fracturing, the combination of which has been key to the shale/tight oil revolution.

Oil: The Next Revolution                                                                               9
Section 6 analyzes the case of the Bakken shale (a tight oil formation) in North Dakota, the
catalyst of the U.S. shale revolution. The Section examines the different geological evaluations of
the Bakken Shale, starting with the unparalleled study conducted by geochemist Leigh Price
(1999), who has estimated the original oil present in the Bakken Shale formation to equal that of a
major Persian Gulf oil producer. The Section also analyzes all available data from the Bakken and
Three Forks (another tight oil formation that lies just beneath Bakken) formations, gathered from
different sources and companies. Finally, this Section offers an evaluation of the Bakken/Three
Forks production potential up to 2020.

Section 7 deals with the analysis and evaluation of other U.S. shale/tight oil formations (Eagle
Ford shale, Permian Basin shale, Utica Shale, Niobrara/Codell shale) where a significant level of
exploration and development activity is already underway, making it possible to gather data and
predict future supply. This Section also includes a broad forecast of U.S. shale/tight oil
production potential up to 2020, (the results of which are included in the world’s total production
capacity by 2020 analysis in Part I).

Section 8 analyzes the main technical problems that could significantly limit the deployment of
the U.S. shale/tight oil from reaching its full potential. In particular, it examines the oil
transportation and infrastructure gaps existing in the United States, the mismatch between the
quality of most shale oils and the structure of the U.S. refining system, the supply of tools and
skilled labor force required by intensive shale oil activity, and the problem of natural gas
production associated with shale oil production.

Section 9 examines the single most important problem affecting the future of shale/tight oils: the
environmental threat that their extraction seems to pose to water, land, and air.

Part III hinges on one single section (Section 10), exploring the macro factors that could
significantly affect the estimations contained in this paper. This Section also examines the
possibility of a collapse of oil prices in this decade due to a combination of a faster than expected
surge in oil production and insufficient demand, and examining the different consequences such a
collapse could have depending on its timing. Finally, this Section reflects upon the crucial
concepts we can glean from this analysis beyond the numerical reports and predictions of future
oil production.

10                                                                           Oil: The Next Revolution
I. A GLOBAL VIEW

1. NOT RUNNING OUT OF OIL: HOW HYDROCARBON RESOURCES EVOLVE
In 2011, the world consumed about 32 billion barrels of oil (crude oil and natural gas liquids),
while oil proven reserves were about 1.3 trillion barrels. This means that those reserves should
last more than 40 years. However, proven reserves are only a tiny slice of the overall supply of oil
our planet hides.

On a global scale, the U.S. Geological Survey (USGS) estimates the remaining conventional oil
resources in the earth at about seven trillion to eight trillion barrels, out of eight-to-nine trillion
barrels of Original Oil in Place (OOP). Part of this (about one trillion barrels) has already been
consumed by humankind. With today’s technology and prices, only part of the OOP can be
recovered economically and thus be classified as a proven reserve.2

The notion of recoverability is crucial to the oil industry. Given its complex nature, a
hydrocarbon reservoir will always retain part of the oil and gas it holds, even after very long and
intensive exploitation. Fields that no longer produce oil and are considered exhausted still contain
ample volumes of hydrocarbons that cannot simply be economically recovered with existing
technologies.

Today, the worldwide average recovery rate for oil is less than 35 percent of the estimated OOP,
which means that less than 35 barrels out of 100 may be harvested. As often occurs with
statistics, these figures hide huge disparities.

In most major producing countries, particularly those where international oil companies (IOC’s)
are not permitted to produce oil, the oil recovery rate is well below 25 percent, because of old
technologies, reservoir mismanagement, limited investment, and many other factors. The
situation has improved in the last decade, but not significantly.

For example, the current leading oil producers report about a 20 percent recovery rate.3 This
group includes the Russian Federation, Iran, Venezuela, Kuwait, and others. Some of these
countries have even lower recovery rates, in spite of their long and important history as
producers.

Consider Iraq. Despite its long history as a producer, the country is largely untapped as far as oil
development is concerned, according to the assessment made by the IOC’s awarded re-
development contracts between 2009 and 2011 (see Section 3). Since production began at the
dawn of the twentieth century, only 2,300 wells (both for exploration and production) have been
drilled there, compared with about one million in Texas.7 A large part of the country, the western
desert area, is still mainly unexplored. Iraq has never implemented advanced technologies, like 3-

Oil: The Next Revolution                                                                              11
D seismic exploration techniques, or deep and horizontal drilling and hydraulic fracturing, to find
or tap new wells. Of more than eighty oil fields discovered in the country, only about twenty-one
have been partially developed.8 Given this state of underdevelopment, it is realistic to assume that
Iraq has far larger oil reserves than documented so far, probably about 200 billion barrels more.
These numbers make Iraq, together with a few others, the fulcrum of any future equilibrium in the
global oil market.9 To date, the Iraqi recovery rate has been much less than 20 percent, and
probably lower than 15 percent of its OOP.

Even the most oil-rich country in the world, Saudi Arabia, still has much potential to exploit.
Despite a flurry of recent doubts about the actual size of its reserves (a renewed attempt to
discredit the country’s role as the world’s Central Bank for oil), the Kingdom will probably
continue to defy skeptics for decades to come. Currently, its 260 billion barrels of proven
reserves, a fifth of the world’s total, represent nearly one-third of the original oil in place
estimated by the Saudi state oil giant, Saudi Aramco; 10 yet the company has pointed out that its
measurement does not take into account potential future advantages of enhanced recovery
techniques.

On the opposite side of the spectrum are countries like the United States, Canada, Norway, and
the United Kingdom, which record recovery rates above 45 percent, thanks to the open
competition among international oil companies.

The United States is a mature oil country, whose oil production declined from 1971 to 2009. Yet,
it still holds huge volumes of unexploited oil. Although the country has documented oil reserves
of only 29 billion barrels, in 2007, the National Petroleum Council (NPC) estimated that 1,124
billion barrels were still underground, of which 374 billion barrels could be recovered with then-
current technology.4

Thus, price and technology are key elements in determining the evolution of oil reserves. The
evolution starts with the other characteristics of the phenomenon known as “reserve growth.”

The USGS defines reserve growth “as the estimated increases in quantities of crude oil, natural
gas, and natural gas liquids that have the potential to be added to remaining reserves in
discovered accumulations through extension, revision, improved recovery efficiency, and
additions of new pools or reservoirs.”5

It is important to bear in mind that “reserve growth” concerns existing fields only, not newly
discovered ones, and because of this, hydrocarbon reserves may increase without the discovery of
new fields. In fact, history has proved that “additions to proven recoverable volumes” of
hydrocarbon have been “usually greater than subtractions,” without any new oil discovery.6

12                                                                          Oil: The Next Revolution
Reserve growth is a crucial element in the evolution of oil supply, and is often ignored or
underestimated. Most analyses on oil reserves and supplies focus primarily on depletion rates of
already producing oil basins, subtracting from reserves, and assuming a reduction of future
production, without adequately factoring in their reserve growth. This underestimates the
production of several oilfields, particularly the larger ones.

Two prominent geologists from the U.S. Geological Survey conducted a brilliant examination of
“reserve growth” on a global scale. According to their extensive analysis, the estimated proven
volume of oil in 186 well-known giant fields in the world (holding reserves higher than 0.5
billion barrels of oil, discovered prior to 1981) increased from 617 billion barrels to 777 billion
barrels between 1981 and 1996.7

Because of “reserve growth,” a country or a company may increase its oil reserves without
tapping new areas if it can recover more oil from its known fields. One of the best examples of
the ability to squeeze more oil from the ground comes from the Kern River Field in California.

 When the Kern River Oil Field was discovered in 1899, analysts thought that only 10 percent of
its unusually viscous crude could be recovered. In 1942, after more than four decades of modest
production, it was estimated that the field still held 54 million barrels of recoverable oil, a fraction
of the 278 million barrels already recovered. As observed by Morris Adelman, “In the next 44
years, it produced not 54 [million barrels] but 736 million barrels, and it had another 970 million
barrels remaining.”8 But even this estimate proved incorrect.

In November 2007, U.S. oil giant Chevron, by then the field’s operator, announced cumulative
production had reached two billion barrels. Today Kern River still yields nearly 80,000 barrels
per day, and the state of California estimates its remaining reserves to be about 627 million
barrels.9

Chevron began to increase production markedly in the 1960s by injecting steam into the ground, a
novel technology at the time. Later, new exploration and drilling tools, along with steady steam
injection, turned the field into a kind of oil cornucopia.

Kern River is not an isolated case. The oil literature is filled with cases of oilfields that gained a
second or third life after years of production, thanks to new technologies that made it possible to
estimate the size of an oilfield resource better, to discover new satellites of the main oilfield, to
extract more oil, and to manage the drilling and production operations better.

The exact boundaries of a large oilfield can not be known with complete confidence until years or
decades of successive geophysical analysis and adequate drilling have gone by. A reservoir may
extend through tens or even hundreds of square miles and, have a vertical depth and a horizontal
extension that are initially unknown. Consequently, during the first years of exploration and

Oil: The Next Revolution                                                                             13
production, estimates of hydrocarbon resources contained in an oilfield tend to be incomplete and
conservative.

All of these elements point to a fundamental concept: knowledge of already discovered oil
resources is not static, but increases over time through the expansion of scientific understanding
of the fields. This explains why resources increase over time in tandem with increased
knowledge, though a dynamic, ongoing process. In other words, estimates of reserves are not
carved in stone.

This is even truer for what we do not know, that is, the unexplored areas of the world. Only one
third of the sedimentary basins of our planet (the geologic formations that may contain oil) have
been thoroughly explored with modern technologies including advanced seismic prospecting and
deep exploration drilling. For example, until a few years ago, it was impossible to look through
pre-salt formations with traditional seismic technology, or tap hydrocarbons below more than
5,000 or 6,000 feet of water. Moreover, large parts of Africa and Asia and many deep and ultra-
deep offshore basins are still unexplored.

Exploration wells (also known as wildcats in oil jargon) represent a good proxy of the real
knowledge of our planet’s hidden secrets, because they follow careful geological and seismic
evaluations of the subsoil. Only about 2,000 new wildcat fields have been drilled in the entire
Persian Gulf region since the inception of its oil activity, compared to more than one million in
the United States.10 Even today, more than 60 percent of drilling activity is concentrated in North
America (United States and Canada), as reflected by the rig count numbers made available each
month by Baker Hughes.

All of this said, however, our planet most likely does not hide many more gigantic basins of
conventional oil, for which discovery peaked in the 1960s. Some of these formations might still
be hidden in the ultra-deep offshore or in other environmentally hostile areas, such as the Arctic
Sea, but it is improbable that conventional oil basins such as those discovered in the early 20th
Century in the Persian Gulf, in Texas, or a few other areas of the world are yet to be found. But a
new paradigm may render these questions irrelevant.

While aggregate conventional oil production capacity continues to grow, a process of “de-
conventionalization” of oil reserves will likely result in an expanding wave of “unconventional
oil” production.

According to the U.S. Energy Information Administration (EIA) definition, conventional crude
oil and natural gas production refers to oil and gas “produced by a well drilled into a geologic
formation in which the reservoir and fluid characteristics permit the oil and natural gas to readily
flow to the wellbore.” By converse unconventional hydrocarbon production doesn’t meet these
criteria, either because geological formations present a very low level of porosity and

14                                                                           Oil: The Next Revolution
permeability, or because the fluids have a density approaching or even exceeding that of water, so
that they cannot be produced, transported, and refined by conventional methods. This umbrella
definition, then, encompass ultra-heavy oils, shale and tight oils, tar sands, and oil shale.

The USGS (2003)11 and the World Energy Council (WEC, 2007)12 estimated that there could be
more than 9 trillion barrels of unconventional oil resources beneath the surface of our planet, with
only 300 billion barrels of them potentially recoverable at the time of that estimation. However,
as we can see from the shale/tight natural gas and oil boom in the U.S., those kinds of evaluations
were both based on a conservative probabilistic approach that was already outdated, as they could
not factor in the rapidly evolving use of new technologies to explore and develop hydrocarbon
basins.

In fact, the current decade could herald the advent of “unconventional oil” as “the oil of the
future,” changing the geopolitical landscape that has marked the oil market for most of the 20th
Century. Most of the known unconventional oil resources, and about 70 percent of those
considered “recoverable” today, are concentrated in Canada, the United States, and Venezuela.

The fact that a significant portion of tomorrow’s oil supply might come from unconventional
resources has led many observers to talk about the end of “cheap oil.”

The expression “cheap oil” has not exact boundaries. Generally, it is used in reference to the
cheap oil prices prevailing over the second half of the 20th Century, when oil price in real terms
(2000 U.S. dollars) ranged between $20-30 per barrel, with some noteworthy exception (such as
during the period of the oil shocks in the 1970s and early 1980s, when the price of oil largely
exceed $ 100 per barrel in real terms).

 If we do accept this definition of cheap oil, we may come to the conclusion that the bulk of it is
almost depleted, also because it was the first to be discovered and exploited. Many of the largest
and most productive oil basins in the world are approaching what I call technological maturity;
the point at which traditional technologies are no longer effective. These basins include reservoirs
in Persian Gulf countries, Mexico, Venezuela, and Russia, which started yielding oil in the 1930s,
1940s, and 1950s. For these fields to keep producing in the future, new technologies will be
necessary; that requires additional costs.

This influx of new technology is already being developed in several countries, continuing the
productive life of many of the oldest and most prolific oilfields in the world, starting with the
largest conventional oilfield ever discovered, al-Ghawar in Saudi Arabia. It has been delivering
an impressive 5 mbd for many years, and it will continue to do so for the rest of this decade.

Yet a considerable measure of today’s “easy and cheap” oil was not so easy and cheap when it
was discovered.

Oil: The Next Revolution                                                                            15
Consider North Sea oil, for example. When it was developed in the 1970s, it seemed that offshore
technology had reached its most daunting frontier, tapping fields that lay below 100 to 200 meters
of water and 1,000 meters under the seabed. The cost of operating in those conditions seemed to
be prohibitive, and only the two oil shocks of the 1970s and the consequent spikes in oil price
made North Sea oil profitable. Yet after ten years of intense exploration, development, and
developing infrastructure, the cost of discovering and developing North Sea oil has decreased by
50 percent. Today, the oil industry can strike oil below 3,000 meters of water and 6,000 meters of
rock and salt; the limits of the North Sea in the 1970s are business as usual today.

There is a learning curve for new technology, but the difficult oil of today will be the easy oil of
tomorrow.

2. METHODOLOGICAL PROBLEMS IN EVALUATING FUTURE SUPPLY
First, it is important to recall that in most statistical sources, the expressions “oil production”, “oil
supply”, and “oil production capacity” usually include both crude oil and natural gas liquids
(NGLs, i.e. ethane, propane, butane, pentane, etc.). In this paper, I use “oil production/capacity”
and “liquid production/capacity” interchangeably, the latter being clearer for the general reader.

At the beginning of 2012, total liquid production capacity was about 93 million barrels per day
(mbd). About 77 mbd of that was crude oil supply capacity.

Second, any assessment of the future of oil production should take into account the asynchronicity
between the evolution of demand and supply, which emerges from several elements. First,
investment cycles for exploration and development of oil and natural gas deposits are very long,
averaging between eight and twelve years. Consequently, development of new production is out of
sync with both the demand for oil and its price.

The industry tends to increase investment gradually as the price of crude oil increases, but once the
new investments are started, they are very difficult to stop, even when consumption and crude oil
prices suddenly collapse. In other words, the industry behaves like an elephant running: it starts
very slowly, but once it gets going, no one can stop it.

In fact, as an oil company gradually spends its budget, the investment assumes a life of its own, and
it becomes unprofitable to block the spending, especially when hundreds of millions of dollars have
already been spent. The need to obtain an economic return on capital already invested takes priority
over almost any other consideration, unless there are dramatic changes in the market situation.

To complicate matters, contractual commitments are made by the oil companies with the countries
owning the deposits, which often make it difficult to block or reduce the spending. Indeed, these

16                                                                              Oil: The Next Revolution
commitments demand heavy economic penalties or even revocation of the concessions granted by
the host government if, by pre-established dates, the agreed number of wells and the needed
infrastructure are not realized, and initial production is not achieved.

The only companies that can effectively block or significantly rein in their own investments in the
event of a negative market situation are national oil companies belonging to the producing
countries themselves, whose investment policies must be approved by those same governments that
own the companies. Another exception occurs in the United States and Canada, where the freedom
to make business decisions (including the decision to block investments already approved) is
unique in the world, thanks to the presence. This is particularly true in the case of U.S. shale/tight
oil and Canadian tar sands development, where the production unit is not a field, but a single well
or a single, limited portion of a tar-sand basin. In this case, companies may effectively decide to
rein in investments as soon as a sudden dip of oil price occurs.

Third, every public company must replace reserves "consumed" each year, a problem that has
reached critical dimensions in the last two decades, given the increasing difficulty of accessing the
reserves of the big oil-producing countries, especially in the Persian Gulf. Thus, the objectives of
replacing reserves, and maintaining or increasing future production of oil and gas, often override
purely economic considerations.

Finally, even when oil prices and demand collapse, the oil industry tends to believe that the
collapse is a short-term phenomenon, so that it tends to slowly cut new initiatives, but finds it very
difficult to impede those that have already been initiated, unless the downturn persists for a
sufficiently long period of time (more than one year at least). However, even then, it is more likely
that scheduled investments will be deferred, rather than block initiatives already started. Also in
this case, the U.S. shale/tight oil and the Canadian tar sands represent an exception.

Because of the asynchronous relationship between production development and the evolution of
demand and oil prices, it is misleading (and often wrong) to assess the development of oil
production as a simple function of demand that, in its turn, is calculated as a function of economic
growth according to the general economic equilibrium paradigm used by most econometric models.
It is even more misleading to make long-term predictions—twenty years or more—having no real
tool for evaluating the evolution of technology, of political decisions, of prices, and so on.

For all these reasons, a correct evaluation of the future oil supply growth should depend on a
relatively short period of time (in the case of this paper, to 2020), and start with a bottom-up
analysis, i.e., a field-by-field analysis of all projects currently active in the world to develop new
oil production or to maintain existing production. These projects should include all those initiatives
that are already in a building phase or in a planning stage after the formal signature of committing
contracts.

Oil: The Next Revolution                                                                          17
You can also read