A2 GEOGRAPHY REVISION GUIDE EDEXCEL
←
→
Page content transcription
If your browser does not render page correctly, please read the page content below
A2 GEOGRAPHY
             REVISION GUIDE

                             EDEXCEL

Created by Natalie Garthwaite 2010
Topic 1: Energy Insecurity What do I need to know? How energy sources can be classified and the advantages and disadvantages of these Reasons for global variations in energy access and consumption Factors effecting energy security – California Case Study Impact of growing global energy demand e.g. China case Study Impact of geopolitics on energy security Energy pathways problems with these – Trans-Siberian Pipeline How energy supplies can be disrupted e.g. Russia Environment impacts of looking for more energy e.g. Tar Sands in Canada, Arctic Oil Who they key players are in supplying future oil – OPEC, TNCs - Gazprom Why we are uncertain about the future of energy The advantages and disadvantages of the possible futures How energy insecurity will lead to geopolitical tensions e.g. USA involvement in Middle East, China and India How can meet our future energy needs? Created by Natalie Garthwaite 2010
Key Terms
Energy Pathways        Supply routes between energy producers and consumers e.g. pipelines or
                       shipping routes
Energy Poverty         When a country or region has insufficient access to reliable sources of power
Energy Security        This is vital to the functioning of any economy – any country that is self-
                       sufficient in energy resources will be secure
Energy surplus         When a country or region has more than enough sources of power for its needs
                       and is able to export its surplus power to other countries
Geopolitics            Political relations among nations, particularly relating to claims and disputes
                       regarding boarders and resources
Low-carbon standard    Initiative introduced in California in 2007 aimed to reducing the carbon
                       intensity of transportation fuel by 10% by 2020
OPEC                   The Organisation of Petroleum Exporting Countries e.g. Iran, Iraq, Kuwait
Peak Oil               The year in which the world or an individual oil-producing country reaches its
                       highest level of production, production declines after
Security Premium       The extra cost built into the price of oil to allow for any disruption in supply
Strategic              Something that is done as part of a plan that is meant to achieve a particular
                       purpose or to gain an advantage
Supply shock           A significant interruption to supply due to an environmental, economic or
                       political event
Tar Sands              Naturally occurring mixtures of sand or clay, water and dense form of
                       petroleum called bitumen
Energy crisis          A serious shortage of energy which interrupts domestic supplies and impacts
                       on all sectors of the economy
Environmental impact   Details all of the impacts on the environment of an energy type or another
assessment             project above a certain size
Fossil fuels           Fuels consisting of hydrocarbons (coal, oil and natural gas) formed by the
                       decomposition of prehistoric organisms
Renewable resources    Sources of energy such as solar and wind power that are not depleted as they
                       are used
Strategic Petroleum    The USA’s reserve supply of oil which should last for about 3 months in the
Reserve                event of severe interruptions to imported oil
Energy                 The built environment constructed for the exploration, development and
infrastructure         production of energy, and all the networks
Energy TNCs            Transnational corporations that specialise in the exploration, development,
                       production and sale of energy products
Resource               When a country decides to place part or all of one or a number of natural
nationalisation        resources e.g. oil under state ownership
Carbon credit          A permit that allows an organisation to emit a specified amount of greenhouse
                       gases
Carbon Trading         A company that does not use up the level of emissions it is entitled to can sell
                       the remainder to another company
Coal gasification      A process which converts solid coal into a gas that can be used for power
                       generation
Green taxation         Taxes levied to discourage behaviour that will be harmful to the environment
Microgeneration        Generators producing electricity with an output of less than 50KW
Created by Natalie Garthwaite 2010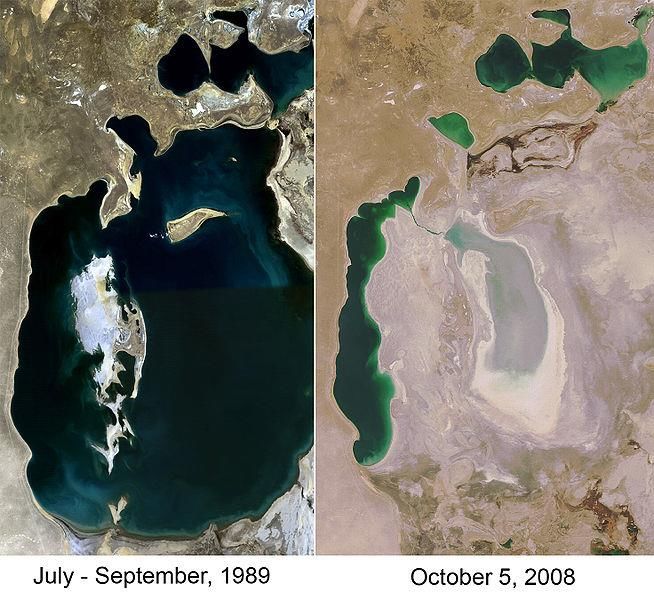
How energy sources can be classified and the advantages and
disadvantages of these
The main way to classify energy is between renewable, non-renewable and recyclable sources
Renewable = can be used over and over again e.g. wind and solar power (also known as FLOW
RESOURCES)
Non-renewable = these are finite resources so as they are used up the stock that remains behind is
reduced (also known as STOCK RESOURCES)
Recyclable resources = fuel that has been used once can be used again to generate power e.g. nuclear
reprocessing can make uranium waste reusable
Energy source Type Issues
Coal Non-renewable Releases large amounts of Co2 contributing to
climate change e.g. 2 billion tonnes from USA
plants per year
Carbon capture technology to remove Co2 is
unproven
Natural Gas Non-renewable Releases Co2 on use
Issues of security of supply
Nuclear Non-renewable (may be Health risks and accidents e.g. Chernobyl
recyclable) Disposal of radioactive material an issue
Oil Non-renewable Global supplies may have reached their peak
Release Co2 when burnt
Solar Renewable Availability varies across the globe
Expensive compared with fossil fuels
Tidal Renewable Only certain locations suitable
Technology for large-scale generation unproven
Wind Renewable Only certain locations suitable
Wind energy is variable so hard to manage power
supply
Biomass Renewable Acts as a carbon sink so combustion releases
carbon dioxide
Limited potential for large sale generation
Geothermal Renewable Availability limited to a few locations e.g.
Iceland
Hydro- Renewable and recyclable Large scale schemes are expensive
electricity Dam building creates wide scale flooding
Created by Natalie Garthwaite 2010
Reasons for global variations in energy access and consumption
Distribution of energy reserves: COAL:
China produced 41.1% of global
coal in 2007
USA produces 18.7%
WIND
HEP: Germany world
China, Canada, leader at
Brazil and 23.6%
USA account Germany, USA
for 46% of and Spain
global total account for
58% globally
NATURAL GAS: OIL:
Russia and USA produce 40% of In 2007 the Middle East = 30.8%
world’s total of oil production
N. America = 16.5%
Saudi Arabia dominates
production 12.6% of world’s
total
Russia accounts for over ½ of
Why energy supply varies:
production for Europe and
Eurasia
1) Physical:
Deposits of fossil fuels are only found in a limited number of places
Solar power needs a large number of days a year with strong sunlight
Large power stations require flat land and stable foundations
2) Economic
Onshore deposits of oil and gas are cheaper to develop then offshore deposits
In poor countries foreign direct investment is essential to develop energy resources
Most accessible and low cost deposits of fossil fuels are developed first
3) Political
Countries wanting to develop nuclear power need to gain permission from the
International Atomic Energy Agency
International agreements such as the Kyoto Protocol can influence energy decisions
Created by Natalie Garthwaite 2010
HEP schemes on ‘international’ rivers require the agreement of all countries that share
the river
NICs:
Energy consumption
China accounts for
1/3rd of the growth in
global oil demand
since 2000
Demand for oil in
China is expected to
rise by 5-7% year
Developing Countries:
Most are struggling to pay for their energy
MEDCs:
requirements
The USA shows huge demands
Energy demand is influenced by rate of
for energy resources
economic development and rate of population
Germany and UK have improved
growth
their energy efficiency resulting
In the world 2 billion people lack access to
in a modest increase in demand
household electricity
compared with NICs
Traditional biomass in these countries accounts
for 90% of total energy consumption
It is important to note that the use of energy in all countries has changed over time due to:
Technological developments nuclear power only been available since 1954
Increasing national wealth incomes increase resulting in increasing use of energy
Changes in demand Britain’s trains were powered by coal
Changes in price Electricity production in UK switched from coal to gas power stations are
they are cheaper to run
Environmental factors/public opinion can influence decisions made by governments
Factors effecting energy security
Energy security has a number of risks:
1) Physical – exhaustion of reserves or disruption of supply lines
Created by Natalie Garthwaite 2010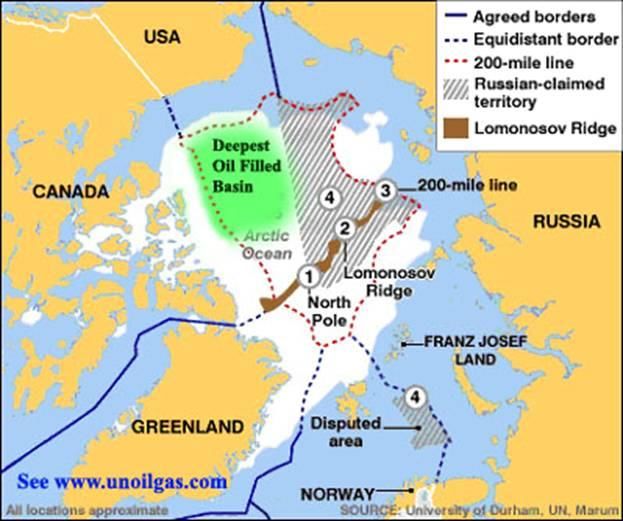
2) Environmental – Protests about environmental change caused by exploitation of energy
resources
3) Economic – sudden rises in costs of energy forcing increased imports of higher-priced energy
4) Geopolitical – political instability in energy-producing regions
The energy security of a country can be measured using the ‘Energy Security Index’ (ESI).
This is based upon:
- Availability – the amount of a country’s domestic oil and gas supplies and its level of reliance
on imported resources
- Diversity – the range of energy resources used
- Intensity – the degree to which the economy of a country is dependent on oil and gas
The higher the index, the lower the risk and therefore the greater the energy security
Case Study: Energy Security Issues: California Case Study
Facts:
Largest state in the USA
Lowest per capita energy consumption rate in the USA due to mild weather
16% of USA oil reserves, but only 3% of gas reserves
Produces 5% of USA total electricity
More motor vehicles that any other state
Why is the USA in energy crisis?
1) Consumption In 2007 USA consumed 23.8% of the world’s oil
2) Reliance on imports Between 1960 and 2003 USA’s reliance on imported gas and oil
increased by 18% to 58%
9/11 terrorist attack highlight concerns on dependence on imports from the Middle
East
3) Price In 2006 the price of oil had risen from $20 to $60 per barrel . In 2008 the oil
was $140
4) Reserves of fossil fuels are being to run out reserves should last for between 40-65 years
5) Global sources of energy are unevenly distributed most are concentrated in politically
unstable parts of the world
6) Demand for energy is increasing the growth of economies in China and India has meant more
competition for resources
So why is California suffering an energy crisis?
Due to the fact that the US energy market is privatised the market is driven by the desire to make
most profit. Between June 2000 and May 2001 California experienced a series of blackouts due to
various factors:
a. The weather:
2000 was the 3rd years of drought so less surplus energy due to lack of hydro-
electricity from surrounding states
Summer was very hot so increased demand for air-conditioning
Winter was unusually cold so increased need for heating
b. Insufficient generating capacity strong anti-pollution laws in the 1970s meant energy
companies were unwilling to build new power stations that were expensive
c. Limited capacity of power lines to important more electricity
Created by Natalie Garthwaite 2010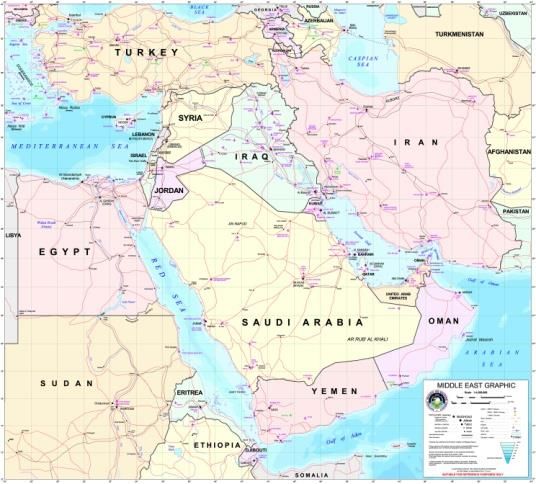
d. Eron used supply and demand to ensure energy prices remained high enough when supply was
good
Therefore the two major power companies in California were forced to shut off electricity supplies
to conserve limited stocks
Impact of growing global energy demand e.g. China case Study
Background:
In 2001, China accounted for 10% of global energy demand, in 2007 it was 15%
Per capita energy demand is still relatively small due to its huge population (e.g. 2006 consumed
less than 7 million barrels/day a 1/3rd of USA)
Controls 3% of world oil reserves (enabled China to be self-sufficient until 1995)
Causes of rising demand:
1. Since 1949 China has been a communist country separate from the rest of the world, however
in 1986 the government developed an ‘Open-Door Policy’ to overseas investment.
2. 1990s became more of a capitalist economy allowing individuals to accumulate wealth = still not
a free-market economy as most companies are state owned (LINK TO SUPERPOWER UNIT)
3. Rising energy demand is due to both economic growth and the demands of the new industry
but also rapid urbanisation and growing car ownership
Rural-urban migration in China is 8.5 million people per year (45million expected to move
to the cities by 2012)
Car ownership to grow from 16 cars per 1000 people in 2002, to 267 cars per 1000
people in 2030 (by 2020 expected to have 140 million private cars on the road)
Only uses 10% of its energy for transport currently but will need huge amounts in the
future
Where does the energy come from?
Coal – Relies on coal for 70% of its electricity generation and the huge demand means China is
building on average 3 coal-fired power stations a week. Creates environmental problems for them e.g.
Beijing Olympics. Majority of the coal is located in the north and west, whilst industry is located in
the south and east.
HEP – Accounts for 16% of china’s energy production e.g. Three Gorges Dam and China aims to build
HEP dams on all of its major rivers
Oil – Oil production has now peaked and exploration into offshore fields has begun, however
territorial disagreements in the South China Sea is making this difficult importing more oil
Future:
China’s energy security problems matter to the rest of the world due to its size and the impact that
an increase in demand would have on everyone else. However is energy dependency is only 12%
compared with USA of 40% and Japan of 80%.
Potential Exam Question: Discuss how far economic development can be affected by energy
security (15 marks)
Impact of geopolitics on energy security
Created by Natalie Garthwaite 2010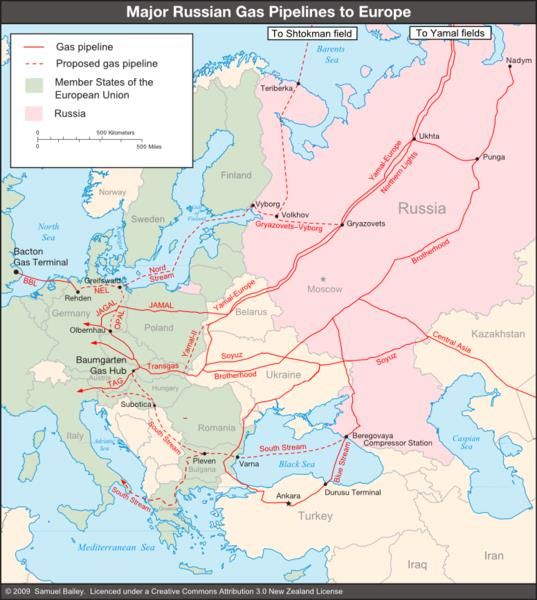
Energy security demands on resource availability, both domestic and foreign, and security of supply.
It can be affected by geopolitics because there is little excess capacity to ease pressure on energy
supplies if supply becomes disrupted. For example, following the 1973 Arab-Israeli war, the Arab
nations reduced the supply of oil to the USA and Western Europe to reduce their support for Israel
– this created a serious energy shortage.
Since then in 1977 the USA construction a ‘Strategic Petroleum Reserve’ with the initial aim to store
1 billion barrels of oil which could be used in the event of supply issues.
Energy pathways problems with these
Energy pathways between producers and consumers highlight the considerable levels of risk
involved in the energy industry.
Patterns:
Oil has a complex global pattern of PATHWAYS and PLAYERS (exporters and importers).
The Middle East exports around 15 000 barrels per day, mainly to Japan, Europe and CHINA.
Substantial amounts flow from Africa, Canada and South and Central America TO the USA.
Russia supplies some oil to CHINA, but the bulk of its exports now head to Europe.
Gas pathways are different in that they tend to be localised and regional rather than global.
Traditionally gas is transported through pipelines, whereas oil has been transported by ship.
A possible future is that as movement through pipeline becomes less dependable (for political
reasons); there will be a switch towards shipping gas in tankers as LNG.
Physical and human causes of disruption:
Long running tensions in the Middle East e.g. destruction of oil wells during Iraq war
consumed 6 million barrels of oil a day for 8 months
Hurricane Katrina in 2005 affecting oil production and refining in the Gulf of Mexico
causing oil and petrol prices to rise
In 2005 – explosions and fires at Buncefield Oil Storage Depot destroyed fuel worth £10
million. It supplies Heathrow and as a result had to ration fuel
2006 and 2008 disputes between Russian and Ukraine disrupted gas supplies to Western
Europe.
Trans-
Siberi
an
Pipelin
e
Created by Natalie Garthwaite 2010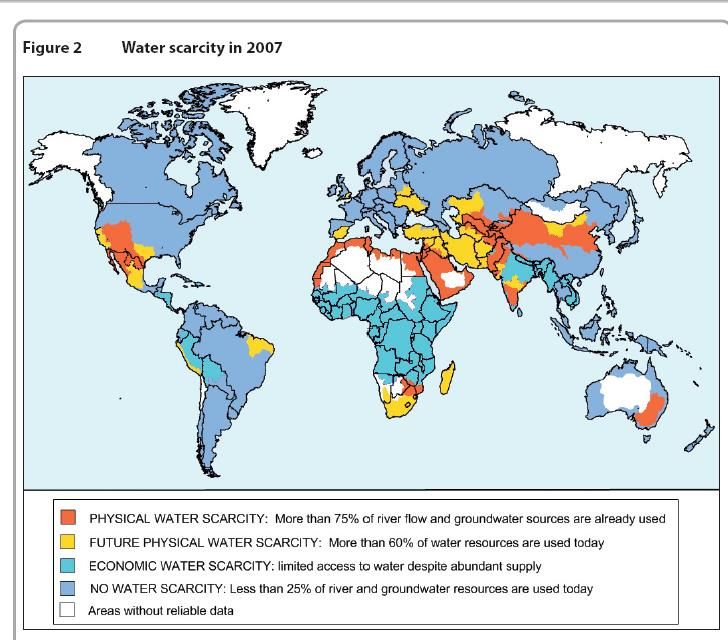
The pipeline project was proposed in 1978 as an export pipeline from Russia to Europe. The pipeline
was constructed in 1982-1984. The pipeline runs from Siberia's gas field to Uzhgorod in Western
Ukraine. From there, the natural gas is transported to Central and Western European countries.
Trans-Alaskan pipeline crosses 3 mountain ranges and several large rivers. In these areas there are
issues of permafrost and to avoid this pipelines are build above ground

How energy supplies can be disrupted e.g. Russia
Background:
• Tensions between Russia and Ukraine have been high since 2004,
   when pro-Western forces led by President Viktor Yushchenko
   won control of the government over Viktor Yanukovych, a
   Moscow ally. Russia also opposes Ukraine’s desire to join the
   North Atlantic Treaty Organization and the EU.
• The EU gets a quarter of its gas supplies from Russia - 80% of
   which passes through Ukraine

What sparked the crisis?
• Ukraine and Russia have faced negotiations over the renewal of gas supply contracts every year,
  but by midnight on 31 December 2008 they had failed to agree on the price Kiev should pay in
  2009.
• This has happened 3 times before but this year, gas supplies were completely halted from 7
  January, after Russia accused Ukraine of siphoning off gas meant for European customers, leaving
  more than a dozen countries without their expected supplies of Russian gas.
• The European Union called the supply cut "completely unacceptable", demanded immediate
  restoration and entered into shuttle diplomacy between Kiev and Moscow.
• A deal reached on 12 January, whereby EU and Russian observers would monitor supplies across
  Ukraine collapsed within hours. The EU said both sides had failed to meet its terms.
• The two countries also failed to agree on a price Russia would pay Ukraine for gas transit to
  Europe.

Impacts:
• Some, like Bulgaria, Serbia and Bosnia, are almost completely dependent on supplies via Ukraine
   and so were left with major shortages, during a very cold spell in Europe.
•   In the meantime European countries had to shut down industrial plants and domestic heating
    systems, find alternative sources of gas or switch energy plants to oil. Schools were shut and
    people had to revert to using log fires to heat their homes.

Europe’s energy security – should they be worried?
Created by Natalie Garthwaite 2010
Yes:
The amount of gas Russia supplies to Europe means that any disruptions have large-scale impacts
No:
Even during the Cold war the supply of Russian gas was stable and the Europe is now looking to
enhance its energy security through:
• Reducing its dependence on Russia—building of the South Caucasus pipeline supplying gas from
Azerbaijan via Turkey, bypassing Russian territory altogether
• Press Russia and Ukraine to sign long-term contracts, with accepted pricing formulae, similar
to those that Gazprom already has with most EU countries.
• Diversify its sources of energy, something that it must do anyway if it is to meet its ambitious
climate-change targets.
Potential Exam Question: Russia uses its oil and gas as a political and economic weapon. Discuss
Environment impacts of looking for more energy
Tar Sands in Canada
This place contains up to 2.5 trillion barrels of oil – that is more
than Saudi Arabia’s reserves
Oil sands are made of sand, water and a hydrocarbon tar called
bitumen. Since the rising oil prices and technological advances they
have now become more feasible to extract.
Alberta’s tar sands produced a million barrels of oil a day in 2003
and expected to reach 3.5 million a day by 2011. By 2030 they aim to produce at least 5 million a day
and export the surplus.
Problems:
Oil in the shale is not easily separated out so immense amount of heat is needed usually
through burning natural gas
Process uses huge amounts of water e.g. every barrel of oil produced requires 4 barrels of
water. The water then also becomes polluted where is can damage ecosystems
Issue of disposing of the shale once the oil has been removed
Very expensive and only viable when oil costs over $30 a barrel (costs $15 per barrel
compared with $2 for convectional crude oil)
Processes tar sands are a large source of greenhouse gas emissions
470km2 of forest have been removed and lakes of toxic waste cover 130km2
Benefits:
Alternative source of oil during times of political or access issues
By 2030 the tar sands could meet 16% of North America’s demand for oil ENERGY
SECURITY
Provide additional source of energy until more renewable sources can be found
Mining companies are required to replant land disturbed by mining
Oil is vital to Canada’s economy (2007= 20% of exports)
Created by Natalie Garthwaite 2010Players involved:
1. Canada and Venezuela (countries containing Tar Sands
2. TNCs e.g. Shell and BP
3. Alberta Energy Research Institute
4. Environmental groups e.g. Greenpeace
5. Local people (those employed by the companies or those affected by pollution)
Arctic Oil
This place is estimated to contain up to 25% of the world’s
undiscovered oil and natural gas. Issue regarding who can lay
claim to which parts of the ocean – Russia has claimed nearly
half of the Arctic but other interested parties e.g. USA,
Norway failed to uphold their claim.
Problems:
Oil companies have already destroyed large parts of
Alaska and Siberia so should be kept out of the Arctic
New oil rush in the Arctic is only possible because of
the increased shrinking of the polar ice cap due to global warming
The Arctic is a pristine environment containing over 45 species of land and marine animals
Issue over who has the right to claim ownership of the natural resources – countries who have
been conflicting over this have now agreed to sign the UN Law of the Sea Convection stating
the 8 Arctic states are allowing to exploit offshore resources within 200 nautical miles of
their territory
Benefits:
At around $70 per barrel it makes drilling in the Arctic viable. (2007 prices reached $100).
Contains up to 25% of the world’s undiscovered oil and natural gas
Players involved:
1. Arctic States – USA, Russia, Canada, Norway, Denmark, Finland, Sweden and Iceland
2. UN – will decide the control of the Arctic by 2020
3. Local people
4. Environmental Pressure groups
Who they key players are in supplying future oil
Energy TNCs e.g. Shell
Created by Natalie Garthwaite 2010Historically the energy industries have been dominated by large TNCs such as Shell but the power of the TNCs has been challenged by OPEC and recently national energy companies. This is due to the fact that TNCs have come under attack from environmental groups and companies like BP have worked hard to establish a positive public image through investments in renewable energies. Shell consists of a global group of energy and petrochemicals companies with a strategy to reinforce their position as a leader in the oil and gas industry in order. One of their focuses has been to explore for new oil and gas reserves. Key Facts: Produce 2% amount of world’s oil Produce 3% amount of world’s gas 3.1 million barrels of gas and oil every day $2 billion spent on CO2 and renewable energy technologies over the last 5 years. In 2009 greenhouse gas emissions were approximately 35% below 1990 levels. OPEC The Organization of the Petroleum Exporting Countries (OPEC) is a permanent intergovernmental organization of 12 oil-exporting developing nations OPEC was formed in 1960 to protect the interests of oil-producing companies and have formed what some view as a CARTEL. Its sets oil production quotas for its members in response to economic growth rates and demand-and-supply conditions. It therefore aims to ensure fair and stable prices for its members. At the end of 2006, the OPEC members had over 78% of the world’s total oil reserves and they produce around 45% of the world’s crude oil and 18% of its natural gas. OPEC is criticised that it controls the price of oil as it is worried that increasing the supply of oil would mean investors would stop investing causing a collapse in the price. Why we are uncertain about the future of energy It is hard to predict energy demand as it is strongly affected by economic growth rates, conservation of resources and the pace at which the world can switch to renewable sources of power. It is thought that world oil demand will grow by 32% by 2020 and global gas demand by 48%. The issue of Peak Oil: The International Energy Agency predicted peak oil production to occur between 2013 and 2037, whilst USA Geological Survey predicted it is at least 50 years away. Created by Natalie Garthwaite 2010
The advantages and disadvantages of the possible futures
Business as usual
If we do nothing forecasts predict that by 2030:
Global primary energy demand will rise by 53%
Fossil fuels will remain the dominant source of energy worldwide
Emissions from electricity generation will account for 44% of energy-related emissions
Over 70% increase in the energy demand will come from developing countries due to rapid
economic growth and population growth
Nuclear
By 2008, 439 nuclear reactors were supplying 15% of the world’s electricity
Does not produce greenhouse gas emissions
Uranium is relatively cheap to mine and reserves should last around 150 years
Very cost effective to transport as only used in small quantities
Produces 1% of global electricity supply
1986 Chernobyl incident highlights the issues
Very expensive to build – several billion pounds
Nuclear waste disposal is an issue as it remains radioactive for 10,000 years
Renewable energy with the emphasis on wind power
Costs of generating wind today are about 10% of what they were 20 years ago
In some areas first generation wind turbines are being replaced with modern turbines which
give better performance
NIMBY – people are concerned that the turbines could blight their homes and views
Turbines can kill birds
Suitable areas are often near the coast where land is expensive
Created by Natalie Garthwaite 2010Energy Conservation
a) Combined Heat and Power (CHP) power stations waste 65% of the heat they generate but
CHP plants can be up to 95% efficient as they can use different fuels in the same boiler
including biomass but also cut emissions and reduce fuel dependency
b) Green Taxation aimed at cutting the use of natural resources and encouraging recycling. E.g.
road tax increase in 2010 will see 9.4 million motorists pay more road tax aimed to punishing
heaviest polluting cars. The government will receive more that £1billion in additional revenue.
How energy insecurity will lead to geopolitical tensions
USA Involvement in the Middle East
In March 2003 USA and allied forces invaded Iraq (4th largest oil reserves in the world); the then
leader was considered to pose a threat to the security of Western oil supplies in the Middle East as
he was making deals with Russian and Chinese oil companies. Before the invasion the USA put
pressure on Iraq to admit it had stockpiled weapons of mass destructions or faces military action.
The USA goal in invading Iraq was to reduce its dependence on Saudi Arabia for oil and increase its
energy security by introducing a new supplier, Iraq. The USA hoped that its involvement in Iraq and
Afghanistan would democratise the Middle East. However, America is excluded from deals between
Russia, China and Iran and is fighting hard to secure oil by means of energy pathways running through
friendly countries.
China vs. India
India’s demand for energy has grown due to high economic growth rates, lack of energy-efficient
technologies, reliance on heavy industry and widespread power stealing. In 2005 oil imports
accounted for 2/3rds of India’s oil consumption and China is seen to be much more energy secure
than India. In terms of investment India is also behind with only $3.5nillion in overseas exploration
compared with $40 billion made by China. Various policies have been introduced:
India will have to rely on imported oil and gas in the short term required increased
diplomacy with South Asia etc
Investing in offshore gas fields in Vietnam
However, India has strained relations with energy suppliers and the countries that the supplies have
to pass through.
How can meet our future energy needs?
Created by Natalie Garthwaite 2010Emissions controls – Kyoto Protocol adopted in 1997 aimed to reduce greenhouse gas emissions. Countries are required to achieve specific reductions in their greenhouse emissions (average of 5% against 1990 levels by 2012). The USA refused to sign Emissions trading – EU emission Trading Scheme meant that heavy industrial plants have to buy permits to emit greenhouse gases over the limit they are allowed by government. Under the Kyoto Protcol carbon emissions are now tracked and traded like a commodity so that any excess reductions can be sold in the ‘carbon market’ Green taxes – Taxes on individuals for using air transport and pollution charges on companies. Other ideas are aimed to reduce energy consumption such as removing stamp duty on carbon neutral homes Offshore wind turbines – Building offshore costs at least 50% more than on land but wind speeds are generally double those on land so they can generate more electricity. Carbon storage – this involves capturing the carbon dioxide released by burning coal and burying it deep underground, but it is not proved that the carbon dioxide will actually stay underground and it is very expensive. Geothermal – In the Philippines 25% of the electricity is generated from underground heat which is free and available all day. However, the heat is often too deep to be economical. Bio fuels – algae – There are 3 main types; crops e.g. grasses, sugar, trees and algae. Algae are hard to grow but produce oil that requires less refining before it becomes a bio fuel. What types of questions have been asked? Study Figure 1. (Explain why oil exploration in the areas shown could lead to high economic and environmental costs. (10) Created by Natalie Garthwaite 2010
Assess the relative importance of named players in the global supply of energy. (15)

The development of alternative energy sources is a possible response to future energy demands.
Assess the possible costs and benefits of this approach. (15)

Explain how the world price of oil has a major impact on oil exploration by TNCs and governments (10)

Assess the potential environmental, economic and political risks in exploiting new energy resources
(15)

Suggest how the contrasting distribution/pattern of major oil exporters and importers shown in
Figure 1 could affect the energy security of some nations. (10)

Created by Natalie Garthwaite 2010
Study

Figure 1.
Suggest the possible environmental consequences of the changes in electricity consumption shown.
(10 marks)

Assess the degree of uncertainty over future global sources of energy supply (15 marks)

                                 Topic 2: Water Conflicts
Created by Natalie Garthwaite 2010
What do I need to know? Physical factors affecting water supply – Climate, river systems and Geology Example of California to support How water stress can occur – Agriculture, Industry, Domestic use and supply Examples of China and India to support 3 How Human activity can make water stress worse – pollution, over extraction and salt water incursion How water supply is linked to development Water Poverty Index – examples of Canada and Ethiopia Aral Sea case study – role of different key players here and impacts Conflicts over the same water source – examples of Middle East, Ganges and Nile Geopolitics of water supply within a country – example of Colorado River Basin USA and Helsinki Rules What water future are going to be How different key players opinions on future water usage may conflict Dams as a solution – example of 3 Gorges Dam, China. Impacts of these Water transfer schemes as a solution. Learn the pros and cons of 2 of China transfer, Ebro River, Snowy Mountain or Turkey to Israel How Restoration can solve the problems – example of River Kissimmee and Aral sea Role of Water Aid ( NGO) in solving problems How we can conserve water Role of technology in solving future problems e.g. desalinisation, drip irrigation, GM crops Created by Natalie Garthwaite 2010
Key Terms
Aquifer                A rock, such as chalk, which will hold water and let it through
Arid and semi-arid     Describe conditions where rainfall is less than 250mm and 500mm of
                       precipitation per year respectively
Desalination           The conversion of salt water into fresh water
Drought                An extended period of abnormally dry weather that causes water shortages and
                       crop damage. A drought starts when total rainfall is well below average for
                       several months.
El Nino                A southerly warm ocean current, which develops off the coast of Ecuador, it is
                       associated with major variations in tropical climates
Groundwater            All water found under the surface of the ground which is not chemically
                       combined with any minerals present, but not including underground streams
High pressure          A region of high atmospheric pressure, otherwise known as an anticyclone
Infiltration           The process of the water entering rocks or soil
Irrigation             The supply of water to the land by means of channels, streams and sprinklers in
                       order to permit the growth of crops
La Nina                An extensive cooling of the central and eastern Pacific. Globally La Nina means
                       that parts of the world that normally experience dry weather will be drier and
                       those with wet weather will be wetter.
Percolation            The filtering of water downwards through soil and through bedding planes,
                       joints and pores of a permeable rock
Potential              The amount of evaporation and transpiration that can occur given a sufficient
Evapotranspiration     supply of water
Precipitation          The deposition of moisture from the atmosphere onto the Earth’s surface in
                       form of rain, hail, snow, frost or sleet
Prevailing             Most frequent, most common
Privatisation          The sale of a business/industry so that it is no longer owned by the government
Rain shadow            An area of relatively low rainfall to the lee side of uplands (sheltered from
                       winds). The incoming air has been forced to rise over the highlands causing
                       precipitation on the windward side
Relief Rainfall        This forms when moisture-laden air masses are forced to rise over ground. The
                       air is cooled, the water vapour condenses, and precipitation occurs
Riparian               Relating to a river bank. Owners of land crossed or bounded by a river have
                       ‘riparian’ rights to use the river
Spatial imbalance      The uneven distribution/location across a landscape or surface of e.g. population
Stream flow            The flow of water in streams, rivers and other channels.
Surface runoff         The movement of over ground of rainwater. It occurs when the rainfall is very
                       heavy and when the rocks and soil can absorb no more
Urbanisation           The migration of rural populations into towns and cities.
Virtual water          The amount of water used in the production of a good or service
Water rights           The legal right of a user to use water from a water source e.g. a river
Water Scarcity         Can be divided into ‘apparent scarcity’ which exists when there is plenty of
                       water but it is used wastefully, and ‘real scarcity’ which is caused by
                       insufficient rainfall or too many people relying on a limited resource
Water Stress           Measured as annual water supplies below 1,700m3 per person
Water wars             International conflict as a result of pressure on water supplies.
World Water Gap        The difference between those people, who live in water poverty and those who

Created by Natalie Garthwaite 2010
have ready and reliable access to water for drinking and sanitation
Physical factors affecting water supply – Climate, river systems
and Geology
Case Study: Factors affecting California’s water supply
Geographical Controls on water supply:
Mountain chains run parallel to the coast and prevent moist air reaching inland
Most rainfall falls in a coastal zone no more than 250km wide
South and far east of California receive under 100mm of rainfall due to the rain shadow cast by
the Sierra Nevada mountains
High pressure systems over the Pacific ocean block moist air currents reaching southern
California
Most of the major rivers are fed by snowmelt from the Sierra Nevada Mountains.
In recent years extended droughts have meant groundwater and surface storage levels have
decreased
Threats:
a) Precipitation
Much of California is arid with annual average precipitation of between 200-500mm
65% of precipitation is lost through Evapotranspiration, 13% flows out to sea = only 22%
for human use
50% of the rain falls between November and March = seasonal shortages
b) Population
Created by Natalie Garthwaite 2010 Has grown from 2 million people in 1900 to 37.7 million in 2007
Spatial imbalance as three quarters of demand for water comes from areas south of the
Sacramento – 75% of the rain falls to the north
Increasing demands for water exceed natural supplies
How water stress can occur – Agriculture, Industry, Domestic use
and supply
Water stress occurs when demand for water exceeds the amount available during a certain period,
or when poor quality restricts its use. Therefore when a country’s water consumption is more than
10% of its renewable freshwater rate it is said to be water stressed.
During the 20th Century water consumption has increased by 600% due to population growth and
economic development:
Farming uses 70% of all water and in LEDCs this is up to 90%
Industrial and domestic use has to compete with farming needs as a country develops
Daily domestic water use on average is 47 litres per person in Africa, compared with 578
litres in the USA
This has lead to the development of a world water gap with 1.4 billion lacking clean drinking water and
12% of the world’s population consuming 85% of the world’s water.
Agriculture some forms of farming are less water efficient than others e.g. a kg of beef is 10x
more water costly to produce then a kg of rice. 17% of the global area used for growing crops is
irrigated.
Industry 21% used for industry but rapid growth expected since the development of countries
such as India and China. Industry is generally a more efficient user of water then farming.
Domestic Only 10% of world’s water is used for this purpose but this varies from country to
country. Domestic demand seems to be doubling every 20 years.
Named Examples: India vs. China
India
4% of the world’s freshwater but 16% of the population
Demand will exceed supply by 2020
Water tables are falling rapidly as 21 million wells are used
China
8% of the world’s freshwater but 22% of the population
2/3rds of cities do not have enough water all year round
Stress levels expected to occur by 2030
Created by Natalie Garthwaite 2010 Annual population growth rate is about 2.5% in Beijing
Water table has been lowered in some areas by 40m
How Human activity can make water stress worse – pollution, over
extraction and salt water incursion
Key factors:
a) Sewage disposal in developing countries is expected to cause 135 million deaths by 2020. In the
UK we add 1,400 million litres of sewage to our rivers daily although most of it has been treated
b) Chemical fertilisers contaminate groundwater as well as river and water supplies. These add
nutrients to the water leading to an increase in the growth of algae downstream.
c) Industrial waste – every year the world generate 400 billion tonnes of industrial waste which is
pumped untreated into rivers, seas etc.
d) Dams – trap sediment in reservoirs which reduces floodplain fertility and the flow of nutrient
from rivers into seas.
e) Abstraction – removing water from rivers and groundwater sources can cause issues that in some
arid areas rainfall can never recharge these underground stores and the removal of freshwater
from aquifers in coastal locations can lead to salt water incursion.
How water supply is linked to development Water Poverty Index
Water insecurity means not having access to sufficient, safe water. Around 20 developing countries
are classified as ‘water scarce’. Water scarcity occurs for 2 main reasons:
1) Physical scarcity – shortages occur because demand exceeds supply
2) Economic scarcity - people cannot afford water, even when it is readily available
The Water Poverty Index was established in 2002 and uses 5 parameters:
Resources – the quantity of surface and groundwater per person, and its quality
Access – the time and distance involved in obtaining sufficient and safe water
Capacity – how well the community manages its water
Use – how economically water is used in the home and by agriculture and industry
Environment – ecological sustainability (green water –freshwater taken from rainwater stores
in the soil as soil moisture)
Each of these is scored out of 20 to give a maximum of 100
How water links to poverty:
Lack of water hampers attempts to reduce
poverty and encourage development. Improved
water supply can increase food production, bring
better health and provide better standards of
wellbeing.
Created by Natalie Garthwaite 2010Named Examples: Canada vs. Ethiopia
These 2 countries are at the opposite ends of the spectrum when looking at water and development.
Canada Ethiopia
Each household uses 800 litres per person Each person uses 1 litre per day
per day Water is fetched daily from a shared
Water used for lawns, parks and swimming source
pools Issues of water shortages, pollution and
Issues of rising water bills and leakages risk of disease
Water poverty index = 78 Water poverty index = 45
Water use agricultural = 12% Water use agricultural = 93%
Water use industrial = 69% Water use industrial = 6%
Water use domestic = 20% Water use domestic = 1%
GNI ($ per person) = 33,170 GNI ($ per person) = 170
Population in 2000 (millions) = 30 Population in 2000 (millions) = 62.9
What problems can the use of water sources create?
Secure water supplies are needed to support irrigation and food production, manufacturing and
energy generation. However the use of water resources can lead to various problems. E.g. the
depletion of underground aquifers and salinisation of the soil.
Created by Natalie Garthwaite 2010Aral Sea case study – role of different key players here and
impacts
Location: north-western part of Uzbekistan and southern
Kazakhstan
Background: Formerly, one of the four largest lakes of the world
with an area of 68,000 square kilometers, the Aral Sea has been
steadily shrinking since the 1960s.
Causes:
In the early 1960's, the Soviet central government decided to make
the Soviet Union self-sufficient in cotton and increase rice
production. Government officials ordered the additional amount of needed water to be taken from
the two rivers that feed the Aral Sea. Large dams were built across both rivers, and an 850-mile
central canal with a far-reaching system of "feeder" canals was created.
Impacts:
1) Over 30 years, the Aral Sea experienced a severe drop in water level, its shoreline receded,
and its salt content increased. The water level has dropped by 16 metres and the volume has
been reduced by 75%
2) The marine environment became hostile to the sea life in it, killing the plants and animals. As
the marine life died, the fishing industry suffered. All 20 known fish species in the Aral Sea
are now extinct, unable to survive the toxic, salty sludge.
3) The sea has shrunk to two-fifths of its original size and now ranks about 10th in the world.
4) Drinking water supplies have dwindled, and the water is contaminated with pesticides and
other agricultural chemicals as well as bacteria and viruses.
5) Highly toxic pesticides and other harmful chemicals are blown from the dried-up sea
creating dust containing these toxic chemicals.
6) As the Aral Sea has lost water, the climate has become more extreme.
7) Respiratory illnesses including tuberculosis and cancer, digestive disorders and infectious
diseases are common ailments in the region.
8) There is a high child mortality rate of 75 in every 1,000 newborns and maternity death of 12
in every 1,000 women.
9) The Aral Sea fishing industry, which use to employ 40,000 and reportedly produced one-
sixth of the Soviet Union's entire fish catch, has been ruined
The stakeholders involved:
The former soviet government – began the irrigation scheme designed to develop fruit and cotton
farming
Fishing community – use to be a prosperous industry but now huge unemployment
Local residents – health problems and highest infant mortality rates in the world
Scientists – climate has now changed and extinction of species in the area
International economists – people can no longer feed themselves as the land is infertile, could
create 10 million environmental refugees
Created by Natalie Garthwaite 2010Conflicts over the same water source Water conflicts occur when the demand for water overtakes the supply and several stakeholders wish to use the same resource. Conflict is more likely where developing countries are involved as water is vital to feed their growing populations and promote industrial development. The UN reports there are around 300 potential water conflicts in the world. Some examples include: China vs. India due to the Brahmaputra River Turkey vs. Syria and Iraq due to the Euphrates and Tigris Rivers India vs. Pakistan due to the Indus River Case Study: Middle East Water conflicts The Middle East is one of the most water-scarce regions in the world. Due to population growth, increasing affluence (demands for swimming pools etc) and the development of irrigated farmlands there are increasing pressures on the water supplies. Further instability is created due to: - Overall scarcity of water but also poor access - Declining oil reserves with future drop in oil revenues - rising youthful population and increasing demands At the moment the Middle East uses revenue from their oil exports to pay for expensive desalinisation plants to provide extra water, but also pay for water and food imports. No single country in the Middle East can resolve its water problems without impacting on another country. Potential conflicts: 1) The Euphrates and Tigris rivers originate in Turkey but supply Syria and Iraq with water. Turkey wants to dam these rivers to improve incomes in Anatolia (south-east turkey) 2) In 1967, Syria and other Arab states objected to Israel’s National Water Carrier Project and tried to destroy it. Israel then bombed their attempts to divert the River Jordan from Israel 3) Droughts across the whole region between 1990-2005 increased fears of conflicts 4) Bombing of Lebanese water pipelines by Israel in 2006 Geopolitics of water supply within a country Often when countries compete for water resources international agreements and treaties have to be drawn up on how best to manage shared water supplies. Under the Helsinki Rules there is an agreement that international treaties must include concepts such as equitable use and share. Therefore the criteria for water sharing should include: Natural factors – rainfall amounts, share of drainage basin Social and economic needs – population size, development Downstream impacts –restricting flow, lowering water tables Dependency – are alternative water sources available? Prior use – existing vs. potential use Efficiency – avoiding waste and mismanagement of water Created by Natalie Garthwaite 2010
Case Study - Geopolitics with the USA: The Colorado River
Background – The basin of the Colorado River is the most heavily used source of irrigation water in
the USA. Original water rights were allocated in 1933. Since then a series of treaties between the
7 US states with water rights and between Mexico have been signed. A series of dams has been built
to serve the water needs to 30 million people.

Agreements:
1920s ‘Law of the River’ = divided the water between upper basin states or Colorado, Wyoming, Utah
and New Mexico and their responsibility to supply the lower basin states. California was given
highest proportion of water due to its large population and political power. (Around this time was a
period of higher rainfall and water surpluses)

Stakeholders and conflicts

Issues of developing water pathways
In some areas with a shortage of water one of the solutions is to divert water from one drainage
basin to another. However these can produce political risks

Created by Natalie Garthwaite 2010
Case Study: The Snowy Mountains Scheme
This scheme involves 16 major dams, 7 power stations and a network of pipes and aqueducts.
P
roblems created:
Creation of storage lakes has destroyed wildlife habitats
Snowy River flow has fallen to 1%
Groundwater salinisation results from low flow
Water scarcity has lead to competition between users
Political fallout meant governments had to restore some of the flow in the Snowy River and invest
in water-saving projects
Record droughts due to El Nino have used up the water allocations
Water future s?
The issues of future projections are that climate change is occurring but its exact impact cannot be
predicted. Also continued economic growth may not be inevitable e.g. credit crunch, finally political
and religious conflicts can create further issues.
Alternative scenarios for water by 2025
Scenario Water Changes by 2025 Wider impacts
Water scarcity will reduce food production Developing countries will rely on
Business as usual
Consumption will rise by +50% food imports but increased
Household water use rise by +70% hunger
Industrial water demand in developing In parts of western USA, China
countries will increase etc water will be pumped out
faster than can be recharged
Global water consumption will increase Food production will decline and
Water Crisis
Demand for domestic water will fall food prices increase
Demand for industrial water will +33% Conflict over water between
and within countries will
increase
Created by Natalie Garthwaite 2010 Global & industrial water use will have to fall Food production could increase
Sustainable Global rain-fed crop yields increase due to slightly
Water improvements in water harvesting and Investment in crop research
sustainable farming and technology would increase
Agricultural and domestic water prices Unsustainable pumping of
double groundwater would end
How different key player’s opinions on future water usage may
conflict
Different players and decision makers have key roles to play in securing future water supplies but
their aims may conflict.
Category Players
Political International organisations e.g. UN, regional and local
councils, pressure groups
Economic (Business) World Bank, governments, utility companies e.g.
Thames Water, agriculture, industry, TNCs
Social (Human welfare) Individuals, residents, farmers, consumers, NGOs e.g.
Water Aid
Environmental (sustainable Development) Conservationists, planners, NGOs e.g. WWF
Alternative Strategies for managing water supplies in the future
Hard engineering projects to increase water shortage and transfer
Case Study: China’s Three Gorges Dam
Location: Yangtze River and is the world’s largest hydroelectric scheme
Benefits Costs
18,000MW of electricity generated Dammed waters will down 100,000 hectares
Will supply water to the region responsible 1.9 million people will be displaced
for 22% of China’s GDP Pollution increases as abandoned mines and
Flood protection will save lives and cut factories are flooded
financial losses Dam failure, earthquakes and heavy rain could
Navigational improvements could open up cause serious issues
China’s interior to development Ecological impacts on fishing and habitats
Case Study: China’s South-North Transfer Project
Project began in 2003 and involves building 3 canals to run across the eastern, middle and western
parts of China and link the country’s 4 main rivers.
Benefits Costs
Created by Natalie Garthwaite 2010 Transfer 44.8 billion m3 per year Significant ecological and environmental
Central government to pay 60% of the cost impacts along the waterways
Water conservation, improved irrigation, Resettlement of people will be needed
pollution treatment and environmental project Declining water quality
Will supply big cities like Beijing Will cost $62 billion
Will take 50 years to complete
Restoration
At a local scale this can involve restoring meanders, replanting vegetation and using sustainable
methods to manage watercourses for people and the environment.
Case Study: Restoring the Aral Sea
In 2007 the Kazakhstan government secured a $126 million loan from the World Bank to help save
the northern part of the Aral Sea. The government has already built a dam to split the sea into 2
parts and the new loan is to be used to build a dam to bring the water back into the deserted port of
Aralsk.
Fisherman have been able to resume fishing
Rain has returned
The southern part of the sea is still shrinking
The waters from the Amu Darya and Syr Darya are controlled by other countries
Water conservation
This involves reducing the amount of water used (demand) rather than trying to increase water
supplies. In the UK around 22% of water does not reach the end user due to leakage. Examples
include:
1) Reducing domestic consumption
- installing water meters in every home
- reducing the amount of water used in lavatory cisterns
- planting drought resistant species in ‘water-wise’ gardens
- using grey water to flush the lavatory or water the garden
2) Reducing industry consumption
- installing more efficient systems to reduce water costs
- Agricultural irrigation = use of micro-irrigation techniques using drip irrigation from tubes
reduces the volume of water used
Role of technology in solving future problems
Technology can help increase both water supply and access. Examples include:
Desalination – provides 70% of Saudi Arabia’s water but it is the most expensive option for
water supply due to its energy use
Towing flexible polypropylene bags will with freshwater has been propose e.g. Kielder to Essex
USA uses reverse osmosis membrane technology to filter salt from brackish water
Created by Natalie Garthwaite 2010 In developing countries ore intermediate technology is more appropriate:
- Water collection e.g. catching rainwater or building small dams
- Wells built by NGOs e.g. Water Aid
- Using plastic or glass bottles filled with contaminated water exposed to the sun for 6 hours
destroys micro-organisms
What questions have been asked?
Using named examples assess the role of different players and decision makers in trying to secure a
sustainable ‘water future’ (15)
Referring to examples, assess the potential for water conflict in areas where demand exceed supply
(15)
Referring to examples, explain why future water supplies for many regions are increasingly insecure
(15)
Referring to examples, assess the validity of the statement that ‘water conflicts are as much to do
with water quality as quantity’ (15)
Suggest how water resources and human wellbeing might be affected by the data in Figure 2 (10)
Created by Natalie Garthwaite 2010Explain how physical and human factors have contributed to the variation in water scarcity shown (10) Jan 2010 Using named examples, assess the contribution of large scale water management projects in increasing water security (15) Jan 2010 Study Figure 2. Explain how human interference in the water cycle can affect water availability. (10) Using named examples, assess the potential for water supply to become a source of conflict. (15) Created by Natalie Garthwaite 2010
Topic 3: Biodiversity under Threat
What do I need to know?
Ways in which biodiversity can be defined
Key processes and factors that influence biodiversity
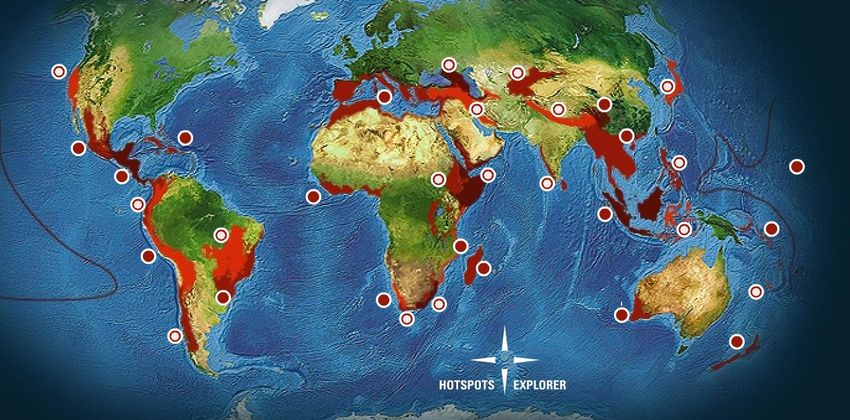
Global distribution of biodiversity and biodiversity hotspots
The value of ecosystems
The distribution of threatened areas
Global factors threaten biodiversity
The impact of these threats on ecosystem processes
The link between economic development and ecosystem destruction/degradation
The concept of sustainable yield
The role of different players in managing biodiversity
Spectrum of strategies and policies for managing biodiversity
The future of biodiversity
Created by Natalie Garthwaite 2010Key Terms:
Biomass The total amount of organic matter
Biome A major terrestrial ecosystem of the world.
Ecosystem A system of which both the living organisms and their environment form
components (elements) - these components are linked together by flows
and are separated from the outside by a boundary.
Succession The gradual and predictable change in plant and animal species over time,
for example bare ground is colonised by plants and there is a series of
sequential replacements as one set of dominant plants replaces the other
Net primary productivity The difference between the rate of conversion of solar energy into
(NPP) biomass in an ecosystem and the rate at which energy is used to maintain
the producers of the system
Biotic Living components of an ecosystem
Abiotic The non-living parts of an ecosystem
Goods and services ‘goods’ are direct products that can be derived from an ecosystem and
‘services’ are the benefits that the ecosystem provides
Energy flow The movement of energy through a community
Nutrient cycle The movement of nutrients in the ecosystem between the three major
stores of the soil, biomass and litter.
biodiversity The variability amongst living organisms from all sources including
terrestrial, marine and other aquatic systems, and the ecological
complexes of which they are part: this includes diversity within species,
between species and of ecosystems.
conservation The protection of natural or man-made resources for later use.
Habitat The place where a particular species lives and grows. It is essentially the
environment- at least the physical environment- that surrounds,
influences and is utilised by a particular species.
Endemic species Exclusively native to a particular place of region. Endemic species tend to
have a high conservation value.
Sustainable Yield Key part of sustainable management of ecosystems. It represents the
‘safe’ level of harvest that can be hunted/caught/utilised without
harming the individual ecosystem
Genetic diversity The diversity of genes found within a species
Species diversity The variety of plant/animal species in a given area (habitat)
Ecosystem diversity The variety of different ecosystems and the habitats surrounding them
in a given area, it includes biotic and Abiotic components.
Biodiversity Hotpot An area containing a huge number of species, a large percentage of which
are endemic
WRI (World Resources An economic scorecard which shows the condition of the world’s major
Institute) ecosystems and their ability to provide future good and services.
MEA (millennium A multi scale assessment commissioned by the UN
ecosystem assessment)
Destruction Loss in quantity
Degradation Loss in quality
Created by Natalie Garthwaite 2010You can also read