Secular Stagnation, the Long-Term Real Bond Rate Outlook and Policy Issues for NSW and Australia - Adrian Blundell-Wignall (Consultant)
←
→
Page content transcription
If your browser does not render page correctly, please read the page content below
May 2021
                                           TTRP 21-06

2021 Intergenerational Report
Treasury Technical Research Paper Series

Secular Stagnation, the
Long-Term Real Bond
Rate Outlook and Policy
Issues for NSW and
Australia
_________
Adrian Blundell-Wignall
(Consultant)
Acknowledgement
NSW Treasury acknowledges the Traditional Owners of the land on which we live and work, the
oldest continuing cultures in human history.

We pay respect to Elders past and present, and the emerging leaders of tomorrow.

We celebrate the continuing connection of Aboriginal and Torres Strait Islander peoples to Country,
language and culture and acknowledge the important contributions Aboriginal and Torres Strait
Islander peoples make to our communities and economies.

We reflect on the continuing impact of policies of the past and recognise our responsibility to work
with and for Aboriginal and Torres Strait Islander peoples, families and communities, towards better
economic, social and cultural outcomes.

Note

Dr Adrian Blundell-Wignall is a former Director of the OECD and currently he holds the post of Adjunct
Professor at Sydney University. He is a board member of the OECD pension fund, and a part-time
columnist for the Australian Financial Review. Dr Blundell-Wignall is also Chairman of the Anika
Foundation, supporting research into adolescent depression and suicide.

The views in this report are his own and do not seek to represent those of the NSW Government or
any past or current employers. The author is grateful to Michael Warlters and Stephen Walters for
suggesting this intriguing topic, and to members of NSW Treasury for comments on an early draft
(particularly Michael Warlters, Luke Maguire, and Kevin Ge). All remaining errors are his alone.

TTRP21-06 Secular Stagnation, the Long-Term Real Bond Rate Outlook and Policy Issues for NSW
and Australia                                                                                1
Preface
Ex ante excess saving versus investment in the global economy has worked to bring about
their ex post equality via extremely low real interest rates. Returns on investment have fallen
and deflation pressure has been a feature for most OECD countries.

The ‘saving glut’ view originally put forward by Ben Bernanke (2005) to explain these
outcomes is the most plausible of those offered in the literature. The view that excess saving
affected the US disproportionately due to its special role in the international financial system
is supported by the data. Probability weighting different future global scenarios suggest
convergence of the US 10-year real rate to an equilibrium of 1.85 per cent, which is also
consistent with estimated potential growth.

The empirical estimate for the Australian real 10-year rate is based on interest rate parity
with the US real rate and long-run Australian dollar equilibrium. The estimated real
equilibrium bond rate from this approach converges to 2.1 per cent in the long run, also
consistent with estimated potential growth. Cross-checking with a model based on domestic
and foreign saving influences confirms similar estimates.

The savings trends in major regions, and the probabilities attached to them, are set to be
consistent with global demographic trends and GDP profiles provided by the World Bank.
Debt levels in the various regions, China’s likely slowing, and the implications of the Belt and
Road Initiative also influence the weighting for different scenarios used for the real interest
rate projections.

Australian and NSW productivity growth compares poorly with other countries. The US is
singled out for comparison because it has a high level of productivity (harder to improve
upon) and Sweden because it is a similar size to NSW and mining is (likewise) unimportant.
Both countries do better in comparison to Australia.

Mining and finance are shown to be entirely unsuitable for any plan to improve Australian
and NSW productivity growth over the long run. Mining productivity growth was been
especially poor. However, productivity growth excluding mining and finance, the bulk of the
economy that needs to be a focus of any plan, is also poor.

A plan for NSW that makes sense is feasible, and some characteristics of Sweden’s success
are argued to be informative for NSW planning. Such policies will require physical and social
infrastructure spending, and the growth and the real interest rate projections in this study are
favourable for borrowing to implement such projects, particularly if a higher growth rate is
associated with them. When assessing individual projects, hurdle rates should avoid giving
too much weight to the recent distorted low rate environment.

JEL Classification Numbers: C53, E24, G12, J11, J21, J23, J26, O30

TTRP21-06 Secular Stagnation, the Long-Term Real Bond Rate Outlook and Policy Issues for NSW
and Australia                                                                                2
Contents
Acknowledgement ................................................................................................................. 1

Preface ................................................................................................................................. 2

Abstract................................................................................................................................. 4

1.          Real Interest Rates Trends and the Literature on Secular Stagnation ........................ 6

     Economic Theories ............................................................................................................ 6

     Declining Real Interest Rates Trends................................................................................. 7

     Selective Literature Survey .............................................................................................. 12

2.          Empirical Analysis of Real Interest Rates ................................................................. 27

     Introduction ...................................................................................................................... 27

     United States Real Bond Rate Scenarios......................................................................... 29

     The Australian Bond Rate Scenarios ............................................................................... 36

     Conclusion ....................................................................................................................... 44

3.          Global Issues That Will Affect NSW and Australia .................................................... 51

     Introduction ...................................................................................................................... 51

     Demographics and ‘Saving Glut’ Issues........................................................................... 52

     Global Debt Levels and Growth ....................................................................................... 56

     Implications of the Belt and Road (BRI) Initiative for Australia .......................................... 65

     Inflation and Monetary Policy ........................................................................................... 68

     Conclusion ....................................................................................................................... 70

4.          Some Policy Issues for New South Wales and Australia .......................................... 72

     Chapter Highlights ........................................................................................................... 72

     Introduction ...................................................................................................................... 72

     The Poor Performance of Australia and NSW Productivity Growth .................................. 73

     Elements of an Economic Plan for NSW .......................................................................... 79

References ......................................................................................................................... 86

TTRP21-06 Secular Stagnation, the Long-Term Real Bond Rate Outlook and Policy Issues for NSW
and Australia                                                                                3
Abstract Budget deficits have expanded after the Global Financial Crisis (GFC) and again significantly with measures to support the economy following the COVID-19 pandemic. These increase the need for short-term borrowing. But aside from immediate cash needs, both Australia and New South Wales (NSW) need an economic plan for maintaining prosperity in the future. Australian and (especially) NSW productivity growth compares poorly with other countries. For mining, this growth was negative for most of the 2000s and the recent cyclical boost brings it back only to near zero since 2000. Finance is oversized in Australia and NSW, and it too faces an uncertain future. Yet the other parts of the Australian economy on which a solid future depends show signs of ‘secular stagnation’: or a weakness in the long-term growth of market economies associated with falling real interest rates and companies operating at or below capacity. Capital investment to drive better productivity in the future is essential. The real interest rate outlook in this report suggests that it is an ideal time to bring about such structural change. State and Federal governments will need to increase emphasis on Research and Development (R&D), shown in all countries to be essential for productivity growth. Education is necessary to promote a more innovative economy. Improving the quality of existing labour to keep pace with IT producing and using companies is also important and requires investments in retraining facilities and support for workers displaced by structural change. Physical and social infrastructure investment is supportive of digitalisation and greater capital intensity of labour. Providing pandemic-proof medical services for a healthy workforce and supportive childcare facilities needs to be a part of this. So too does a transition to renewable energy, which will reduce exposure to stranded assets in the future and interruptions to energy supply. The borrowing required for such programs requires a sensible approach. The OECD ‘golden rule’ has always been that government current spending should be funded out of revenue, while borrowing for investment enhances welfare when the social returns to that investment exceeds the ‘hurdle’ discount rate. Borrowing costs are at historical lows, but a strong duty of care is required because intergenerational considerations are present. Cost-benefit analyses of investments are important to avoid supporting ‘white elephant’ projects that saddle future generations with under-performing assets when interest rates return to more ‘normal’ (higher) levels. In short, current low interest rates are attractive from a borrowing perspective but also risky from the point of view of the rigorous assessment of investments. Since the returns to investment accumulate over several decades, it is important for NSW governments to consider what a more ‘normal’ economic environment might look like for future generations. It is the real interest rate that matters for these considerations. Is secular stagnation here to stay, so rates will remain low and beneath potential growth rates? Or will TTRP21-06 Secular Stagnation, the Long-Term Real Bond Rate Outlook and Policy Issues for NSW and Australia 4
global developments lead to higher rates considered more normal in years prior to the global
crisis? Answering these questions is the focus of this report.

While domestic factors are key drivers of potential growth, the underlying drivers of real
interest rates are global in nature. Global bonds are priced with reference to the US Treasury
bond rate — the global ‘safe asset’ traded in a large deep market where central banks tend
to invest much of the their foreign reserves (the reason why the US dollar is referred to as
the “reserve currency”). US demographics and saving trends are important drivers of the US
real rate. But bonds are globally traded securities and global demographic and saving trends
are also key determinants of the price of the global safe asset. The cumulated current
account deficit is a measure of how rest of the world saving affects the level of assets held in
foreign portfolios for any country. It is a key influence on this critical benchmark US market
and for interest and exchange rates in other countries.

Like the USA, other advanced economies are ageing. This should exert a downward
influence on saving and upward pressure on real interest rates. China and the so-called
Asian Tigers (Korea, Taiwan, Singapore and Hong Kong) are also ageing. China has played
a disproportionately large part in the rise in global saving until now. Were this to reverse
somewhat further upward pressure on real interest rates would arise, unless saving in other
developing countries with younger populations (such as India) could combine to sustain a
further increase in global saving.

Global issues also set the backdrop for Australia’s growth outlook and the terms of trade
which drives the Australian dollar. If the resource super cycle plays a less important role for
Australia in the future, states will have to do more to offset the negative impact on future real
income. The Australian dollar is also a key influence on capital account flows and the
evolution of asset prices (which affect state revenues), the hedging activities of state entities,
and currency choices for bond issuance. The Australian real exchange rate is likely
undervalued in 2020, but its direction in the long term will depend on many of the other
issues considered in this report.

Chapter 1 sets out some of the key data trends and provides a selective summary of some
of the relevant literature on secular stagnation and real bond rates. Chapter 2 is more
technical and sets out a tractable model framework to assess the themes most relevant to
Australian borrowers. The main hypothetical scenarios for the interrelated real long-term
interest rates in the US and Australian economies are provided. The exchange rate role in
this process and how it might evolve given developments in Asia is also analysed. Chapter 3
then provides a view on the global outlook and trends that are most likely to affect alternative
scenarios. This discussion influences the probability weights attached to different scenarios
used to determine the direction of real bond rates. Finally, in Chapter 4, some policy
thoughts of direct relevance to NSW are presented.

This paper is offered as part of a series of technical research papers that unpack the key
drivers of long-term economic growth and the fiscal outlook in the lead up to the 2021 NSW
Intergenerational Report.

TTRP21-06 Secular Stagnation, the Long-Term Real Bond Rate Outlook and Policy Issues for NSW
and Australia                                                                                5
1.       Real Interest Rates Trends and the Literature on
         Secular Stagnation

Chapter Highlights

The equilibrium real interest rate is that which balances saving and investment at the global
level, and rates between countries mean revert towards each other. The United States plays
a disproportionate role in this process, given the size and liquidity of its bond market, and the
role of the dollar as the reserve currency. Other markets ‘price’ relative to this safe liquid US
security.

The period since 2000 has witnessed large shifts in production supply chains and saving
behaviour between advanced and emerging countries. Investment and saving have shifted
materially towards Asia. These countries are acquiring net US assets and the US is running
large bilateral current account deficits. The reason for this is something of a puzzle, as it is
advanced countries with ageing populations that should be running current account
surpluses and net lending to younger higher-return emerging countries.

Much of the empirical work on the US has put too much weight on traditional economic
theories of closed economies to explain low real interest rates, which are not well supported
by the data (e.g. that real wages rise resulting in capital for labour substitution that offsets
the effects of the fall is saving due to ageing; yet real wages are in secular decline for less
educated worker cohorts and US saving is rising).

The fall in US real interest rates gathered pace after 2001, and this appears to fit better with
the global saving glut view and the shift of supply chains to Asia (where investment is also
strong) as opposed to some sudden shift in predictable demographic trends.

The reason for US economic success is mainly due to investment in IT producing and IT
using sectors, as well as outsourcing lower-value-added production to Asia. The quality of
labour rather than the size of the labour-force (emphasised in some demographic studies)
may play a significant role in what happens to real returns in the future. If the quality of
labour through education and training can’t keep up with the demands of IT-producing and
using sectors, then labour productivity and trend economic growth may well weaken.

Economic Theories

‘Secular stagnation’ is a term used to describe weak long-term growth in market economies
which operate at or below capacity and are characterised by falling real interest rates with
subdued inflation. Following more than two decades of deflation pressure, poor investment
levels in Western economies and falling real interest rates, policy-maker concern about
stagnation is rising.

There is a long history of theories of secular stagnation. Marx believed that capitalist
economies invest heavily in productive capacity, while unequal income distribution

TTRP21-06 Secular Stagnation, the Long-Term Real Bond Rate Outlook and Policy Issues for NSW
and Australia                                                                                6
constrains consumption. Competition between companies results in excessive investment and a secular decline in the rate of profit. Alvin Hansen in the 1930s held a somewhat opposite view that the main difficulty is that full employment generates too high saving for investment to be able to fill the gap. Keynes too believed that situations like the 1930s were related to too little investment caused by capitalist ‘animal spirits’ that became too depressed and self-fulfilling. He believed fiscal expansion to be the only way out. Neo-Keynesian thinking also emphasizes the role of financial markets in affecting income distribution, asset market bubbles and crises. The Harrod/Domar growth models present the idea of ‘warranted growth’: investment needs to be just enough to absorb saving, given the marginal efficiency of capital and the propensity to save. Higher saving and a lower capital-output ratio warrant high growth and vice versa. If growth falls below the warranted rate it might further depart from equilibrium. Furthermore, the ‘warranted rate’ need not be in line with the natural rate of growth determined by population growth — that rate at which full employment is maintained — resulting in secular stagnation. The neoclassical growth model ‘golden rule’ posits that if consumption is to be maximised, then the first order conditions are such that the equilibrium capital/labour ratio is that where the marginal product of capital (MPK) — the real interest rate — would be equal to the natural rate of growth determined by population growth. The Ramsey growth model is more general than the familiar Solow model, as it endogenizes saving. Consumers make choices between consumption today and consumption tomorrow, and utility maximisation requires a MPK equal to population growth plus societies rate of time preference. Growth, and real interest rates can move lower due to falling population growth, ageing and any change in the rate of time preference. Declining Real Interest Rates Trends The past 800 years Schmelzing (2020) presents painstaking research over 800 years, covering old kingdoms, city states and governments. He argues that the decline in real rates is a very long-term trend that is likely to continue. The work is most interesting for some of the documented historical events that saw sharp turning points in real rates. Thus, when sumptuary laws were introduced to restrict rampant luxury spending by the merchant class after the Black Death, saving was forced to flow back into the debt markets and real rates declined in the late 15th and early 16th centuries. However, extrapolating an 800-year trend aggregated from vastly different sources and concepts — most of which are impossible for readers to verify — does not seem justifiable. There is nothing resembling uniform security instruments, and inflation data prior to the 20 th Century are very unreliable. The nature of ‘markets’ in the days when despotic kings could impose loans on the nobility with no meaningful covenant protection isn’t comparable to the TTRP21-06 Secular Stagnation, the Long-Term Real Bond Rate Outlook and Policy Issues for NSW and Australia 7
deep, deregulated exchange traded markets of today, where derivatives also play a large
role.

The Past 100 Years

Even the government bond markets in place for much of the 20 th century aren’t comparable
to those of today. Prior to the early 1980s modern tenders for blocks of bonds did not exist.
Instead yields were fixed, and institutions would often apply for issues. This was more like
pricing used cars — the car in the yard has a price painted on the window and you can come
into the yard and buy the car or not. The central bank acted as the residual lender to the
government. Worse, from 1933 markets were heavily regulated, capital controls and interest
rate ceilings were in place, and financial repression techniques were widely practiced. 1

The combination of these arrangements meant that inflation movements would drive real
interest rates proportionately in the opposite direction (see Chart 1). Hence, the inflation of
World War II, and that of the oil shock periods in the 1970s, distort all measures of the real
interest rate. The economic adjustment mechanisms for saving and investment are also very
different before and after deregulation in the early 1980s. Debt could be eliminated by an
inflation tax on elements of enforced saving for much of the 20 th century, but much less so
since the 1980s.

The period Since the Early 1980s

US capital controls were abandoned in 1974, and interest rate ceilings were removed in the
early 1980s. Since deregulation saving and investment decisions can adjust more freely, and
measured interest rates are less distorted. Inflation too has been declining and is now very
low. Nevertheless, Chart 1 shows that over this more market-oriented period the real interest
rate on government bonds in the world’s largest economy has declined following the jump up
during the Volcker disinflation.

1
 See McKinnon (1973) for a discussion of financial repression. This restriction, together with requiring banks and insurance
companies to hold government debt by regulation, permitted governments to borrow cheaply.

TTRP21-06 Secular Stagnation, the Long-Term Real Bond Rate Outlook and Policy Issues for NSW
and Australia                                                                                8
Chart 1 100 Years of Real US 10-Year Bond Rate & Estimated Trend

  % p.a.

 25                                  Actual Real 10y        Trend Est 10y   CPI 12m

 20

 15

 10

   5

   0

  -5

 -10

 -15

 -20

Source: Thomson Reuters and author data and calculations.

The real rate for the US 10-year benchmark bond is also low compared to the 1920s, a
period which was free of regulations, interest rate ceilings and rampant inflation episodes. It
is this post-deregulation period that deserves the full scrutiny of empirical research. Indeed,
some wariness in interpreting modelling results prior to 1974 and 1980 should always be
front of mind.

The Special Global Role of the US Treasury Market

The attractiveness of the US Treasury market derives from its vast size and that it is the
most liquid bond market in the world. These were the reasons why the US dollar evolved to
be the global ‘reserve currency’. Chart 2 gives some idea of the dominant size of this market
for central government debt. These charts include Japan’s large JGB market, where the
main bulk of securities outstanding are not traded but are instead held to maturity by
Japanese insurance companies. This is often described as a ‘captive market’. The US
Treasury market in 2019 was around USD 14.3tn, some 39.2 per cent of the USD 36.4tn
total for the countries shown. If Japan is excluded, the US share becomes 53.1 per cent. The
US Treasury market excludes state and local government debt. If these were included the
size of US general government debt outstanding becomes USD 22tn at the end of 2019.

Investors value the liquidity and safety of US bonds and hold them in portfolios according to
various benchmarks. Other markets are traded as spreads to this global liquid ‘safe asset’.
Global fund managers focus on spread trades. For example, the synthetic cost of another

TTRP21-06 Secular Stagnation, the Long-Term Real Bond Rate Outlook and Policy Issues for NSW
and Australia                                                                                9
government’s borrowing by a country in US dollars (their own bonds swapped into US dollar)
is compared with the US government’s cost of borrowing in dollars. Basis point premiums
and discounts to the US market are compared in carry trades. But underlying these portfolio
channels are the fundamentals of global capital flows between open economies.

Chart 2 Central Government Bond Market Size Comparisons (USD bn)

                     383.2              1,296.6
                   443.4
                              2,887.1
                   624.9                                                 GER
               1,053.6
                                                                         JAP

                                                                         UK
                                                            9,494.5
                                                                         FRA

                                                                         Bra

                                                                         USA

                                                                         SPA

                                                            2,133.7      KOR
                   14,256.5
                                                                         Can
                                                      2,298.8
                                                                         Aus

                                                                         20 other
                                                  1,467.9

Source: BIS.

The Correlated Nature of Real Bond Yields in Advanced Countries

Real bond yields in domestic currencies are correlated with the US market (see Chart 3).
This correlation likely reflects mean reversion towards US rates, given currency
expectations. With globalisation, saving from all countries may fund investment anywhere in
the world and rates will adjust when perceived returns for investors move out of line.

TTRP21-06 Secular Stagnation, the Long-Term Real Bond Rate Outlook and Policy Issues for NSW
and Australia                                                                               10
Chart 3 International Real Bond Yields are Highly Correlated
% p.a.
11 USA Aust Ger Jap UK
9
7
5
3
1
-1
-3
May-13
May-83
May-88
May-93
May-98
May-03
May-08
May-18
Sep-81
Sep-01
Sep-21
Sep-86
Sep-91
Sep-96
Sep-06
Sep-11
Sep-16
Jan-80
Jan-85
Jan-90
Jan-95
Jan-00
Jan-05
Jan-10
Jan-15
Jan-20
Source: Thomson Reuters and author calculations.
Policy-makers too may find that the ‘elastic band’ can’t be stretched too far out of line with
US short rates. The Volcker disinflation policy distorted US real rates to high levels at the
start of the 1980s, for example, and this is associated with high rates in other countries. This
is because central banks would not wish to see sharp movements in their currencies. With
open capital markets global flows into the US would distort world saving away from other
countries, were their real rates not to move up. Exchange rates would weaken versus the US
dollar (the latter inducing central bank responses and yield curve adjustment).
Is There ‘Secular Stagnation’ and When did it Begin?
Even after the Volcker distortion, the US real rate remained high at close to 4 per cent for the
second half of the 1980s. This may have been due to better expectations of profitable
investment opportunities and growth following financial deregulation, the taming of inflation
and the earlier opening of international capital markets. Household saving rates had also
begun to decline. This period was followed by the recession of 1991. The average real
10-year rate for the period 1991 to December 2001 was 3-3/4 per cent, not that much lower
than that for the second half of the 1980s, and certainly well above the 1.1 per cent average
for the earlier period (distorted-by-regulation) from January 1950 to December 1980.
These data suggest that secular stagnation, if it is present, is best thought of as starting from
around 2001 and continuing to the present. This corresponds with China’s World Trade
Organisation (WTO) entry, and the beginning of their net acquisition of foreign assets (see
TTRP21-06 Secular Stagnation, the Long-Term Real Bond Rate Outlook and Policy Issues for NSW
and Australia 11Chart 16 below) as vast increases in savings exceeded investment and had to be recycled to
the rest of the world to finance the current account surplus.
US real rates began to decline continuously for two decades with other countries following.
From January 2002 to December 2008 (just after the Lehman collapse) US real rates
averaged 2.2 per cent, some 1.5 per cent below the decade to 2001. Since 2009 real rates
have averaged 0.6 per cent. This latter period includes the main added impact of the global
financial crisis. But as this crisis ended, real rates did not return to their pre-crisis levels. This
suggests that the Asian ‘saving glut’ is a very important influence on secular stagnation
concerns. Its stabilisation or reversal will be important in any return to a ‘normal’ inflation and
real bond-yield environment.
Global Factors or Coincidence?
For smaller open economies like Australia, this report will adopt a global framework for
analysing the real bond rate and future scenarios. It is of course possible that the
correlations between the US and foreign bond rates could be a coincidence. For example,
similar domestic demographic factors may be at play in all OECD countries (such as ageing
populations). Some of the literature goes this way. Other writers focus on savings and
investment factors and constraints to economic growth. Still others focus on excess
indebtedness and some on the global savings ‘glut’. The following sections try to draw
together some of the literature on these trends as a prelude to setting the framework for
subsequent empirical analysis and discussion of major issues in this report.
Selective Literature Survey
Neutral short rates and the Fed
Fed literature on the neutral real short rate is aimed at providing a sort of compass for
monetary policy. The underlying theory is linked to the Ramsey economic growth model.
Consumers smooth saving over time. Low productivity growth would cause them to save
more (as future income will be lower). The increase in saving results in more investment in
lower-yielding projects, so the MPK and real interest rates fall. Expected consumption and
the discount rate of consumers are the key drivers.
Taylor (1993) formulated a monetary policy rule around this idea. In the end monetary policy
should aim to set rates consistent with savings and investment incentives and the neutral
rate over the long run.
Fed economists Holsten et al. (2016) focus on the neutral short rate relevant for monetary
policy using times series techniques that are agnostic about lags, and allow for shifts in trend
growth and the unobserved neutral rate.2 They equate the neutral real short rate with trend
growth, but where stochastic processes affect both. A statistical filtering technique is used to
2
See also Laubach and Williams (2015).
TTRP21-06 Secular Stagnation, the Long-Term Real Bond Rate Outlook and Policy Issues for NSW
and Australia 12identify these shifts in the neutral rate.3 Inflation expectations and the output gap are key
elements of the calibrating procedure. They find that trend growth and the neutral rate are
falling over time, and that there is co-movement between five countries suggesting global
factors are at play. They point out that their estimates are imprecise (a standard error of 1.1
percentage points) and suggest there is a need for models incorporating more structural and
global factors.
The updated work shown in Chart 4 has the neutral rate falling from around 5 per cent in
1960, to 2¼ per cent by 1990. It then picks up to around 3 per cent by 2000, before
collapsing to ½ per cent by Q2 2020.
Chart 4 Laubach-Williams Neutral Rate
% p.a.
10
Laubach-W 1-sided Laubach-W 2-sided
8 Real FF Rate Actual Johanssen Mertens
6
4
2
0
-2
-4
Dec-67
Dec-76
Dec-85
Dec-94
Dec-03
Dec-12
Dec-21
Sep-65
Sep-74
Mar-79
Sep-83
Sep-92
Sep-01
Mar-06
Sep-10
Sep-19
Mar-61
Mar-70
Mar-88
Mar-97
Mar-15
Jun-63
Jun-72
Jun-81
Jun-90
Jun-99
Jun-08
Jun-17
Source: US Federal Reserve: https://www.newyorkfed.org/research/policy/rstar ; and: http://dx.doi.org/10.17016/2380-
7172.1703
Other Fed economists Johanssen and Mertens (2016) model the equilibrium real Fed Funds
(and a 5-year bond), with Bayesian time series techniques, referencing an unemployment
gap, inflation and long-term bonds. The real Fed Funds rises from the 1960s to around 2-3/4
per cent in the late 1980s achieving that peak again in 2000. Subsequently, the real rate
declines by 1-3/4 per cent to just under 1 per cent by 2015 — suggestive of a trend decline
from 2000 (also shown in Chart 4).
While both sets of authors work at the Fed, with comparable techniques, the results are quite
different in the lead up to 2000, possibly due to the use of an output gap in one and an
3
A Kalman filter.
TTRP21-06 Secular Stagnation, the Long-Term Real Bond Rate Outlook and Policy Issues for NSW
and Australia 13unemployment gap in the other. Different statistical techniques are also employed. However,
both approaches agree that trend growth and the equilibrium real Fed Funds begin to
decline after 2000 (coinciding with the period when world saving began to rise as a share of
world GDP, with a sharp rise in emerging market saving offsetting declines in many Western
countries as shown in Chart 7 below).
Hamilton et al. (2015) are very dismissive of these growth and output gap approaches. They
focus on the US economy, but also examine cross-country data and look back to the
19th Century. They find the relationship between growth and real short rates to be very weak,
and certainly period specific. There are many reasons for this. Factors affecting the
estimates include inter alia: Regulation Q and other constraints that came into effect
following the Great Depression; debt defaults; trends in inflation; growth headwinds like the
trade deficit; and asset bubbles. In the past, long periods of high, low and negative real rates
have persisted and then reversed because of such factors. They argue there is no reason
why this won’t continue to occur into the future.
The authors find that the only thing that appears stable, is that the US real short rate is
cointegrated with estimates of the median of a global real rate (calculated from
auto-regressive estimates of each country’s real rate based on a 30-year rolling window). If
the US rate is below this, it will rise and vice versa. The global real rate does not revert to a
mean, and therefore may shift up in the future for reasons that are difficult to anticipate in
advance.
Monetary Theories
Borio et al. (2017) are sceptical of the real economy being the driver of falling real interest
rates. Using long data periods their panel regression work compares two sets of factors:
• Those that pertain to savings and investment interactions (the marginal product of
capital proxied by labour productivity growth, total factor productivity, the dependency
ratio, population growth, the relative price of capital, and inequality proxied by the
income share of the top 1 per cent).
• Those that pertain to monetary policy regimes (the Gold Standard, the inter-war Gold
Standard, the post-War Bretton Woods arrangements, pre-Volcker, and post Volcker
inflation targeting).
Over the full sample and monetary regime subsamples, the savings variables are mostly
insignificant or of the wrong sign. Monetary policy regime dummies, on the other hand, are
almost always highly significant. This they argue casts doubt on the idea that monetary
policy is neutral in the long run. The authors assert that their empirical findings support the
idea that real rates are a monetary phenomenon, and the saving-investment framework has
little support in the data.
One must be sceptical of monetary theories of real returns considered over long periods of
time. The authors touch on the problem in a footnote asserting that excluded third factors
like oil price shocks might be causing changes in monetary regimes and real interest rates.
But they reject this on the grounds that oil prices affected both the post-Bretton Woods and
TTRP21-06 Secular Stagnation, the Long-Term Real Bond Rate Outlook and Policy Issues for NSW
and Australia 14the more recent inflation targeting periods, yet the regime dummies had opposite signs. But
other issues confound this interpretation. For example, interest rate ceilings were introduced
in the US Banking Acts of 1933 and 1935 and were maintained until the early 1980s. The
ceilings are present for Bretton Woods but not for the inflation targeting period — regulations
are not monetary policy regimes. The oil price impact on output, inflation and measured real
rates will be quite different when rates are free to adjust and when they are not. Problems of
interpretation also arise for the gold standard period, since the impact of a monetary shock
caused by gold discoveries would impact on real rates depending on how countries stuck to
the rules of the game. The US and England did so, whereas continental Europe frequently
cheated.
The study is interesting however in the findings about demographic variables, productivity
and the relative-price-of-capital. These are taken for granted in many of the studies
considered in this report, yet they struggle to find support against real world data. The Asian
‘saving glut’ was not tested.
Demographic Factors
Domestic monetary policy fixes short rates in the interbank market, with inflation targeting
goals in mind. Real long-term rates adjust with non-bank private demand playing a more
important role. Lifecycle and precautionary motives for saving depend on uncertainty about
future income and demographic drivers, including population growth, fertility, mortality and
the dependency ratio (very young people and retirees versus the working-age population).
In the ‘sweet spot’ of a younger and growing population, as with the middle years of the
baby-boom generation, a large ‘lump’ of saving begins to work its way through the system
and would, other things given, reduce real interest rates. Of course, Western societies are
well past the baby-boom demographic sweet spot, and a decline in saving should begin to
put upward pressure on real rates. This mechanism, however, appears to have been offset
by other factors, some of which are also demographic in nature.
The increase in longevity, shown for several countries in Table 1, is one such factor. Since
1950, every 10 years has seen OECD country average lifespans increase by about 1 year.
People need to save more for a longer retirement if pension vesting or entitlement birthdays
are not increased commensurately.
Table 1 Life Expectancy Changes – Life expectancy at 65 years: selected countries
Added years per
1960 2018
Country decade
Men Women Men Women Men Women
USA 12.8 15.8 18.1 20.7 0.8 0.7
Japan 11.6 14.1 19.6 24.4 1.2 1.5
Germany 12.2 14.2 18.1 21.1 0.9 1.0
France 12.5 15.6 19.7 23.8 1.1 1.2
TTRP21-06 Secular Stagnation, the Long-Term Real Bond Rate Outlook and Policy Issues for NSW
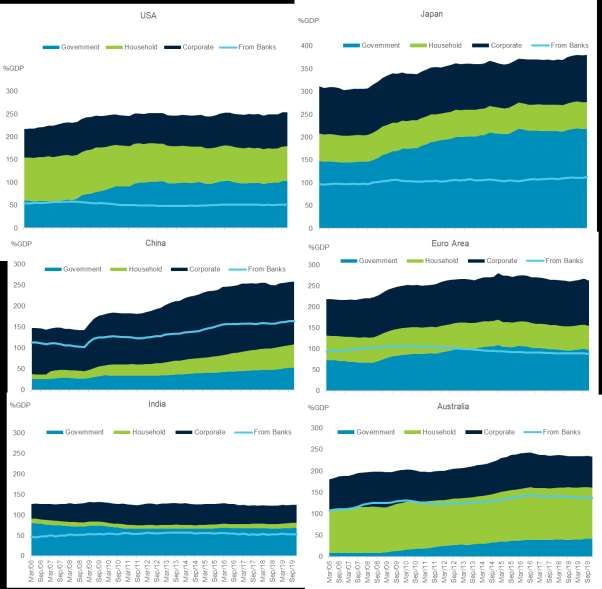
and Australia 15UK 11.9 15.1 18.9 21.1 1.0 0.9 Spain 13.1 15.3 19.5 23.5 0.9 1.2 Italy 13.4 15.3 19.6 22.8 0.9 1.1 Source: OECD. Furthermore, uncertainty about future income and lifespans interact with other economic developments. The hollowing out of the middle class demonstrated empirically by Autor et al. (2016), for example, has seen falling real wages across large sections of Western society. This implies lower internal returns in PAYG pension schemes, which compounds financial sustainability issues. For defined contribution private pension schemes lower wage growth combined with low real interest rates generates retirement-income adequacy concerns. With financial returns not delivering, loss of confidence in private pension schemes provides an incentive for more saving. This has been compounded by a mistrust of public pensions being able to deliver on promises, especially in Europe (see OECD 2018). If the asset backing of pension funds is inadequate saving would need to rise for precautionary reasons. Carvalho et al. (2016) use a life-cycle model to focus on the three main demographic channels that affect the equilibrium real interest rate: an increase in longevity, which increases savings and reduces real rates; a reduction in population growth, which raises capital/labour ratios tending to reduce the MPK and real rates; and the offsetting tendency for dependency ratios to rise as population growth slows, which may reduce saving and push rates up (as retirees save less). Calibrating these factors, the model explains around half of the decline in real short rates between 1990 and 2014. Policies to raise the equilibrium rate mentioned by the authors include that set of factors that might raise productivity growth, as well as raising the retirement age. Gagnon et al. (2016) use a US demographic model to study the real US 10-year rate. They show a trend decline of about 1-1/4 per cent in the equilibrium real rate from 1980. They suggest that fertility declined in the 60s and 70s as the baby-boomers began entering the workforce. This peaks around 2000, where this cohort begins to reach mature age, and the number of their dependent children falls. When the baby boomers saved for retirement capital-to-labour ratios were relatively low. This all began to reverse after 2000. The baby boom generation began to draw down their capital on leaving the workforce and, as labour supply was reduced, capital-labour ratios began to rise. The model suggests that even though saving was beginning to decline after 2000, the equilibrium real interest rate continued to fall due to the extent of this capital-for-labour substitution. This mechanism explains about a ½ decline in rates. The decline in mortality since 1980 explains another ¼ per cent of the decline. The authors suggest that it might be something of a coincidence that real rates are falling in all OECD countries — it is because the same local demographic baby-boom factors have been at play everywhere. This domestic closed economy approach is not convincing. First, US real wages for the less-than-tertiary-educated workers have been falling throughout, and if capital-labour ratios are rising it is more likely due to the way US companies have responded to the challenge of TTRP21-06 Secular Stagnation, the Long-Term Real Bond Rate Outlook and Policy Issues for NSW and Australia 16
globalisation. Second, the US has the highest fertility of OECD countries, an echo of the
baby-boom generation from the mid-1980s, and immigration is also stronger in the US than
other OECD countries.

Global Factors versus Demographic Trends

Global factors are frequently ignored in demographic studies of the falling real rate. One
exception to this is Krueger and Ludwig (2007), who allow for OECD-wide effects and
provide a long-run extrapolation to the decline in the equilibrium real interest rate (from 2005
before the flurry of interest since the financial crisis) based on ageing population
demographics. They make use of United Nations population projections from 2005 to 2080.
Working age population ratios are declining over this period as baby boomers retire, fertility
rates decline and longevity increases. This leads to rising real wages (by 4.1 per cent
between 2005 and 2080). Despite declining savings ratios (it is mainly the young that save),
capital deepening occurs because labour “tomorrow” becomes increasingly scarce. This
investment reduces the MPK. Equilibrium real interest rates are projected to decline by some
86 basis points between 2005 and 2080.

The assumption of free capital flows between OECD countries doesn’t mitigate this effect on
the US economy. This is because Europe and Japan have even more dramatic ageing
trends. The US essentially imports worse factor price trends from these countries. The
authors mention policies that would mitigate the fall in real interest rates. These include
increasing the retirement age to 70 and human capital formation through education that
would make labour more effective (reducing the scarcity effect).

It is a pity that this work excludes the non-OECD world. The results could differ, depending
on the relative importance of ageing countries like China and the Asian Tigers versus faster-
growing and younger economies in Africa, India, other parts of Asia and the Middle East.

These global ‘emerging market’ developments may be critically important for understanding
changes in real rates from 2001. Too much weight might be placed on local demographic
trends and capital-for-labour substitution in Western countries. The sharp changes from
2001(emerging market saving) and 2009 (global crisis) are clear and relatively recent.
Demographic trends in the West, on the other hand, are relatively stable and predictable in
advance. There have been no sudden surprises that can explain why the decline in real
rates has for the most part happened after 2001.

Headwinds to Economic Growth and Low Real Rates

Gordon (2012) identifies four phases of US productivity: 1891 to 1972 when it grew on
average at 2.3 per cent; the first major slowdown from 1972 to 1996, when it grew at 1.3 per
cent; the recovery from 1996 to 2004, when growth rose to 2.5 per cent; and the slowdown
from 2004 to 2012 with 1.3 per cent growth

Gordon focuses on frontier technology as the main driver. This was located in the UK to
1906, and in the US ever since. From 1750 to 1830 steam and railroad discoveries and their
proliferation over a long period afterwards was the key driver. This was followed from the

TTRP21-06 Secular Stagnation, the Long-Term Real Bond Rate Outlook and Policy Issues for NSW
and Australia                                                                               17
late 19th Century by electricity, the internal combustion engine, running water and indoor
toilets (freeing women from carrying water), communications, entertainment, chemicals and
petroleum. This phase was the most important, lasting eighty years and leading to so many
spin-offs (e.g. aeroplanes, air conditioning and interstate highways, and more). Once these
had run their course the first major slowdown of productivity occurred.

Most recently the frontier has become computers, the internet and mobile phones. This has
been short-lived and doesn’t seem to have had the same breadth and durability necessary to
overcome six headwinds going forward, only one of which is demography. The others are:

   •   The quality of education.
   •   A sharp rise in inequality — he suggests that it is possible that growth of
       consumption per-capita of the bottom 99 per cent of households could become as
       low as ½ per cent pa in the future.
   •   Globalisation, including the outsourcing supply chains enabled by ICT. With the
       ‘China shock’ possibly to be followed by India, other parts of Asia and Africa, factor
       price equalisation is hurting higher-wage countries the most.
   •   Global warming, energy and the environment, where the necessity of raising the
       price of carbon will slow growth.
   •   The severe overhang of government and household debt — recently made worse by
       the response to the corona virus epidemic.

Without policies for change these headwinds will slow growth further because the latest
innovations (the iPod, smartphone, iPad, etc.) mainly provide the opportunity for
consumption at work and for leisure activities — they are not replacing human labour with
machines and countering the globalisation forces.

Debt Overhang

Reinhart et al. (2012) and Lo et al. (2015) focus on the debt overhang episodes in advanced
countries. In their survey of the literature Lo et al. (2015) find there is agreement about the
need for better education and for high-return infrastructure investment, but the transmission
from the overhang mechanisms are less clear. The slowdown in growth could arise through
generalised deleveraging. Alternatively, it could also be due to country’s attempt to run
primary budget surpluses following a debt overhang, raising taxes and/or cutting spending.

Education and Labour Quality

Jorgenson, Ho and Samuels (2014) focus on the role of education in the growth process
from 1947 to 2010 in 65 industries. They examine industry outputs and inputs of capital,
labour, energy, materials and services to analyse productivity growth. They use OECD
methodology for production accounting which has become the basis of a new approach to
measuring productivity. They find that 80 per cent of growth over this period was due to
capital and labour inputs, while only 20 per cent was due to productivity. The expansion and
upgrading of the labour force and investment in intangibles such as R&D and software
explain most of the growth in output. The 1995-2010 growth recovery was dominated by IT-

TTRP21-06 Secular Stagnation, the Long-Term Real Bond Rate Outlook and Policy Issues for NSW
and Australia                                                                               18
producing and IT-using activities. Future growth will require the replication of established technologies across a broader front of industries. The authors identify the main impediment to this future growth as improvements of labour quality (in agreement with the Gordon study). In this detailed disaggregated work labour supply is of course affected by ageing, as in the demographic studies. But this misses what turns out to be the more important factor in labour quality. The authors break the labour force data into age, gender and educational attainment cohorts. Employment rates are much higher for cohorts associated with higher educational attainment. But while the current level of education attainment is high, its growth rate is slowing. Herein lies the main problem. The 1995-2000 investment boom drew more females, young people and poorly educated workers into the work force. But this peaked in 2000, and subsequently employment for these less-qualified (male and female) cohorts began to fall, a process that accelerated after the global recession of 2008. The loss of these labour inputs that are not suited for growth in the IT-producing and using sectors is a major impediment to growth. If gender, age, and educational employment rates are held constant at the 2014 full employment levels, and growth in educational attainment continues to slow, labour productivity growth will automatically follow. This is because it is the IT-producing and the IT-using sectors that contribute most to growth and labour quality isn’t keeping pace with the needs of these sectors. The authors provide a base case of 1.8 per cent GDP growth for the following 10 years. A low-growth scenario of 1.6 per cent is produced with more pessimistic assumptions on these drivers. A high-growth scenario of 2.4 per cent can be achieved with more optimistic assumptions. To move in the higher-growth direction will require policies that promote more investment that create opportunities for employment of the marginal cohorts. They state that policies to stimulate innovation will have little or no impact on growth — basically such policies don’t work. The Relative Price of Capital Goods and Asset Inflation To explain the observed phenomenon of falling real interest rates and rising house prices and household debt, Thwaites (2015) builds a model based on a production function and lifecycle saving capable of incorporating falling capital goods prices. He finds some support empirically from production function parameters and from the house price implications of his theory. In this framework, households finance their retirement by selling their accumulated claims on the company sector. As technology reduces the price of capital goods, the increased use of capital reduces the MPK and real returns fall, while output and wages rise. Housing demand is boosted by lower interest rates and, since the housing stock is fixed, this causes house prices to rise to choke of the demand. Household debt rises because people buy early in life and borrow to do so. This is an alternative to buying claims on companies to fund retirement. At the global level, company demand for household saving falls, and housing provides an alternative channel for saving. This mitigates the fall in the real interest TTRP21-06 Secular Stagnation, the Long-Term Real Bond Rate Outlook and Policy Issues for NSW and Australia 19
rates, since funds that would have gone to companies are instead lent to younger
households.

For small open economies Thwaites suggests that the acquisition of net foreign assets
becomes a further channel for saving in addition to claims on home country companies and
housing. Small economies are price takers for world real interest rates. As the fall in the
relative price of capital goods reduces the demand for funds at home, ex ante real rates fall
relative to the global rate, inducing households to buy claims on foreign companies. This
mitigates the pressure on house prices and, with rising wages, younger households require
less housing debt. Real rates move back towards the world rate. At the policy level, Thwaites
points out that macroprudential policies to limit the accumulation of household debt would
accelerate the fall in real interest rates.

These thoughts may be relevant for studying real rates in an economy such as Australia.
However, one offset to the mechanism of falling capital goods prices causing more
investment is ‘virtualisation’.4 This has become more scalable than ever with IT
developments in recent years and it reduces the need for capital expenditure while cutting
operational and other costs. Even the need for physical office space can be reduced.

The Global ‘Saving Glut’ View

Rachel and Summers (2019) model the equilibrium real interest rate for OECD countries.
Their calculation of the equilibrium real rate falls by 3 percentage points from 1972 to 2018
(from 3.5 per cent to 0.5 per cent). They note that falling trend growth doesn’t explain this
decline. Instead, they use a private saving and investment approach. 5 They justify ignoring
the developing-country world by noting that the OECD current account deficit is small and
doesn’t move by very much.

One of their models is based on private precautionary saving behaviour. As the income level
of the wealthy rise sharply, they become increasingly concerned about hanging onto it in the
face of unpredictable income shocks. Private saving rises (a buffer). Their models suggest
that were it not for budget deficits filling in for excess private saving and rising debt the
decline in real rates would have been much larger than the calculated equilibrium. The
authors suggest that OECD governments need to get on the front foot with fiscal policy.
Printing more money and forcing nominal interest rate to large negative levels will create too
many other problems for the future — and possibly inflation of asset and goods prices. The
authors argue that government debt should not be thought of as a constraint on policy when
interest rates are very low.

One problem with this paper is the incorrect argument that because the OECD aggregate
current account balance is close to zero and stable the rest of the non-OECD world can be
ignored. The authors fail to give any weight to the size, liquidity and attractiveness in the US

4
  A technology that decouples hardware and software — multiple operating systems can be used as virtual machines sharing
resources of servers.
5
  See also Summers (2016), and Rachel and Smith (2015). The latter provides a useful survey.

TTRP21-06 Secular Stagnation, the Long-Term Real Bond Rate Outlook and Policy Issues for NSW
and Australia                                                                               20
bond market — the idea that the US market is disproportionately affected by world saving
(including the non-OECD).

These issues are better understood in Bernanke (2005). In an influential speech the then
President of the Federal Reserve focused on the ‘global saving glut’ as a major factor in
falling real returns in the US and a few other advanced countries (including the UK and
Australia). He identifies the tech boom from 1996 to 2000 as a cause of large capital inflows
(liabilities to foreign savers). US consumption rose (the wealth effect) and the dollar
appreciated, which led to a sharp deterioration in the US current account. Subsequently, the
tech bust led to lower policy interest rates, reducing the incentive to save in US households
and increasing the incentive for investment in residential housing through cheap mortgages.
This led to a further deterioration in the current account funded from foreign savings.

Bernanke suggests that the effect on the US is disproportionate to other countries because
the bond market is the most attractive ‘safe asset’ market (due to its size, liquidity and the
reserve currency role of the dollar noted earlier). Other mainly Anglo-Saxon countries also
had house price inflation and current account deteriorations like the United States. Germany
and Japan, on the other hand, avoided these trends and moved further into current account
surplus.

Bernanke points out that it is emerging market saving that has had the largest impact on the
United States in this process. This he sees as a major problem. If the United States is
ageing, then it should be the US that acquires net foreign assets by lending to developing
countries to take advantage of higher returns there. If US savers and those of other
advanced countries would like to see higher real returns, they should run current account
surpluses (acquire net foreign assets) and invest in more productive capital at home (not
housing).

Instead, this has been turned on its head with emerging Asia being a net acquirer of US
assets. It will be argued below and in later chapters that the financial repression
development model in Asia is in large part responsible for this Bernanke paradox.

The Contrarian Case for Rising Real Interest Rates

The role of global saving to date does not mean that real interest rates are doomed to
decline forever. Global competition for funds may intensify. Supply of bonds following recent
fiscal policy deficits may run into more limited emerging market saving. This case is made in
a wide-ranging piece by Goodhart and Pradhan (2017 and 2020). Noting that there is no link
between local economic growth and real interest rates and that all these rates are correlated
internationally, they favour a global framework for analysing real rates.

Until now global ex ante saving has far exceeded ex ante investment demand, requiring real
interest rates to fall. China, they suggest, has played an important role in this excess saving.
The world has arrived at a turning point, and the reversal of these same factors will begin to
see a sustained rise in real interest rates in the future.

TTRP21-06 Secular Stagnation, the Long-Term Real Bond Rate Outlook and Policy Issues for NSW
and Australia                                                                               21
You can also read