Youth Employment in Kenya - Literature Review - British Council | Kenya
←
→
Page content transcription
If your browser does not render page correctly, please read the page content below
Youth Employment
in Kenya

Literature Review
October 2017

This document is an output from a project co-funded by the UK Department for International
Development (DFID) through the Research for Evidence Division (RED) for the benefit of developing
countries. However, the views expressed and information contained in it are not necessarily those of
or endorsed by DFID, which can accept no responsibility for such views or information or for any
reliance placed on them.
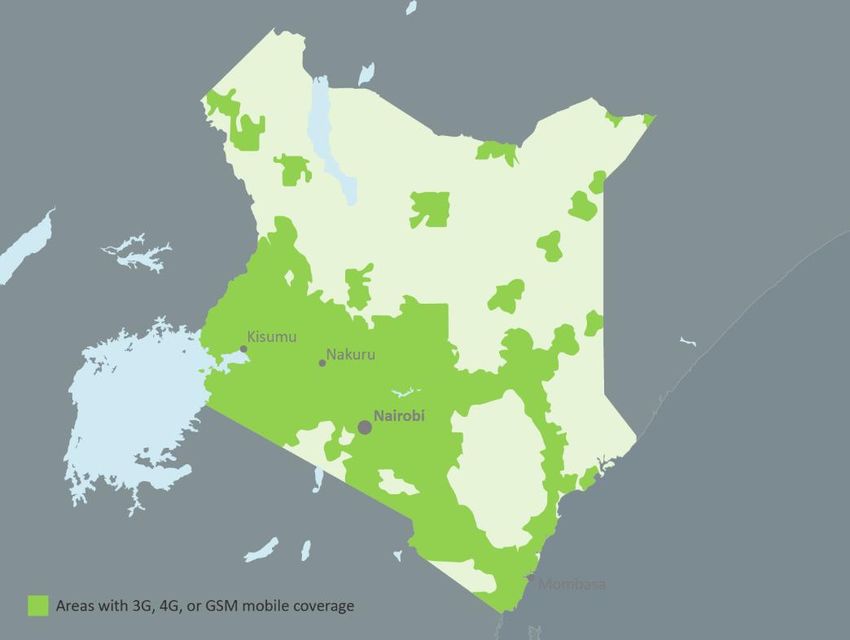
Table of Contents

Executive Summary                                                                                4

1. The Next Generation Project in Kenya                                                          4
   A.   Introduction                                                                             8
   B.   Demographic background and context                                                       9
2. Literature review results & limitations                                                      13
   A.   Methodology & Process                                                                   13
   B.   Results and Overview of the Literature Search                                           14
   C.   Data Reliability and Study Limitations                                                  16
3. Economic development and the potential of the demographic dividend                           18
   A.   Contextualising youth employment in Kenya                                               18
   B.   ‘Demographic dividend or disaster’                                                      23
4. Labour market integration and readiness of Kenyan youth: individual and systemic barriers and
   opportunities                                                                                 25
   A.   Primary and secondary education in Kenya                                                25
   B.   Tertiary and vocational education                                                       26
   C.   The impact of gender on education and labour market integration                         28
   D.   From employers’ perspective: a widespread mismatch between “supply” and “demand”
        among youth                                                                             30
   E.   Additional barriers to youth employment                                                 31
5. Sectoral and locational differences in employment amongst Kenyan youth                       33
   A.   Rural vs. urban contexts                                                                33
   B.   Key sectors of employment for youth                                                     33
   C.   Kenyan Youth and the ‘Silicon Savannah’: Opportunities and Limitations of ICT           35
   D.   Between the formal and the informal                                                     40
   E.   Gendered work strategies                                                                45
6. The future of youth employment in Kenya                                                      46
   A.   Looking towards 2030                                                                    46
   B.   Lessons learned from other countries: (Dis)similarities and relevance                   51
7. Final Discussion                                                                             55
   A.   Summary of key findings                                                                 55
   B.   Policy and research recommendations                                                     56

Bibliography                                                                                    59

Annex 1 - Detailed Methodology                                                                  70
Annex 2 - Results of the Literature Search: Detailed Overview                                   76

Youth Employment in Kenya                Samuel Hall                                             1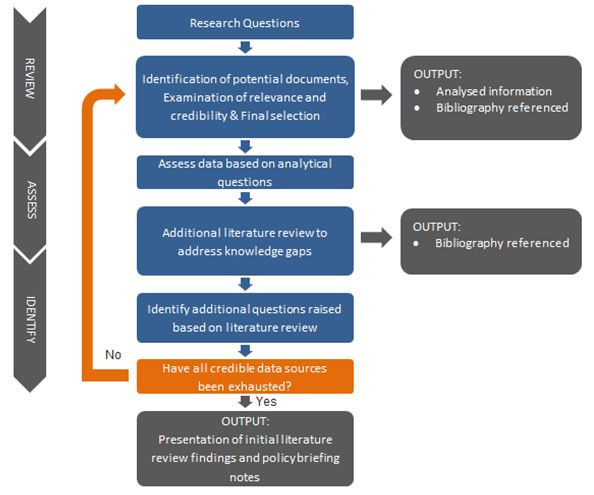
List of Abbreviations

      AfDB     African Development Bank
         AU    African Union
       BPO     Business Process Outsourcing
      DFID     Department for International Development
          EG   Egypt
       FAO     Food and Agriculture Organization of the United Nations
       GDP     Gross Domestic Product
        HIV    Human Immunodeficiency Virus
         ICT   Information and Communication Technology
        IILS   International Institute for Labour Studies
        ILO    International Labour Organization
          IN   India
        ITU    International Telecommunication Union
       KEN     Kenya
     KEPSA     Kenya Private Sector Alliance
     KIBHS     Kenya Integrated Household Budget Survey
      KNBS     Kenya National Bureau of Statistics
       MSF     Medecins sans Frontieres
       SSA     Sub-Sahara Africa
      TVET     Technical and Vocational Education and Training
          TZ   Tanzania
         UG    Uganda
     UNDP      United Nations Development Programme
    UNECA      United Nations Economic Commission for Africa
   UNESCO      United Nations Educational, Scientific and Cultural Organization
    UNICEF     United Nations Children's Fund
    UNFPA      United Nations Population Fund
     USAID     United States Agency for International Development
          ZA   South Africa

Youth Employment in Kenya                Samuel Hall                              2
List of Figures

Figure 1: Youth Population (per cent) - based on UN estimates for 2015 (UN 2017) ............................ 9
Figure 2: Kenya's population since 1960 with a focus on 2000-2015 (absolute numbers in 1,000) -
     based on UN estimates for 2015 (UN 2017) ................................................................................. 10
Figure 3: Youth Population (15-24 years) by County in 2009, absolute numbers (left) and percentages
     (right); the three counties with the highest numbers in each category are highlighted – own
     calculations based on Kenya Population Census 2009 (KNBS 2009) ............................................ 12
Figure 4: Iterative review process ......................................................................................................... 13
Figure 5: Document/literature Identification and Screening Process .................................................. 15
Figure 6: Unemployment rates (per cent) in Kenya from 2000 to 2017 - based on ILO estimates (ILO
     2016a) ........................................................................................................................................... 18
Figure 7: Comparative change in GDP and Youth Unemployment Rates in Kenya and SSA from 2000
     to 2016; the respective numbers for 2000 have been levelled at 100 – based on ILO estimates
     and World Bank Data (ILO 2016a; World Bank 2017f) ................................................................. 19
Figure 8: Per cent of the population employed, for the age group between 15 and 24 in 2017 - based
     on ILO estimates (ILO 2016b) ........................................................................................................ 21
Figure 9: Student Enrolment in Public TVET Institutions and in Public Universities in Kenya from 2012
     to 2015 – based on official numbers from KNBS (KNBS 2017) ..................................................... 28
Figure 10: Percentage of Individuals using the Internet in Kenya, Tanzania and Uganda from 2000 to
     2016 (ITU 2017)............................................................................................................................. 35
Figure 11: Mobile Network Coverage in Kenya – based on FSP Maps (FSP Maps 2016) ..................... 36
Figure 12: Main areas of Agricultural Production vs Mobile Network Coverage in Kenya – based on
     FSP Maps and LANDSAT TM images (FSP Maps 2016; FAO 2003) ................................................ 39
Figure 13: Employment numbers (in thousands) in the formal and informal sector in Kenya, 1980 to
     2010 - based on annual economic surveys from the Kenyan Government (adapted from: Omolo
     2012) ............................................................................................................................................. 40
Figure 14: Share of informal employment in non-agricultural employment for India, Kenya, Uganda,
     Egypt and South Africa in 2010 - based on ILO calculations (ILO & IILS 2013) ............................. 41
Figure 15: Annual GDP Growth in Kenya 2001-2020 (Source: World Bank 2017) ................................ 46
Figure 16: GDP Growth per capita (2003-2014) for Kenya, Sub Saharan Africa economies, and other
     middle-income countries – levelled at 100 for 2003 numbers, selection of countries by World
     Bank (Source: World Bank Development Indicators & KNBS) ...................................................... 48
Figure 17: Kenyan youth’s share in total working-age population (per cent) ...................................... 49
Figure 18: Formal employment (Kenya’s demographic trends, millions - Source: World Bank & Kenya
     National Bureau of Statistics) ....................................................................................................... 50

Youth Employment in Kenya                                     Samuel Hall                                                                                3
Executive Summary With its youth population of nearly 10 million, more than 20 per cent of its overall population, Kenya is currently experiencing a so-called ‘youth bulge’ (defined as a situation when at least 20 per cent of a country’s population is between the age of 15 to 24). In other contexts, this situation has proven to be a major asset for national economies, when these young people were able to find appropriately paying employment, or other ways of gaining personal economic independence. The large number of young Kenyans thus offers the potential to be a force for a positive economic future of the country, both collectively and as individual agents of progress and change. The term ‘demographic dividend’ provides a strategic lens to conceptualise the potential (economic) future of the country: if Kenya is able to provide the appropriate education and jobs to its growing youth population, this could allow it to experience a boost in economic growth resulting from the ‘dividend’ of a well-equipped and economically independent youth. This scenario is by no means guaranteed; it is contingent on a decrease in the number of ‘dependents’ in the country which would require two major shifts, namely 1) a further decrease in Kenya’s birth rate (currently at 3.9 children per woman) and 2) higher employment numbers for its young generation. The latter is the focus of this report. Kenya’s economy has presented volatile yet comparably high growth rates in the last two decades. However, this generally positive macro-economic development has not translated into benefits for its youth. While annual GDP growth of more than 5 per cent has been regularly recorded, Kenya’s youth unemployment rate has shown little to no positive development, and stands at a staggering 22 per cent for 2016 (according to ILO estimates). In addition, underemployment appears to be a rampant phenomenon for young Kenyans. The danger of a ‘lost generation’ is running high in Kenya; and most countries in Africa record significantly lower youth unemployment rates than this relatively strong economy. With 500,000 to 800,000 young Kenyans entering the job market each year, its economy has not been able to provide the necessary amount of employment opportunities – formal and informal alike. Economic progress has primarily benefitted the older generation; young females in rural locations constitute the largest share of unemployed Kenyan youth (in absolute numbers), while their counterparts in urban areas are most likely to be unemployed (in relative terms). Gender and living location are defining factors, but youth unemployment is rampant throughout Kenya. Education is regularly considered a key element for better employment opportunities, and Kenya has made progress in recent years with enrolment numbers for primary education now officially at 100 per cent. In contrast, however, with only 3.3 per cent of women and 4.7 per cent of men enrolled in tertiary education, Kenya is falling behind many other African nations and the education provided/obtained often lacks the necessary skillsets the job market actually requires. Relevant technical skills could be taught in TVET programmes and colleges, but these have seen a comparably slow increase in enrolment numbers due to the focus on basic education by governmental and Youth Employment in Kenya Samuel Hall 4
international actors. Despite recent efforts and initiatives in this regard, TVET and labour-market-
adapted university education still leave major room for improvement to appropriately equip Kenya’s
youth, especially young women. Little or misdirected preparedness for the labour market is one of
the major complaints from employers.
Faced with few opportunities, much competition and in some cases additional personal
vulnerabilities (for example, impoverished backgrounds and poor health conditions), most of Kenya’s
young generation relies on the possibilities the informal sector offers, employment and self-
employment alike. Kenya’s dual, but intertwined, economy is characterised by an informal sector
that provides 83 per cent of all current employment opportunities – formal and comparably well-
paid wage employment is only available for very few of Kenya’s youth. Instead, informal
employment and self-employment in the following sectors create the major job market ‘pools’:
Agriculture: rural youth in Kenya primarily earn their living in informal jobs within the
agriculture sector, including pastoralism. Despite a lack of precise data, (informal) work
in various agricultural activities is considered the largest ‘employer’ of Kenyan youth.
However, currently the sector is not of key concern for governmental actors in terms of
growth, investment and innovation strategies, and it is defined by high vulnerability to
natural impacts (eg droughts).
Service Sector: as an umbrella term, the service sector not only combines various
activities but is also the second most important area for young Kenyans to earn a living.
Especially in urban areas – such as Nairobi, Mombasa and many secondary towns across
the country – labour activities in the food industry, in markets, in the transport sector
and in waste management are highly common forms of income for young Kenyans. In
addition, but highly dependent on the location, jobs in the growing ICT and creative
industries (especially in Nairobi and often formal) and in tourism (e.g. on the Kenyan
coast) provide some other service sector opportunities.
While they remain niche phenomena, the reality of criminal activities and prostitution as forms of
income generation for male and female youth alike in Kenya cannot be denied. Reliable numbers do
not exist, but Kenyan youth do not seem to focus livelihood strategies. In contrast, young Kenyans
throughout the country – especially in urban centres – are often tech-savvy and tech-literate
individuals. Hence, with Kenya a country with comparably good mobile internet coverage and high
individual internet use (in comparison to other sub-Saharan African countries), this creates the
foundation for the country’s growing ICT scene. Particularly for educated youth, jobs in software and
app development, in business-process outsourcing and in creative/editorial tasks become more and
more attractive and available. However, such job opportunities are rarely available to the rural
majority of Kenya’s young generation. Accordingly, bridging the gap between technology and the
agricultural sector could not only create new jobs, but could also increase the attractiveness of the
sector for Kenyan youth.
Although the ICT sector is one of the six economic sectors of growth in the government’s Kenya
Vision 2030 (along with Energy, Finance, Tourism, Manufacturing, and Micro, Small and Medium
Enterprises), it cannot and will not be able to solve the country’s current ‘youth employment
challenge’ by itself. Instead, job creation and interventions for such need to be more diverse,
Youth Employment in Kenya Samuel Hall 5including other sectors such as agriculture – currently and in the future the most important job
market. The mix of unemployment, underemployment, inactivity, and poor-quality jobs (informal,
unskilled, and low-paid) continues to disproportionately affect 15-24-year-old youth more than the
rest of the working-age population of Kenya – and will continue to do so, unless the Kenyan
governments initiates systemic reforms.
By 2030, Kenya will need to solve a difficult equation: on the one hand, a working-age population at
approximately 60 per cent; on the other, high levels of informal jobs, unemployment, and
underemployment. In spite of the very positive image of the modern services sector (finance, ICT), it
only accounts for a minor percentage of employment among youth. It is therefore urgent to
promote a transformational agenda, for instance, by optimising the fiscal revenues from the
emerging oil industry, by investing in and promoting technical education such as TVET programmes,
and by including low-income but work-intense sectors into development strategies (eg certain
agricultural sub-sectors). In addition, any interventions and support programmes should not only be
concerned with the macro-economic lens of harnessing a ‘demographic dividend’, but must be
focused on the individual capacity, ingenuity and agency of young Kenyans.
For the tasks of positively engaging with its current ‘youth employment challenge’, from individual to
national level, Kenya can learn from other countries, but it must adapt programmes and ideas to its
own realities. Being able to do so depends on reliable and up-to-date data on youth employment in
Kenya and in its 47 counties. Unfortunately, such data is currently lacking: neither large scale survey
data nor sufficient sector assessments and case studies are available. Accordingly, the following
future research efforts are recommended:
Employment statistics: Reliable youth (un)employment data at the county and sectoral
level is necessary for any future evidence-based interventions and programming.
Labour market and skills assessments: A national labour market assessment and skills
inventory is needed to better understand the skills mismatch, and to allow for the
development of policies to address this.
Sectoral case studies and assessments: These will allow of the measurement of the
real potential for youth employment in certain sectors (such as ICT, agriculture,
tourism, the transport industry and others) and better understand the specificities of
situations at the individual level.
Gender-sensitive assessments: Gender-specific research regarding the vulnerabilities
faced by male and female you are necessary to support the design of gender-sensitive
approaches.
Despite current limitations in terms of precise data, analysing current literature and available
information still allows for identifying key aspects of potential interventions. Actors engaged in youth
employment issues in Kenya should focus their future efforts on the following areas:
Curricular revision of secondary, tertiary and technical level education, to allow
young Kenyans to become a readily employable, skilled workforce.
Promoting supervised internships and apprenticeships across all sectors and
education levels.
Youth Employment in Kenya Samuel Hall 6 Supporting young people in creating their own (formal or informal) employment
opportunities, by teaching entrepreneurial skills, values and personal attributes such
as communication, finance, leadership, strategic thinking, navigating conflict, and the
ability to recognise one’s own potential and capacity.
Holistic programming for Kenya’s ‘youth employment challenge’ with unbiased
approaches, supporting the creativity and resilience of existing sectors and individuals,
rather than focusing on the formal or informal.
Youth Employment in Kenya Samuel Hall 71. The Next Generation Project in Kenya
A. Introduction
The British Council’s Next Generation research series focuses on the role of young people as active,
engaged citizens, and on how evidence-based research can ensure they are best supported in this
role. In prioritising young people’s voices and views around employment, education, ways of life,
and their opportunities and challenges, the Next Generation series plays a key role in informing
programme and policy research. In each country, the research element of the series includes a
literature review with three main objectives:
1. To systematically and critically analyse existing findings on country specific youth
issues to develop a framework for further research;
2. To identify where gaps in knowledge appear in the existing literature, and present
further questions raised;
3. To use the synthesised analysis of literature, knowledge gaps, and questions to
make recommendations for future areas of research, and thus lay the groundwork
for the subsequent empirical research component of the Next Generation projects.
This review specifically addresses youth employment in Kenya, examining both the challenges and
opportunities faced by its young people aged 15 to 24. Kenya is currently experiencing a ‘youth
bulge’, with over 20 per cent of its population falling into that category. The absolute number of
youth in Kenya is steadily increasing (currently at an estimated 9.5 million). With a large child
population as well, this trend is set to continue for generations to come. This ‘youth bulge’ has the
potential to elevate Kenya’s socio-economic status, if sufficient jobs and employment are available
to youth who have the potential to actively contribute to the labour force. However, if the youth
population continues to experience the very high levels of unemployment it currently faces, it could
result in economic stagnation through a “lost generation” of workers. To address this most
effectively, taking into account the aspirations and agency of these youth is crucial.
The research presents a detailed literature review of existing studies and literature related to the
topic. It underlines gaps in existing research and raises key questions on the reliability of existing
data. Most studies draw their conclusions from the same small pool of primary research, including
the Kenya Integrated Household Budget Survey, which was conducted in 2005/2006, and the Kenya
Population and Housing Census, which was conducted in 2009. Therefore, the analysis in this
literature review can only be a comment on general trends and patterns, rather than absolutes.
The key sections of this report will be as follows:
Literature review results and limitations;
Economic development and the potential for a demographic dividend;
Youth Employment in Kenya Samuel Hall 8 Labour market integration and the readiness of Kenyan youth: individual and systemic
barriers and opportunities;
Sectoral and locational differences in employment amongst Kenyan youth;
The future of youth employment in Kenya; and finally
A summary of key findings followed by policy and research recommendations.
B. Demographic background and context
The Republic of Kenya in the year 2017 is a ‘young’ country, with an estimated 61 per cent of its
population being either children – age 0 to 14 – or youth – age 15 to 24 (UN 2017). Based on latest
UN estimates, the country’s youth population is made up of over 9.5 million people, more than 20
per cent of all Kenyans. This youthful population is not unique in the African continent, home to 226
million youth aged 15-24 in 2015 (UN 2015). Such a youth share in population statistics echoes the
demographic realities of Kenya’s neighbouring countries and Sub-Saharan Africa, in general (see
Figure 1).
Figure 1: Youth Population (per cent) - based on UN estimates for 2015 (UN 2017)
As is the case for many other developing countries, especially on the African continent, Kenya’s
overall population saw high growth rates in the second half of the 20th century, and “high fertility,
combined with declining child mortality, gave Kenya one of the world's fastest population growth
rates in the 1970s and 1980s” (Thuku et al 2013). While fertility rates in Kenya declined significantly
in the 1980s, they have stalled since the mid-1990s at approximately 3.9 births per women (for
2014; UNFPA & AFIDEP 2015: 12). Kenya’s population growth thus remains significant, across all
counties. Given current numbers of children and youth, this trend will continue “for several
generations even after reaching replacement level fertility (about 2.1 children per woman) because
Youth Employment in Kenya Samuel Hall 9there are many young people who are likely to start their own families” (Muiya 2014). Hence, based on past and present population dynamics, UNFPA has classified Kenya as a ‘Group 3’ country in Africa, characterised by a (still) elevated fertility but decreased (child) mortality rates (UNFPA & AFIDEP 2015). Like most of these countries, Kenya is currently faced with the opportunity and challenge of a so- called ‘youth bulge’. Following the official UN definition, this phenomenon “occurs when more than 20 per cent of a country’s population is composed of young people”, which can be “a valuable asset for both present and future generations” but, at the same time, “a risk to development if social and economic conditions are not suitable” (UNDP 2013). Considering the 20 per cent benchmark, Kenya has been experiencing a ‘youth bulge’ since the mid-1990s, with a peak in in the mid-2000s when nearly 22 per cent of all Kenyans were between the ages of 15 and 24 (see Figure 2 below). The latest numbers on the country’s population, however, showcase that – in relative terms – this ‘youth bulge’ is undergoing a slow decline (only 20 per cent youth in 2015). However, the absolute number of youth in Kenya continues to increase, from 6.8 million in 2000 to 9.5 million in 2015 (see Figure 2). This simply means that “the growth rate of this population cohort is now smaller than the adult working-age cohort” (UNDP 2013). Figure 2: Kenya's population since 1960 with a focus on 2000-2015 (absolute numbers in 1,000) - based on UN estimates for 2015 (UN 2017) The Republic of Kenya is likely currently experiencing its ‘youth bulge’ peak, “which could either be a demographic dividend, or a disaster” (Chatterjee & Ronneberg 2017): either Kenya will be able to utilize and support its young, aspiring citizens in achieving appropriate education and jobs, which should lead to a prosperous socio-economic future for everyone, or – if this chance is missed – economic stagnation and a neglected ‘lost generation’ will likely jeopardize such future. The rapid Youth Employment in Kenya Samuel Hall 10
increase of the overall population, and especially of the youth population, in past decades, has
provided Kenya, its socio-political structure and its economy with various opportunities, stemming
from an increased number of potential consumers and workers, but also increasing stress. Other
‘mega-trends’ are intertwined with this phenomenon, for example:

    ●    Migration: Including rural-urban migration, as “many of the young people have moved
         to cities as a way to escape poverty and to seek opportunities” (Kararach et al 2011),
         and out-of-country-migration – “in the face of the increasing discontent and the poor
         employment prospects, out-migration of young people has remained an important
         issue in Kenya” (ILO & IILS 2013).
    ●    Urbanisation: Fuelled by rural-urban migration and the general population growth,
         Kenya’s cities are growing in an often rather uncontrolled fashion, which can be
         observed for the county’s major agglomerations (Nairobi, Mombasa, Kisumu) but
         increasingly also for smaller and secondary towns, such as Nakuru, Eldoret, Kikuyu,
         Ruiru, Kangundo-Tala, Thika and Machakos (Bousquet 2008; UN Habitat 2015).
    ●    Environmental degradation: The increase in population can lead to environmental
         strain as the demand for water, for example, increases (Sivi Njonjo 2011).
    ●    Insufficient infrastructure: “With more young people comes an increased demand for
         education, health care and sanitation infrastructure” (Ibid.).
    ●    Hardening socio-economic inequality: Kenya’s Gini Coefficient is of 47.7, which is
         higher than many neighbouring countries (Odero et al 2017), while one third of
         Kenya’s population is experiencing ‘multidimensional poverty’.1 However, on this front
         Kenya remains better off than its neighbours as the prevalence of ‘multidimensional
         poverty’ is significantly higher in other East African countries, such as Tanzania (66 per
         cent), Uganda (70 per cent) and Ethiopia (88 per cent) (UNDP 2016).
    ●    High (youth) unemployment rates: “Youth unemployment rates are high, and youth
         represent, by far, the bulk of unemployed people. The unemployment problem in
         Kenya is to a large degree, thus, a youth problem” (UNDP 2013).

This study will focus on economic and labour market concerns that are either connected to or (at
least partially) caused by Kenya’s youth population. In this regard, the overall economic
development in Kenya since 2000 provides the basis for the contextualisation of the realities of
current youth (un)employment and their economic activities presented subsequently. While it is
important to understand the macro-economic contexts and conceptual frameworks, such as the
‘demographic dividend’ (see Chapter 3), understanding youth as actors and framing discussions
accordingly is necessary to allow equity based approaches to supporting young people. Considering
the agency of youth in achieving a prosperous Kenyan future, and acknowledging their needs and
aspirations to fulfil their potential, is crucial for academic tasks such as this report but particularly to
design and implement interventions appropriately at the operational, advocacy and policy levels.

1
 “The Multidimensional Poverty Index (MPI) […] complements monetary measures of poverty by considering overlapping
deprivations suffered by individuals at the same time. The index identifies deprivations across the same three dimensions
as the HDI [namely, health, education and standard of living] and shows the number of people who are multidimensionally
poor (suffering deprivations in 33% or more of the weighted indicators) and the number of weighted deprivations with
which poor households typically contend with.” (UNDP 2016)

Youth Employment in Kenya                        Samuel Hall                                                          11
Figure 3: Youth Population (15-24 years) by County in 2009, absolute numbers (left) and percentages (right); the three counties with the highest numbers in each category are highlighted – own calculations based on Kenya Population Census 2009 (KNBS 2009) Youth Employment in Kenya Samuel Hall 12
2. Literature review results & limitations
A. Methodology & Process
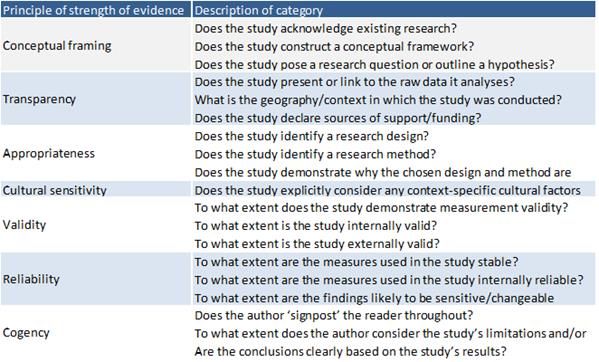
A detailed methodology is available in Annex 1. Samuel Hall used a systematic and iterative
approach to conducting this literature review with three key steps (see Figure 4 below), using an
iterative approach that progressively refines the literature review to ensure all credible data sources
have been investigated, and relevant portions incorporated.
Figure 4: Iterative review process
Step 1 - REVIEW Step 2 - ASSESS and Step 3 - IDENTIFY
ANALYSE
Identification of Finalisation of review and
documentation for Inclusion and analysis of remaining gaps in lit
incorporation relevant data
•At this point remaining
•Uses DFID's Strength of •4 analytical questions used to literature gaps and questions
Evidence approach to the assess information relevance raised will be incorporated into
review and strength: (1) Are the the literature review
articles and studies relating to document.
•3 step screening process: the thematic objectives the
•Identification of potential most current available? (2) In •These questions will be used to
documents for incorporation answering the research refine the recommendations
questions what gaps are there for future data collection,
•Examination of strength of in the information? (3) What
evidence according to analysis and desk review in
events have happened since order to uncover the necessary
selected review criteria ((1) the last data collection to
Conceptual framing; (2) information.
suggest data may be different
Transparency; (3)
today? (4) Is more
Appropriateness; (4) Cultural information likely to be found
sensitivity; (5) Validity; (6)
and if not can the question be
Reliability; and (7) Cogency) more adequately addressed
•Final selection and analysis through future data
of documentation and collection?
secondary data
•Those articles and documents
assessed as being relevant
and reliable will be used to
answer the research
questions.
An initial literature search was conducted by reviewing key academic studies and reports by bilateral
and multilateral organisations, focusing on those working on the area of youth employment in
Kenya, including, but not limited to, those recommended by the British Council such as:
DFID East Africa Research Hub
British Council Higher Education Graduate Employability research
International Labour Organisation
World Bank
Aga Khan East Africa Institute
Afrobarometer
Global Competitiveness Report
Youth Employment in Kenya Samuel Hall 13Key search terms were developed in order to conduct a broader literature sweep of reports
(published and unpublished), journal articles, dissertations, press releases, and newspaper or
magazine articles relevant to the topic. Google Scholar was used as the search engine, as it includes
results from major research engines such as Research Gate or Refseek, and runs its own operators to
ensure synonyms and truncations are used. Whereas the general Google search engine results are
open to a user’s location or prior search history, Google Scholar allows for a more systematic and
replicable approach.
Due to the relatively broad nature of the research questions, and the need to keep the literature
review as systematic as possible, the search terms were designed to ensure a particular focus on
youth, and Kenya. In order to gauge a more complete picture, however, studies on global youth
(un)employment were also included.
Literature was prioritised according to relevance, with particular interest paid to studies where
youth played a role either in the design or research specifically. However, it was found that despite
an enormous amount of literature on youth employment and a global acknowledgement of the
increasing numbers of youth attempting to enter a constricting labour force, recent and accurate
data focusing on youth in Kenya is lacking. Many studies used the same outdated data, and so in
answering the research questions it was possible only to understand general trends and patterns.
In addition to the systematic search, an iterative approach was used, particularly in cases where
information was scarce. In these instances, further broader searches were conducted, using the
bibliographies of identified studies to snowball off of, in order to ensure important information was
not being left out of the discussion.
B. Results and Overview of the Literature Search
Of the 324 documents initially identified, 42 were chosen for inclusion based on the appropriateness
and inclusion criteria detailed above. Documents that were not open access, or were academic
submissions below PhD level, were immediately excluded.2 Articles with little relevance to the
Kenyan context were also excluded. These 42 documents were then read fully and assessed using
DFID “assessing the strength of evidence” guidelines. After this process, a further 7 documents were
excluded from the study. This search selected documents that were mostly expert reports, peer-
reviewed journal articles, and dissertations, which pass the strength of evidence criteria.
In addition to the initial document identification, an iterative search process took place, where
additional documents were sourced based on key stakeholder research, the bibliographies of
documents already identified, and further literature search to address data gap. These were similarly
assessed along strength of evidence criteria. Documents failing these (such as newspaper articles)
were only included (with a caveat) should there be a lack of any other data on the topic.
2
In cases where abstracts were available in open access format, these abstracts were considered to see if the paper would
add to the information already gathered from other documents; this did not lead to the identification of documents likely
to answer data gaps.
Youth Employment in Kenya Samuel Hall 14Figure 5: Document/literature Identification and Screening Process Youth Employment in Kenya Samuel Hall 15
Table 1: Included references by type of publication/document

Type                                                  Number
Report                                                48
Journal Article / Research Paper                      30
Online Sources                                        20
Data / Survey                                         14
Newspaper/Magazine Article                            11
Book / Book Chapter                                   9
Other                                                 11
Total                                                 143

Table 2: Included references by year of publication

Year                                                  Number
n.d                                                   9
2000                                                  0
2001                                                  0
2002                                                  1
2003                                                  1
2004                                                  1
2005                                                  1
2006                                                  0
2007                                                  1
2008                                                  2
2009                                                  5
2010                                                  4
2011                                                  5
2012                                                  10
2013                                                  15
2014                                                  8
2015                                                  21
2016                                                  32
2017                                                  27

       C. Data Reliability and Study Limitations

The general reliability and accuracy of information on youth (un)employment, their economic
(in)activity and even general population numbers for Kenya must be questioned. While a few studies
in recent years have provided their own primary data collection – such as the The Kenya Youth Survey

Youth Employment in Kenya               Samuel Hall                                             16
Report by Aga Khan University (executive summary: Awitit & Scott 2016) and The Nature, Challenges
and Consequences of Urban Youth Unemployment by Bernard Munyao Muiya (2014) – the clear
majority of numbers, statistics and secondary analyses are primarily based on the following three
major surveys:
● The 2005/2006 Kenya Integrated Household Budget Survey (KIBHS) by the KNBS –
funded and supported by DFID and USAID (KNBS 2012)
● The 2009 Kenya Population and Housing Census by the KNBS (see:
www.knbs.or.ke/publications)
● The annual and national Economic Surveys by the KNBS, which do not feature youth
specific data (see: www.knbs.or.ke/publications)
No more recent reliable labour force surveys have been conducted in Kenya (World Bank 2016b);
even the extensive 2009 Kenya Population and Housing Census has raised concerns about its
reliability, with for example, the data on population for the North Eastern Province controversial
(UNFPA 2015). The information gathered and analysed within this desk review study must therefore
be looked at critically. This includes even the numbers and statistics from reports and databases
which are released by organisations such as the World Bank, ILO and several UN bodies. For example,
ILO unemployment estimates (see Figure 6) are based on the official numbers of the KNBS, UN
estimates for Kenya’s population (see Figure 2) are based on models that are fed by past Kenya
Population and Housing Censuses (with the last one from 2009), and the oft-cited discussion paper
Kenya’s Youth Employment Challenge (UNDP 2013) draws its numbers and conclusions from the
2005/2006 KIHBS.
While the general trends and overviews from such documents and statistics can allow for a broad
analysis of the current landscape of youth (un)employment in Kenya, they do not allow for an in-
depth and definitive assessment. Thus, while the issues and trends identified in this desk review are
based on sound scientific research and valid secondary information, one of the key challenges for
future efforts regarding youth employment in Kenya is the lack of data – to overcome this problem,
further research and support for major surveys are necessary.
Youth Employment in Kenya Samuel Hall 173. Economic development and the potential of the
demographic dividend
This section considers the recent and current trends in the Kenyan economy, as well as the shifting
portion of the population made up by youth, in order to understand the potential for a demographic
dividend in Kenya. While Kenya’s economy continues to grow, to date this growth has not been
sufficient to keep up with the “youth bulge” placing demographic pressure on it. Kenya’s relatively
low dependency ratio and economic boom do offer the potential for a demographic dividend; the
country currently lacks the means to facilitate and exploit this at the national and individual levels.
A. Contextualising youth employment in Kenya
After significant economic volatility in the 1980s and 1990s, Kenya’s economy started growing
consistently with average GDP growth rates of 2.5 per cent per year between 2003 and 2014 (World
Bank 2016b). For the last two years, the country’s GDP growth has been oscillating between 5.6 and
6.5 per cent annually. These are impressive numbers in global comparison, but not unique in the
East African region, one of the current powerhouses of economic growth in the world (Odero et al
2017; UNECA 2017). While growth in the region is high, it is coming from a lower point than much of
the developed world; the question of unemployment is thus more relevant as the country cannot
rely on continued growth.
Figure 6: Unemployment rates (per cent) in Kenya from 2000 to 2017 - based on ILO estimates
(ILO 2016a)
Youth Employment in Kenya Samuel Hall 18For Kenya, “construction, manufacturing, finance and insurance, information and communication
technology (ICT), and wholesale and retail trade” are considered the main drivers behind this trend
(Odero et al 2017). However, this positive economic development is not reflected in the
employment rates of Kenya’s population, and especially of its youth. As Figure 6 shows,
unemployment rates in Kenya – namely, the number of persons who are unemployed as a per cent
of the total number of employed and unemployed persons (age 15 and older) – first increased until
2009, before plateauing through 2012/2013 and have, since then, only shown moderate rates of
decline. While these trends are valid for all age groups, it is, in particular, Kenya’s young generation
that has been left behind – despite all macro-economic advancements. In comparison with whole
SSA, the combination of macro-economic progress (based on DGP growth) and high youth
unemployment rates in Kenya becomes even more distinct: although GDP growth in both Kenya and
SSA has been significant since 2000, Kenya’s youth unemployment rate is now 42 per cent higher
than in 2000, while the youth unemployment rate for overall SSA has decreased by 9 per cent (see
Figure 7).
Figure 7: Comparative change in GDP and Youth Unemployment Rates in Kenya and SSA from 2000
to 2016; the respective numbers for 2000 have been levelled at 100 – based on ILO estimates and
World Bank Data (ILO 2016a; World Bank 2017f)
600
Kenya - Youth Unemployment Rate
Kenya - GDP
500
Sub-Sahara Africa - Youth Unemployment Rate
Sub-Sahara Africa - GDP
400
300
200
100
0
2000 2005 2010 2015
The gap between economic progress and increasing youth unemployment is a distinct feature of
Kenya’s current socio-economic situation. The reasons for this phenomenon are manifold, but Jacob
Omolo generalizes the situation as follows:
“[E]ven though the Kenyan economy may have realised net employment creation
(after taking into account the new jobs and job churning) over time, the rate at which
the net jobs were created was almost the same as the rate of labour force growth. This
effectively meant that more job seekers, both the new labour market entrants and
Youth Employment in Kenya Samuel Hall 19those out of employment through the various labour separation mechanisms,
ordinarily remained out of employment for a longer period hence swelling the ranks of
the discouraged job seekers.” (Omolo 2012)
While Kenya’s economy grew, so did employment rates, by 4.5 per cent per year between 2006 and
2013. However, this steady increase in available jobs (including formal and informal forms of
employment) has not been sufficient to accommodate concurrently 500,000 to 800,000 young
Kenyans that enter the working age population – and the labour market – each year (Nebe &
Mang’eni 2016; Sikenyi 2017; World Bank 2016a). Data on the exact numbers entering the labour
market is lacking; hence the wide spread between these figures. Accordingly, the country’s young
labour force has not been put into productive use, hurting the general growth potential of its
economy and limiting the opportunities of many of Kenya’s young citizens, who possess the
potential to creatively and significantly contribute to the positive development of the nation (UNDP
2010; World Bank 2016b).
Several interconnected reasons explain the fact that Kenya’s economic growth has not been
reflected in the employment rates and economic opportunities for its youth:
1) The sheer size and growth of its young population – despite most recently plateauing
as a share of the population (see Figure 2) – is hard to compensate for, even if
continuous and strong economic growth leads to more employment opportunities, in
the present and near future (UNDP 2013).
2) Employment growth in the last few years has largely benefitted the older segments
of the labour force, who have more experience and contacts (Escudero & López
Mourelo 2013).
3) The skill-sets and aspirations of Kenya’s young generation are often disconnected
from the realities and demands of the actual labour market (Ndayambaje et al 2016;
Odero et al 2017; Sikenyi 2017) – for example, only 11 per cent of youth aspire to work
in agriculture despite the sector’s huge capacity for employment (Awiti & Scott 2016).
4) Kenya’s relatively low employment-to-population rates for youth – namely, the
proportion of its youth population that is employed (see Figure 8; NB that figures
considering unemployed and employed numbers come to 50 per cent, while the
specific activities of the rest are not specified, these could include youth in education,
or in un-recorded economic activity/ inactivity) – might be affected by the positive fact
that secondary school enrolment has been increasing. However, this would only
account for the age group between 15 and 19 (and over-19s repeating years of school).
Indications of an increasing ‘elitisation’ of academic education suggests that this
cannot fully explain the phenomenon (ILO & IILS 2013; Sivi Njonjo 2011 / see also
Section 4).
Youth Employment in Kenya Samuel Hall 20Figure 8: Per cent of population employed, for the age group between 15 and 24 in 2017 - based on
ILO estimates (ILO 2016b)
These challenges for Kenya’s future are faced by the entire country, for all genders and counties, in
both urban and rural areas. The only available in-depth and nation-wide analysis of youth
employment – based on data from the 2005/2006 KIHBS (Kenya Integrated Household Budget
Survey) – allows for a more nuanced look at the situation. The key take-aways for this often-
referenced UNDP (2013) study are that:
● Youth unemployment is rampant throughout all of the former provinces of Kenya,3 and
everywhere it is significantly higher than adult unemployment rates (while the
magnitude of this difference varies).4
● Unemployment is particularly affecting the age group of 18-to-25-year olds.
● While the youth unemployment rate is higher in urban areas (ranging from 35 to 60
per cent, vs. 20 to 25 per cent in rural areas; UNDP 2013), the absolute number of
unemployed youth is higher in rural areas.
● Young women are more affected by unemployment or economic inactivity than young
men, with a difference of more than 10 per cent (UNDP 2013).
● As a simple rule, in Kenya, of youth, female urban youth have the highest (percentage)
rates of unemployment (ranging from approximately 50 to 65 per cent depending on
age), and rural males the lowest (at approximately 20 per cent; UNDP 2013).
3
The 2005/2006 KIHBS, that provides the underlying data, had been conducted before Kenya’s administrative system was
changed, following the promulgation of the country’s newest constitution in 2010 and its goal of political-administrative
devolution. The former 8 provinces of Kenya have been replaced by 47 counties in 2013.
4
Based on data from the 2005/2006 KIHBS, the most significant gap between youth and adult unemployment rates was
observed for Nyanza Province in Western Kenya, with youth unemployment being six times higher than for adults. The
highest rate of youth unemployment, however, was recorded for North Eastern Province with more than 60% (UNDP 2013)
– recent data on county level is not available.
Youth Employment in Kenya Samuel Hall 21The problem with these findings, as with many other information for this study, is the outdated
nature of the data on which they are based (see also Section 2). However, numerous authors and
organisations are certain about the general challenge and threat to Kenya’s socio-economic future
that arises from its current demographics and its inability to provide sufficient economic
opportunities: “Although official statistics are not available, unemployment and underemployment
are rampant, especially among the youth” (World Bank 2016b).
In this regard, the underemployment of Kenyan youth is a highly neglected yet serious issue, neither
accounted for in official statistics of the KNBS or ILO, nor reliably and thoroughly addressed by
academic literature. Underemployment can be defined as “overstaffing or a situation whereby one’s
job does not permit total use of his/her skills, abilities or productive capacity” or as “working on part-
time, working under unsatisfactory working conditions to the worker or working on a full-time job on
which the candidate over qualifies” (Ndayambaje et al 2016). According to either of these definitions,
and despite a lack of accurate data on the issues, a few studies (for example, Vuluku et al 2013), as
well as reports by organisations and the media, indicate that underemployment is a crucial problem
that leaves affected youth behind as dependents, despite their actual economic activity. This seems
to be the case for youth in rural areas, as an “estimation from the 2009 population census points to
pervasive underemployment —hidden unemployment— which is transposed into a high share of
labor in subsistence agriculture” (World Bank 2016b). It also affects educated and/or urban youth, as
a recent story in the Financial Times highlights:
“When Oliver Kigalu enrolled for his engineering degree seven years ago, he never thought
he would end up working as a construction labourer. But that is how the 26-year-old now
makes his living. ‘When you leave college so many people are looking for jobs but it’s very
hard to get a decent one,’ he says, as he queues for work outside a half-built factory in
Ruaraka in northern Nairobi. ‘I’m not using my qualification at all, but the important thing is
to make money and get food.’” (Aglionby 2017)
Cases like this shine a light on the struggle of even educated youth to find appropriate employment;
they also showcase the individual challenges of Kenyan youth in becoming active agents of change
and progress in their country. While youth unemployment and, especially, underemployment are by
no means fully explored in existing literature on the Kenyan context, and not at all at the county
level, a general situational analysis exposes a country on the edge – between a prosperous socio-
economic future made possible by productively utilising its current ‘youth bulge’ or a gambled away
‘demographic dividend’. The complete absence of data on underemployment in Kenya, not just youth
related, highlights another crucial challenges (youth) labour market focused interventions in Kenya
and many other African nations:
“One of Africa’s biggest challenges has been lack of statistical information to inform public
policy, and initiatives that governments and partners pursue to address the challenge of
unemployment, underemployment and informality. […] The larger problem is that, if you
cannot measure it, then you cannot monitor progress. You can’t tell your story yet even
when you make progress you do not know it because you don’t have the figures to
demonstrate trends.” (Aeneas Chuma, ILO Regional Director for Africa, quoted in: Banzi
2017)
Youth Employment in Kenya Samuel Hall 22B. ‘Demographic dividend or disaster’
The conceptual framing of engaging with the economic and employment realities of youth and of
national economies by addressing the potential and risks of a ‘demographic dividend’ has gained
significant momentum on the African continent in recent years: “Over the last ten years, it has
become evident that a demographic dividend lens offers a strategic basis for focusing and prioritizing
investments in people in general and the youth in particular” (African Union n.d.).
The economic-demographic phenomenon called ‘demographic dividend’ has, for example, occurred
in several East Asian countries – such as Malaysia, South Korea and Thailand – between 1970 and
2000, and contributed a quarter to a third of the economic growth in this period (UNFPA & AFIDEP
2015). It explains an accelerated economic output when the ratio of working-age adults significantly
increases relative to dependents, for example children and unemployed persons, and when more
women join the workforce due to reduced child rearing responsibilities. Simply and relatively
speaking, more (young) people, especially women, enter the working age population than leave it,
and they are put to productive use. After this initial phase, a second phase of the ‘demographic
dividend’ can occur “by the enhanced human capital investments per child, and increased savings
and investments that households and governments make as a result of increased incomes and
reduced costs of taking care of children” (UNFPA & AFIDEP 2015). However, this is not a process that
will just happen naturally but it is highly dependent on the economic utilisation of a country’s young
population:
“The demographic dividend concept describes the boost in economic growth that society
can experience when a well-equipped demographic — in this case young people — has the
education and jobs. If you have the same number of young people, but lots of dependents
and big families, that is not going to lead to the boost that we are describing. Typically,
countries will benefit when they are equipping young people [with education and skills] and
they are also making a transition from having lots of dependents to better family planning.
The dependency ratio is a key element of the demographic dividend.” (Natalia Kanem,
UNFPA Acting Executive Director, in: Lieberman 2017)
These requirements – a well-equipped demographic with education and jobs as well as a reduced
percentage of dependents (discussed later in this report) – are exactly what Kenya has been
struggling with:
● Regarding education, while there have been significant advancements in primary and
secondary education, enrolment in tertiary education remains relatively low with 2009
rates at 4 per cent, compared to 6.8 per cent for SSA in 2010 and 30.6 per cent in the
Middle East and North Africa for the same. This has been noted as potentially contributing
to the relatively high inactive portion of youth, for whom participation in tertiary
education cannot explain lack of employment (ILO & IILS 2013).
Youth Employment in Kenya Samuel Hall 23● Regarding jobs, as previously shown, Kenya’s economy has not be able to provide its
young generation with sufficient jobs, hence “the majority of the youth in Kenya are still
under- or unemployed, and vulnerable” (Sikenyi 2017).
While estimations by the World Bank and by the National Transfer Accounts indicate the potential
for a decrease of the percentage of dependents in Kenya by 2030: “For example, the youth
dependency ratio is projected to fall to 0.6 by 2030,” from 1.0 in 2010 – this is not guaranteed – “if
the youth unemployment rate remains high, Kenya’s effective youth dependency rate will go down
only to 0.7” (World Bank 2016b: 67). In general, an impactful decline in dependency ratios is highly
dependent on two factors: 1) a further decline in fertility rates with a more significant pace than
since the 1990s and 2) adequate labour income for its young generation. (NTA 2013; World Bank
2016b). In sum, Kenya still has the opportunity to harness its potential ‘demographic dividend’ in the
coming years and decades, but only if, simultaneously, birth rates decline and its young generations
rely less on their families in the future – the latter requires a growing number of well-paying jobs,
especially in agriculture and the informal sector: “labor income is critical if Kenya is to achieve a
robust demographic dividend” (NTA 2013: 3). To support such positive development on the
continent, the African Union has recently prepared a road map, providing general guidelines for key
activities in four pillars - namely: Employment and Entrepreneurship; Education and Skills
Development; Health and Wellbeing; and Rights, Governance and Youth Empowerment (African
Union n.d.).
While the roadmap can provide ideas for a programmatic engagement with an ‘demographic
dividend’, its successful utilization in the Kenyan context is far from guaranteed. Past examples from
South Africa have shown that countries are often unable to provide an appropriate policy landscape
and/or to attract necessary investment in relevant sectors, education and such like (Drummond et al
2014). Positive examples have happened in vastly different contexts and it is not easily possible to
replicate interventions that led to a positive use of the ‘demographic dividend’ (see Chapter 6).
Kenya, despite its current economic boom and long-standing geopolitical role in (East) Africa, also
struggles with corruption, political tension and increasing inequality, among other challenges. While
this also calls for Kenya’s young generation to take their present and future into their hands,
government, civil society, economic actors and more have the duty to ensure that these youth have
the right tools and opportunities at hand to do so in a productive and peaceful fashion. How the
current realities and coping mechanisms within the ongoing ‘youth employment challenge’ and its
larger context in Kenya are lived and experienced will be explored in-depth over the course of this
report.
Youth Employment in Kenya Samuel Hall 24You can also read