THE LONG VIEW HOW WILL THE GLOBAL ECONOMIC ORDER CHANGE BY 2050? - PWC
←
→
Page content transcription
If your browser does not render page correctly, please read the page content below

www.pwc.com         The World in 2050

                The Long View
                How will the global
                economic order change
                by 2050?

February 2017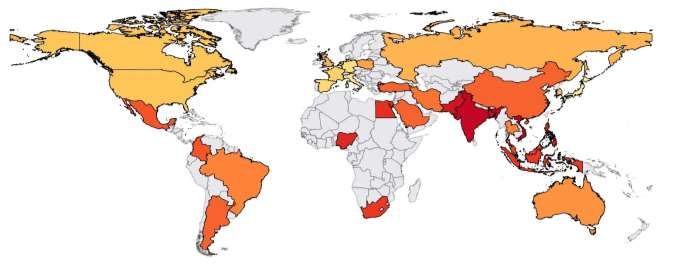
The World in 2050

Table of Contents
1. Summary ……………………………………………………………………………………………………………………………………..5
2. Introduction ……………………………………………………………………………………………………………………………….12
3. Global growth projections to 2050 …………………………………………………………………………………………..16
    Box 1: China’s long-term growth prospects ……………………………………………………………………………………….21

    Box 2: Five ways in which Nigeria can support inclusive growth …………………………………………………………29

    Box 3: The prospects for stable growth in Colombia ………………………………………………………………………….30

    Box 4: Turkey’s journey to maturity …………………………………………………………………………………………………32

    Box 5: Pitfalls on the path to prosperity – a discussion with Professor Marvin Zonis …………………………….37

4. Challenges for policymakers – achieving sustainable growth ….…………………………………………..39
    Box 6: Meeting the demographic challenge in Poland ………………………………………………………………………..44

    Box 7: Income inequality and what to do about it – an interview with Professor Branko Milanovic ………..47

    Box 8: How institutions underpin development – an interview with Professor Michael Jacobides …………51

5. Opportunities for business – winning in emerging markets………………………………………………….54
    Box 9: Walmart in Brazil …………………………………………………………………………………………………………………56

    Box 10: Kellogg’s in India ………………………………………………………………………………………………………………..58

    Box 11: General Motors in China ………………………………………………………………………………………………………59

6. Appendices …………………………………………………………………………………………………………………………………61

Key abbreviations

G7: group of advanced economies of Canada, France, Germany, Italy, Japan, the United Kingdom and the
United States

E7: group of emerging market economies of Brazil, China, India, Indonesia, Mexico, Russia and Turkey

GDP at PPP: gross domestic product at purchasing power parity adjusts for price level differences across
countries and provides a better measure of the volume of goods and services produced in an economy

GDP at MER: gross domestic product at market exchange rates provides a better measure of the value of
goods and services produced in an economy and converts a country’s GDP in national currencies to US$ based
on current market exchange rates

The long view: how will the global economic order change by 2050?
PwC                                                                                               Page 2 of 72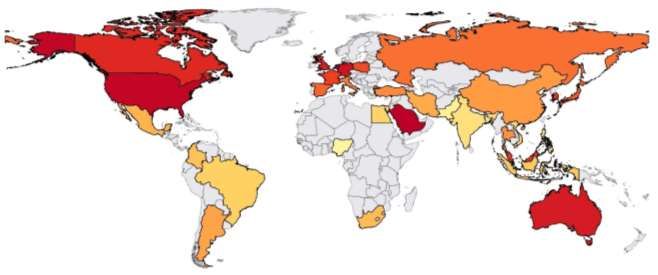
The World in 2050

Foreword
The long view: how will the global economic order change by 2050?
After a year of major political shocks with the Brexit vote and the election of President Trump, it might seem
brave to opine on economic prospects for 2017, let alone 2050.
However, I still think it is important to take a longer term view of global economic prospects that looks beyond
the short-term ups and downs of the economic and political cycle, which are indeed very difficult to forecast.
Instead our approach in this report, based on a rigorous modelling approach, focuses on the fundamental
drivers of growth: demographics and productivity, which in turn is driven by technological progress and
diffused through international trade and investment.
Such forces saw America progress through the 19th and early 20th centuries to become the largest economy in
the world despite a civil war, various other conflicts with foreign powers, three presidential assassinations, and
numerous economic and financial crises.
These forces also helped global economic growth to bounce back strongly from two world wars and a Great
Depression to reach record levels in the post-war decades. Looking ahead, we think they will see emerging
economies come to dominate the 21st century. By 2050 we project China will be the largest economy in the
world by a significant margin, while India could have edged past the US into second place and Indonesia have
risen to fourth place. The EU27’s share of global GDP could have fallen to below 10%. We also think the world
economy will more than double in size between now and 2050, far outstripping population growth.
I think this kind of long-term view, looking beyond short-term economic and political cycles, is particularly
useful for policymakers and businesses in areas like pensions, healthcare, energy and climate change, transport,
housing and other types of infrastructure investment.

Challenges for policymakers
Of course, we should not dismiss political shocks like Trump or Brexit to the extent they point to deeper
structural shifts, notably a populist backlash against globalisation, automation and the perceived impact of
these trends in increasing income inequality and weakening social cohesion.
These trends pose real policy challenges across the developed world and beyond and, as we discuss in Section 4
of this report, there is no silver bullet to address these concerns. They require determined efforts by
governments to boost the quality of education and training, and address perceived unfairness through well-
targeted fiscal policies. They also require real political leadership to resist calls for increased protectionism and
maintain momentum on longer term issues like climate change and global poverty reduction.

Opportunities for business
From a business perspective, there is also a need to look beyond short-term economic volatility in both
advanced and emerging economies and develop strategies that have the right balance of flexibility and patience.
As we discuss in Section 5 of the report, this requires a clear focus on identifying and building on core
capabilities, while remaining flexible enough to ride out short term political and economic storms of the kind
we have seen in both advanced and emerging economies in recent years.
Overall, though, I remain optimistic that governments and businesses can rise to these challenges and deliver
the continued increases in global living standards that we project in this report.

John Hawksworth
Chief Economist, PwC UK

The long view: how will the global economic order change by 2050?
PwC                                                                                                      Page 3 of 72

The World in 2050

   Emerging markets will dominate the                                        Vietnam, the Philippines and Nigeria could
   world’s top 10 economies in 2050 (GDP at                                  make the greatest moves up the rankings
   PPPs)                                                                     by 2050

                            2016            2050                                up 12 places                                                    2050

      China                    1                1                China         20
                                                                                    th               up 9 places

        US                     2                2                India                                  th                  up 8 places
                                                                                                   19
      India                    3                3                  US
                                                                                                                               th
                                                                                                                          14
      Japan                    4                4            Indonesia

    Germany                    5                5                Brazil

     Russia                    6                6               Russia

      Brazil                   7                7               Mexico

    Indonesia                  8                8               Japan            32
                                                                                     nd                      th                     nd
                                                                                                      28                    22                  2016
        UK                     9                9             Germany               Vietnam             Philippines            Nigeria

     France                   10               10                  UK
                                                                                    Average annual GDP growth rate, 2016-2050
                                                                                           5.1%                   4.3                    4.2%
                      E7 economies                    G7 economies                                                 %

  The US and Europe will steadily lose                                      Global economic power will shift to the E7
  ground to China and India                                                 economies

 Share of world GDP (PPPs) from 2016 to 2050…
                                                                              In…
                                                                                                                    were
          20%
                                                                15%
                                                                                     1995            E7              half
                                                                                                                  the size of
                                                                                                                                          G7
                                                                               By…                                   were
                                                                                                                  around the
          China
           18%                US
                                                                                      2015           E7             same                   G7
                             16%               EU27                                                                 size as
                                                15%
                                                                India
                                                                 7%           And in just
                                                                              25 years…
                                                                                                                    could be
                            12%
                                               9%
                                                                                         2040       E7              double
                                                                                                                   the size of
                                                                                                                                             G7

      2016        2050

                                                                                G7: US, UK, France, Germany, Japan, Canada and Italy
    Sources: IMF for 2016 estimates, PwC analysis for projections to 2050       E7: China, India, Indonesia, Brazil, Russia, Mexico and Turkey

The long view: how will the global economic order change by 2050?
PwC                                                                                                                                      Page 4 of 72
The World in 2050

    1. Summary: The world in 2050
 Key findings
    1.   We project that the world economy could more than double in size by 2050, assuming broadly growth-
         friendly policies (including no sustained long-term retreat into protectionism) and no major global
         civilisation-threatening catastrophes.

    2. Emerging markets will continue to be the growth engine of the global economy. By 2050, the E7
       economies could have increased their share of world GDP from around 35% to almost 50%. China could
       be the largest economy in the world, accounting for around 20% of world GDP in 2050, with India in
       second place and Indonesia in fourth place (based on GDP at PPPs).

    3. A number of other emerging markets will also take centre stage – Mexico could be larger than the UK
       and Germany by 2050 in PPP terms and six of the seven largest economies in the world could be
       emerging markets by that time.

    4. Meanwhile, the EU27 share of world GDP could be down to less than 10% by 2050, smaller than India.

    5.   We project Vietnam, India and Bangladesh to be three of the world’s fastest growing economies over
         this period. UK growth has the potential to outpace the average rate in the EU27 after the transitional
         impact of Brexit has passed, although we project the fastest growing large EU economy to be Poland.

    6. Today’s advanced economies will continue to have higher average incomes, but emerging economies
       should make good progress towards closing this gap by 2050. This will open up great opportunities for
       businesses prepared to make long-term investments in these markets. But this will require patience to
       ride out the storms we have seen recently in economies like, for example, Brazil, Nigeria and Turkey, all
       of which still have considerable long-term economic potential based on our analysis.

    7.   To realise this growth potential, emerging market governments need to implement structural reforms
         to improve macroeconomic stability, diversify their economies away from undue reliance on natural
         resources (where this is currently the case), and develop more effective political and legal institutions.

    8.

1.1 Our approach
In this report, we present our latest long-term economic growth projections, providing an update to our 2015
results. We project GDP to 2050 for 32 of the largest economies in the world, which together currently account
for around 85% of global GDP. We hope this analysis will be of interest to policymakers around the world,
businesses making long-term investments, academics, students and economic commentators. These long-term
growth projections will also feed into other PwC projects and reports.

Our analysis uses a robust long-term economic growth model from the academic literature that accounts in a
rigorous way for projected trends in demographics, capital investment, education levels and technological
progress to estimate potential long-term growth rates. We assume broadly growth-friendly (but not perfect)
policies and no major civilisation-threatening global catastrophes (e.g. nuclear war, asteroid collisions) over the
period to 2050. Full technical details of our methodology are contained in Appendix A.

We are aiming to identify broad long-term trends, abstracting from short-term economic and political cycles.
We are not claiming to be able to make precise forecasts of GDP in 2050, which is clearly not possible looking
that far ahead, but we do believe it is possible to trace out the broad shape of economic power shifts over this
period. We also look at the impact of a range of alternative assumptions on our long-term growth projections
(in Section 2.4 of the report).

The long view: how will the global economic order change by 2050?
PwC                                                                                                     Page 5 of 72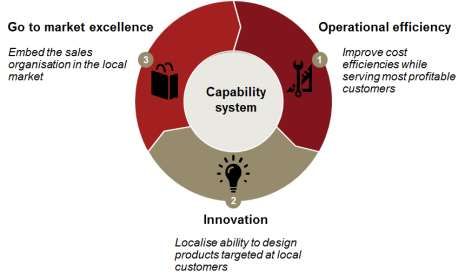
The World in 2050
To complement our modelling projections we also include:
commentaries on five emerging markets (China, Nigeria, Colombia, Turkey and Poland) from PwC
senior economists or partners in these countries;
interviews with three leading academics - Professor Marvin Zonis, Professor Branko Milanovic and
Professor Michael Jacobides – on the uncertainties around our projections, the challenge of income
inequality, the need for institutional reform and the implications of our analysis for business strategy;
and
summaries of a range of other PwC research and case study analysis to draw out the implications of the
long-term global economic trends we project for public policy and business.
1.2 GDP projections to 2050
Global economic growth will be driven by emerging market economies, which will gradually
increase their share of world GDP over time
We project that the world economy will double in size by 2042, growing at an annual average rate of around
2.6% between 2016 and 2050.
We expect this growth to be driven larely by emerging market and developing countries, with the E7 economies
of Brazil, China, India, Indonesia, Mexico, Russia and Turkey growing at an annual average rate of almost 3.5%
over the next 34 years, compared to just 1.6% for the advanced G7 nations of Canada, France, Germany, Italy,
Japan, the UK and the US.
We will continue to see the shift in global economic power away from established advanced economies,
especially those in Europe, towards emerging economies in Asia and elsewhere. As shown in Figure 1, the E7
could comprise almost 50% of world GDP by 2050, while the G7’s share declines to only just over 20%.
Figure 1: Projected change in shares of world GDP from 2016 to 2050
2016 G7 E7 Rest of the world
2050 G7 E7 Rest of the world
0% 10% 20% 30% 40% 50% 60% 70% 80% 90% 100%
Share of world GDP at PPPs
Sources: IMF for 2016 estimate, PwC projections for 2050
In fact, China has already overtaken the US to become the world’s largest economy in purchasing power parity
(PPP) terms1, while India currently stands in third place and is projected to overtake the US by 2040 in PPP
terms. By 2050, France will no longer be among the world’s ten largest economies on this basis, with the UK
1PPP estimates of GDP adjust for price level differences across countries, providing a better measure of the volume of goods
and services produced by an economy as compared to GDP at current market exchange rates, which is a measure of value.
The long view: how will the global economic order change by 2050?
PwC Page 6 of 72The World in 2050
falling to 10th place, while Indonesia could rise to 4th place by 2050 (see Figure 2). By 2050, six of the seven
largest economies in the world could be today’s emerging economies in PPP terms according to our projections.
Figure 2: Projected GDP rankings (at PPPs)
2016 2030 2050
China, 1 China, 1
United States, 2 India, 2
India, 3 United States, 3
Japan, 4 Indonesia, 4
Germany, 5 Brazil, 5
Russia, 6 Russia, 6
Brazil, 7 Mexico, 7
Indonesia, 8 Japan, 8
United Kingdom, 9 Germany, 9
France, 10 United Kingdom, 10
Mexico, 11 Turkey, 11
Italy, 12 France, 12
South Korea, 13 Saudi Arabia, 13
Turkey, 14 Nigeria, 14
Saudi Arabia, 15 Egypt, 15
Spain, 16 Pakistan, 16
Canada, 17 Iran, 17
Iran, 18 South Korea, 18
Australia, 19 Philippines, 19
Thailand, 20 Vietnam, 20
Egypt, 21 Italy, 21
Nigeria, 22 Canada, 22
Poland, 23 Bangladesh, 23
Pakistan, 24 Malaysia, 24
Argentina, 25 Thailand, 25
Netherlands, 26 Spain, 26
Malaysia, 27 South Africa, 27
Philippines, 28 Australia, 28
South Africa, 29 Argentina, 29
Colombia, 30 Poland, 30
Bangladesh, 31 Colombia, 31
Vietnam, 32 Netherlands, 32
Sources: IMF for 2016 estimates (updated for Turkey due to recent major statistical revisions), PwC projections for 2030 and 2050
The long view: how will the global economic order change by 2050?
PwC Page 7 of 72The World in 2050
When looking at GDP measured at market exchange rates (MERs)2, we do not see quite such a radical shift in
global economic power, reflecting the lower average price levels in emerging economies. But China still emerges
as the largest economy in the world before 2030 and India is clearly the third largest in the world by 2050, so
there is still a considerable shift in economic power towards Asia in particular whichever measure we use.
We will see a number of new emerging markets taking centre stage
By 2050, emerging economies such as Mexico and Indonesia are likely to be larger than the UK and France,
while Pakistan and Egypt could overtake Italy and Canada (on a PPP basis). In terms of growth, Vietnam, India
and Bangladesh could be the fastest growing economies over the period to 2050, averaging growth of around
5% a year. Figure 3 shows the projected average annual GDP growth rate over the next 34 years for all of the 32
countries we modelled. Total GDP growth is also broken down into how much is attributable to population
growth and how much to real GDP per capita growth.
Figure 3: Projected average real GDP growth p.a., 2016-2050
6%
5%
Average real GDP growth p.a. (2016-2050)
4%
3%
2%
1%
0%
(1%)
Average Pop Growth p.a % Average Real Growth per capita p.a %
Average GDP growth p.a. (in domestic currency)
Source: PwC analysis
Nigeria has the potential to be the fastest growing large African economy and could move up the GDP rankings
from 22nd place to 14th by 2050. But Nigeria will only realise this potential if it can diversify its economy away
from oil and strengthen its institutions and infrastructure. Colombia and Poland also exhibit great potential,
and are projected to be the fastest growing large economies in their respective regions, Latin America and the
EU (though Turkey is projected to grow faster within the wider European area).
As Figure 3 shows, growth in many emerging economies will be supported by relatively fast-growing
populations, boosting domestic demand and the size of the workforce. This will, however, need to be
complemented with investment in education and an improvement in macroeconomic fundamentals to ensure
there are sufficient jobs for growing numbers of young people in these countries.
2 The difference between GDP at PPP and MER estimates reflects that price levels in lower income countries are lower than
that in advanced economies, meaning the value of their goods and services produced results in a lower GDP estimate.
The long view: how will the global economic order change by 2050?
PwC Page 8 of 72The World in 2050
Today’s advanced economies will continue to have higher average incomes, but by 2050
emerging economies should make good progress towards closing this gap
With the exception of Italy, all of the G7 continue to sit above the E7 in our rankings of GDP per capita in 2050.
China achieves a middling rank by 2050, while India remains near the bottom, as illustrated in Map 1. India’s
GDP per capita trajectory over the next 34 years is markedly different to its overall GDP progression,
illustrating that while strong population growth can be a key driver of GDP growth, it can also make it more
challenging to boost average income levels.
Map 1: Projected real GDP per capita in 2050
Lower GDP per capita Higher GDP per capita
Source: PwC analysis
The gap is closing, however. In 2016, US GDP per capita was around four times the size of China’s and almost
nine times that of India’s. By 2050, these gaps are projected to narrow to around double China’s and around
three times India’s, demonstrating long-term income convergence.
The world economy will slow down over time, with a marked moderation in growth rates after
2020
We project annual global economic growth to average around 3.5% over the next 4 years to 2020, slowing down
to 2.7% for 2021-2030, 2.5% for the decade after that, and 2.4% for 2041-2050. This will occur as many
advanced economies experience a marked decline in their working-age populations. At the same time, emerging
market growth rates will moderate as these economies mature, which is consistent with academic research3 on
the tendency for growth rates to ‘regress to the mean’ in the long-run.
This is illustrated in Figure 4, with the growth rates of the largest emerging economies moderating over time to
converge to around 2% in the very long run in line with the major advanced economies. India and Nigeria are
the two of the main exceptions to this, with growth remaining higher for longer due to their lower initial
average income levels providing greater scope for catch up growth.
3 For example, see the analysis by Pritchett and Summers (2014) here: http://www.nber.org/papers/w20573
The long view: how will the global economic order change by 2050?
PwC Page 9 of 72The World in 2050
Figure 4: Projected growth profiles for larger economies
8%
Average annual growth in GDP in PPPs
7%
6%
5%
4%
3%
2%
1%
0%
Brazil Russia India China US UK EU27 World
2016 - 2020 2021 - 2030 2031 - 2040 2041 - 2050
Source: PwC analysis
1.3 Challenges for policymakers in achieving sustainable
long term growth
To realise this economic potential, emerging market governments need to implement structural
reforms to improve their macroeconomic fundamentals and institutions
The report details the great potential that emerging economies have to grow and prosper over the coming
decades. But to realise this potential, they must undertake sustained and effective investment in education,
infrastructure and technology. Adverse global conditions and a falling oil price over recent years have
highlighted the importance of diversified economies for long-term sustainable growth. Underlying all of this is
the need to develop their political, economic, legal and social institutions to generate incentives for innovation
and entrepreneurship, creating secure and reliable economies in which to do business.
Looking forward, the global economy faces a number of challenges to prosperous economic growth. Structural
developments, such as ageing populations and climate change, require forward-thinking policy which equips
the workforce to continue to make societal contributions later on in life and promotes sustainable development.
Falling global trade growth, rising inequality and increasing global uncertainties are intensifying the need to
create diversified economies which create opportunities for everyone in a broad variety of industries.
1.4 Opportunities for business – winning in emerging
markets
Businesses need to adopt flexible, dynamic and patient strategies to navigate these rapidly
evolving and maturing emerging markets
Emerging market development will create many opportunities for business. These will arise as these economies
progress into new industries, engage with world markets and as their populations – which will also be more
youthful on average than in advanced nations – get richer. As these emerging countries develop their
institutions, fostering social stability and strengthening their macroeconomic fundamentals, they will become
more attractive places to do business and live, attracting investment and talent.
The long view: how will the global economic order change by 2050?
PwC Page 10 of 72The World in 2050 These economies are rapidly evolving and often relatively volatile, however, so companies will need dynamic and flexible operating strategies to succeed in them. Businesses should be prepared to adjust their brand and market positions to suit differing and often more nuanced local preferences. An in-depth understanding of the local market and consumers will be crucial, which will often involve working with local partners. This report contains several examples of how businesses (e.g. Kellogg’s in India, Walmart in Brazil and General Motors in China) have overcome challenges and ultimately been successful in combining their global best practices with flexible adaptation to local business and consumer environments. Businesses also need to be patient enough to ride out the short term economic and political storms that will inevitably occur from time to time in these emerging markets as they move towards maturity. But the numbers in our report make clear that failure to engage with these markets means missing out on the bulk of the economic growth we expect to see in the world economy between now and 2050. The long view: how will the global economic order change by 2050? PwC Page 11 of 72
The World in 2050
2. Introduction
2.1 Background to our World in 2050 reports
Our first ‘World in 2050’ report was published in March 2006, featuring projections for potential GDP growth
for 17 leading economies over the period to 2050. Our initial model covered:
the 10 largest advanced economies: the G7 (US, Canada, UK, France, Germany, Italy and Japan),
Australia, Spain and South Korea; and
the seven largest emerging economies, which we referred to collectively as the E7 (China, India, Brazil,
Indonesia, Mexico, Russia and Turkey).
We subsequently updated our projections in March 2008, January 2011, January 2013 and February 2015.
With each new edition up to 2015, more countries were added to our model, which now also covers:
Argentina, Saudi Arabia and South Africa to complete coverage of the G20;
the Netherlands, as a key European advanced economy;
Poland and Malaysia, as two fast-growing medium-sized countries; and
Bangladesh, Colombia, Egypt, Iran, Nigeria, Pakistan, the Philippines, Thailand, and Vietnam as
additional relatively large emerging markets.
As such, our World in 2050 model now includes 32 countries, together accounting for around 85% of world
GDP. Our analysis suggests that this group of countries should have a high probability of including at least the
25 largest economies in the world in 2050. Given the considerable uncertainties that come with any such long-
term projections, we cannot say, however, that these will necessarily be the largest 32 economies in the world in
2050.
2.2 What have been the drivers of historical emerging
market growth?
Over the past few decades we have seen the beginning of a radical shift in global economic power towards many
leading emerging markets. Across emerging and developing counties, as defined by the IMF, growth has
averaged 5.8% per annum since 2000, considerably higher than the 1.8% seen by advanced nations. As
background to our forward projections, we conducted some additional analysis for this edition of our World in
2050 report into the drivers of emerging and developing economy growth over the past fifteen years4.
We used a robust econometric growth model, based on a review of the academic literature, in which initial GDP
per capita, investment, government debt and education levels were the key potential explanatory variables for
real GDP per capita growth. We then augmented this with primary commodity exports as a percentage of GDP,
as this is a key sector for many emerging markets.
As Table 1 below shows, we found that all variables considered had a statistically significant impact on growth,
explaining around 40% of the variance in real GDP per capita growth across 114 emerging and developing
economies in 2000-155 (see Appendix A for further technical details of these results).
4 This was initially published as a PwC Economics in Business blog article by Hannah Audino on ‘What drives emerging
markets growth?’: http://pwc.blogs.com/economics_in_business/2016/11/what-drives-emerging-markets-growth.html
5 This is a relatively good fit for a simple cross-sectional regression of this kind.
The long view: how will the global economic order change by 2050?
PwC Page 12 of 72The World in 2050
Table 1: Results of our econometric analysis into the drivers of emerging market GDP per
capita growth, 2000-2015
Variable What impact does the variable Is the impact statistically
have on GDP growth? significant?
Initial GDP per capita in 2000 Negative Highly significant
Average investment as a % of GDP Positive Highly significant
(2000-15)
Average secondary school enrolment, % Positive Highly significant
(1995-2000)
Average debt as a % of GDP (2000-15) Negative Highly significant
Average primary commodity exports as Positive Significant
a % of GDP (2000-15)
Source: PwC analysis based on data from IMF, World Bank, UNCTAD
Our key results are as follows:
Initial GDP per capita: we find a significant negative relationship between initial average income
levels in an economy and subsequent GDP per capita growth; this reflects the fact that, other things
being equal, a low initial level of economic development provides more opportunities for catch-up with
higher income countries by making use of their technologies and ideas.
Investment: this is a key determinant of economic growth, with a one percentage point increase in
investment being associated, on average, with a 0.15 percentage point increase in annual average real
GDP per capita growth. Investment can raise economic growth by supporting infrastructure
development in key areas like energy and transport, boosting technological progress and so increasing
productivity.
Education: a one percentage point increase in secondary school enrolment is associated with a 0.05
percentage point rise in real GDP per capita growth. While this is a smaller impact than for investment,
the benefits from education are more likely to accrue over longer periods of time as better educated
school leavers enter the workforce.
Government debt: we find a negative relationship between government debt and growth, but the
impact is of a relatively smaller magnitude compared to the other variables in the model. High levels of
debt can make governments vulnerable to financial and currency crises, particularly if these involve
heavy borrowing from overseas, and so tend to be associated with greater macroeconomic instability,
higher inflation and slower long-term growth on average.
Commodity exports: strong demand and many years of high commodity prices for most of the past
15 years had a positive impact on growth in emerging markets, but the magnitude of this effect was
relatively small and falling oil prices in recent years have reversed the beneficial impact of commodity
exports on emerging market growth. Therefore, we do not include this factor in our long run model.
These results reinfoce the modelling approach we have taken in this World in 2050 report, providing
statistical support for the key variables we have used to project long-run economic growth such as initial
productivity levels, capital investment and education as described further in the following section.
The long view: how will the global economic order change by 2050?
PwC Page 13 of 72The World in 2050
2.3 Our modelling approach
We used the International Monetary Fund’s World Economic Outlook (October 2016) estimates for GDP in
2016 as the starting point for our projections. We then used our long-term economic model to estimate trend
growth rates to 2050. These longer term trend growth estimates, which abstract from shorter term cyclical
trends, are driven by the following key factors:
Growth in the working age population and, hence, the potential workforce (based on the latest UN
population projections);
Increases in human capital, which we proxy here by average education levels across the adult population;
Growth in the physical capital stock, which is driven by capital investment net of depreciation; and
Total factor productivity (TFP) growth, which is driven by technological progress and catching up by lower
income countries with richer ones by making use of their technologies and processes.
Our model is broadly consistent with the results of our econometric model on the drivers of emerging market
growth discussed in Section 2.2, capturing investment and education as two of the primary determinants of
economic growth. Government debt is one of the variables used to inform judgments on TFP catch-up rates for
emerging economies.
Emerging economies have stronger potential growth than the current advanced economies on most of these
measures, although it should be stressed that this assumes they continue to follow broadly growth-friendly
policies. In this sense, the projections are of potential future GDP growth if such policies are followed, rather
than predictions of what will actually happen, bearing in mind that not all of these countries may be able to
sustain such policies in the long-run in practice.
There are, of course, also many other uncertainties surrounding these long-term growth projections, so more
attention should be paid to the broad trends indicated rather than the precise numbers quoted in this report.
We consider these uncertainties further in the scenario analysis in Section 3.4 of this report.
The broad conclusions we reach on the shift in global economic power from the G7 to the E7 economies should,
however, be robust to these uncertainties, provided that there are no catastrophic shocks (e.g. global nuclear
war, asteroid collisions, extreme global climate change etc.) that derail the overall global economic development
process.
We provide more details of our modelling approach and key assumptions in Appendix A at the end of this
report.
2.4 What has changed since our February 2015 report?
We have made two main changes to our model since 2015:
1. We have updated all historical data in the model so that the base year is now 2016, rather than 2014,
and we also use the latest update of the UN’s population projections6. Our detailed assumptions on
future trends in key input variables has also been revised to reflect actual trends over the past two years
and the latest thinking of PwC and external experts.
2. We have reduced the assumed US trend labour productivity growth rate from 2% to 1.5% per annum,
reflecting accumulating evidence that potential growth has fallen in the US. This can be attributed to
factors including the US’s ageing population, a plateau of educational attainment, and rising household
and government deficits generating financial instability7. These factors are also related to the concept of
6https://esa.un.org/unpd/wpp/
7For further discussion on the ‘six headwinds’ causing faltering productivity growth in the US, identified by Professor
Robert Gordon see: http://www.cepr.org/sites/default/files/policy_insights/PolicyInsight63.pdf
The long view: how will the global economic order change by 2050?
PwC Page 14 of 72The World in 2050
secular stagnation8, in which an increasing propensity to save and a decreasing propensity to invest
dampen demand, so impeding growth in the long run.
Despite these changes, the broad story of shifting global economic power that we reported in February 2015
(and indeed in earlier World in 2050 reports back to 2006) remains robust. China, India and other leading
emerging markets are projected to move steadily up our rankings of the largest economies in the world over the
period to 2050. But the precise projections have changed to reflect the latest available data.
2.5 Structure of this report
The remainder of this report is structured as follows:
Section 3: outlines the key results of our model, focusing on projected GDP levels, growth rates and
average income trends to 2050. It also includes analysis of three alternative downside scenarios to
capture some of the uncertainties around our main scenario projections, which are also discussed
further in an interview with Professor Marvin Zonis. The quantitative analysis in this section is
complemented by commentaries on long-term prospects for their economies by senior PwC economists
and business experts in China, Nigeria, Colombia and Turkey.
Section 4: discusses five key challenges facing policymakers seeking to achieve sustainable long-term
growth: falling global trade growth, demographic change, climate change, rising inequality and growing
global uncertainties. The discussion here includes a commentary by our senior economist in Poland on
how long-term prospects there are being affected by demographic trends and other factors, and also an
interview with Professor Branko Milanovic, a leading expert on global income inequality trends. This
wide-ranging section also examines the fundamental role of well-developed and stable institutions for
sustainable economic and social development, including an interview with Professor Michael Jacobides
that discusses both these issues and some of the implications for business strategy that we consider in
more detail in the next section.
Section 5: considers how businesses can make the most of the opportunities from the growth of
emerging markets, drawing on recent research by the PwC Growth Markets Centre and the practical
experience and insights of Strategy&, PwC’s strategy consulting practice. This section examines the
ways in which emerging markets are different to operate and conduct business in than advanced
economies and discusses, with the help of three case studies, how businesses can adopt flexible but
patient strategies in order to navigate these markets most effectively as they develop and mature.
Appendix A: sets out full technical details of our modelling approach to project GDP to 2050, as well
as the results of our econometric analysis of the drivers of historical GDP growth.
Appendix B: includes more detailed results of our projections using GDP at market exchange rates.
8This concept has received recent attention from economists, including Larry Summers:
http://larrysummers.com/2016/02/17/the-age-of-secular-stagnation/
The long view: how will the global economic order change by 2050?
PwC Page 15 of 72The World in 2050
3. Global growth projections to
2050
Key findings
1. Growth in the E7 will continue to outpace that of the G7 with annual average growth of around
3.5% between 2016 and 2050, while the G7’s growth will be slower at around 1.6% per annum.
2. Europe will steadily lose ground relative to the Asian giants. The EU’s share of world GDP (at PPPs)
is expected to fall from around 15% to just 9%, while China’s rises to around 20% and India’s to
15%. The US’s share of world GDP will also fall, potentially to around 12% by 2050.
3. By 2050, India could overtake the US to be the world’s second largest economy in GDP at PPP
terms, and Indonesia could be the world’s fourth largest economy. Six of the seven largest
economies could be today’s emerging markets by 2050.
4. Vietnam, India and Bangladesh could achieve annual average growth of around 5% over the next 34
years. Nigeria could achieve growth of around 4% per annum if it can diversify and reform its
economy.
5. Given economic growth is subject to many economic, political, social and environmental
uncertainties, we also analyse some of the risks to growth and present three possible downside
scenarios
3.1 Relative size of leading economies
3.1.1 Global economic power shifts from G7 to E7
In 1991, the E7 were 35% the size of the G7 in PPP terms. Twenty-five years later, these emerging economies
had overtaken the G7. Looking forward to another 25 years, the E7 could be double the size of the G7 by 2040,
marking a significant shift in global economic power.
GDP at PPP exchange rates is a measure of the goods and services produced in a given economy, after
correcting for price level variations across countries. When looking at GDP at market exchange rates, the speed
of change is slightly more muted, as shown by Figure 5. In MER terms, the E7 have yet to overtake the G7 and
were just over half the size of the G7 in 2016, reflecting the much lower average price levels in emerging
economies than advanced economies at current MERs. In comparison to GDP at PPPs, we project that the E7
will be around one and a half times the size of the G7 by 2050, overtaking it by 2030. The difference between
these two measures of GDP are explained in more detail below and in Appendices A and B.
The long view: how will the global economic order change by 2050?
PwC Page 16 of 72The World in 2050
Figure 5: Relative size of G7 and E7 economies, 2016 and 2050
160,000
GDP in PPPs (constant, 2016 US$ bn)
140,000
120,000
100,000
80,000
60,000
40,000
20,000
0
2016 PPP 2050 PPP 2016 MER 2050 MER
G7 E7
Sources: IMF for 2016 estimates, PwC projections for 2050
The E7 economies will remain the driving force behind global economic growth, continuing to exhibit strong
GDP growth rates of around 3.5% p.a. between 2016 and 2050. Growth should continue at the relatively high
rates of over 5% we have seen over the past decade until 2020, at which point they will taper off progressively to
around 3% by 2050. Projected growth rates for the E7 and other economies are discussed in more detail in
Section 3.2 below.
In comparison, we project the G7 economies to grow at a markedly slower average rate of around 1.6% per
annum during the period 2016-2050, as shown in Figure 6. This is slightly slower than we had projected in our
2015 report, which partly reflects the fact that the recovery over the last two years has not been as strong as
anticipated, but is primarily due to a more general reassessment of US trend productivity growth as discussed
in Section 2.4 above. As the US sets the global technological frontier in our model, this also translates to slower
growth in other economies.
Figure 6: Growth paths of the E7 and G7 economies in PPP terms
160,000
140,000
E7
GDP in PPPs (constant, 2016 US$ bn)
120,000
100,000
80,000
G7
60,000
40,000
20,000
0
2016 2018 2020 2022 2024 2026 2028 2030 2032 2034 2036 2038 2040 2042 2044 2046 2048 2050
Source: PwC analysis
The long view: how will the global economic order change by 2050?
PwC Page 17 of 72The World in 2050
For the G7, its growth path remains largely unchanged when looking at GDP in MER terms. But Figure 7 shows
the rather different projected growth trajectory of the E7 economies for GDP at MERs. On this basis, the E7
have yet to overtake the G7, doing so by around 2030 on our projections.
Figure 7: Growth paths of the E7 and G7 economies in MER terms
120,000
E7
100,000
GDP in MERs (constant, 2016 US$ bn)
80,000
60,000
G7
40,000
20,000
0
2016 2018 2020 2022 2024 2026 2028 2030 2032 2034 2036 2038 2040 2042 2044 2046 2048 2050
Source: PwC analysis
Emerging markets are much larger using PPPs than market exchange rates
As noted above, the difference between the PPP and MER estimates reflects the fact that the price levels in the
E7 are, on average, still well below G7 levels when they are compared using current MERs. In the long-run, as
emerging markets develop, their prices will increase towards the levels seen in advanced countries due to some
combination of nominal exchange rate appreciation and/or higher price inflation. Higher prices will cause a
long-run real currency appreciation for these economies, resulting in a convergence of GDP at PPPs and MERs.
We have seen this convergence happen in the past with fast-growing economies such as Japan in the 1960s-
1980s and South Korea in the 1970s-1990s.
We have fed this effect into our model through an econometric equation, which has been estimated based on
past data. In our model, GDP at MERs converges towards GDP at PPP, but this is a very gradual process and
full price level convergence will not be complete by 2050 in most emerging markets. Currently, the E7’s GDP at
MERs is around 45% of the value of its GDP at PPPs (both in US dollar terms). By 2050, the GDP of the E7 at
MERs will be around three-quarters of its PPP value. However, these real exchange rate projections are highly
uncertain, so we focus on our results for GDP in PPP terms for the rest of this section. Our results for GDP at
MERs are discussed in more detail in Appendix B.
3.1.2 Projected shifts in global power by 2050
The G7 and E7 economic groups currently account for similar shares of world GDP, at 31% and 37% respectively
in PPP terms. Over the next few decades, the G7’s share will fall to around 20% of world GDP, while the E7 will
increase their share to comprise almost 50% of world GDP by 2050, continuing the shifts in global power we
have seen in recent decades away from Europe and towards Asia, as illustrated in Map 2.
The long view: how will the global economic order change by 2050?
PwC Page 18 of 72The World in 2050
Map 2: Projected GDP in PPPs in 2050
Lower GDP in PPPs Higher GDP in PPPs
Source: PwC analysis
China and India could be the two largest economies in the world by 2050
This shift of global economic power towards the emerging economies will largely be driven by China and India.
China is already the largest economy in the world in PPP terms, having overtaken the US in 2014. It is not yet
the largest economy in GDP at MERs, but we project that China should overtake the US to take first place on
this basis before 2030 (see Figure 8). This is subject to our assumptions on the degree of convergence of China’s
market exchange rate with the PPP exchange rate, which are plausible but nonetheless subject to uncertainty.
Figure 8: Projected GDP growth paths of China and the US
70,000
United States China, in domestic currency/PPP China, in USD/MER
60,000
Projected GDP (US$ bn)
50,000
40,000
30,000
20,000
10,000
0
2016 2018 2020 2022 2024 2026 2028 2030 2032 2034 2036 2038 2040 2042 2044 2046 2048 2050
Source: PwC analysis
China’s current share of world GDP at PPPs stands at almost 18%, just above the US share of around 16% (see
Figure 10). This is projected to increase to a peak of around 21% in 2030, before falling slightly t0 20% by 2050.
Further details of our views on China are provided by our chief economist there, Allan Zhang in Box 1 below. In
comparison, the US’s share of global GDP is projected to fall gradually but steadily to just below 12% in 2050.
The long view: how will the global economic order change by 2050?
PwC Page 19 of 72The World in 2050
Figure 9: Relative GDP at PPPs and MERs as a % of US levels in 2050
180%
GDP in PPPs GDP in MERs
GDP as a % of US level in 2050
160%
140%
120%
100%
80%
60%
40%
20%
0%
MEX
JPN
NGA
MYS
ITA
COL
IND
IDN
TUR
IRN
USA
BRA
ZAF
FRA
PHL
VNM
THA
ESP
AUS
ARG
NLD
DEU
SAU
PAK
CAN
BGD
CHN
GBR
KOR
POL
RUS
EGY
Source: PwC analysis
India currently comprises 7% of world GDP at PPPs, which we project to rise steadily to over 15% by 2050. This
is a remarkable increase of 8 percentage points, gaining the most ground of any of the countries we modelled.
Our model indicates that India has the potential to overtake the US as the second largest economy in the world
by 2040 in GDP at PPPs. Looking at GDP in MERs, India is unlikely to overtake the US in the rankings and, as
shown by Figure 9, there remains a relatively large difference between India’s GDP at PPPs and MERs even in
2050 because India’s price level is still likely to be well below advanced economy levels. This is reflected in its
relatively low income per capita levels and is discussed further in Section 3.3 below.
Europe set to steadily lose ground relative to the Asian giants
The rise of China and India will also reduce the share of world GDP accounted for by Europe, with India
projected to be larger than the EU279 by 2035. As a result, the EU’s share of the world economy (at PPPs) is
projected to fall steadily from almost 15% to 9% by 2050. While the exact extent and timing of these shifts is
subject to considerable uncertainty, the general direction of change is clear.
Figure 10: Share of world GDP in PPP terms for the ‘Big 4’ economies
25% United States China India EU27
Projected share of world GDP in PPPs
20%
15%
10%
5%
0%
2016 2018 2020 2022 2024 2026 2028 2030 2032 2034 2036 2038 2040 2042 2044 2046 2048 2050
Source: PwC analysis
9Unless otherwise stated, ‘EU’ in this report refers to the EU27 excluding the UK, since we assume the UK will leave the EU
before 2020, which is early on in our projection period.
The long view: how will the global economic order change by 2050?
PwC Page 20 of 72The World in 2050
Box 1: China's long-term economic growth prospects
China is currently undergoing a transition from an export- and investment-driven economy to one that is
consumption and services oriented.
Nonetheless, fixed investment remains a key driver of China’s economic growth for the moment. In 2015,
fixed investment steadily rose to a new high of 38 trillion yuan (US$5.7 trillion), accounting for around 50% of
total GDP, thanks to the government’s strong push for infrastructure investment. This trend is likely to
continue in the coming years as urbanisation moves ahead and new government initiatives are rolled out, such
as the Belt and Road, Beijing-Tianjin-Hebei city cluster, Yangtze River Economic Belt and International
Industrial Capacity Cooperation initiatives. Investment is also a powerful tool to help maintain an average
annual GDP growth rate of around 6.5% in order to achieve the goal of doubling GDP and GDP per capita by
2020 (relative to 2010) as set out in the 13th Five-Year Plan.
Going forward, the key challenges for investment are twofold: diminished marginal returns and low levels of
private investment, which accounts for over 60% of total investment. In the first three quarters of 2016,
private investment grew by only 2.5%, as compared to 21% for the state sector, due to lack to business
confidence. The government will need to make sure that future funds will flow into productive projects instead
of the “zombie enterprises”.
Meanwhile, exports have lost steam, declining by 7.5% year-on-year, and imports contracted by 8.2% in the
first three quarters of 2016. Total imports and exports are expected to contract further in the near future due
to slower global economic growth and sluggish demand.
In contrast, the services sector has maintained its strong growth momentum, rising to 52.8% of GDP in the
third quarter of 2016, while consumption remained robust, contributing 71% to GDP growth, which is 13%
higher than a year ago. By 2030, services are expected to rise further to around 70% of GDP and China’s rising
middle-class could generate a consumption market of US$6 trillion, the largest in the world.
Meanwhile, China’s remains one of the most attractive destinations for foreign direct investment, which rose
from US$110bn in 2010 to US$136bn in 2015, providing valuable technologies and management skills to
nurture China’s modern industries. As China moves up the value chain, more and more Chinese companies
choose to directly acquire foreign brands, technologies and market networks. China’s outbound investment
shot up from US$75bn in 2011 to US$150bn in 2015, making China a net global investor (see chart). These
two-way investment flows will help improve China’s productivity, which is currently only around 20% of
average OECD levels, thus providing further impetus to its future economic growth.
Figure 11: China's FDI vs outbound investment
1600
1400
Investment (US$ 100 milion)
1200
1000
800
600
400
200
0
2006 2007 2008 2009 2010 2011 2012 2013 2014 2015 2016
(Sep)
FDI Outbound Investment
Source: China National Bureau of Statistics
The long view: how will the global economic order change by 2050?
PwC Page 21 of 72The World in 2050
However, demographic changes pose a severe challenge to China’s long-term growth. According to the
National Bureau of Statistics, China’s working-age population between the ages of 16 and 59 has declined for
three straight years since 2012, with the over 60 population reaching 222 million in 2015, accounting for
around 16% of the overall population. The total workforce is predicted to decline to about 700 million people
by 2050, when one in three people in China will be aged over 65. The “two children” policy came too late to
make much difference to this trend. The ageing society and shrinking working population will push up labour
costs significantly and could undermine China’s competitiveness and economic vitality unless offset by strong
technology-driven productivity gains.
Rising bad debt levels represent another key risk factor. China’s total debt is believed to be around 280% of
GDP, with corporate debt rising quickly to 160% of GDP, the highest level among the major world economies.
Non-performing loans of the banking sector, though officially standing at less than 2% in 2016, could be much
bigger if judged by international accounting standards.
China’s ongoing supply-side structural reform will play a critical role in nurturing the long-term growth
potential and saving the country from falling into the middle-income trap. Streamlining regulation, lowering
business costs, creating a pro-innovation environment and developing strategic industries and the services
sector are important measures in unleashing the vitality of the private sector and boosting growth. Reducing
inventories of residential properties will be vital in avoiding a Japanese-style housing bubble. Yet reducing
industrial overcapacity will have a knock-on effect on short-term GDP growth.
Looking ahead, China still has great potential for growth. Its urbanisation process is still at a relatively early
stage, and its services sector has a lot of scope to catch up with economies like the US in terms of quality,
sophistication and business range, in particular as regards producer services such as logistics, information,
financing and commercial services. Reform of state-owned enterprises, if properly handled, could shatter
monopolies and create new business opportunities worth trillions of dollars.
To a large extent, China’s success will depend on how the government enforces the principle of “letting market
forces play a decisive role in resource allocation” as adopted by the 18th Party Congress. So long as the reform
agenda progresses further, China is likely to forge ahead to become the world’s largest economy before 2030
as our projections suggest, though growing at a relatively slower rate in the long-run than in recent decades.
Allan Zhang
Chief Economist, PwC China/Hong Kong
E: allan.zhang@cn.pwc.com
Allan has been working at PwC UK and PwC China for 18 years and is a seasoned commentator on the Chinese
economy.
The long view: how will the global economic order change by 2050?
PwC Page 22 of 72The World in 2050
Indonesia could be the fourth largest economy in the world by 2050
Looking beyond the top three countries, we see a marked movement of emerging economies up the rankings
into the top 10, with a corresponding fall in the rankings of today’s advanced economies. With the exception of
Turkey, the E7 economies will dominate the top 7 places, with Indonesia, Brazil, Russia and Mexico taking 4th to
7th places in 2050. Table 2 shows how the rankings of GDP at PPPs changes from 2016 to 2030 and 2050.
Table 2: Projected rankings of economies based on GDP at PPPs (in constant 2016 $bn)
2016 rankings 2030 rankings 2050 rankings
GDP PPP
rankings Projected Projected
Country GDP at PPP Country Country
GDP at PPP GDP at PPP
1 China 21269 China 38008 China 58499
2 United States 18562 United States 23475 India 44128
3 India 8721 India 19511 United States 34102
4 Japan 4932 Japan 5606 Indonesia 10502
5 Germany 3979 Indonesia 5424 Brazil 7540
6 Russia 3745 Russia 4736 Russia 7131
7 Brazil 3135 Germany 4707 Mexico 6863
8 Indonesia 3028 Brazil 4439 Japan 6779
9 United Kingdom 2788 Mexico 3661 Germany 6138
10 France 2737 United Kingdom 3638 United Kingdom 5369
11 Mexico 2307 France 3377 Turkey 5184
12 Italy 2221 Turkey 2996 France 4705
13 South Korea 1929 Saudi Arabia 2755 Saudi Arabia 4694
14 Turkey 1906 South Korea 2651 Nigeria 4348
15 Saudi Arabia 1731 Italy 2541 Egypt 4333
16 Spain 1690 Iran 2354 Pakistan 4236
17 Canada 1674 Spain 2159 Iran 3900
18 Iran 1459 Canada 2141 South Korea 3539
19 Australia 1189 Egypt 2049 Philippines 3334
20 Thailand 1161 Pakistan 1868 Vietnam 3176
21 Egypt 1105 Nigeria 1794 Italy 3115
22 Nigeria 1089 Thailand 1732 Canada 3100
23 Poland 1052 Australia 1663 Bangladesh 3064
24 Pakistan 988 Philippines 1615 Malaysia 2815
25 Argentina 879 Malaysia 1506 Thailand 2782
26 Netherlands 866 Poland 1505 Spain 2732
27 Malaysia 864 Argentina 1342 South Africa 2570
28 Philippines 802 Bangladesh 1324 Australia 2564
29 South Africa 736 Vietnam 1303 Argentina 2365
30 Colombia 690 South Africa 1148 Poland 2103
31 Bangladesh 628 Colombia 1111 Colombia 2074
32 Vietnam 595 Netherlands 1080 Netherlands 1496
Sources: IMF for 2016 estimates, PwC projections for 2030 and 2050 (Note that Turkish GDP has been revised significantly upwards
from the IMF estimate for 2016 due to revisions made subsequently by the Turkish national statistical office)
The long view: how will the global economic order change by 2050?
PwC Page 23 of 72You can also read