City Logistics landscape in the era of on-demand economy
←
→
Page content transcription
If your browser does not render page correctly, please read the page content below
City Logistics
         landscape in the era
            of on-demand
               economy
       Main challenges, trends and
     factors influencing city logistics
  Pending the approval from the European Commission

Deliverable number: D1.1
Author(s): Edoardo Marcucci (MOLDE), Valerio Gatta (MOLDE), Giacomo
Lozzi (POLIS).
Author'(s') affiliation (Partner short name): MOLDE, POLIS

       This project has received funding from the
       European Union's Horizon 2020 research       Pending EC Approval
       and innovation programme under grant
       agreement No 861598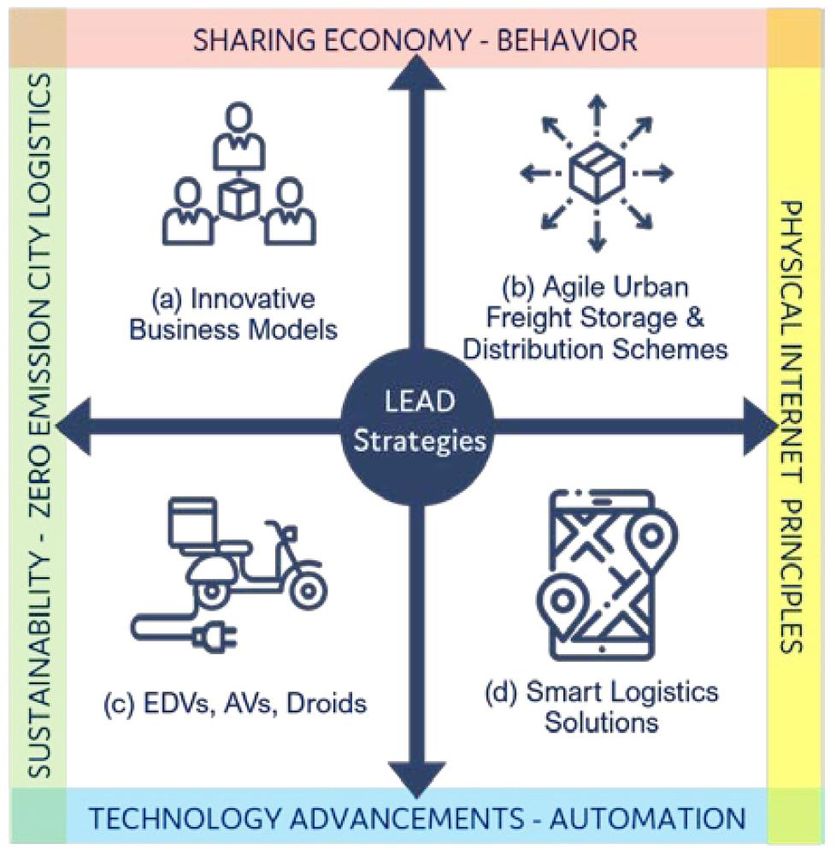
D1.1 - City Logistics landscape in the era of on-demand economy

 Deliverable No.                                   D1.1

 Workpackage No.                                                        Adaptive  City  Logistics
                           WP1                     Workpackage Title    Framework and LEAD Value
                                                                        Cases

 Task No.                                                               City Logistics landscape in
                           T1.1                    Task Title           the   era    of  on-demand
                                                                        economy

 Date of preparation of this version:              11/01/2021

 Authors:                                          Edoardo Marcucci, Valerio Gatta, Giacomo Lozzi

 Status (F: final; D: Draft; RD: revised draft):   F

 File Name:                                        LEAD_D1.1_final.docx

 Version:                                          3.0

 Task start date and duration                      1/06/2020 – 31/12/2020

This document is issued within the frame and for the purpose of the LEAD project. This project has
received funding from the European Union's Horizon 2020 research and innovation programme under
Grant Agreement No. 861598.

The views represented in this document only reflect the views of the authors and not the views of the
European Commission. The dissemination of this document reflects only the author's view and the
European Commission is not responsible for any use that may be made of the information it contains.

                                                                                                                     Page 2 of 92
D1.1 - City Logistics landscape in the era of on-demand economy

Revision History

  Version No.      Dates         Details, New10

  1.0              20/11/2020    1st draft version

                                 2nd draft version, including contributions of: CityLogin, LPA,
  2.0              10/12/2020
                                 SONAE, ZLC, Last Mile, DHL.

  3.0              23/12/2020    3rd draft version, revision based on reviewers’ comments

Reviewers List

 Name property                  Company          Dates          Signature

 Bas Groothedde                 Argusi           06/01/2021
 Ioanna Kourounioti,
                                TUDelft          07/01/2021
 Rodrigo Tapia

                                                                                                                Page 3 of 92
D1.1 - City Logistics landscape in the era of on-demand economy

Contents

Executive summary........................................................................... 8
1              Introduction ....................................................................... 10
1.1     The LEAD project ..................................................................................................10
1.2     How this deliverable links with the LEAD project ...................................................10
1.3     Purpose of this deliverable and document structure ..............................................11

2              Key challenges and trends influencing urban freight transport 12
2.1     The context ...........................................................................................................12
    2.1.1    Cities: an unsustainable future today ...............................................................12
    2.1.2    Negative externalities due to urban transport...................................................15
2.2     Current trends in urban freight transport ................................................................16
    2.2.1    E-commerce ....................................................................................................18
    2.2.2    The on-demand economy ................................................................................19
    2.2.3    On-demand logistics and Digital Twins ............................................................20
2.3     Factors influencing urban freight transport: a survey .............................................21
    2.3.1    General Information .........................................................................................22
    2.3.2    Influencing factors ...........................................................................................23
    2.3.3    Results of the survey .......................................................................................24
    2.3.4    The most influencing factors ............................................................................36
    2.3.5    Needs and challenges in the private and public sector ....................................38

3              Typologies of agile storage & last-mile distribution schemes 40
3.1     The organization of deliveries ................................................................................41
    3.1.1    Delivery locations ............................................................................................41
    3.1.2    Delivery mode .................................................................................................46
    3.1.3    Delivery times ..................................................................................................49
3.2     Management of loading and unloading areas ........................................................50
3.3     Consolidation ........................................................................................................51
    3.3.1    Urban Consolidation Centers ...........................................................................51
    3.3.2    Micro-hubs.......................................................................................................53
    3.3.3    Mobile Depot and small electric vehicles .........................................................55
3.4     New technologies ..................................................................................................56
    3.4.1    Automated and Autonomous delivery systems ................................................56
    3.4.2    Cloud Computing, Artificial Intelligence and Data Collection through the Internet of Things
             ........................................................................................................................58

                                                                                                                                          Page 4 of 92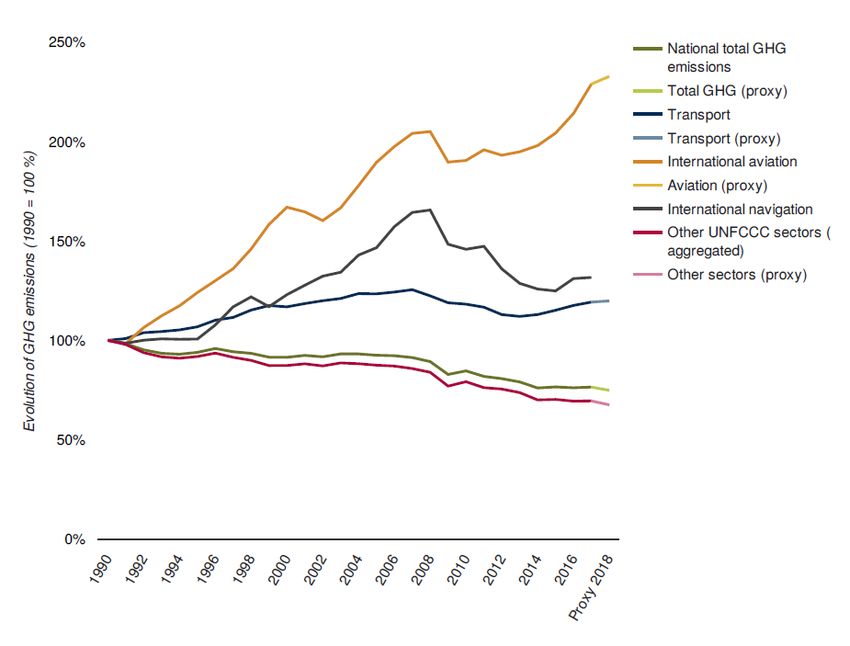
D1.1 - City Logistics landscape in the era of on-demand economy

4              The Physical Internet: State-of-the art and new trends .. 61
4.1     LEAD and the Physical Internet concept ...............................................................61
4.2     PI theory and applications .....................................................................................62

5              Green vehicles classification and integration in urban logistics
               ............................................................................................ 67
6              Conclusions ....................................................................... 75
References ....................................................................................... 76
Annex – Survey to capture key challenges, trends and influencing factors
       ............................................................................................ 82

List of figures
Figure 1: EU greenhouse gas emissions in the transport sector ...................................................... 14

Figure 2: EU (Convention)- Share of transport greenhouse gas emissions 2019 ............................. 15

Figure 3: Total external cost 2016 for EU 28 (excluding congestion) ............................................... 17

Figure 4: Share of the different cost categories on total external costs 2016 for EU 28 ................... 18

Figure 5 - Respondents’ countries ................................................................................................... 22

Figure 6: Respondents’ categories .................................................................................................. 23

Figure 7: Relevance of “Economy and demographics” .................................................................... 25

Figure 8: Relevance of “Economy and demographics” by sector ..................................................... 26

Figure 9: Relevance of “Ecology and social responsibility “ ............................................................. 27

Figure 10: Relevance of “Ecology and social responsibility” by sector ............................................. 28

Figure 11: Relevance of “Consumer acceptance and behaviour change” ........................................ 29

Figure 12: Relevance of “Consumer acceptance and behaviour change” by sector ......................... 30

Figure 13: Relevance of ”New technologies” ................................................................................... 31

Figure 14: Relevance of “New technologies” by sector .................................................................... 32

Figure 15: Relevance of “Corridors, nodes and spaces” .................................................................. 33

                                                                                                                                     Page 5 of 92
D1.1 - City Logistics landscape in the era of on-demand economy

Figure 16: Relevance of ”Corridors, nodes and spaces” by sector ................................................... 34

Figure 17: Relevance of “COVID-19” ............................................................................................... 35

Figure 18: Relevance of “COVID-19” by sector................................................................................ 36

Figure 19: the most influencing factors: an overview ....................................................................... 37

Figure 20: most influencing factors by sector ................................................................................... 38

Figure 21 : LEAD Strategies and Innovation Drivers ........................................................................ 61

Figure 22: Solutions for freight transport and logistics decarbonisation ........................................... 62

Figure 23 : Illustrating π containers Snapping as Pickup/ Delivery Lockers ..................................... 65

Figure 24: Illustration of a π container Based Smart Locker Bank at Some Punctual Time .............. 65

List of tables
Table 1 Total external costs 2016 for EU 28 freight transport by cost category and transport mode 16

Table 2 Innovation and solutions for agile storage & last mile distribution schemes ........................ 41

                                                                                                                                   Page 6 of 92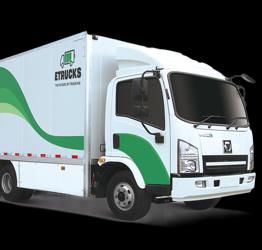
D1.1 - City Logistics landscape in the era of on-demand economy

List of acronyms
B2B: business to business

B2C: business to consumer

B2P: business to person

BEVs: battery electric vehicles

BSS: Binnenstadservice

CNGs: compressed natural gas

EDVs: electric delivery vehicles

EFFVs: environmentally friendly freight vehicles

EFVs: electric freight vehicles

EU: European Union

FC-EREVs: fuel cell range extender electric vehicles

FCVs: fuel cell vehicles

ICT: Information and Communication Technology

ICEVs: internal combustion engine vehicles

IoT: Internet of Things
LNGs: liquefied natural gas

LEZ: Low emission zone

LL: Living Labs

P2B: person to business

P2P: peer to peer

PI: Physical Internet

PPPs: public-private partnerships

SDGs: Sustainable Development Goals

UCC: urban consolidation centre

UFT: urban freight transport

TCO: total cost of ownership

ZEZ: Zero emission zone

                                                                                                     Page 7 of 92
D1.1 - City Logistics landscape in the era of on-demand economy

Executive summary
One of the most dynamic and evolving sectors of urban transport is logistics. Last mile delivery
systems are facing many challenges associated with the dawn of on-demand logistics, struggling to
accommodate citizen's expectations for responsive logistics systems, that deliver products at low or
even zero cost. The recent COVID-19 crisis has demonstrated the importance of the resilience of the
logistics chain, which sees the most complex stretch in the last urban mile. It is also changing the way
citizens buy, increasingly turning to online, on-demand platforms. This pressure on the system must
therefore be efficiently mitigated.

To minimize the negative impacts of this phenomenon, LEAD is creating Digital Twins1 of urban
logistics networks in six cities (Living Labs), to test different innovative solutions for shared-connected
and low-emission logistics operations and to address the requirements of the on- demand economy
while aligning competing interests and creating value for all different stakeholders.

The first step, therefore, requires a clear identification of the challenges and trends that influence
urban logistics, in particular on-demand deliveries, as well as the different perspectives and needs of
the relevant stakeholders. This facilitates the definition and success of value cases to be tested in the
Living Labs. In order to provide this knowledge, this deliverable provides a literature review and a
survey with 125 participants, identifying the factors that most influence urban logistics, also broken
down and analysed by type of stakeholder. New technologies, consumer requirements and economic
& demographic elements were selected as the factors that most influence on-demand logistics.

Furthermore, to favour the identification of the innovative solutions to be tested in the Living Lab and
the different LEAD strategies (D1.5), the deliverable identifies and schematizes the typologies of agile
storage and last-mile distribution schemes, based on four categories: i) Delivery locations, modes and
times; ii) Loading and unloading area management; iii) Consolidation iv) New technologies. This will
help partners to understand how the solutions will likely perform under various economic,
environmental and social conditions, looking at concrete experiences and evaluations throughout
Europe and the rest of the world.

The long-term vision of LEAD is to design an Open Physical Internet (PI)-inspired framework for Smart
City Logistics that incorporates the created Digital Twins, laying the foundations for the development
of large-scale city Digital Twins. For this reason, the deliverable provides an overview on the state-of-
the art and new trends on PI developments. The specific case of the SONAE partner is presented, as
the company is already applying the Physical Internet approach to its operations in the ICONET
project.

Finally, LEAD wants to identify the most appropriate green vehicles for its value cases, at the same
time reducing air pollution and increasing the efficiency of the entire system. In the last section, green
vehicles are classified and evaluated in terms of requirements for their effective integration with
logistics operations. An enablers / barriers map identifies the necessary actions, while for each vehicle
the following are discussed: policy and legislation; technology and innovation; infrastructure;

1
    A Digital Twin is a digital replica of a complex real-world urban environment that represents different processes, actors and their interaction.

                                                                                                                                              Page 8 of 92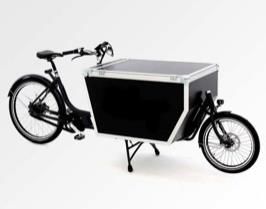
D1.1 - City Logistics landscape in the era of on-demand economy

consumer acceptance. A common element is the need for a charging infrastructure network suitable
for the upscaling of these vehicles.

                                                                                                           Page 9 of 92
D1.1 - City Logistics landscape in the era of on-demand economy
1 Introduction
1.1 The LEAD project
LEAD will create Digital Twins of urban logistics networks in six cities, to support experimentation and
decision making with on-demand logistics operations in a public-private urban setting. Innovative
solutions for city logistics will be represented by a set of value case scenarios that address the
requirements of the on-demand economy while aligning competing interests and creating value for all
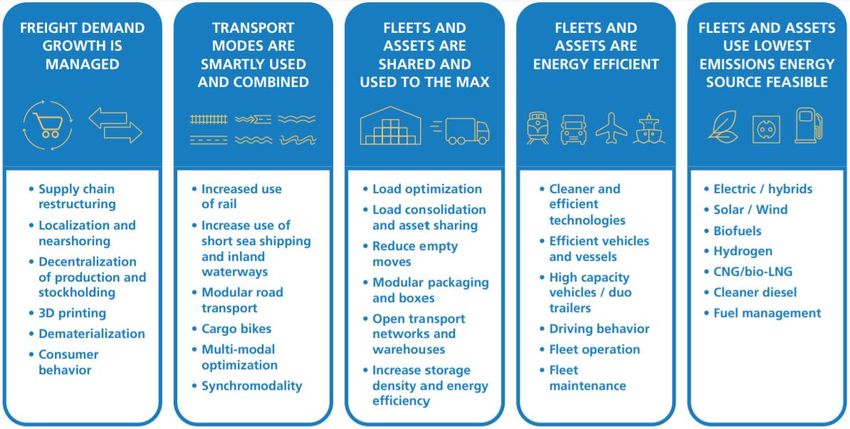
different stakeholders. Each value case will combine several measures (LEAD strategies): a)
innovative business models, b) agile urban freight storage and last-mile distribution schemes, c) low-
emissions, automated, electric, or hybrid delivery vehicles, and d) smart logistics solutions.
Cost, environmental, and operational efficiencies for value cases will be measured in 6 Living Labs
(LL). Evidence-proven value cases and associated logistics solutions will be delivered in the form of
exploitable Digital Twins, incorporating the models that support adaptation to different contexts and
that provide incentives for public-private partnerships (PPPs).
The LEAD consortium comprises 22 partners, all of whom are involved in the Living Labs, supported
by 5 international partners for knowledge transfer. This structure incentivizes the co-creation of
solutions by city authorities, logistics industry leaders, start-ups, and research experts in freight
modelling, complex simulation and logistics optimisation.
1.2 How this deliverable links with the LEAD project
LEAD’s vision will be realised through four key implementation objectives that are designed to address
the specific business, technical and regulatory challenges and fulfil the innovation, dissemination and
commercial ambitions of the project. These are i) Value cases co-design, ii) Digital Twins Tools, iii)
Validation in Living Labs, iv) Scale-up.
This deliverable is framed within the first objective, which aims to develop a contextual framework to
support the design and implementation of cost-effective sustainable integrated city logistics systems,
by involving stakeholders in the co-creation of innovative last mile solutions and services that address
the needs of the on-demand economy. The deliverable provides an analysis of the strategic,
regulatory, business, technology, environmental factors influencing complex city logistics systems in
the on-demand economy era. The analysis is backed by a consolidated survey on the current needs,
trends and challenges of last mile logistics. This preliminary work is essential to generate up-to-date
knowledge about the on-demand logistics ecosystem, functional to the articulation of the following
activities both for the design of the solutions and strategies, for the definition of models and tools, and
for the real-life applications (Living Labs experimentation, upscaling of the solutions).
Page 10 of 92D1.1 - City Logistics landscape in the era of on-demand economy
1.3 Purpose of this deliverable and document structure
This deliverable collates, refines and frames existing knowledge and understanding of the city logistics
landscape in the era of on-demand economy. The document starts highlighting the main challenges
and trends that are influencing city logistics due to the on-demand economy. Based on these findings,
it covers (i) typologies of agile urban freight storage and last mile distribution schemes; (ii) an overview
of the Physical Internet (PI) optimisation criteria; (iii) green vehicles classification, considering their
potential integration in urban logistics.
Key challenges and trends influencing Urban Freight Transport (UFT). Cities and industries need
new knowledge-driven logistics solutions to cope with the contemporary challenges. The main factors
influencing increasingly complex city logistics systems have been analysed, including strategic,
regulatory, business, technology elements. The key challenges and trends that are influencing urban
freight transport were captured through a desk research and reinforced via an in-depth survey,
involving the project partners and a wider network of relevant stakeholders, including the Advisory
Board and international cooperation partners.
Typologies of agile storage & last-mile distribution schemes. Retailers and logistics operators
are testing alternative urban delivery schemes, such as home delivery, click and collect, kerbside
pickup, parcel lockers and more. Different agile storage can be used as proximity stations or proximity
points to improve the last mile delivery efficiency, particularly to distribute small- and medium-sized
goods, utilising integrated network approaches. Market segment, customer profile, economic and
operational resources are some of the main drivers for this complex choice. Thanks to the support of
LEAD industrial partners, who apply these schemes or plan to do so, the deliverable categorized and
analysed the configuration of these models, highlighting their trends and impacts.
The Physical Internet: state-of-the art and new trends. The development of the Physical Internet
(PI) concept aims to a transition from single optimization problems to a holistic operational research
approach based on an integrative transportation network. Since the resources of logistics companies
should be used collaboratively, new developments are needed for the optimization of this
transportation network where movers, nodes and containers are the three physical elements of the
PI. The deliverable reviews different PI-related approaches to optimise the supply chain. Liaison with
the ICONET project and the ALICE network generate additional elements to provide inputs on the
state-of-the art and new trends on PI developments.
Green vehicles classification and their integration in urban logistics. The innovations introduced
in the vehicles market have been disruptive, especially new engine technologies and driverless
vehicles. Green vehicles are needed for decarbonising transport, reducing air pollution and increasing
the efficiency of the system. In the last section, green vehicles are classified and evaluated in terms
of requirements for their effective integration in city logistics. An enablers/barriers map for their
integration in urban logistics defines what are the necessary technological, organisational and
regulatory conditions for their uptake. The investigated elements include: policy and legislation;
technology and innovation; infrastructure; consumer acceptance.
Page 11 of 92D1.1 - City Logistics landscape in the era of on-demand economy
2 Key challenges and trends influencing urban
freight transport
2.1 The context
2.1.1 Cities: an unsustainable future today
Cities and metropolitan areas have increasingly become the main centres of the economic and social
life. A globalised international system tends to increase opportunities in cities at the expense of more
peripheral areas, accentuating their relative attractiveness.
Today, there are 4.3 billion people living in cities (55% of the world's population) and by 2050 it is
expected to be 6.5 billion (66% of the world's population). In 2018, around 70% of the EU population
resided in urban areas — comprising cities, towns and suburbs2. Further, it is estimated that urban
areas are responsible for generating over 85% of EU GDP3. The increasing amount of people located
in cities therefore implies new challenges, including mobility and logistics aspects (UN-Report, 2014).
Cities consume 75% of the available resources, 60%-80% of the energy produced and generate 70%
of the CO2 emissions produced, while occupying only 2% of the land (Swilling et al. 2013). These
numbers highlight the weight that cities play in the current model of economic development.
The impact of climate change and the consequences that will ensue are the most visible damage the
excessive and irrational consumption of resources implies. Drought, environmental disasters and soil
depletion will be phenomena that we will probably have to cope with (M. Allen et al. 2018). Rapid and
urgent action is needed to avert this change. The actions to be taken must reduce emissions by 45%
compared to the 2010 level by 2030 and then reach global net anthropogenic CO2 emissions in 2050
(M. Allen et al. 2018).
Mitigation measures are not sufficient. The whole economic paradigm and its compatibility with
sustainable development needs to be rethought.
The Brundtland Commission defines the concept of sustainable development as “a model that meets
the needs of current generations without compromising the ability of future generations to meet their
own”(World commission on environment and development, 1987).
In 2015, the United Nations, with an extensive collaboration of numerous stakeholders, drafted the
Sustainable Development Goals (SDGs) for 2030. The idea behind these objectives is a concept of
multidimensional development where the economic, environmental and social dimension is
simultaneously considered. These dimensions are held together by the principle of intra and
2 https://ec.europa.eu/eurostat/web/products-eurostat-news/-/EDN-20200207-1
3 https://ec.europa.eu/transport/themes/urban/urban-mobility/urban-mobility-package_en
Page 12 of 92D1.1 - City Logistics landscape in the era of on-demand economy
intergenerational fairness: there can be no development without equity within the state, between states
and between different generations of individuals (UN, 2015).
The key role of the city was recognised in the drafting of the SDGs. Cities are not only the indirect
recipient of policies aimed at sustainable development, but they are also considered key development
actors. As the city is the centre of social and economic life for much of the world's population, it was
deemed necessary to draw a specific Goal 11: Sustainable Cities & Communities on how cities must
change to accompany and drive change towards a more sustainable world.
Goal 11 aims to make cities resource efficient (water, energy, waste), resilient to the possible effects
of climate change, with an efficient, green, unpolluted and inclusive transport system designed so as
not to develop and eradicate existing slums (UN, 2015).
Although not explicitly mentioned, cities are also the recipient of Goal 12 : Responsible Consumption
& Production, which aims to create sustainable production models (UN, 2015). While metropolitan
areas are the largest consumer centre and therefore the largest producer of waste material,
sustainable production should focus on cities key role in balancing the relationship between
production, consumption and waste generation.
To date, however, these targets seem hard to reach: 828 million people live in slums on the outskirts
of cities and the rapid growth of the population puts increasing pressure on drinking water sources,
sewage systems, the living environment of cities and public health, effectively making many cities the
emblem of an unsustainable development model (UNDP, 2018). Transport, freight and sustainability
are strictly intertwined.
If the city is the centre of a globalized society, the transport sector is certainly its foundation. The flow
of goods and services, people and information and the worldwide supply chain are only possible
thanks to infrastructure, logistics capabilities and resilience of the transport system, as the epidemic
crisis caused by the COVID-19 virus has clearly proven.
The link between transport and economic growth depends on the consideration that goods, before
they can be consumed and generate wealth, must be transported from the place of production to the
place of consumption.
The proper functioning of the entire transport sector supports economic growth and promotes further
development by encouraging investment and opportunities for market expansion.
However, the economic boom of the last century and the first twenty years of the 21st century has
also brought to light the weaknesses of this foundation. The entire transport sector contributes to the
current non-sustainability of the economic system. Polluting fuels are used in the transport sector
serving, very often, an inefficient supply chain characterized by inadequate logistical capabilities.
Page 13 of 92D1.1 - City Logistics landscape in the era of on-demand economy
Figure 1: EU greenhouse gas emissions in the transport sector
Source: (European Environment Agency, 2020)
Today, more than 20% of the world's CO2 emissions are related to the transport sector, 13% are
related to passenger mobility demand, while around 7% is related to freight transport (OECD/IA, 2014;
OECD/ITF, 2015).
Freight emissions are expected to increase four-fold from 2010 to 2050 due to increased trade, longer
supply chains and a possible shift towards road transport. These figures therefore call for a sharp
reorganisation of the entire transport sector, in particular the road transport sub-sector, where the
share of greenhouse gas emissions is 80% (Figure 2) in the United States and 71% in the EU,
respectively (OECD/ITF, 2015; Environmental Protection Agency, 2018; European Environment
Agency, 2019).
Page 14 of 92D1.1 - City Logistics landscape in the era of on-demand economy
Figure 2: EU (Convention)- Share of transport greenhouse gas emissions 2019
Source: (European Environment Agency, 2019)
2.1.2 Negative externalities due to urban transport
If the transport sector is generally a very inefficient sector, it is even more noticeable in cities because
of the consequences it generates. The increasing density of housing and new commercial paradigms
such as e-commerce and on-demand economy exacerbate already detrimental phenomena such as
air pollution, noise, accidents and congestion. The combination of these phenomena entails economic
costs known as externalities which not only undermine the productivity of the economic activities of
cities, but directly affect the quality of life4. Consider, for example, the life expectancy losses due to
road accidents or diseases ascribable to breathing harmful gases.
Road accidents (29%), congestion (27%), air pollution (14%) and climate change (14%) (Figure 4)
are the four externalities that weigh the most in terms of economic costs in Europe. Road transport is
responsible for most of the total external costs/externalities produced (about 83%) (CE Delft, 2019).
4
"Externality arises when economic and/or social activities of one group have an impact on another group or person and when this impact
is not considered or compensated by the first group." CE Delft. (2019). Handbook on External Costs of Transport. In European Commission.
https://www.cedelft.eu/en/publications/2311/handbook-on-the-external-costs-of-transport-version-2019
Page 15 of 92D1.1 - City Logistics landscape in the era of on-demand economy
The numbers in question are macroscopic and go beyond the aforementioned effect of greenhouse
gases and air pollution. Overall, externalities represent a huge loss for society, equivalent to around
6.6% of EU GDP (CE Delft, 2019).
Most of the economic and social losses are concentrated in the city. For example, according to a
McKinsey report, the cost of congestion in cities is between 2% and 4% of the cities' GDP (Bouton et
al. 2017).
Freight transport has a significant impact on the externalities produced. In fact, light and heavy road
vehicles and, to a lesser extent, rail and inland navigating vehicles produce, in the European Union
(EU) alone, over 200 billion € total external costs (Figure 3). Half of these are produced by light
vehicles, mostly operating within cities (CE Delft, 2019). A large portion of the total amount of
externalities the transportation sector produces is due to freight transport thus implicitly linked to urban
logistics, in general, and to the last-mile, in particular5, Table 1 shows that last mile logistics is
burdened by the congestion problem, accounting for more than half (55.5 of 117.6 billion euros) of the
external costs light commercial vehicles produce (CE Delft, 2019).
Table 1:
1 Total
Totalexternal
external costs
costs 2016
2016 for
for EU
EU 28
28 freight
freight transport
transport by cost category and transport
mode
Source: (CE Delft, 2019)
2.2 Current trends in urban freight transport
The increase in total external costs in the urban area is largely due to the continuous increase in light
commercial vehicles used for last mile deliveries. The latter, although representing a minor proportion
of the total number of vehicles circulating within the city, plays a fundamental role in explaining urban
5 An example of this can be the transition from the urban or peri-urban distribution center or warehouse to the end consumer.
Page 16 of 92D1.1 - City Logistics landscape in the era of on-demand economy
road space occupation and externalities. Today, freight commercial vehicles, with respect to the
overall situation, travel 15-25% of the kilometres in the city, occupy 20% to 40% of the urban road
space, cause between 20% and 40% of CO2 emissions related to urban transport and are responsible
for 30% to 50% of the main air pollutants (PM and NOx) (Smart Freight Centre, 2017).
Negative performance in urban logistics would have detrimental consequences for the liveability of
cities and globally in the fight against climate change. Some scenarios today predict a 78% increase
in last mile delivery by 2030 change (World Economic Forum, 2020). The subsequent increase in
light commercial vehicles would provoke a 21% increase in congestion, equivalent to approximately
additional eleven commuting minutes in 2030 compared to 2010. Globally, freight emissions would
rise by 32% reducing the effects of measures put in place to mitigate climate change (World
Economic Forum, 2020).
The increase in commercial vehicles used for freight transport not only depends on the rise in demand
for goods and services, due to the growth of city dwellers and to the additional spreading of logistic
sprawl, but also on e-commerce and on-demand economy.
Figure 3: Total external cost 2016 for EU 28 (excluding congestion)
Source: (CE Delft, 2019)
Page 17 of 92D1.1 - City Logistics landscape in the era of on-demand economy
Figure 4: Share of the different cost categories on total external costs 2016 for EU 28
Source: (CE Delft, 2019)
2.2.1 E-commerce
E-commerce is the process of buying and selling products and services by electronic means. This can
be classified based on who are the active parties in the sale. B2B (Business to Business) is when the
transaction takes place between two companies, B2C (Business to Consumer) when there is a direct
transaction between the company and the end consumer, and C2C (Consumer to Consumer), a less
widespread category, when there is an exchange of goods or services between two consumers.
E-commerce is now experiencing growth of more than 10% per year worldwide and regionally. This is
remarkable considering that, over five years, e-commerce sales ratios nearly tripled globally (World
Economic Forum, 2020).
The first factor that explains this explosion is primarily the increase in people using the internet. In
2018, 4 billion people had access to the internet, an increase of 10% compared to 2016 (Casaleggio
Associati, 2018). Today, the widespread use of the Internet is undergoing a further acceleration due
to the epidemic crisis caused by COVID-19. In addition to this factor, online sellers are having a huge
success because of the price and perceived convenience of the service. Amazon and Alibaba alone
manage to bill more than a trillion dollars a year (Casaleggio Associati, 2018).
Page 18 of 92D1.1 - City Logistics landscape in the era of on-demand economy
The widespread diffusion of smart devices considerably reduces transaction costs thus allowing a
substantial increase in the total number of mobile-based transactions performed each year. Online
channels are expected to grow significantly in the near future across all the retail industry where the
most important actors are purposely pursuing a multi/omni-channel strategy so to either increase or
retain their market power/competitiveness (Verhoef et al. 2015) .
Along with a strong and steady growth of this specific market segment a substantial strain has
developed for brick-and-mortar retailers that are now compelled to improve e-commerce-equivalent
capabilities so to make their stores competitive also online (Fruhling & Digman, 2000; Kim & Park,
2005) .
Given this context, both delivery logistics and service quality acquire a strategic value in determining
retail competitiveness. Retailers competing online need to develop on-demand logistic capabilities to
keep up with customer expectations which incorporate both high logistics service quality and low
costs. Most of the customers’ requirements with respect to logistics service quality are focused on
short delivery times which often constitutes the main driver for the overall delivery experience. Last-
mile delivery optimization plays a key role in promoting retailers’ competitive advantage by increasing
customer satisfaction (Esper et al. 2003; Napolitano, 2013) . This heavily depends upon how goods
fulfilment is performed, especially since, while short, this segment accounts for approximately 50% of
total logistic costs.
The increase in the number of e-commerce consumers translates into an increase in freight transport
and an increase in light commercial vehicles. Although, in theory, online shopping can make people
shop less in physical stores and therefore move less by reducing the kilometres travelled overall, this
is not often the case because omnichannel activities6 imply more kilometres travelled. The total
number of kilometres travelled between freight and passenger transport does not seem to decrease
(Rai et al. 2019;Rotem-Mindali & Weltevreden, 2013).
E-commerce therefore seems to be complementary or at least not a substitute for traditional retail-
generated trips, and is therefore an additional cause of externality, also as a result of the development
of the on-demand economy and the just-in-time logistics paradigm.
2.2.2 The on-demand economy
The on-demand economy refers to a new economic model that is based on the use of online platforms
that allow immediate matching between a user who requires a good or a service and another who is
able to provide it "sharing" the assets of goods, skills, time of which it is in possession (Dagnino,
2015). The term on-demand refers to the almost immediate use of a service.
The impact of the on-demand economy in society is enormous; in the United States, the 3.9 million
workers employed in the sector in 2017 will increase, according to forecasts, to 9.2 million, with the
creation of a new class of entrepreneurs and workers (Intuit, 2017). In the field of transport and
6
The “omnichannel environment” is a new retail paradigm enabling consumers shopping seamlessly and flexibly through a range of online
and offline channels and touchpoints, using advanced technologies on smartphones and other devices. (Buldeo Rai et al., 2019)
Page 19 of 92D1.1 - City Logistics landscape in the era of on-demand economy
logistics, this has led to the reorganization of the supply chain, which has been geared towards a new
industrial philosophy, the so called just-in-time. It is a philosophy that has reversed the "old method"
of producing finished products waiting to be sold (called push logic) by switching to pull logic,
according to which it is necessary to produce only what has already been sold or that is expected to
be sold in a short time. In the e-commerce sector, this translates into the sale of immediately
deliverable products. Amazon Prime and Amazon Now, for example, allow online products to be
received within a day or even two hours.
The perceived convenience of this new delivery service offered, also supported by the perception of
zero delivery costs, is making other modes inadequate. In the US, 74% of consumers say that they
will most likely choose again a company that offers a same-day delivery service7, while in the UK only
32% of consumers are willing to wait 2 or 3 business days for delivery8.
While this service improves the experience perceived by consumers, it creates strong downward
competition among operators who are inclined to act with half-empty vehicles to deliver products as
quickly as possible and gain customer trust.
Therefore, the consequence of this new paradigm is, among others the increase in traffic, due to the
excessive presence of light commercial vehicles and the increased emission of CO2 and polluting
materials in the air.
2.2.3 On-demand logistics and Digital Twins
On-demand delivery conceptually includes a service that, taking advantage of professional
crowdsourced delivery capabilities, aims at providing a tailored, yet low-cost, delivery service capable
of satisfying customers’ desired time/place on a very short notice. UberRUSH for instance allows, by
using crowdsourced drivers, to serve online businesses by performing a reliable, flexible, low-cost and
with reduced lead-time deliveries to local customers. Other operators such as, for instance, Amazon
and DHL have developed similar logistics service capabilities. Wal-Mart, a major retailer in the US,
has developed a comparable service by using their employees back-to-home trips to deliver online
purchases to customers’ homes (Bhattarai, 2017) . Another on-demand delivery service foresees that
customers pick up their orders placed online in a given physical place, be it a supermarket, a shop, or
a dedicated pick-up point. Retailers increase their perceived attractiveness by dropping off orders in
physical places that are convenient from a final customer perspective, even if this is not their final
place of consumption (i.e. home). Amazon, for instance, promotes self-service parcel delivery/return
service where customers play an active role in either retrieving or returning orders from/to Amazon
Lockers. This service type can be both attractive and financially convenient for both operators and
customers since they: (1) cut the gordian knot due to the need for the contextual presence of delivery
person/customer thus substantially reducing the number of missed deliveries; (2) increase time
flexibility for both logistic operators and customers in performing their respective actions thus implicitly
contributing to their optimisation; (3) reduce both financial and environmental costs due to an increase
in number of drops per stop made, an increase in the average load factor, a reduction in kilometres
7
https://www.dropoff.com/blog/retail-delivery-consumer-survey-shoptalk-2018
8
https://www.whistl.co.uk/news/british-consumers-want-their-deliveries-faster-than-ever
Page 20 of 92D1.1 - City Logistics landscape in the era of on-demand economy
driven, a reduction of double line parking, a decrease in the number of cruising for parking kilometres,
and a reduction in the number of stop/start for each vehicle. These service arrangements are
particularly valuable when it comes to the e-grocery market (Marcucci et al., 2021) .
Recently, many and relevant changes have taken place in this context that have had a substantial
impact on city freight distribution. In fact, both large and small e-commerce platforms are contributing
to those social changes that are impacting on society due to urbanisation, aging population,
asymmetric income distribution, and last but not least epidemic risks that have strongly stimulated a
significant increase in instant deliveries and on-demand logistics. However, one should not
underestimate the daunting problems these strong and quick changes are producing with respect to
safeguarding environmental sustainability and guaranteeing, at the same time, economic and social
goals such as labour and social inclusion, income distribution equality and resilience.
Given this framework of reference, one has to be able to describe/predict future outcomes quickly and
reliably thus paving the way to the definition and deployment of effective and ex-ante acceptable
intervention policies with the aim of tackling these fast-rising problems that the different stakeholders
partaking in the complex and heterogeneous urban freight distribution system are facing.
Digital Twins can be appropriately developed within a Living Lab approach to policy-making and
planning. Digital Twins are useful to achieve jointly ex-ante acceptable solutions since they provide
easy-to-understand descriptions of future scenarios and illustrate the future implications of current
choices in a stakeholder-specific manner. One should recall that planning recursively interlinks with
piloting and evaluation, suggesting how a Living Lab approach can be integrated with Digital Twin
modelling.
The integration of these two instruments is very promising for policy-making and planning. As
Marcucci et al. (2020) have convincingly argued, one should clearly consider the following three
main points: (i) a Digital Twin system can hardly represent the full reality of a complex urban freight
transport system due to its, often cited and widely recognised, deep complexity of one side and lack
of the data needed for continuously feeding the model as well as the structural instability of the
relationships describing agents’ behaviour; (ii) Digital Twins can support experiments and pilots in on-
demand urban logistics planning and policy-making, by informing stakeholders about future
implications of any given policy thus allowing for a more informed decision-making process; (iii)
behavioural and simulation models constitute the common base for characterising urban freight
transport, where a sound theory and knowledge with respect to the relationships linking contextual
reality and behaviour is fundamental to explain what happens in the real world.
2.3 Factors influencing urban freight transport: a survey
As a preliminary activity, LEAD aims to collate, refine and further develop existing knowledge and
understanding of the city logistics landscape in the era of the on-demand economy. By doing so, it is
creating new knowledge-driven logistics solutions to cope with contemporary challenges, considering
new trends and impacts generated by the COVID-19 outbreak.
Page 21 of 92D1.1 - City Logistics landscape in the era of on-demand economy
The LEAD project launched a survey to gather views on the key challenges, trends and influencing
factors characterising urban freight transport, involving key experts and practitioners.
Building upon the legacy of the EU-funded NOVELOG project9, a set of factors influencing the UFT
environment has been drawn up. Participants were asked to assess to what extent each factor
influences the development of the urban logistics ecosystem and to add any further factors that they
consider important that do not appear in the list.
The survey took place online, and was disseminated through various channels interested in urban
mobility and logistics, including POLIS, ALICE, CIVITAS, and the communication tools and channels
of LEAD and its partners.
In order to facilitate the largest possible participation, a 2nd stage simplified questionnaire was
prepared and translated it into six languages10, so that it could be shared also with local stakeholders.
2.3.1 General Information
A first overview provides information on the geographic origin of the respondents, as well as their
nature (public, private, academia).
Figure 5 - Respondents’ countries
Respondents' countries
60
50
50
40 37
30
30
20
10 8
0
Outside Europe North Europe Central Europe South Europe
125 experts participated in the survey, coming mainly from Spain, Italy, Norway, the Netherlands, and
Hungary (59.8%), which not by chance are the countries in which the project takes place. Germany,
9
http://www.novelog.eu/
10
https://www.leadproject.eu/new-multi-language-survey-to-map-challenges-and-trends-in-urban-freight-transport
Page 22 of 92D1.1 - City Logistics landscape in the era of on-demand economy
France and Belgium cover the 14.1% of the respondents. It is noticeable to see that 3.9% of
respondents come from outside Europe.
Figure 6: Respondents’ categories
Who are the respondents
59
34
34
PUBLIC ACADEMIA PRIVATE
Most respondents are researchers (46.4%). Public authorities at every level represent 18.8% of the
respondents whereas logistics operators correspond to 11%. Other respondents are citizens,
members of companies, consultants, or manufacturers/producers.
While the sample size and its extraction from the population does not ensure its statistical
representativeness, we support the idea that given the focused administration of the questionnaire
among qualified respondents, this allows us to capture the most important factors.
2.3.2 Influencing factors
Influencing factors are elements, e.g. economic, demographic, social, operational, etc. that influence
both the current and future state of UFT environments.
Building upon the legacy of the EU-funded NOVELOG project, a set of factors influencing the UFT
environment has been drawn, including six main categories:
1. Economy & demographics includes factors relating to the demographic and socio-economic
fabric of the urban population, as well as the type of shops in the city.
2. Ecology & social responsibility considers the weight of factors such as the demand for
goods and services that favour environmental-friendly production, waste reduction, local and
ethical sourcing.
Page 23 of 92D1.1 - City Logistics landscape in the era of on-demand economy
3. Consumer requirements considers the level of attention of consumers to different aspects of
delivery, such as their social impact, environmental sustainability, use of the data provided.
4. New technologies consider to what extent and how the development of new technologies
makes on-demand logistics more efficient and sustainable.
5. Corridors, nodes and space: urban planning, space management and the performance of
the infrastructural network influence the operational capacity of the operators and their impact
on the urban fabric.
6. COVID-19: the lockdown and the consequent increase in online orders has accelerated the
development of e-commerce and contactless delivery and payments, as well as stressed the
entire supply chain.
Compared to NOVELOG, the set has been expanded considering the developments over the past 4
years, the scope of LEAD ('on demand economy' - shared, connected and low-emission logistics
operations), and the COVID pandemic.
Participants were asked to both assess to what extent each factor influences the urban logistics
ecosystem, based on a 5-scale (1 = Not at all; 2 = To a small extent; 3 = To some extent; 4 = To a
great extent; 5 = To a very great extent) and add any further factor, not present in the list, they consider
important. Notwithstanding the qualitative nature of the scale used, we believe using the average is
helpful in facilitating an overall evaluation. By using the same scale, we ensure comparability of the
results both within and across categories. What a Likert-scale cannot, by construction, ensure is the
homogeneous interpretation of the various qualitative point scales across respondents. This however
is an intrinsic limitation of the Likert-scale used and there is not much we can do about it. Nevertheless,
since the overall aim is to acquire a qualitative evaluation of the relevance of the various elements
considered, this is not, per se, a strong drawback with respect to the aims we pursue.
The following section describes results within each category, while sections 2.3.4 and 2.3.5 analyse
the influence of a group of factors in comparison to other categories and provide for a qualitative
assessment on need and challenges in urban freight transport based on open answers.
2.3.3 Results of the survey
This section presents the results of the survey, broken down per categories analysed. For each of
them, the weight attributed by the respondents to each of the proposed influencing factors is reported
and discussed. Furthermore, their position is also consolidated by type of respondents, that is, coming
from the public, private or academia sectors. This provides interesting insights, to grasp the different
sensitivities of practitioners, experts and operators with respect to the mechanisms that govern the
sector, and how they perceive the variables of the on-demand economy. This knowledge will be
essential to contextualize the upcoming analysis of Innovative Business Models, Governance and
PPPs (D1.3) and the definition of the reference LEAD strategies to be explored through simulation in
the Digital Twins and in real-life urban setting experiments (D1.5). Understanding stakeholder opinions
is crucial to co-create efficient logistic solutions and can lead to an acceleration of successful
participated policies.
Page 24 of 92D1.1 - City Logistics landscape in the era of on-demand economy
2.3.3.1 Economy and demographics
The aim of this section is to evaluate the weight of economy and demographics factors in the urban
logistics ecosystem through a quantitative analysis based on a 5-scale variable, highlighting not only
the overall influence of every economic/demographic factor in comparison to the others, but also a
breakdown of the different stakeholders’ opinions (academia, public, private).
Respondents have rated six economic and demographic factors.
The importance of economic factors is crucial as there is a strong relationship between economic
development and freight activity; noteworthy to mention for their impact to urban freight activity are
also structural market factors such as fuel cost and retail establishment size. The first one is a
significant part of transport costs while the latter can influence the level of freight trips.
Demographic factors are also pivotal: the physical distribution of the population and its structure affect
the focus on regional distribution system, typology and frequency of delivery.
For every economic factor inserted in the survey, respondents have expressed the importance of such
variable giving a score from 1 to 5. The average values have been grouped respectively in Figure 7
and Figure 8.
Figure 7: Relevance of “Economy and demographics”
Economy and demographics
4,10
[Urban population share (% of 3,96
total regional level)] 3,90 3,81
[GDP per city inhabitant]
3,70
3,55
[Retail establishment size] 3,50
3,35
3,30
[Fuel cost] 3,18
3,07
3,10
[City's population share of
2,90
over 65 years old]
[Average household size] 2,70
2,50
The y-axis reports the average Likert point scale (1-5)
Page 25 of 92D1.1 - City Logistics landscape in the era of on-demand economy
The most important economic and demographic factors for the respondents are urban population
share (% of regional level) and GDP (per city inhabitant). A high share of urban population is expected
to lead to a regional logistics system that is more focused on its urban distribution part. Moreover,
respondents acknowledge a strong relationship between economic development and freight activity.
GDP increases are expected to lead to more freight movements. Retail establishment size is also
considered a strong influential factor: evidence shows that small (e.g. independent) retail
establishments are more likely to generate more freight activity, generating movements with smaller
vehicles than larger establishments.
Figure 8: Relevance of “Economy and demographics” by sector
Economy and demographics
4,40
4,20
4,00
3,80
3,60
3,40
3,20 Private
3,00 Academia
Public
2,80
[Urban [GDP per [Retail [Fuel cost] [City's [Average
population city establishm population household
share (% inhabitant ent size] share of size]
of total ] over 65
regional years old]
level)]
Public 3,72 3,55 3,50 3,18 2,87 2,97
Academia 3,95 3,89 3,39 3,29 3,29 3,05
Private 4,22 3,91 3,82 3,62 3,28 3,18
Public Academia Private
The second diagram depicts the same order of importance, this time broken down for the three sectors
(public, private, academia). It is noteworthy to mention that overall private sector considers economic
and demographic factors more important in comparison to academics and public sector, in particular
Page 26 of 92D1.1 - City Logistics landscape in the era of on-demand economy
the latter gives less importance than the others to economic factors in the urban logistic ecosystem.
A noticeable different point of view emerges for the variables retail establishment size and fuel cost:
in fact, while for the public sector they are not important, is not the same for the private sector.
2.3.3.2 Ecology and social responsibility
The respondents were asked what are the most important factors related to ecology and social
responsibility contributing to reshape urban logistic ecosystem; in particular, they have given a score
from 1 to 5 to several variables such as demand for environmentally friendly products, demand for
reduced waste, for local sourcing and for ethical sourcing.
The first one is important because the increased requirement of environmentally friendly products put
pressure on urban freight transport at the levels of assets used and delivery processes. Demand for
ethical sourcing and local sourcing stresses urban freight transport at the informational and at the
physical delivery level and may lead to an increase of the frequency of urban freight trips and to an
increased share of short supply chains. Lastly, demand for reduced waste generates pressure in terms
of reverse logistics and circular economy.
It is crucial to understand if stakeholders deem disruptive such factors in urban freight environment.
For instance, understanding if the private sector considers more important the future impact of zero-
emission production in comparison to circular economy/local economy and ethical business models,
could lead the public sector to different policies and subsequent measures. The ranking is presented
in Figure 9.
Figure 9: Relevance of “Ecology and social responsibility “
Ecology and social responsibility
3,90
3,82
[Demand for environmental-
3,80 3,75
friendly products]
3,70
[Demand for reduced waste]
3,60 3,53
3,50
[Demand for local sourcing] 3,40 3,35
3,30
[Demand for ethical sourcing] 3,20
3,10
The y-axis reports the average Likert point scale (1-5)
Page 27 of 92You can also read