Road Safety Performance Review - Dominican Republic UNITED NATIONS ECONOMIC COMMISSION FOR EUROPE UNITED NATIONS ECONOMIC COMMISSION FOR LATIN ...
←
→
Page content transcription
If your browser does not render page correctly, please read the page content below

UNITED NATIONS ECONOMIC COMMISSION FOR EUROPE
         UNITED NATIONS ECONOMIC COMMISSION FOR LATIN AMERICA AND THE CARIBBEAN
                     UNITED NATIONS ECONOMIC COMMISSION FOR ASIA AND THE PACIFIC

Road Safety Performance Review
                             Dominican Republic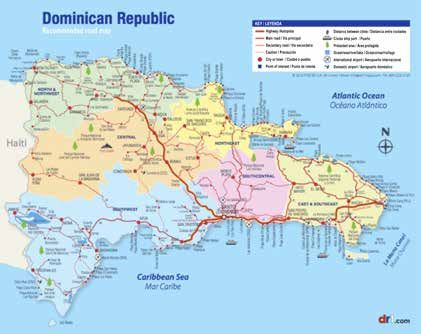
United Nations Economic Commission for Europe
  United Nations Economic Commission for Latin America and the Caribbean
  United Nations Economic and Social Commission for Asia and the Pacific

Road Safety Performance Review
              Dominican Republic
NOTES
The designations employed and the presentation of the material in this publication do not imply the expression of any opinion
whatsoever on the part of the Secretariat of the United Nations concerning the legal status of any country, territory, city or area, or of
its authorities, or concerning the delimitation of its frontiers or boundaries.

No part of this publication may, for sales purposes, be reproduced, stored in a retrieval system or transmitted in any form or by any
means, electronic, electrostatic, magnetic tape, mechanical, photocopying or otherwise, without prior permission in writing from
the United Nations.

United Nations publication
LC/TS.2018/24
Copyright © United Nations, March 2017. All rights reserved
Printed at United Nations, Santiago
S.18-00142
DOMINICAN REPUBLIC

 Contents

Introduction
             7

1.   Country snapshot 		                                                                           8
     1.1 Demographics		                                                                            8
     1.2 The economy		                                                                             9
     1.3 Topography, climate and geography		                                                      11

2.   Review of the legal and administrative framework
     for the promotion of road safety		                                                           12
     1.1 The national legal framework for the promotion of road safety		                          12
     2.2 Transposition of international regulations and agreements		                              14
     2.3 The institutional framework for the promotion of road safety		                           14

3.   Road safety trends over the last decade		                                                    15
     3.1 Road safety data collection and compilation		                                            15
     3.2 Road infrastructure		                                                                    16
     3.3 Road vehicle fleet		                                                                     17
     3.4 Road safety indicators		                                                                 22
        3.4.1   Traffic fatality, injury and accident rates		                                     22
        3.4.2   Seat belt use		                                                                   28
        3.4.3   Driving under the influence: fines, accidents and fatalities		                    29
        3.4.4   Failure to wear a helmet, use of mobile phones while driving,
                speeding and driving without a licence		                                          30
        3.4.5   Total annual expenditure on the promotion of road safety		                        30
     3.5 Assessment of the availability and reliability of road safety data		                     30

4.   Road safety assessment		                                                                     32
     4.1 Road safety management 		                                                                32
        4.1.1   Background		 32
        4.1.2   Transition to a new strategic framework		                                         32
        4.1.3   Funding for the new strategic framework		                                         37
        4.1.4   Traffic police		                                                                  37
        4.1.5   The Road Safety Observatory		                                                     43
     4.2 Safer roads and networks		                                                               44
     4.3 Safer vehicles		                                                                         45
        4.3.1   Institutions with responsibilities concerning vehicles and transport policies		   45
DOMINICAN REPUBLIC
4.4 Safe road-user behaviour 49
4.4.1 Institutions and programmes for regulating the behaviour of road users 49
4.5 Post-crash response 53
4.5.1 Institutions and public programmes 53
5. Conclusions and recommendations for strengthening national road
safety management capacities 56
5.1 A new institutional framework for road safety in the Dominican Republic 56
5.2 Content of the road safety plan for the Dominican Republic 59
Annex1: International Alliance for Responsible Drinking (IARD) Drink-driving
assessment of the Dominican Republic 63
Bibliography
73
Tables
Table 1.1
Foreign investment income: Dominican Republic and selected countries, 2006-2014 10
Table 1.2
Foreign investment inflows to the Dominican Republic, by sector, 2006-2014 11
Table 1.3
Foreign investment inflows to the Dominican Republic, by country of origin, 2006-2014 11
Table 3.1
Overview of the road network 17
Table 3.2
Public revenue from motor vehicle registration and transfers 19
Table 3.3
Vehicle ownership, by gender, 2015 19
Table 3.4
Distribution of light-vehicle imports, by region or country of origin, 2011-2016 20
Table 3.5
Distribution of bus imports, by region or country of origin, 2011-2016 21
Table 3.6
Distribution of jeep imports, by region or country of origin, 2011-2016 21
Table 3.7
Distribution of truck imports, by region or country of origin, 2011-2016 21
Table 4.1
Number of police officers per 100,000 inhabitants (selected years), 1937-2010 38
Table 4.2
Distribution of public transportation services, by type of AMET-registered vehicle 40
Table 4.3
Distribution of types of emergency responses 42
Table 4.4
Distribution of emergency responses by geographical location 42
Table 4.5
Distribution of DGTT-registered vehicles by type of vehicle 46DOMINICAN REPUBLIC Figures Figure 1.1 Trends in rurality in the Dominican Republic, 1960-2014 8 Figure 1.2 Percentage of the population in the most populous cities of the Dominican Republic, 2015 9 Figure 1.3 GDP growth: Dominican Republic and Latin America, 2000 and 2007-2015 9 Figure 1.4 Composition of GDP in 2016 (Percentages) 10 Figure 1.5 Map of the Dominican Republic 12 Figure 2.1 Institutional map of public road safety organizations 15 Figure 3.1 Number of traffic fatalities per 100,000 persons per year, 2003-2015 16 Figure 3.2 Types of roads in the Dominican Republic 16 Figure 3.3 Total number of motor vehicles, by year, 2004-2015 18 Figure 3.4 Percentage of motorcycles in the total motor vehicle fleet 18 Figure 3.5 Number of traffic fatalities per 10,000 vehicles per year (raw and corrected data), 2003-2015 22 Figure 3.6 Number of traffic fatalities per 100,000 vehicles per month (raw and corrected data), 2003-2015 23 Figure 3.7 Number of traffic fatalities per 1,000,000 persons per month (raw and corrected data), 2003-2015 24 Figure 3.8 Number of male traffic fatalities per 100,000 men per year (raw and corrected data), 2003-2015 25 Figure 3.9 Number of female traffic fatalities per 100,000 women per year (raw and corrected data series), 2003-2015 25 Figure 3.10 Percentage of road crashes resulting in fatalities, by type of collision, 2007-2010 27 Figure 3.11 Percentage of road crashes resulting in fatalities, by type of collision, 2011-2015 27 Figure 3.12 Percentage of traffic fatalities, by age group, 2010-2014 28 Figure 3.13 Number of traffic tickets issued for a failure to wear a seat belt 29 Figure 3.14 Number of traffic offences associated with selected high-risk behaviours, 2010-2015 30 Figure 3.15 Institutional map of road crash data systems 31 Figure 4.1 Municipalities covered by the 911 system 55 Figure 5.1 Three-pronged strategy for building national road safety capacity 62
DOMINICAN REPUBLIC

 Introduction

Road safety is an important sustainable development goal, but there is little awareness of this issue, and
road safety works are seriously underfunded. Every year, some 1.3 million people die in vehicle collisions
around the world, and another 20 million to 50 million sustain non-fatal injuries. Approximately 90% of all
the people killed in road crashes are in low- and middle-income countries, although they own only around
54% of the world’s motor vehicles. More than half of global road traffic deaths occur among pedestrians or
drivers of motorized two-wheeled vehicles (WHO, 2015).

In 2010, the United Nations General Assembly proclaimed 2011-2020 to be the United Nations Decade of
Action for Road Safety. General Assembly resolution A/70/L.44, adopted in April 2016, reaffirms the road-
safety-related Sustainable Development Goal and targets outlined in the 2030 Agenda for Sustainable
Development, such as target 3.6, which aims to reduce global road traffic deaths and injuries by 50% by
2020, and target 11.2, which aims to provide access to safe, affordable, accessible and sustainable transport
systems for all by 2030.

Regrettably, there has been little improvement in global road safety (measured in terms of the number of
deaths, injuries and crashes) since the launch of the Decade of Action for Road Safety, and this is particularly
true for the Latin American and Caribbean region (Pérez-Salas and Nazif-Muñoz, 2015). Therefore, much
remains to be done to meet the goal set for the Decade, especially in this region.

In 2010, the Economic Commission for Europe (ECE) and the Economic Commission for Latin America and
the Caribbean (ECLAC) completed the fifth-tranche United Nations Development Account project entitled
Improving Global Road Safety: Setting Regional and National Road Traffic Casualty Reduction Targets,
which successfully supported governments in low- and middle-income countries in developing national
road safety targets and exchanging best practices for achieving those targets by 2015. In Latin America and
the Caribbean, this project has had a positive impact in helping countries of this region to improve various
aspects of their institutional framework for the promotion of road safety (Nazif-Muñoz and Pérez-Salas, 2013).

The ninth-tranche United Nations Development Account project entitled Strengthening the National
Road Safety Management Capacities of Selected Developing Countries and Countries with Economies
in Transition focuses on assisting four such countries to strengthen their road safety management system
capacities and to effectively address and improve national road safety. The project partners are three of
the United Nations regional commissions: the Economic Commission for Europe (ECE), the Economic
Commission for Latin America and the Caribbean (ECLAC) and the Economic and Social Commission for Asia
and the Pacific (ESCAP). The ECE Sustainable Transport Division is leading and coordinating the project.

The Dominican Republic is one of the four countries, along with Viet Nam, Georgia and Albania, that are
participating in this project. As will be seen throughout this assessment, the Dominican Republic has one of
the highest traffic mortality rates not only in the region, but in the entire world. A radical realignment of the
practices and goals of its road safety management system is therefore required if a significant reduction is to
be made in the country’s traffic mortality and morbidity indicators.

This report is divided into five parts. The first section provides a brief overview of the country’s population,
economy and climate. The second offers a brief discussion of the legal and political framework for road
safety policies. The third section looks at the main trends in traffic fatalities and injuries, infrastructure
investment, vehicle fleets and information system operations. The fourth, focuses on the public
institutions whose objectives and mission statements address road safety issues and assesses the past
and present approaches taken to road safety in the country. It also includes an exploration of the unique
opportunity for tackling the road safety challenge offered by the institutional paradigm shift currently
taking place in the country. The fifth and final section offers concluding remarks and some preliminary
insights into ways of improving the road safety management system, which is currently under review,
and of reducing traffic-related mortality and morbidity. Specific recommendations are also made

                                                                                                               7
DOMINICAN REPUBLIC
regarding three institutional measures that could enhance the country’s institutional framework for road
safety and seven substantive measures associated with policies and projects that can directly impact
roadway infrastructure, vehicle safety, roadway users’ behaviour and post-crash response capacity.
These recommendations take into account the new institutional climate in the Dominican Republic and
are aimed at strengthening the institutions recently created under the newly adopted Mobility, Ground
Transportation, Transit and Road Safety Act.
1. Country snapshot
1.1 Demographics
The Dominican Republic has an estimated population of 10.65 million, up from 9.44 million at the time of
the 2010 census (World Bank, 2017). The demographic transition in this country has exhibited three different
trends during three different periods. In 1950-1955, the transition was in an incipient phase during which
population growth was relatively slow owing to a combination of high mortality and fertility rates. Then, in
1985-1990, it shifted into a moderate phase characterized by a decline in mortality while the fertility rate
remained high, causing the population growth rate to rise. Finally, in 2005-2010, a full-fledged transition
was observed, with a more marked downturn in fertility leading to a reduction in the growth rate (ECLAC,
2007). Two significant changes in composition are to be noted. First, while, in 1950, 51.7% of the population
was between the ages of 15 and 64, the proportion of the population in this age group had risen to 62.8%
by 2010. Second, between 1960 and 2015, the Dominican Republic witnessed a considerable increase in its
urbanization. In 1960, 70% of the population lived in rural areas but by 2014, this figure had fallen to 20%
(see figure 1.1).
Figure 1.1
Trends in rurality in the Dominican Republic, 1960-2014
80
70
60
50
40
30
20
10
0
1984
1986
1988
1960
1976
1990
1992
1994
1996
1998
2000
2002
2004
2006
2008
2010
2012
2014
1962
1964
1966
1968
1970
1972
1974
1978
1980
1982
Source: World Bank, “World Development Indicators”, 2017 [online] http://data.worldbank.org/indicator.
Currently the largest cities are Santo Domingo, Santiago, La Vega, San Cristobal and San Pedro de Macorís
(see figure 1.2).
8DOMINICAN REPUBLIC
Figure 1.2
Percentage of the population in the most populous cities of the Dominican Republic, 2015
30
27,63
25
20
15
10
5,25
5
2 1,99 1,96
0
Santo Domingo Santiago La Vega San Cristóbal San Pedro
de Macorís
Source: National Statistical Office, “Provinciales y municipales”, 2015 [online] https://www.one.gob.do/provinciales-y-municipales.
1.2 The economy
The Dominican Republic is the Caribbean’s largest economy, with a gross domestic product (GDP) in 2015
estimated at $ 67.103 billion (three times the size of Guatemala’s). Its growth has been robust over the past
decade, with declines being seen only in 2009, 2011 and 2012.1 The only three years in which its economic
growth rate was lower than the Latin American average during this period were 2008, 2011 and 2012.
Figure 1.3
GDP growth: Dominican Republic and Latin America, 2000 and 2007-2015
10
8
6
GDP growth in
the Dominican Republic
4 GDP growth in
Latin America
2
0
2000 2001 2002 2003 2004 2005 2006 2007 2008 2009 2010 2011 2012 2013 2014 2015
-2
-4
Source: Economic Commission for Latin America and the Caribbean (ECLAC), Updated Economic Overview of Latin America and the
Caribbean, Santiago, 2016 and national sources.
1
See ECLAC (2016a).
9DOMINICAN REPUBLIC
The largest share of GDP, by activity, corresponds to industry (25%), followed by commerce (9%), transport
and communications (9%), construction (9%), agriculture (6%), public administration (4%), and health and
social work (3%).
Figure 1.4
Composition of GDP in 2016
(Percentages)
6,00%
25,00% Agriculture
Other sectors
Public administration
35,00%
Health care and social work
Transport and communications
9,00%
Commerce
Construction
9,00%
industry
4,00%
3,00% 3,00%
Source: National Statistical Office, “Cuentas nacionales”, 2016 [online] https://www.one.gob.do/economicas/cuentas-nacionales.
The Dominican Republic is fairly well-positioned in terms of its integration into international markets when
compared to many other Latin American and Caribbean countries. Table 1.1 shows how it compared with Haiti,
Jamaica and Uruguay in 2006-2014. As may be seen from the table, the Dominican Republic received more
foreign investment than either Haiti or Jamaica, with an average inflow during this period of US$ 2.16 billion.
In comparison with Uruguay, a country with 3.7 million habitants, however, the Dominican Republic lagged
behind. This result can, in large part, be attributed to Uruguay’s proximity to Argentina and Brazil.
Table 1.1
Foreign investment income: Dominican Republic and selected countries, 2006-2014
(Millions of dollars)
2006 2007 2008 2009 2010 2011 2012 2013 2014
Dominican Republic 1 085 1 667 2 870 2 165 2 024 2 277 3 142 1 991 2 209
Haiti 161 75 29 55 178 119 156 186 99
Jamaica 882 866 1 437 541 228 218 413 654 699
Uruguay 1 493 1 329 2 106 1 529 2 289 2 504 2 536 3 032 2 755
Source: Economic Commission for Latin America and the Caribbean (ECLAC), Foreign Direct Investment in Latin America and the
Caribbean, 2015 (LC/G.2641-P), Santiago, 2015.
10DOMINICAN REPUBLIC
As may be seen from table 1.2, the services sector receives the largest share of foreign investment, followed
by manufactures. This has important implications in terms of infrastructure, since much of this type of
investment is associated with transportation infrastructure projects. Nevertheless, specific plans need
to be designed in order to attract more foreign investment to support roadway and other transportation
infrastructure projects.
Table 1.2
Foreign investment inflows to the Dominican Republic, by sector, 2006-2014
(Millions of dollars)
2006 2007 2008 2009 2010 2011 2012 2013 2014
Natural resources 107 30 357 758 240 1 060 1 169 93 -39
Manufactures -168 184 574 280 566 355 1 257 404 607
Services 1 146 1 453 1 938 1 128 1 218 862 716 1 494 1 640
Source: Economic Commission for Latin America and the Caribbean (ECLAC), Foreign Direct Investment in Latin America and the
Caribbean, 2015 (LC/G.2641-P), Santiago, 2015.
The breakdown of foreign investment inflows by country of origin (see table 1.3) reflects the influence
exerted by the member countries of the North American Free Trade Agreement (NAFTA). As in the case
of Uruguay, proximity is an important consideration in understanding the distribution of this type of
investment. Agreements concerning motor vehicle imports are another influential factor in this case, since
Canada, Mexico and the United States all have large motor vehicle production and export industries.
Table 1.3
Foreign investment inflows to the Dominican Republic, by country of origin, 2006-2014
(Millions of dollars)
2006 2007 2008 2009 2010 2011 2012 2013 2014
Canada 142 113 383 773 696 1 126 851 143 158
Mexico 84 -124 055 273 433 73 -32 6 244
Netherlands 41 54 -73 96 50 28 10 83 70
United States 662 536 360 455 1 055 499 252 374 321
Venezuela (Bolivarian
17 53 11 31 208 70 55 47 44
Republic of)
Source: Economic Commission for Latin America and the Caribbean (ECLAC), Foreign Direct Investment in Latin America and the
Caribbean, 2015 (LC/G.2641-P), Santiago, 2015.
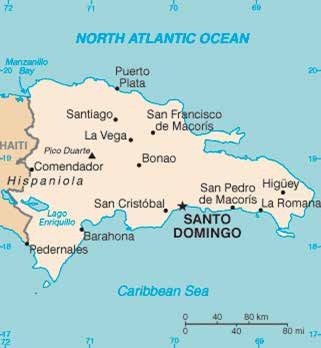
1.3 Topography, climate and geography
The Dominican Republic is located on the eastern two thirds of the island of Hispaniola, which it shares
with Haiti, in the Caribbean Sea along the boundary with the North Atlantic Ocean and has a territory of
48,670 square kilometres. It is a unitary presidential republic whose government is democratically elected.
The country is divided into 10 regions: North-east Cibao, North-west Cibao, North Cibao, South Cibao, El
Valle, Enriquillo, Higuamo, Ozama, Valdesia and Yuma. The capital and largest city is Santo Domingo. It has a
tropical maritime climate, with little seasonal temperature variation but with seasonal variations in rainfall.
11DOMINICAN REPUBLIC
Figure 1.5
Map of the Dominican Republic
Source: Google Maps, “Dominican Republic”, 2017 [online] http://bit.ly/2GxMhdl.
Disclaimer: The boundaries and names shown on this map do not imply official endorsement or acceptance by the United Nations.
2. Review of the legal and administrative framework for the promotion of road safety
2.1 The national legal framework for the promotion of road safety
The development of national road safety legislation has been an ongoing process in the Dominican Republic.
One of the first laws of this type –Act No. 16, which deals with the regulation of traffic flows– was introduced
in 1963. In 1966, under Act No. 165, the General Directorate of Ground Transportation (DGTT) was created to
serve as the lead regulatory agency in this field. One of the most important pieces of legislation in this area,
Act No. 241-67, which governs the actions of all road users, was passed in 1967. Changing circumstances
within the country, along with the steps taken to address new political and economic challenges, account
for the large number of amendments and supplements to this law that have been introduced. In 2017, the
government initiated several effective measures for the promotion of transport policy development, and
work was undertaken in the road transport sector to frame the necessary legislative foundation and to
further develop the system’s institutional structure. Two specific measures of significance in this connection
were the establishment of the Presidential Commission on Road Safety and the passage of the Mobility,
Ground Transportation, Transit and Road Safety Act (Act No. 63-17).
The Constitution of the Dominican Republic contains a number of provisions that have a direct bearing on
the regulation of transportation and transit: article 37 states that everyone has an inviolable right to life and
that under no circumstance will capital punishment be imposed; article 46 states that everyone who is in the
country legally has the right to freedom of movement; and article 42 states that everyone has the right to
have their physical, psychological and mental well-being respected and to live without violence.
Transport management and regulation are now governed by the Mobility, Ground Transportation, Transit
and Road Safety Act, which directs that transport policy is to be formulated and implemented by the
National Ground Transportation and Traffic Institute (INTRANT).
12DOMINICAN REPUBLIC
Road transport, in general, and the rights and responsibilities of all participants in transport activities are
also regulated by the Mobility, Ground Transportation, Transit and Road Safety Act, as are traffic flows and
traffic safety. This law sets out the main lines of traffic safety policy, government duties and obligations in
this connection, traffic rules and conditions, the design and placement of traffic signs and traffic marks, the
rights and obligations of road users and the general requirements for driving permit issuance and vehicle
registration. The law covers all Dominicans and foreign nationals who use the country’s roads and all
national and international vehicles in the country. Violations of traffic regulations are defined in the Mobility
Act, which refers to other Dominican laws for the determination of which types of actions incur civil, criminal
or administrative penalties. This law also covers the rules governing the use and protection of roads by road
owners and users, engineering, construction and owner organizations, and road use fees and payments.
Passenger transportation is mainly overseen by the National Ground Transportation and Traffic Institute
(INTRANT). Before that organization’s establishment, however, this work was done by the Ground
Transportation Technical Office (GTTO), which had been established under Presidential Decree No. 489 of
1987. The role of GTTO had involved redesigning bus routes and reallocating them to different operators,
with bus operations being subsidized in order to hold down passenger fares. The mission of GTTO was to
manage the public transportation system in such a way as to meet the mobility needs of the population.
Its vision statement focused on ensuring that it would serve as a model of public service that upheld
ethical standards, worked to achieve excellence in its field, kept operations flowing smoothly and used
leading-edge technology in order to have a positive impact on the quality of life of all Dominicans. Its legal
framework was composed of 17 national laws and 19 decrees governing various aspects of the work of
government offices. These statutes included the 20 different laws amending Act No. 241-67; some of the
most important of those amendments have been promulgated in Act No. 12 (on traffic fines), Act No. 114,
Act No. 61-92, Act No. 56-89, Act No. 56-86-15, Decrees Nos. 284-914, Act No. 160, Act No. 593 (on load
inspection), Act No. 146 (on insurance), Act No. 143 (prohibition of the use of mobile phones while driving),
Act No. 585, Act No. 513 (regulations applying to public transport drivers), Act No. 176-07, Act No. 76-00
(regulations applying to taxis), Act No. 547-70 (on pension funds for public transportation drivers). GTTO
was also governed by Decrees Nos. 178-94, 37-98, 448-97 (establishment of GTTO), 393-97 (establishment
of the Metropolitan Inland Transport Authority (AMET)), 447-05 (establishment of the Transit Reorganization
Office), 250-07 (establishment of the Ground Transportation Development Fund), Regulation No. 723-06 and
Resolution No. 3 of 2006, which prohibits alcohol consumption in motor vehicles.
Cargo transport is also covered by the Mobility Act. This law sets out the provisions governing the safety and
property maintenance requirements for roadway cargo transport operations, including those applying to
dangerous cargo, as well as operators’ rights, obligations and responsibilities. Previously, cargo transport was
governed by Act No. 241-92. There are also local regulations that place further restrictions on these activities.
For instance, the municipal government of Santo Domingo has specific regulations of its own, such as the
Cargo and Commercial Vehicles Regulation of Santo Domingo of 2013 (Government of Santo Domingo, 2013).
Labour regulations applying to commercial drivers are set out in Decree No. 25893 of 1 October 1993, which
establishes that drivers must not drive for more than 10 hours per day or 70 hours per week. They also must not
drive for more than 5 consecutive hours, and resting times between driving hours must not be less than 1 hour
and 30 minutes. These regulations are fully applicable to international transport as well but do not cover the
monitoring systems (tachographs) to be used or their installation, verification, technical servicing or maintenance.
Periodic technical inspection of vehicles in the Dominican Republic is covered by Act No. 241-07. This
regulation defines the timeline for obligatory tests of road transport vehicles based on their category
and function. GTTO used to be responsible for ensuring mechanical and physical vehicle inspections, but
those duties have now been taken over by INTRANT. By law, the inspections must cover the tyres, brakes,
seats, the vehicle body condition, lights, horn and a number of other elements. Under the new Mobility,
Ground Transportation, Transit and Road Safety Act, improved technical vehicle inspection procedures are
being introduced. The types of servicing and technical service lists, along with the corresponding timelines,
conditions, procedures and requirements pertaining to service companies registered in the Dominican
13DOMINICAN REPUBLIC Republic, are defined in Act No. 241-07 and the new Mobility Act. The regulations are designed to ensure that the technical features of all transport vehicles are in accordance with Dominican laws and standards. The Dominican Republic is not a contracting party to the United Nations Agreement concerning the Adoption of Uniform Conditions for Periodical Technical Inspections of Wheeled Vehicles and the Reciprocal Recognition of Such Inspections of 1997 or of the United Nations Agreement concerning the Adoption of Uniform Technical Prescriptions for Wheeled Vehicles, Equipment and Parts which can be Fitted and/or be Used on Wheeled Vehicles and the Conditions for Reciprocal Recognition of Approvals Granted on the Basis of These Prescriptions of 1958. 2.2 Transposition of international regulations and agreements The Dominican Republic signed the Convention on Road Traffic in 1949 and ratified it in 1957. It also signed the Protocol on Road Signs and Signals that same year. 2.3 The institutional framework for the promotion of road safety The legal and institutional framework for the promotion of road safety in the Dominican Republic is composed of numerous overlapping laws and centralized and local public agencies. These laws and agencies address all the pillars of activities listed in the Global Plan for the Decade of Action for Road Safety, and the country has also recently introduced a target of a 20%-30% reduction in the two most commonly used road safety indicators: fatalities and injuries. Figure 2.1 maps out the institutions which had contributed directly and/or indirectly to road safety policies, programmes and projects prior to the introduction of the Mobility Act. Most of these agencies focus on one of the five pillars set out in the Global Plan, but some, for instance the Ministry of Public Works and Communications and the General Directorate of Ground Transportation (DGTT), have functions that involve areas included in two or more pillars. There are also a considerable number of cross-cutting components that are depicted by the overlapping institutional identifiers shown in the figure. For example, there are eight institutions that target different aspects of issues associated with the “road user behaviour” pillar. Some agencies also create ad hoc sub-units to reach out to institutions dealing with other pillars. Examples include the National Programme to Reduce Traffic Deaths of the Ministry of Public Health and the National Road Education School of the Ground Transportation Development Fund (FONDET). Municipal governments have primarily focused on the infrastructure and road user behaviour pillars. The fact that the country’s municipal governments have differing levels of resources and priorities has important implications, since these differences can have an impact on road safety indicators at the local level, as well as at the aggregate or national level. The number of agencies dealing with the infrastructure and post-crash response pillars is much smaller than the number that are focusing on safer vehicles and road user behaviour. This suggests that these two pillars are the ones in which there are more coordination problems and in which resources may not necessarily be allocated appropriately. Lastly, the dotted line pointing to the Presidential Commission on Road Safety reflects the fact that, formally, this institution is expected to coordinate the work of most of the other institutions appearing in this map. However, in reality, in order to fulfil its mandate, it has to work with three other agencies: (i) the Ministry of Internal Affairs and the Police Force; (ii) the Attorney General’s Office; and (iii) the Inland Revenue Agency. The Presidential Commission on Road Safety has initiated a public review and redesign of the national road safety plan, and many of the topics and sub-topics to be included in the new plan match up with one or more of the five pillars of the Global Plan. It is therefore quite likely that the new plan will include traditional types of measures that have proven to be effective in the past. 14
DOMINICAN REPUBLIC

      Figure 2.1
      Institutional map of public road safety organizations

        Road safety                                             Road user          Post-crash          CPSV:   Presidential
        management      Infrastructure   Safe vehicles                                                         Commission on Road
                                                                behaviour           response
                                                                                                               Safety
                                                                                                       MPWC: Ministry of Public
                                                                                                               Works and
                                                                             National                          Communications
                           MPWC                          DGTT                                   911
                                                                              Police                   DGTT: General Directorate
                                                                                                               of Ground
                                                                                                               Transportation
                                                                                           Ministry
                                                          PREMAT              AMET                     PREMAT: National Programme
                                                                                           of Health
                                                                                                               to Reduce Traffic
            CPSV                                                                                               Deaths
                                                                                                       AMET: Metropolitan Inland
                                                                              Military                         Transport Authority
                                                                            Commission                 GTTO: Ground
                                                                                                               Transportation
                                                                    Ministry of                                Technical Office
                                            GTTO                                                       ORT:    Transit
                                                                    Education
                                                                                                               Reorganization
                                                                                                               Office
                                                                   National Road                       FONDET: Ground
                                             ORT                                                               Transportation
                                                                   Safety School
                                                                                                               Development Fund

                          City Halls       FONDET                   Municipal
                                                                   governments

Source: Prepared by the authors.

 3.        Road safety trends over the last decade

3.1        Road safety data collection and compilation
Statistics on road accidents are compiled by the National Statistical Office, which publishes this information
on its website (http://www.one.gov.do) every year. Additional data can be obtained in an Excel format by
submitting a Freedom of Public Information Request. By law, that information must be made available
within 15 working days. Data on road crashes are collected for international/intra-urban roads and for local/
secondary roads by different police units.

The General Office of Epidemiology (DIGEPI) of the Ministry of Public Health and Social Assistance collects
data on all mortalities and categorizes each case on the basis of mortality codes. It has an extensive
technological network, and health professionals can take the required information from hospital records
and enter it directly into the system. In the case of traffic crashes, in accordance with Decision No. 4-13 of the
Ministry of Public Health and Social Assistance, health professionals must notify DIGEPI within a week of the
occurrence of each such event.

The official statistics on road safety for 2015 indicate that there were approximately 20 fatalities per 100,000
inhabitants. Although the change may partly be attributable to the effects of the economic crisis in 2015,
this is a slight improvement over the figure for 2010 (an average of 23 fatalities per 100,000 inhabitants).
In comparison to the Latin American and Caribbean average of 15.9 deaths per 100,000, the Dominican
Republic’s road fatality index is 21% higher.

                                                                                                                                     15
DOMINICAN REPUBLIC
Figure 3.1
Number of traffic fatalities per 100,000 persons per year, 2003-2015
25
20
Traffic fatalities
per 100,000 persons
15
10
5
0
2003 2004 2005 2006 2007 2008 2009 2010 2011 2012 2013 2014 2015
Source: National Statistical Office, “República Dominicana: número de muertes ocurridas y registradas en accidentes de tránsito por
año y sexo según año, 2033-2016”, 2016 [online] https://www.one.gob.do/Multimedia/Download?ObjId=41963.
3.2 Road infrastructure
Figure 3.2
Types of roads in the Dominican Republic
Source: Dominican Republic, “Dominican Republic Recommended Roads Map”, 2017 [online] http://www.godominicanrepublic.
com/wp-content/uploads/2014/02/national-map-english-spanish-roads-02.pdf.
Disclaimer: The boundaries and names shown on this map do not imply official endorsement or acceptance by the United Nations.
16DOMINICAN REPUBLIC
The Ministry of Public Works and Communications is responsible for building, expanding, repairing and
maintaining transport infrastructure works, as well as for organizing, overseeing, coordinating and planning
ground transportation systems throughout the Dominican Republic. The prime objectives of this institution
are to provide the safest possible roads in order to reduce the number and consequences of traffic crashes
and to help expedite and smooth out traffic flows throughout the Dominican Republic and to ensure that
the road and highway networks support the mobility of goods, services and people in the safest, fastest and
most efficient way possible.
Table 3.1
Overview of the road network
Type Km % network % network vehicles
Main (primary) 1 081.1 7.8% 54.9%
Regional (secondary) 1 830.9 13.2% 22.0%
Local (tertiary) 2 010.0 14.5% 18.8%
Subtotal: roads 4 921.9 35.6% 95.8%
Asphalt roads 872.8 6.3% 1.3%
Gravel roads 3 221.1 23.3% 2.5%
Dirt roads 4 813.3 34.8% 1.0%
Subtotal: other routes 8 912.2 64.4 4.2%
Total: network 13 834.1 100% 100%
Source: Ministry of Public Works and Communications, “Oficina de Acceso a la Información Pública Ética y Transparencia Sistema
de Asistencia y Seguridad Vial”, 2016 [online] http://www.mopc.gob.do/media/2450/presentaci_n_sistema_de_asistencia_vial__
actualizado_.pptx
There is a plan in place for the improvement of more than 2,000 kilometres of public roads, with the Ministry
of Public Works and Communications serving as the lead agency for this initiative. Table 3.1 shows the
distribution of the road network by road type and vehicle capacity.
There has been a considerable amount of investment in road signage and in the maintenance of both
highways and secondary roads. In 2014, for example, road infrastructure projects for a total of RD$ 17.161
billion (approximately US$ 36.8 million) were being executed. According to the Dominican Republic Export
and Investment Centre, Dominican roadway infrastructure is among the largest and most modern of the
entire Caribbean region. The country currently has 8 international airports and 12 seaports, in addition to
having one of the largest highway systems in the region in proportion to its size. Foreign direct investment in
infrastructure projects (including telecommunications, electricity, real estate and transportation) amounted
to some US$ 8,835,800,000 in 2004-2013.
3.3 Road vehicle fleet
The prosperity enjoyed by the Dominican Republic has had an impact on its vehicle fleet. Figure 3.3 shows
that, while there were approximately 2,200,000 registered motor vehicles in 2003, by 2015 the fleet had
expanded by 63% to approximately 3,600,000 motor vehicles. A large share of this fleet is made up of
motorcycles, which are the type of vehicle with the fastest growth rate of all. In 2003, there were 1,020,000
registered motorcycles, but by 2015 the number of motorcycle had jumped by 90%. In fact, as shown in
figure 3.4, the percentage of the vehicle fleet accounted for by motorcycles has been climbing steadily, rising
from 46.5% in 2004 to 53.9% in 2015. The need for specific measures to tackle all the challenges associated
with this means of transportation is therefore clear.
17DOMINICAN REPUBLIC
Figure 3.3
Total number of motor vehicles, by year, 2004-2015
4 000 000
3 500 000
3 000 000
Total number
2 500 000 of motor-vehicles
Lineal (Total number
2 000 000 of motor-vehicles)
Total number
1 500 000 of motorcycles
Lineal (Total number
1 000 000 of motorcycles)
500 000
0
2003 2004 2005 2006 2007 2008 2009 2010 2011 2012 2013 2014 2015
Source: Inland Revenue Agency (DGII), Parque vehicular 2015, Santo Domingo, 2016 [online] http://www.dgii.gov.do/
informacionTributaria/estadisticas/parqueVehicular/Documents/ParqueVehicular2015.pdf.
Figure 3.4
Percentage of motorcycles in the total motor vehicle fleet
56
54
52
50
48
46
44
42
2003 2004 2005 2006 2007 2008 2009 2010 2011 2012 2013 2014 2015
Source: Inland Revenue Agency (DGII), Parque vehicular 2015, Santo Domingo, 2016 [online] http://www.dgii.gov.do/
informacionTributaria/estadisticas/parqueVehicular/Documents/ParqueVehicular2015.pdf.
The government of the Dominican Republic now collects close to US$ 216 million per year for vehicle
registration and sales recording services, with the bulk of that amount corresponding to the fees charged for
the issuance of a first-time licence plate (DGII, 2016). As a result of the explosive growth of the country’s vehicle
fleet, these revenues shot up from US$ 132 million in 2011 to US$ 216 million in 2015, for an increase of 63%.
18DOMINICAN REPUBLIC
Table 3.2
Public revenue from motor vehicle registration and transfers
Dominican pesos US dollars
Type of transaction Percentage
(Millions) (Millions)*
Issuance of first licence plate 6 990.0 150.3 69.5%
Renewal of documents 1 503.0 32.32 14.9%
Transfers 949.0 24.40 9.4%
Change or renewal of (actual) vehicle licence plates 54.8 1.17 0.5%
Copy of documents 45.1 0.96 0.4%
Co2 emissions 515.3 11.07 5.1%
Total 10 057.2 216.282 100%
Source: Inland Revenue Agency (DGII), Parque vehicular 2015, Santo Domingo, 2016 [online] http://www.dgii.gov.do/informacionT
ributaria/estadisticas/parqueVehicular/Documents/ParqueVehicular2015.pdf.
*Rate calculated as of 5 December 2016 by the Central Bank of the Dominican Republic: http://www.bancentral.gov.do/estadisticas_
economicas/mercado_cambiario/ .
The gender-based distribution of vehicle ownership is a traditional one, with a majority of the owners of
each type of vehicle being male. The gender gap is narrower in the case of light vehicles and jeeps, however,
with the percentage of such vehicles owned by women standing at 31.2% and 35.9%, respectively. The
widest gender gaps are seen in the ownership of transport vehicles such as buses, heavy trucks and dump
trucks. While ownership records indicate who registered the vehicle, this does not necessarily indicate who
drives the vehicle, but it nonetheless serves as a good proxy variable for gauging which people are more
likely to be exposed to transportation-related hazards.
Table 3.3
Vehicle ownership, by gender, 2015
(Percentages)
Type of vehicle Women Men Total
Light vehicles 31.2% 68.8% 100%
Buses 19.9% 80.1% 100%
Jeeps 35.9% 64.1% 100%
Heavy trucks 11.9% 88.1% 100%
Motorcycles 16.0% 84.0% 100%
Dump trucks 11.7% 89.3% 100%
Other 10.9% 89.1% 100%
Source: Inland Revenue Agency (DGII), Parque vehicular 2015, Santo Domingo, 2016 [online] http://www.dgii.gov.do/
informacionTributaria/estadisticas/parqueVehicular/Documents/ParqueVehicular2015.pdf.
According to the Inland Revenue Agency, this gender distribution is relatively stable across provinces. However,
there are provinces, such as Bahoruco, Elías Piña and San José de Ocoa, in which male vehicle ownership
surpasses 85% of the total. The National District is the only one in which this figure is close to 70%.
There is no single institution that is fully in charge of implementing road safety policies. There are, however,
a number of different pieces of legislation that deal with the subject. Articles 170 and 212 of Act No. 2441
cover various aspects of road safety, but consideration should be given to framing a single, overarching
technical regulation that consolidates and systematizes the currently scattered statutes dealing with motor
vehicle safety requirements.
19DOMINICAN REPUBLIC All the vehicles in the Dominican Republic are imported, but a considerable number of the motorcycles do not enter as assembled vehicles; instead, the motorcycle parts are imported and then are assembled in the country. This practice, which seems to be quite widespread, makes the proper registration of these vehicles quite difficult. According to the Inter-American Development Bank (IDB), there is a lack of coordination between DGTT and the Border Security Agency, which focuses entirely on restricting the entry of vehicles that have their steering wheel on the right-hand side (IDB, 2015). Since 2007, a decrease in vehicle imports has been seen, with the number of vehicles entering the Dominican Republic in that year (30,000) falling to 21,000 by 2012. One factor that may help to account for this trend is the high taxes levied on retail vehicle sales. Another factor that has shaped the configuration of the vehicle fleet has been the importation of second-hand motor vehicles. By law, only vehicles that are less than five years old can be brought into the country. Nevertheless, according to IDB figures, the number of second-hand vehicle imports is twice as high as imports of new vehicles. According to information provided by the Inland Revenue Agency of the Dominican Republic, the majority of imported vehicles come from Japan; the quantities of vehicle imports coming from Europe, the United States and the Republic of Korea are also considerable (see tables 3.4-3.7). Vehicles from the Republic of Korea, however, have to have the position of their steering wheels changed, which has certain safety implications, since this also entails repositioning the airbags and rear-view mirrors, among other things. The installation of airbags and of seat belts in the rear seats is not mandatory, and the country therefore relies on the regulations in place in countries that export motor vehicles to the Dominican Republic. This is an important failing, because, although European and North American countries have high safety standards, those standards are not necessarily replicated in some Asian and Latin American countries. This is especially a problem in the case of trucks, since, as shown in table 3.7, more than 10% of the Dominican Republic’s imports of this type of vehicle come from countries other than the United States, Japan, European countries and the Republic of Korea. Table 3.4 Distribution of light-vehicle imports, by region or country of origin, 2011-2016 Origin Number Percentage Europe 87 362 11.3 Japan 565 761 73.2 Republic of Korea 49 629 6.4 United States 57 169 7.4 Other 13 458 1.7 Total 773 019 100 Source: Inland Revenue Agency (DGII), Parque vehicular 2015, Santo Domingo, 2016 [online] http://www.dgii.gov.do/ informacionTributaria/estadisticas/parqueVehicular/Documents/ParqueVehicular2015.pdf. 20
DOMINICAN REPUBLIC

Table 3.5
Distribution of bus imports, by region or country of origin, 2011-2016

 Origin                                           Frequency                             Percentage
 European countries                                    3 949                                   4.5
 Japan                                                51 338                                  58.3
 Republic of Korea                                    11 699                                  13.3
 United States                                        12 039                                  13.7
 Other                                                 9 084                                  10.3
 Total                                                88 109                                  100

Source: Inland Revenue Agency (DGII), Parque vehicular 2015, Santo Domingo, 2016 [online] http://www.dgii.gov.do/
informacionTributaria/estadisticas/parqueVehicular/Documents/ParqueVehicular2015.pdf.

Regulations on the use and circulation of motorcycles are quite limited in scope. For instance, the installation
and functionality of motorcycles’ brake systems are not covered by vehicle safety standards. In addition, as
mentioned earlier, tracing the origin of these vehicles is extremely difficult. As shown in tables 3.4-3.7, the
Inland Revenue Agency compiles information regarding the country of origin of light motor vehicles, trucks,
buses and jeeps, but not motorcycles. This poses a challenge for policymakers seeking to determine what
types of safety regulations actually apply to these vehicles. An assessment of how vulnerable these vehicles
and their drivers and passengers is thus a necessary step towards identifying what types of regulations and
monitoring systems should be introduced.

Table 3.6
Distribution of jeep imports, by region or country of origin, 2011-2016

 Origin                                             Number                              Percentage
 European countries                                   15 580                                  4.4
 Japan                                               233 099                                 65.3
 Republic of Korea                                    42 206                                 11.8
 United States                                        60 362                                 16.9
 Other                                                 5 871                                  1.6
 Total                                               357 028                                 100

Source: Inland Revenue Agency (DGII), Parque vehicular 2015, Santo Domingo, 2016 [online] http://www.dgii.gov.do/
informacionTributaria/estadisticas/parqueVehicular/Documents/ParqueVehicular2015.pdf.

Table 3.7
Distribution of truck imports, by region or country of origin, 2011-2016

 Origin                                           Frequency                             Percentage
 European countries                                    16 605                                4.2
 Japan                                                288 715                               73.6
 Republic of Korea                                     11 531                                2.9
 United States                                         33 455                                8.5
 Other                                                 42 089                               10.7
 Total                                                392 395                                100

Source: Inland Revenue Agency (DGII), Parque vehicular 2015, Santo Domingo, 2016 [online] http://www.dgii.gov.do/
informacionTributaria/estadisticas/parqueVehicular/Documents/ParqueVehicular2015.pdf.

                                                                                                              21
DOMINICAN REPUBLIC
There is no regulation that establishes standards for the use of gasoline or diesel fuels. Furthermore, the
technicians who install vehicle fuel systems are not formally trained. For the most part, the installation of
these systems is carried out in workshops in which safety standards are poor.
3.4 Road safety indicators
3.4.1 Traffic fatality, injury and accident rates
The following section is based on information drawn from the Metropolitan Inland Transport Authority’s
crash data set, which is processed, without the use of corrective factors, by the National Office of Statistics.
This data set was chosen because it provides information compiled on a monthly basis and specifies the
types of road users involved, including their sex and age. A corrective factor of 1.3 has been applied in order
to derive an alternative to the official figures.
Rates are also given by vehicle fleet and population. While the first of these denominators is usually
preferred because it may capture mobility patterns, the second one is a useful option for inter-country
comparisons (Nazif, Quesnel-Vallée and Van den Berg, 2015). Caution should also be exercised when
using vehicle fleets as the denominator because a rapid expansion of a vehicle fleet may bring fatality and
injury rates down artificially.
Figure 3.5
Number of traffic fatalities per 10,000 vehicles per year (raw and corrected data), 2003-2015
10
9
8
7
Traffic fatalities
per 10,000 vehicles
6
Traffic fatalities
5 per 10,000 vehicles
(corrected data series)
4
3
2
1
0
2003 2004 2005 2006 2007 2008 2009 2010 2011 2012 2013 2014 2015
Source: Inland Revenue Agency (DGII), Parque vehicular 2015, Santo Domingo, 2016 [online] http://www.dgii.gov.do/
informacionTributaria/estadisticas/parqueVehicular/Documents/ParqueVehicular2015.pdf; and National Statistical Office, “Cuentas
nacionales”, 2016 [online] https://www.one.gob.do/economicas/cuentas-nacionales.
Note: A corrective factor of 1.3 was used.
Figure 3.5 depicts a downward trend, even when the corrected data series is used, with a 22.6% decrease in
the corrected traffic fatality rate (from 9.3 traffic fatalities per 10,000 vehicles per year in 2003 to 7.2 traffic
fatalities per 10,000 vehicles per year in 2015). The drop in fatality rates seen in 2011 and 2012 coincided
with a downturn in productivity in the Dominican Republic, which suggests that the decreases seen during
that period are more likely to have been an effect of a change in mobility patterns associated with the
deceleration of the Dominican economy rather than being the result of improved road safety policies.
22DOMINICAN REPUBLIC
This downward trend can also be observed in the monthly data shown in figure 3.6. Even though these
figures reflect a positive situation, they should be interpreted with care. The monthly data also provide
various types of valuable information. For instance, it can be seen that over this 12-year period, the rate of
fatalities peaked during the month of December.
Figure 3.6
Number of traffic fatalities per 100,000 vehicles per month
(raw and corrected data), 2003-2015
10
9
8
Traffic fatalities
7
per 100,000 vehicles
6 Lineal (Number of fatalities
per 100,000 motor-vehicles)
5
Traffic fatalities
4 per 100,000 vehicles
(corrected data series)
3
Lineal (Number of fatalities
2 per 100,000 motor-vehicles
(corrected data))
1
0
January
April
July
October
January
April
July
October
January
April
July
October
January
April
July
October
January
April
July
October
January
April
July
October
January
April
July
October
January
April
July
October
January
April
July
October
January
April
July
October
January
April
July
October
January
April
July
October
January
April
July
October
Source: Inland Revenue Agency (DGII), Parque vehicular 2015, Santo Domingo, 2016 [online] http://www.dgii.gov.do/
informacionTributaria/estadisticas/parqueVehicular/Documents/ParqueVehicular2015.pdf; and National Statistical Office, “Cuentas
nacionales”, 2016 [online] https://www.one.gob.do/economicas/cuentas-nacionales.
Note: A corrective factor of 1.3 was used.
While the figures tabulated using the vehicle fleet as the denominator trace a downward trend over the past 12
years, the figures computed using the population as the denominator show just the reverse, since the rate for
2003 was 23.6 per 100,000 persons whereas, in 2015, the rate was 25.3, for an increase of 7%. What is more, in
2010 the rate was 29.2. This backs up the observation that measurements of traffic fatality rates that use the size
of the vehicle fleet as a denominator should be viewed with caution. More specifically, the trends do not correlate
as they would be expected to do if a set of road safety measures were being implemented. As in the case of figure
3.5, a drop in the rate for 2011 and 2012 is to be observed, which adds weight to the hypothesis that the decrease
is associated with the economic slowdown that occurred during that time in the Dominican Republic.
The monthly figures also show that the rate peaks in December. Further study of the mobility and
behaviour patterns associated with this month is required in order to determine what factors are behind
these peaks. One possible factor may be that alcohol consumption levels are higher in December because
of the holidays; another could be that more vehicles are purchased during this month in response to year-
end specials. From an institutional perspective, another factor could be that government resources are
reallocated to other pressing areas at this time of year; for instance, police officers may devote more of
their time to combating crime in December as the lure of holiday purchases may cause the incidence of
various types of theft to climb.
Gender is another factor that influences variations in traffic fatalities. The fact that, on average, men
engage in riskier behaviour than women is well documented. Generally accepted theories about risk-
23DOMINICAN REPUBLIC
taking lead to the expectation that there are observable differences between people who regularly
take risks and people who regularly avoid risks. The possibilities include: “(a) a naturally lower level of
arousal in men or (b) a socially instilled belief that risk-taking is a highly valued masculine tendency [that]
motivates high levels of risk-taking across contexts in men.” (Byrnes, Miller and Schafer, 1999, p. 368). In
other words, it is expected that gender differences will not vary by context (i.e., men will always take more
risks than women and the gap will remain relatively the same across contexts). There is, of course, a range
of theories that seek to explain gender gaps in risk-taking behaviour in specific contexts and others that
attribute risk-taking to other characteristics, such as age. Given the type of information that is available,
however, it would be of interest to undertake further research to determine whether gender differences
are prominent among the Dominican population and whether these trends are stable, divergent or
convergent over time.
Figure 3.7
Number of traffic fatalities per 1,000,000 persons per month
(raw and corrected data), 2003-2015
30
25
Traffic fatalities
20 per 1,000,000 persons
Lineal (Number of fatalities
15 per 1,000,000 persons)
Traffic fatalities
per 1,000,000 persons
10
(corrected data)
Lineal (Number of fatalities
5 per 1,000,000 persons
(corrected data))
0
January
May
September
January
May
September
January
May
September
January
May
September
January
May
September
January
May
September
January
May
September
January
May
September
January
May
September
January
May
September
January
May
September
January
May
September
January
May
September
Source: Inland Revenue Agency (DGII), Parque vehicular 2015, Santo Domingo, 2016 [online] http://www.dgii.gov.do/
informacionTributaria/estadisticas/parqueVehicular/Documents/ParqueVehicular2015.pdf; and National Statistical Office, “Cuentas
nacionales”, 2016 [online] https://www.one.gob.do/economicas/cuentas-nacionales.
Note: A corrective factor of 1.3 was used.
Figures 3.8 and 3.9 reflect a clear gender-based pattern that fits in with prevailing theories about the link
between gender and risk-taking behaviour. More men than women died in traffic accidents in 2003-2015.
While there was a slight narrowing of the gender gap in 2004 and 2005, the overall trend is in the opposite
direction. Not only did more men die in traffic crashes during the study period, but a comparison of the
trends for each sub-population shows that the female traffic fatality rate per 1,000,000 women has been
relatively stable. In 2003, the rate was 6.32 and, in 2015, the rate was almost identical (6.33). The highest
rate –7.52— was recorded in 2010. For men, on the other hand, the situation is more problematic. In 2003,
the rate was 40.88 and, in 2015, it was 44.35, for an increase of 10%. As in the case of women, the highest
traffic fatality rate for men was registered in 2010 (50.71). A comparison of the differentials between the
annual male and female traffic fatality rates indicates that the point of greatest convergence was in 2004,
but after that, the two trends began to diverge again.
24DOMINICAN REPUBLIC
Figure 3.8
Number of male traffic fatalities per 100,000 men per year (raw and corrected data),
2003-2015
50
45
40
Traffic fatalities among
35
males per 100,000 men
30 Traffic fatalities among
males per 100,000 men
25
(corrected data series)
20
15
10
5
0
2003 2004 2005 2006 2007 2008 2009 2010 2011 2012 2013 2014 2015
Source: Inland Revenue Agency (DGII), Parque vehicular 2015, Santo Domingo, 2016 [online] http://www.dgii.gov.do/
informacionTributaria/estadisticas/parqueVehicular/Documents/ParqueVehicular2015.pdf; and National Statistical Office, “Cuentas
nacionales”, 2016 [online] https://www.one.gob.do/economicas/cuentas-nacionales.
Note: A corrective factor of 1.3 was used.
Figure 3.9
Number of female traffic fatalities per 100,000 women per year
(raw and corrected data series), 2003-2015
8
7
6
Traffic fatalities among
females per 100,000
5 women
4 Traffic fatalities among
females per 100,000
women (corrected
3
data series)
2
1
0
2003 2004 2005 2006 2007 2008 2009 2010 2011 2012 2013 2014 2015
Source: Inland Revenue Agency (DGII), Parque vehicular 2015, Santo Domingo, 2016 [online] http://www.dgii.gov.do/
informacionTributaria/estadisticas/parqueVehicular/Documents/ParqueVehicular2015.pdf; and National Statistical Office, “Cuentas
nacionales”, 2016 [online] https://www.one.gob.do/economicas/cuentas-nacionales.
Note: A corrective factor of 1.3 was used.
25You can also read