The loTTery of birTh Giving all children an equal chance to survive
←
→
Page content transcription
If your browser does not render page correctly, please read the page content below
The lottery
of birth
Giving all children an equal chance to survive

                                                 I
Front cover: Bianca, six hours old, in Kopsiro
                       Health Facility in Bungoma County Kenya.
                       (Photo: Colin Crowley/Save the Children)
The lottery of birth

   II
The lottery
of birth
Giving all children an equal chance to survive

                                                 III
The lottery of birth

                       Save the Children works in more than 120 countries.
                       We save children’s lives.
                       We fight for their rights.
                       We help them fulfil their potential.

                       Acknowledgements
                       This report was written by José Manuel Roche, Lisa Wise, Dimitri Gugushvili and Luisa Hanna from Save the Children UK.
                       The production of the report would have not been possible without invaluable inputs and feedback from many colleagues
                       across the global Save the Children Movement. Special thanks for substantive inputs and support at different stages to
                       Kitty Arie, Lara Brearley, Lucia Cizmaziova, Brendan Cox, Jonathan Glennie, Elizabeth Stuart and Simon Wright.
                       The country spotlight for Mexico was produced in strong collaboration with Anthony Caswell (SC Mexico), Aline Tinoco
                       (SC Mexico), Nancy Ramirez (SC Mexico), Mario Tellez (SC Mexico). Inputs for other country spotlights were provided
                       by Abeba Bekele (SC Ethiopia), Raj Kumar Mahato (SC Nepal), Mathilde Mailfert (SCUK), Ishtiaq Mannan (SC Bangladesh),
                       and David Melody (SC Malawi).The intersection analysis for Nigeria was conducted by Alexis Le Nestour (SCUK).
                       The production of the infographics was led by Faiza Shaheen (SCUK).We thank Lana Pasic for her background literature
                       review, and Grace Kite for substantive data analysis during early stages of the research.
                       We especially thank Laura Rodriguez Takeuchi and Emma Samman from the Development Progress project at the Overseas
                       Development Institute for contributions to help develop GRID and for providing substantive comments throughout the
                       background research for this report.This was part of a broader research collaboration on measuring development progress
                       and group-based inequalities. Co-authored background technical papers are forthcoming.
                       We are grateful to colleagues from across Save the Children for comments and inputs that have helped to improve and enrich
                       the report, including from Michel Anglade (SCI), Gunnar Andersen (SC Vietnam), Smita Baruah (SCUS), Robert Clay (SCUS),
                       Lani Crane (S US), Ulrika Cilliers (Red Barnet), Jorge Freyre (SCI), Maite Fernandez Gauto (SC Brazil), Jean Christophe Gerard
                       (SC Niger),Tracy Geoghegan (SCUS), Roger Hodgson (SCI), Kate Kerber (SCUS), Michael Kiernan (SCUS), Birgit Lundbak
                       (Red Barnet), Arshad Mahmood (SC Pakistan), Richard Morgan (SCI), Helen Morten (SCUK), Katherine Richards (SCUK),
                       Denise Rocks (SC Haiti), Ishtiaq Mannan (SC Bangladesh), Marie Rumsby (SCUK), David Olayemi (SC Nigeria), Faiza Shaheen
                       (SCUK), Monica Sydgard (SC Norway), Kim Terje Loraas (SC Norway), Patrick Watt (SCI), Ravi Wickremasinghe (SCUK).
                       We would like to thank external reviewers for input and substantive comments on early drafts of the report, including:
                       Sabina Alkire (OPHI, University of Oxford), Paul Anand (Open University), Stefan Dercon (DFID and University of Oxford),
                       Paul Dornan (Young Lives, University of Oxford), Stephan Klasen (University of Göttingen), Carolyn Reynolds (World
                       Bank), Kevin Watkins (Overseas Development Institute), Emma Samman (Development Progress, ODI), Amanda Lenhardt
                       (Development Progress, ODI), Alberto Minujin (New School and Equity for Children), Andrew Norton (Overseas Development
                       Institute), Grace Kite, Kumanan Rasanathan (UNICEF), Laura Rodriguez Takeuchi (Development Progress, ODI), David Stewart
                       (UNICEF), Frances Stewart (ODID, University of Oxford), Adam Wagstaff (World Bank) and Danzhen You (UNICEF).
                       We thank participants at an ODI round table, a UNU-MERIT seminar, the 2014 Development Studies Association conference,
                       the 2014 Human Development Capability Association conference, and the 2014 International Conference on Sustainable
                       Development Practice (ICSDP) for feedback and comments.

                       Published by
                       Save the Children
                       1 St John’s Lane
                       London EC1M 4AR
                       UK +44 (0)20 7012 6400
                       savethechildren.org.uk
                       First published 2015
                       © The Save the Children Fund 2015
                       The Save the Children Fund is a charity registered in England and Wales (213890) and Scotland (SC039570).
                       Registered Company No. 178159
                       This publication is copyright, but may be reproduced by any method without fee or prior permission for
                       teaching purposes, but not for resale. For copying in any other circumstances, prior written permission
                       must be obtained from the publisher, and a fee may be payable.
                       Typeset by Ben Cave

   IV
contents

The Lottery of Birth at a glance		                                                          VI

Executive summary		iX

1.		 Introduction		                                                                          1

2.		Digging deeper: how national averages mask disparities	                                  5

3.		Global trends: fairer progress is possible and often faster		                           13

		 SPOTLIGHT ON MALAWI		                                                                    18

		 SPOTLIGHT ON RWANDA		                                                                    23

4.		Equal life chances:the policies that can get us there	                                  25

		 SPOTLIGHT ON NEPAL		                                                                     26

		 SPOTLIGHT ON BANGLADESH		                                                                29

		 SPOTLIGHT ON MEXICO		                                                                    31

		 SPOTLIGHT ON ETHIOPIA		                                                                  33

5.		The post-2015 framework: a catalyst for equitable progress	                             39

6.		 Conclusions and recommendations			                                                     45

Appendix 1: Methodology		                                                                   48

Appendix 2: Projections under the ‘business-as-usual’ and ‘equitable progress’ scenarios	   54

Appendix 3: Interpreting the Spotlight Case Studies		                                       56

References		                                                                                57

                                                                                                 V
The Lottery of Birth
     at a glance

VI
VII
The lottery of birth

                                       Back from the brink
                                       Just a few months before this photo was taken, two-year-
                                       old Jalil’s life was in grave danger. After he was weaned, he
                                       developed diarrhoea – globally, one of the main causes of
                                       death among children under five. Jalil began refusing food.
                                       He became weak and emaciated.
                                       Jalil’s mother,Amina, brought him to a clinic – or outpatient
                                       therapeutic programme.Amina and Jalil live in northern
                                       Nigeria, where rates of child mortality are very high.
                                       “When we came to the clinic, he was examined.They
                                        gave me medicine and nutrient-enriched milk to give to
                                        Jalil. After that he changed dramatically. Now he’s plump,
                                        and he’s getting bigger and bigger. Before, I was without
                                        hope, but now I’m so happy.”
                                       The clinic where Jalil was treated is based in the grounds
                                       of a government hospital.When Amina was pregnant
                                       with Jalil she did not have antenatal care and gave birth
                                       to him at home. However, following Jalil’s successful
                                       treatment at the clinic, Amina, who was pregnant, started
                                       going to the hospital for antenatal care and then chose
                                       to have her next baby – Jalil’s sister – there.
 Photo: Lucia Zoro/Save the Children

       VIII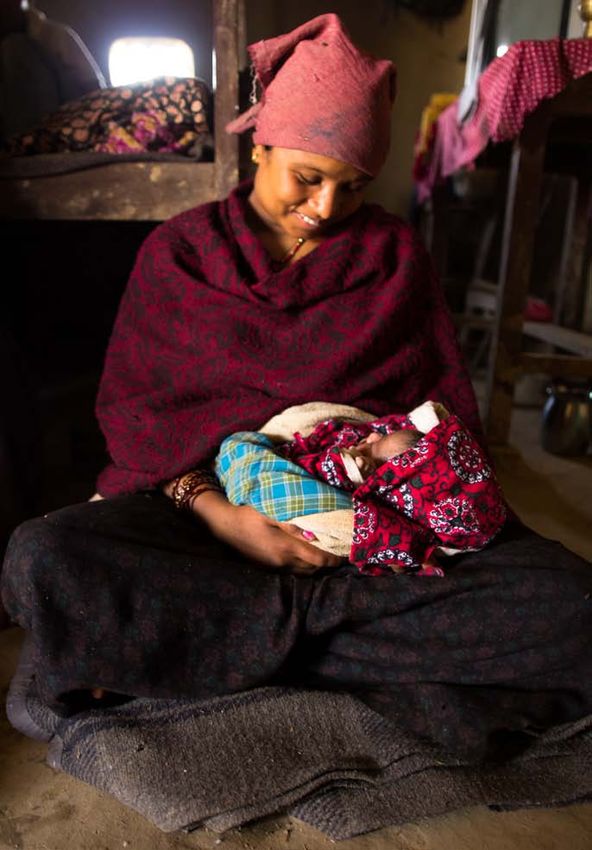
Executive summary

Key messages                                                A story of fast
                                                            but uneven progress
• A
   child’s chances of survival should not depend on        In many countries across the world, the odds of children
  where they are born, how wealthy their parents are,       surviving to celebrate their fifth birthday have improved
  or their ethnic identity.Yet across the world, these      considerably in recent years.Today, 17,000 fewer
  factors continue to determine whether a child lives       children die every day than was the case in 1990 and
  to celebrate his or her fifth birthday – factors          the global under-five child mortality rate nearly halved,
  which, for the child, are purely a matter of chance.      from 90 to 46 deaths per 1,000 live births, between
  This unfair lottery of birth violates every               1990 and 2013. But not all countries have succeeded
  child’s right to an equal start in life.                  in improving children’s life chances, and some of the
                                                            world’s poorest countries – many of which have been
• W
   hile we have seen important progress on reducing        ravaged by conflict and instability – are very much lagging
  under-five child mortality across the world over the      behind. Nevertheless, there has been unprecedented
  past 15 years, in too many countries inequality           progress globally over the past two decades in increasing
  is actually worsening. Progress in reducing child         children’s chances of survival.
  mortality is slower among some groups of children
  who are falling even further behind their more            But this good news story is marred by a worrying
  fortunate peers. Ending this lottery is a defining        fact. Digging beneath the surface of national averages
  challenge for our generation, and one that we             reveals considerable differences in mortality rates
  must tackle head-on.                                      between children within the same country.Too often,
                                                            particular groups of children suffer from persistently high
• T
   hankfully, inequality is not rising in all countries.   levels of mortality, even in countries that have seen very
  Some have managed not only to reduce child                rapid declines overall.These children already have much
  mortality at a fast rate, but to do so equitably –        lower chances of survival than their peers, and are now
  meaning that progress for excluded groups has been        falling even further behind, unfairly left out of global
  faster than the national average. In fact, contrary to    and national progress.These children are the focus
  popular belief, our research finds that pursuing an       of this report.
  equitable pathway to reducing child mortality
  is associated with 6% faster progress over the
  course of ten years, on average.

• A
   range of policies make equitable progress
  more likely, including steps towards the progressive
  realisation of Universal Health Coverage to ensure
  that poor and marginalised groups have access to
  quality services that meet their needs and that they
  are protected from financial hardship.

• G
   overnments should ensure that the successor
  framework to the Millennium Development Goals
  (MDGs), to be agreed in September 2015, shifts the
  world onto a more equitable pathway of progress.
  By 2030 no target should be considered met
  unless it is met for all social and economic
  groups.This is the only way to achieve Save the
  Children’s ultimate vision – a world in which no child
  dies from preventable causes, no matter where they
  are born or who their parents are.

                                                                                                                          IX
The lottery of birth

                                                                                    Equitable progress is possible, and does not
                         What does it mean to be left behind
                                                                                    slow down overall rates of change
                         BY progress
                                                                                    While the global picture looks challenging, there are
                         Examples from around the world
                                                                                    grounds for optimism. Our analysis reveals that a number
                                                                                    of countries are achieving impressive reductions in
                         • In Niger, a child born in the subnational region
                                                                                    child mortality rates while at the same time reducing
                            with the highest mortality rate in 2012 was
                                                                                    disparities between social and economic groups.
                            nearly five times more likely to die before
                                                                                    Clearly, equitable progress is possible. In fact, our findings
                            their fifth birthday than a child born in the region
                                                                                    indicate that equitable progress is associated with faster
                            with the lowest rate. These inequalities in life
                                                                                    than average overall progress, revealing a small but
                            chances have doubled since 1998.
                                                                                    positive correlation between the two:
                                                                                    • About a fifth of countries included in our research
                         • In Indonesia, a child born into the poorest
                                                                                       have achieved fast and above median reductions in
                            40% of households in 2012 was nearly two and
                                                                                       child mortality over the past decade, while at the same
                            a half times more likely to die than a child
                                                                                       time ensuring that no group of children is left behind.
                            in the richest 10%.This inequality has doubled
                                                                                    • More than half of countries that have reduced
                            since 2002.
                                                                                       inequalities in survival chances between groups
                                                                                       have also experienced fast (above median) declines
                         • In Honduras, in 2012, a child born in Islas de
                                                                                       in overall child mortality.
                            Bahia region was three and a half times more
                                                                                    • On average, pursuing an equitable pathway
                            likely to die than a child born in the most
                                                                                       to reducing child mortality was associated with
                            advantaged regions of the country.This inequality
                                                                                       6% faster progress over the course of ten years.
                            has increased considerably since 2006.
                                                                                    These findings contradict a widespread belief that
                         • In Vietnam, children born into the Kinh
                                                                                    reaching the poorest and most disadvantaged groups is
                            ethnic group in 2010 were nearly three and
                                                                                    harder and therefore likely to slow down progress.
                           a half times less likely to die than their
                           non-Kinh peers.
                                                                                    Further grounds for optimism lie in our finding that
                                                                                    disparities between economic groups and between urban
                                                                                    and rural areas have been decreasing in most of the
                                                                                    countries included in our research. However, disparities
                       New research reveals that particular                         between subnational regions and ethnic groups have
                       groups of children are being left                            been increasing in most countries.
                       behind by progress
                                                                                    Importantly, middle-income countries are not always
                       This report focuses on four different types of social        effectively harnessing the fruits of enhanced economic
                       and economic group for which data are available and          growth for the benefit of children who are furthest
                       where there are notable disparities in under-five child      behind. For example, middle-income countries account
                       mortality rates between children from advantaged and         for 13 of the 15 countries with the highest levels of
                       disadvantaged groups: subnational regions, urban and         regional inequality in child mortality, despite making
                       rural areas, ethnic groups and economic groups.              up only around half of the total sample.

                       Our research, which is based on new analysis of
                       disaggregated data for 87 countries, reveals that in most
                       cases, particular groups of children are being left behind
                       by progress in reducing child mortality.

                       • I n 78% of the countries, at least one social
                          or economic group has been making slower
                          progress than more advantaged groups and
                          is therefore being left behind – whether that
                          group is from the poorest section of society, from
                          disadvantaged regions inside the country, from rural
                          areas, or from disadvantaged ethnic groups.
                       • In 16% of the countries, inequalities in children’s
                          survival chances increased across all the groups for
                          which we have data.

   X
Executive summary
Without a step change in action, However, even in those countries that have seen
the unfair lottery of birth will success, maintaining progress will depend on
continue into the future improving the quality of services, and ensuring that
all children can access them free of charge as part
Our analysis suggests that, if current trends continue, of the progressive realisation of Universal Health
particular groups of children in countries across the Coverage.With undernutrition now the leading cause
world will continue to die from preventable causes of nearly half of all under-five deaths worldwide, and an
for generations to come.Within the post-2015 global increasing proportion of all child deaths occurring
development framework, discussions are taking place to in the neonatal period, the gross neglect of nutrition,
include an international target to achieve an under-five and maternal and newborn health, must be reversed.
child mortality rate of no more than 25 deaths per 1,000
live births in all countries by 2030. Our research shows • In many countries, disadvantaged groups have also
that if countries that carry the majority of the world’s seen rapid declines in child mortality rates as a
burden of child mortality continue with the result of efforts to tackle the related dimensions
best rates of progress they have achieved in recent of poverty and its root causes. Evidence from a
years, 47% would reach this target as a national average. diverse range of countries, from Brazil to Bangladesh,
However, looking beneath national averages, highlights the importance of measures to tackle the
only 25% would meet the target for all economic social determinants of health.These include bolstering
groups. Most countries (53%) would fail to meet accountability and ensuring that disadvantaged
the target for rural as well as urban areas, and only groups can make their voices heard; improving water,
14% would reach the target for all subnational sanitation and hygiene; access to quality education;
regions. Accelerated and more equitable progress and ensuring that disadvantaged groups can enjoy a
will be crucial if post-2015 targets are to be achieved decent standard of living through social protection
for all children. mechanisms and economic policy.There is abundant
evidence that the children of empowered, educated
women are more likely to survive beyond their fifth
Opting for equitable pathways: crafting birthday.These experiences show that policies which
policies that put the furthest behind first take into account the multidimensional nature
of poverty have greater potential to deliver equitable
The fact that a significant number of countries are reductions in child mortality.
achieving rapid rates of reduction in under-five child
mortality while ensuring that particular groups of • T
o put children who are left behind first, it will be
children are not left behind suggests that governments critical to ensure adequate investment in health
can pursue policies that make equitable progress systems and other social sectors. Dramatic
more likely. increases in domestic financing are needed in many
countries, supported by more, and more effective,
• R
esearch indicates that countries on fast and more aid. With regional inequalities in child mortality rates
equitable pathways to reducing child mortality have increasing in most of the countries included in our
made concerted efforts to ensure that hard-to- analysis, the redistribution of national resources
reach groups have access to essential, cost- to ensure maximum investment in regions that
effective and high-impact health services have been left behind should be a priority for
that address the leading causes of child mortality. financing strategies.
Expectant mother Kamala and her
husband Binod in Nepal. Kamala’s first
Photo: David Wardell/Save the Children
baby contracted pneumonia a few days
after it was born and tragically died.
“I don’t want this baby to go through
the same fate as my other baby. I want
everything to go smoothly. If the same
thing happens again it will be very
heartbreaking,” Binod says. “My wife will
give birth at the hospital. It’s better there
because there are nurses and doctors
there who can give advice.There are also
better facilities.”
XIThe post-2015 framework: an opportunity to shift
The lottery of birth
the course of progress so that no one is left behind
The post-2015 global development framework to The framework should focus immediate and
be agreed in September 2015 offers an important ongoing attention on the needs of children
opportunity to shift the global course of development who are the furthest behind. It must promote
to ensure that people are no longer left behind simply equity across the framework, including through
by virtue of their social or economic group. The new stepping stone targets – ie, interim targets set for
framework must not only aim to finish the job that the intermediate dates between 2015 and 2030 to reduce
MDGs started – with a bold child survival target – but inequality in life chances between advantaged and
must also go further and tackle the inequalities that disadvantaged groups. Supported by improvements in
have been masked by the focus on national progress. the disaggregation, transparency and accessibility of
By 2030, no post-2015 target should be considered data, stepping stone equity targets have the potential
met unless it has been met for all social and to incentivise the changes in policy and practice that
economic groups. are needed at international, national and local levels
to accelerate progress among disadvantaged groups.
Photo: Meridith Kohut/ Save the Children
Mothers with their babies in Chad. Chad has the third highest child
mortality rate in the world, with 148 children dying per 1,000 live births.
XIISummary of recommendations
Executive summary
Save the Children calls on all global and national 3) Donors, multilateral agencies, civil society
leaders to meet their obligations to children and pursue and other development partners must:
equitable pathways towards an end to preventable child • Step up action and align behind the national and
mortality.The course of action is clear: sector plans of developing country governments –
meeting aid commitments, increasing the allocation
1) Global and national leaders must work of aid budgets to health, supporting implementation
to secure an ambitious and implementable and upholding aid effectiveness principles.
post-2015 framework, which promotes • Provide technical and financial support to help
equity at its core. the poorest countries increase financing for health
This must include: and other social sectors through sustainable and
• Agreeing a politically salient framework that has progressive domestic revenue sources.
the potential to be truly transformative. As a • Create an enabling environment for countries
generation-changing objective, ending preventable to maximise domestic resource mobilisation,
child and maternal deaths should be a central including through increasing the coherence of the
commitment of the framework. international tax system and clamping down on
• Establishing clear targets to advance Universal tax avoidance by international companies operating
Health Coverage and address the multidimensional in developing countries.
drivers of poverty and inequality, supported • Support the strengthening of statistics systems
by standalone goals on gender equality and at national and international levels to ensure
accountable governance. that progress for disadvantaged groups can
• A core commitment that no target will be be better monitored.
considered met in 2030 unless it is met for all social • Review their own policies and plans to focus
and economic groups, supported by stepping stone on inequalities in health and other social sectors.
equity targets for interim dates to focus attention • Hold themselves and each other accountable
on groups that remain furthest behind. for implementation of the post-2015 framework
• Strong reporting and accountability mechanisms through regularly reviewing and reporting publicly
that hold governments, donors and multilateral on their contribution, in coordination with
agencies to account for delivering on their accountability mechanisms established for
commitments and responsibilities. the post-2015 framework.
2) Governments must review national and sector-
specific policies and plans to support the
achievement of post-2015 goals and targets.
This must include:
• Establishing policies to address the proximate and
underlying causes of high child mortality rates
among specific social and economic groups.
• Establishing financial risk protection for healthcare,
expanding the fiscal space for health, increasing
investment in health to at least 15% of the total
government budget, and ensuring that public
budgeting is underpinned by equity principles and
redistribution.
• Ensuring coordination across public sectors that
impact on health, and establishing time-bound
equity targets within national and sector plans,
following a multidimensional approach.
• Strengthening accountability and opportunities for
citizen participation in policy-making and planning.
XIIIThe lottery of birth
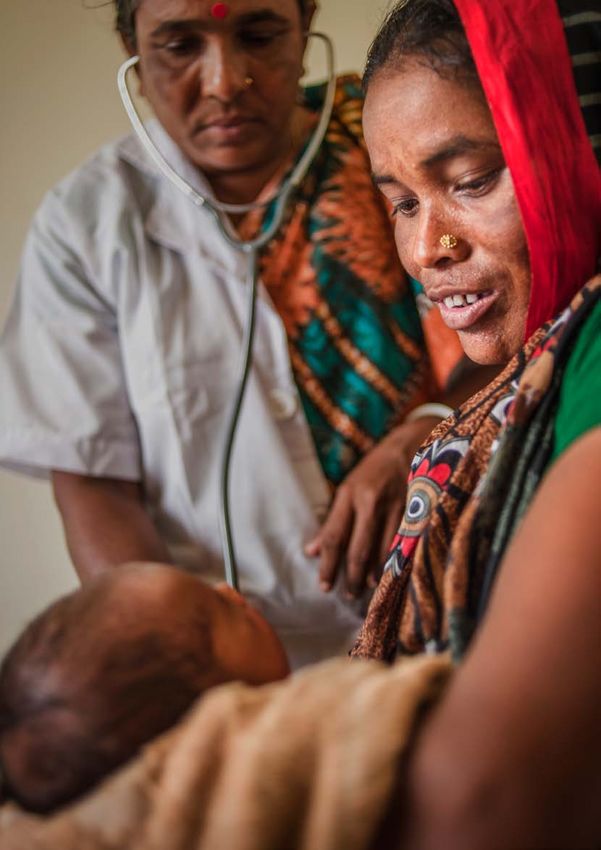
Adapting tradition to close the survival gap
Just six days’ old, Rakhal has been brought by his mother,
Mala, to his local health clinic for a check-up.
For Mala and her community, this is ground-breaking.
Traditionally in her community in Habijganj, Bangladesh, a
mother and her newborn baby should not leave the house
in the first month after birth. Mala has been supported
in breaking from tradition by her mother-in-law. She
accompanied Mala and Rakhal to the clinic, bringing a small
bag of earth taken from the house so that they remain
connected to the family home.
The clinic, within walking distance of Mala’s home, was built
by the Bangladesh government in 2012, in partnership with
Save the Children. Before that, Mala’s family and others
in their village faced a journey of many hours to get to a
health clinic.
Photo: CJ Clarke/Save the Children
XIV1 Introduction
The lottery of birth
Meet Rabia, born in a rural village in north Nigeria. Even more worryingly, these gaps are growing in many
Rabia’s mother, Laila, does everything she can for her countries.This dynamic is the focus of this report.
daughter. But Rabia’s prospects for the future do not Many disadvantaged groups of children are seeing slower
lie fully in her mother’s hands. Compared to her more reductions in child mortality than their more advantaged
affluent peers in the North West region of Nigeria, peers. In these cases, disparities in survival chances
Rabia is twice as likely to die before she reaches her between groups are growing, and significant numbers
fifth birthday.1 If she had been born into a rich family in of children are being left behind by progress.
the South West region where Lagos, the largest city in
Nigeria, is located, she would have been about three This situation is fundamentally unjust. It represents a
and a half times less likely to die. And compared to the violation of every child’s inherent right to life and every
average child mortality rate in the UK, she is 38 times government’s obligation to ensure children’s survival and
more likely to die than British children. development to the maximum extent possible, as laid out
in the United Nations Convention on the Rights of the
This is the lottery of birth. Across the world, children’s Child (UNCRC). Every child has the right to a standard
chances of surviving to see their fifth birthday depend on of health that allows them not only to survive, but also
where they happen to be born, how much their parents to grow and develop, reaching their full potential in life –
can afford to invest in their well-being, the ethnic identity no matter where they are born or who their parents are.
that has been ascribed to them, whether or not they
have a disability, and other factors that are all outside
their control. As a result, there are significant gaps in
child mortality levels between children who have been
lucky enough to be born into advantaged circumstances,
and those who have not.
Photo: Lucia Zoro/Save the Children
Rabia, seven
months, with
her mother at a
malnutrition clinic
in north Nigeria.
1The global backdrop
The lottery of birth
Worryingly, many of the countries that have the highest
child mortality rates also have the slowest rates of child
History may well judge the MDGs as a turning point, mortality reduction (see Table 1).These countries are
given that children’s chances of survival have improved being left behind on the global stage. Many are conflict-
considerably in countries across the world over the affected and fragile states, which accounted for one-fifth
past decade.The global under-five child mortality rate of all child deaths in 2013.9
nearly halved from 90 to 46 deaths per 1,000 live births
between 1990 and 2013.This means that 17,000 fewer This international lottery has been the focus of
children now die every day than was the case in 1990.2 international efforts to reduce preventable deaths,
Global child mortality rates are also falling faster now including through the Millennium Development Goals
than at any time in history, largely as a result of action on (MDGs) and the UN Secretary-General’s Every Woman
immunisation, family planning, nutrition and treatment of Every Child initiative, established in 2010 to support
common childhood illnesses, as well as improvements in MDGs 4 and 5.11 This attention to disparities in child
the wider social determinants of health.3 mortality rates between countries has been important,
and in many cases has paid significant dividends.The
This is a huge achievement, and must be celebrated. MDGs and Every Woman Every Child have helped to spur
The dramatic progress achieved by some of the world’s on the global progress on child mortality that we have
poorest countries has led many to speculate that an end seen in recent years, aligning development partnerships
to preventable child mortality is within our reach.Within behind a set of clear, time-bound global objectives in order
a generation, we could live in a world where no child dies to accelerate change.The global annual rate of reduction
from preventable causes – conditions such as diarrhoea of child mortality is now three times faster than it was
and pneumonia for which cost-effective treatment is before the MDGs were agreed.12 Recent research has
available, or complications at birth that could be resolved found that this acceleration was particularly notable
through the presence of a skilled birth attendant. in countries with high child mortality rates, putting 21
countries on track to achieve the MDG target that would
However, there is still a long way to go. More than 6 million otherwise have missed it had rates of change continued as
children died in 2013, despite being born into an era when they were before.13
we have the means to prevent unnecessary deaths.4 If
current trends continue, it will take until 2028 to reach However, global efforts to reduce child mortality under the
the commitment enshrined in MDG 4 – to cut the global MDG framework have suffered from two key weaknesses.
under-five mortality rate by two-thirds.That’s 13 years First, they have focused on disease-specific interventions.
after the 2015 deadline.5 Under this scenario, more than While this has had a significant impact on some of the
4 million children under the age of five will die in 2030.6 leading causes of under-five deaths, other key policy areas
have been neglected.These include action on newborn
A child’s country of birth has a dramatic impact on their health and nutrition, reflected by high neonatal mortality
chances of survival, giving rise to an international lottery of and stunting rates in countries with high child mortality
birth.The national average under-five mortality rate in low- (Table 1). Due to insufficient improvements in maternal
income countries is 12 times higher than in high-income and neonatal care, an increasing proportion of those
countries, at 76 deaths per 1,000 live births.7 A child born children who die in every region of the world are newborn
in Angola – the country with the highest child mortality rate babies, comprising 44% of all under-five deaths globally.14
in the world – is 84 times more likely to die than a child Undernutrition is an underlying cause of nearly half of all
born in Luxembourg, the country with the lowest rate.8 under-five deaths across the world. Ending preventable
Table 1: Countries with the highest child mortality rates
Country Annual rate of Child deaths per % share of neonatal Under-five stunting
reduction (2000-2013) 1,000 births (2013) deaths in total (2013) rate (indicator of
severe malnutrition)10
Angola 1.3% 167 27.8% 29.2%
Sierra Leone* 2.2% 161 27.5% 44.9%
Chad* 1.6% 148 27.3% 38.7%
Somalia* 0.9% 146 32.1% 42.1%
Central African Republic* 1.0% 139 31.2% 40.7%
Guinea-Bissau* 2.6% 124 36.0% 32.2%
Mali* 3.1% 123 33.7% 38.5%
Congo, DR* 1.7% 119 32.7% 43.5%
Nigeria 2.6% 117 32.5% 36.4%
Niger 4.9% 104 27.4% 43.0%
All figures from UN Inter-agency Group for Child Mortality Estimation, 2014, unless otherwise stated. * Denotes countries in the World Bank’s list of Fragile Situations (FY15)
21. INTRODUCTION
child deaths will therefore depend on significant • Is inequitable progress, in which the most disadvantaged
improvements in antenatal and newborn care and in groups make the slowest progress, inevitable?
maternal and child nutrition in countries across the world.15 • Does focusing on disadvantaged groups to ensure
more equitable progress mean that overall rates
Second, the global focus on national averages and of change will necessarily be slower?
inequalities between countries has led to neglect of the • What can be done to allow countries to shift
significant disparities that exist between different social onto more equitable pathways, ensuring that
and economic groups within countries – which is the focus disadvantaged groups catch up with those with
of this report.This has effectively hidden some of the lower child mortality rates?
world’s poorest and most marginalised groups from view
– children whose extreme vulnerability to death from Our research is based on new analysis of disaggregated
preventable causes has been masked by their country’s data for 87 countries.We focus on four social and
relatively strong progress in reducing the national child economic groups where there are notable disparities
mortality rate. in child mortality rates between disadvantaged and
advantaged groups of children: subnational regions,
urban and rural areas, ethnic groups, and economic
From the MDGs to the post-2015 framework: groups (measured through an asset index as a proxy
a window of opportunity to end the unfair for poorer and richer groups within society).17
lottery of birth
We begin in Chapter 2 by exploring the nature and
In September 2015, world leaders will gather at the magnitude of inequalities in child mortality rates between
United Nations to agree the post-2015 global sustainable social and economic groups.As well as looking at levels of
development framework, setting priorities for domestic inequality within countries, we identify which groups of
and international action on poverty and environmental children are the very furthest behind on the global stage.
sustainability.This presents a critical opportunity to put an
end to the global lottery of birth and spur action towards Chapter 3 moves on to explore trends over time
our ultimate goal – a world in which no child is left behind, in order to determine who is being left behind in
no matter where they are born or who their parents are. the progress that is being made on reducing child
This is an opportunity that must not be missed. mortality. Our analysis addresses a critical question:
is it inevitable that particular groups of children will
The post-2015 framework must be clear, motivating, and always be left behind, or are some countries ensuring
capable of galvanising national and international partnerships that disadvantaged groups are catching up with their
behind the common objective to finish the job that the peers? And what does this mean for prospects for ending
MDGs started. Importantly, it must address the fundamental preventable child deaths among all social and economic
blind spot of the MDGs to inequalities, focusing attention groups within a generation? We also examine what
on the needs of the most disadvantaged children. If backed different pathways of progress mean for overall,
up by political action and funding, including through more national rates of progress.
and better bilateral aid and a renewed Every Woman Every
Child mechanism supported by an effective Global Financing Chapter 4 draws on this analysis to consider how
Facility,16 such a framework has the potential to drive an countries can shift onto more equitable pathways that
unprecedented step change in progress. accelerate progress in reducing child mortality among
disadvantaged groups.We explore the experience of
countries that have successfully reduced inequalities
This report: New evidence to spur action in child mortality rates between particular groups
of advantaged and disadvantaged children, looking at
This report shines a spotlight on children who have the kinds of policies that have helped to drive change.
been left behind by global and national progress in child Our analysis focuses on policies that affect health
mortality reduction in order to make the case that systems directly as well as on the relationship between
action to tackle inequalities should lie at the heart of the multidimensional poverty and the social determinants
global fight against poverty – including in the post-2015 of health and child mortality, including issues of gender
framework and in national development strategies. inequality and the capacity of disadvantaged groups
to hold governments to account.The report includes
The research presented in this report lifts the lid on global country case studies from Bangladesh, Ethiopia, Malawi,
and national progress in child mortality reduction to look Mexico, Nepal and Rwanda, labelled as ‘spotlights’.
at the trends that lie beyond national averages, exploring
the following critical questions: The final chapter shifts the focus to the post-2015
development framework and its potential to drive
• W
hat is the magnitude of the problem? How many change.We consider what can be done to ensure that
countries are leaving children behind, and what does the framework creates incentives for governments,
this mean for future prospects for ending preventable donors and development practitioners to focus on
child deaths? the world’s poorest and most marginalised children.
3The lottery of birth
Helping children survive and thrive
Edna, age eighteen, lives with her daughter Heloise in her
mother-in-law’s home in Petrolina, a town in the state of
Pernambuco in north-east Brazil.
Brazil is one of the world’s largest economies, but it
suffers from extreme inequality and the north and north-
east areas lag behind the rest of the country.
Edna is benefiting from the Mãe Coruja (Mother Owl)
project which is run by the state government.The project
aims to help more children survive and grow up healthy
by providing healthcare to pregnant women and children
under five.Women like Edna can enrol in cooking classes,
and learn skills to help them improve their income.
“I found out about Mãe Coruja through my sister’s friend
and the support they’ve given me and my baby has been
wonderful. Mãe Coruja explains through books, talks
and workshops how to take care of our babies, and they
make sure children get all their vaccines. Next month
I’m looking forward to starting some of their courses
and participating in meetings in my neighborhood. Most
mothers prefer to take the cooking for schools course
as there are more job opportunities.”
Edna also benefits from Family Allowance (Bolsa Família),
a conditional cash transfer system through which families
living in poverty gain a basic monthly income.
Photo: Genna Naccache/Save the Children
42 Digging deeper
how national averages mask disparities
It is widely acknowledged that too many children have been left
behind by the MDG framework, and that looking solely at national
averages can mask inequalities in rates of progress between different
groups. For example, in the outcome document of the 2010 MDG
Review Summit, UN Member States identified “inequalities between
and within countries” as a significant challenge.18
But what is the nature and magnitude of the challenge at hand? Our analysis of
disaggregated data explores the extent of inequalities in survival chances between
different groups of children (see Box 1).
Box 1: New disaggregated data on under-five child mortality
There are numerous challenges involved in boys/girls; urban/rural areas; subnational regions;
systematically monitoring progress in under-five ethno-linguistic groups; poorest 40% and richest 10%
child mortality for various social and economic groups of children (according to the DHS/MICS asset index);
across a large number of countries. Unfortunately, the and quintiles based on the same asset index.The
disaggregated data that are essential for such analysis asset index is used as a proxy for living standards
are scarce and dispersed across various sources and and economic status.
in different formats.This report has made substantial
efforts to compile existing statistics and produce Group-based inequalities metrics
additional data. The metric used in the report to measure inequality is
the ratio between groups with the highest and lowest
Groups and inequality database under-five child mortality rates, which effectively
The background research in this report is based on shows how much more likely a child from one group
data either calculated or compiled from public sources is to die than a child from the other group.There are
into the groups and inequality database (GRID).This at least three reasons for this choice. Child survival
was developed by Save the Children in collaboration is a basic human right – any differences between
with the Development Progress Project at the groups can be ascribed to systematic differences in
Overseas Development Institute (ODI). It is based life chances and are fundamentally unjust.The gap
on direct data processing of 257 Demographic and between the most and least advantaged groups is
Health Surveys (DHS) and Multiple Indicator Cluster revealing of the extent of inequity. Second, the gap
Surveys (MICS), aggregated public sources (the UN between the most and least advantaged is easy to
Inter-agency Group for Child Mortality Estimation, understand for politicians and citizens alike, and
World Health Organization, UNICEF,World Bank), should therefore motivate action.Third, examining the
and official disaggregated figures for a few countries performance of the top-performing group in society
without survey data.The GRID covers a total of shows what level and pace of progress is possible
87 countries with disaggregated data on disparities within a given country context.We are aware that
across social and economic groups, and a total of 64 the ratio does not provide a full account of the entire
countries with data over time for up to seven data distribution, and have used other, less communicable,
points (170 periods). In the current version, GRID but comprehensive measures for robustness tests,
contains measures of stunting, child mortality, and which yielded very similar results.
access to piped water and flush toilets. Each of these
indicators is disaggregated by the following groups: For further details see Appendix 1: Methodology.
5The lottery of birth
Inequalities stemming from The statistics presented here provide a snapshot of
systematic disadvantage the nature and extent of inequalities in child survival
in different countries. But what does the global picture
Inequalities in survival chances are driven by a range look like? Which groups of children have particularly high
of different forms of poverty and disadvantage.These rates of child mortality, both in relation to other groups
include monetary poverty; on average, children born into within their country and to disadvantaged groups in other
the poorest fifth of the population are twice as likely countries? In other words, which children are furthest
to die before their fifth birthday as those in the richest behind in the global race to end preventable child deaths?
fifth.19 But economic resources are not the only driver of
unequal life chances. Disadvantaged children with lower
chances of survival also include: those born into remote Inequalities in child survival chances
or marginalised regions and rural localities that have across economic groups
been deprived of vital investment in health infrastructure;
children who are discriminated against on the basis of A family’s material well-being or economic group is an
disability or ethnicity; and children who are particularly important determinant of children’s survival chances.
vulnerable as a result of living on the street, in refugee Children in the poorest 40% of households face a
camps or in institutions. In some contexts gender is also higher risk of under-five mortality than those in the
an important factor, where boys receive preferential richest 10%.23 The UN Inter-agency Group for Child
treatment to their female siblings or where practices of Mortality Estimation describes under-five mortality
sex-selective abortion and infanticide still prevail.20 rates above 100 per 1,000 live births as ‘very high’, and
those above 40 per 1,000 live births as ‘high’.24 As Figure
Statistics paint a stark picture of the wide disparities within 1 shows, countries with very high child mortality rates
countries, and how they are, in many cases, increasing: among the poorest 40% of households often have very
large disparities between economic groups. Notable
• In Niger, a child born in the subnational region with examples include Niger, Cameroon, Nigeria, Lesotho and
the highest mortality rate in 2012 was nearly five Pakistan, where the poorest 40% of children are among
times more likely to die before their fifth birthday the furthest behind in the world, not just in their own
than in the region with the lowest rate.This inequality countries.There is also significant variation between
has doubled since 1998. countries with similar national average child mortality
• In Indonesia, a child born into the poorest 40% of rates. For example, both Guinea and Côte d’Ivoire
households in 2012 was nearly two and a half times have an average child mortality rate of 100 deaths per
more likely to die than a child in the richest 10%. 1,000 live births. However, the bottom 40% in Guinea
This inequality has doubled since 2002. is further behind than those in Côte d’Ivoire, with a
• In Honduras, in 2012, a child born in Islas de Bahia child mortality rate of 121 deaths per 1,000 live births
region was three and a half times more likely compared to 104 deaths per 1,000 live births.
to die than a child born in the most advantaged
regions of the country.This inequality has increased
considerably since 2006. Inequalities in child survival chances
• In Vietnam, children born into the Kinh ethnic group across ethnic groups
in 2010 were three and a half times less likely to
die than their non-Kinh peers. Recent data on child mortality among different ethnic
groups are scarcer than for other groups. In nearly all
These gaps in child survival rates matter.Their sheer countries with data, children from disadvantaged ethnic
scale underscores the fact that they are not happening as groups have much higher child mortality rates than
a result of random chance.They stem from the fact that the most advantaged groups (see Figure 2). Relative
certain groups are systematically disadvantaged compared inequality between ethnic groups is particularly large
to other groups.Why? Because the government is not in the Philippines,Vietnam, Ghana and Ethiopia, where
investing sufficiently in healthcare in particular regions. children from groups with the highest mortality rates are
Because the financial barriers to healthcare for poor more than three times more likely to die than those in
households are too high. And because certain groups are ethnic groups with the lowest rates.
being discriminated against in the provision of services. In
Indonesia, for example, only 43% of the poorest quintile
of the population have access to six or more of the eight
essential preventive interventions that address some
of the leading causes of child mortality, compared to
75% of the richest quintile.21 In Vietnam, patients from
minority ethnic groups are less aware of government
health programmes and rarely receive information about
their conditions and treatment – an issue exacerbated by
discriminatory public attitudes towards minority groups
and by language barriers.22
6Under-five child mortality rate Under-five child mortality rate
0
20
40
60
80
100
120
140
160
180
0
20
40
60
80
100
120
140
160
180
200
Angola
Ghana
Nigeria
Burkina Faso Cameroon
Guinea
CAR
Burkina Faso
Pakistan Niger
Pakistan
Guinea Lesotho
Benin
Ethiopia
Côte d'Ivoire
Mozambique Mozambique
groups in selected countries
Zimbabwe
Cameroon Ghana
Comoros
Uganda
Ethiopia
Benin Haiti
Liberia
Togo
Kenya
Philippines Gabon
São Tomé and Principe
Afghanistan Uganda
Senegal
Congo, Rep.
Timor-Leste
Mongolia Bangladesh
Cambodia
Gabon
and lowest child mortality rates in selected countries Congo, Rep.
Lao PDR Nepal
Philippines
Nepal Indonesia
Guyana
Vietnam
Kyrgyz Republic
Guyana Egypt
Figure 2: Under-five mortality rates for ethnic groups with the highest
Honduras
Honduras Jordan
Figure 1: Under-five mortality rates for the poorest and richest economic
Colombia
Colombia
Peru
Peru Armenia
Albania
Richest 10%
Kazakhstan
High under-five child mortality
Poorest 40%
Very high under-five child mortality
child mortality
High under-five
Ethnicity with the lowest U5CM
Maldives
Very high under-five child mortality
Ethnicity with the highest U5CM
7
2. Digging deeperThe lottery of birth
Inequalities in child survival chances Inequalities in child survival chances
across urban and rural areas across subnational regions
Whether children live in an urban or rural area also Geographic location also has a large effect on children’s
affects their survival chances (see Figure 3). In almost survival chances. In 32 of 44 countries for which data
every country for which we have recent data, living in disaggregated by subnational level are available, being
rural areas entails a higher risk of dying before reaching born in the region with the highest rate of under-five
the age of five.25 The largest inequality is observed in child mortality at least doubles children’s risk of death
Cambodia, where the rate of child mortality in rural areas compared with the region with the lowest rate.
is nearly three times higher than in urban areas. However,
even relatively small inequalities can translate into Figure 4 illustrates the extent of inequality faced by
extremely large differentials in the number of deaths if children in the regions that are furthest behind on
child mortality rates are high. For example, in Cameroon, reducing child mortality. Disparities are particularly
child mortality among rural children is more than one striking in the Philippines, Guyana, Niger and Bhutan,
and a half times higher than for urban children, with an where children from the furthest behind regions are five
estimated child mortality rate of 112 deaths per 1,000 times or more likely to die than their peers in better-
live births compared with 70 per 1,000 in urban areas. performing regions. Niger is a particularly worrying case.
This means that in Cameroon, over 18,000 fewer rural While regional inequalities in child mortality rates are
children would die every year if their chances of survival decreasing for the other countries (those shown in green
were the same as in urban areas. in the figure), they are increasing in Niger (coloured red).
Children in the most disadvantaged region were two and
a half times more likely to die in 1998 than those from
the best-performing region. By 2012, regional inequality
had increased, and children in the furthest-behind region
were nearly five times more likely to die than children
from the best-performing region. Children in the most
disadvantaged region in Niger are not only extremely far
behind, but are also being left behind by national progress.
Figure 3: Under-five mortality rates for urban and rural areas in selected countries
200
Rural
Urban
180
160
Under-five child mortality rate
140
120
Very high under-five child mortality
100
80
60
High under-five child mortality
40
20
0
Angola
Nigeria
Guinea
Cameroon
Niger
Côte d'Ivoire
Burkina Faso
Lesotho
CAR
Pakistan
Benin
Sierra Leone
Mozambique
Comoros
Zimbabwe
Ghana
Togo
Liberia
Afghanistan
Kenya
Uganda
Gabon
Haiti
Ethiopia
Lao PDR
Senegal
Timor-Leste
India
Bolivia
Congo, Rep.
Cambodia
Bangladesh
Nepal
São Tomé and Principe
Iraq
Philippines
Mongolia
Indonesia
Guyana
Bhutan
Kyrgyz Republic
Honduras
Vietnam
Egypt
Colombia
Jordan
Peru
Armenia
Albania
Mexico
Kazakhstan
Belize
Maldives
82. Digging deeper
Figure 4: regions with highest under-five mortality rates in selected countries
7
25 deaths per 1,000 live births
Philippines
Decreasing inequality
Proposed post-2015 target:
Increasing inequalities
No data on change
6
Guyana
How many times more likely children in these regions
Size of Bubble: number of deaths per
year - 10,000 deaths
5
Bhutan
Niger
are to die than in those furthest ahead
Cambodia
Lao PDR
Vietnam
Indonesia
Gabon
4
Honduras
Ghana
Peru
Ukraine
Bolivia
Zimbabwe
Kenya
Cameroon
3
Guinea
Ethiopia
Haiti
Uganda
Egypt
Timor-Leste
Benin
Burkina Faso
Pakistan
Mozambique
Nigeria
Congo, Rep.
Togo
Central African Republic
2
Bangladesh
Mexico
Afghanistan
Sierra Leone
Angola
São Tomé and Principe
Colombia
Nepal
Lesotho
Jordan
Maldives
Comoros
1
Parity
0
0
25
50
75
100
125
150
175
200
225
Under-five child mortality rate in the furthest behind region (deaths per 1.000 live births)
Children in the furthest-behind region in Niger are also than their peers in the best-performing region, but this
being left behind on the global stage.The child mortality region sees over 2.7 million children born every year,
rate in Tillabéri, for example, is estimated to be 135 over 400,000 of whom are likely to die before their fifth
deaths per 1,000 live births – much higher than the 100 birthday. However, this region is at least catching up with
per 1,000 threshold classed as ‘very high’ by the UN the best-performing region.The picture is less positive
Inter-agency Group. Other countries with subnational in Pakistan, where the furthest-behind Sindh region not
regions that are being left behind – both within their only sees a large number of deaths in absolute terms, but
countries and on the global stage – include low-income is also making slower progress in reducing child mortality
countries like Zimbabwe, Guinea and Burkina Faso, rates than the best-performing Islamabad region. In Sindh,
and lower-middle income countries such as Ghana 1 million children are born every year, over 95,000 of
and Cameroon. In other countries, disparities between whom die before they are five years old. Other regions
subnational regions are not as large, but child mortality in Pakistan, including Balochistan and Punjab, also have
rates are extremely high for every group. Angola is a extremely high child mortality rates and see large
notable example.While regional disparities are relatively numbers of deaths in absolute terms.26
smaller, children in the furthest-behind region face the
highest probability of death compared with children in This analysis does not imply that there is less urgency in
any other country – an estimated 207 children die for tackling inequalities in regions with high child mortality
every 1,000 live births.These children are the furthest rates but smaller absolute numbers of children, such
behind of all of the countries in our sample. as Mboum region in Central African Republic or
Khmu region in Lao PDR. Action must be taken to end
Figure 4 also illustrates that absolute numbers preventable deaths in all regions, no matter how small
matter. Some of the world’s furthest-behind regions their child populations, and starting with those that are
are home to a large number of people, and therefore furthest behind.The analysis does, however, provide
see a staggering number of child deaths in absolute insights into the scale of the challenge in different
terms.This is depicted by the size of the bubble on the countries, and should be taken on board in decisions
graph in Figure 4. In Nigeria, not only are children in the about how international resources should be distributed.
furthest-behind North West region twice as likely to die
9The lottery of birth
Middle-income countries are not always effectively The compound effect of
harnessing the fruits of enhanced economic intersecting inequalities
growth for the benefit of children who are furthest
behind. Our sample contains a roughly even split Of course, in reality, these different forms of inequality
between low- and middle-income countries, yet the latter will often be closely related to each other. For example,
comprise 12 of the 15 countries with the highest levels of ethnic groups in some sub-Saharan African countries have
regional inequality, including Guyana, Bhutan,Vietnam and a distinctive geographical distribution. In these contexts,
Indonesia.These countries arguably had greater potential unequal geographical progress may therefore also be
than others in the sample to advance equal life chances reflected in unequal progress across ethnic groups.
for children, with more resources available to invest in In some contexts, geographical regions or cities may
child health.While child mortality rates in the furthest- be heterogeneous, with pockets of poverty alongside
behind regions of these countries are relatively lower relative advantage. In other contexts, certain regions or
than most of the sample, in all but four of the countries rural cities may be more homogeneous.These dynamics
(Vietnam, Peru, Ukraine and Maldives) they are still above are important, but internationally comparable data with
the 40 per 1,000 threshold that the UN Inter-agency sufficient disaggregation to explore them are limited.This
Group categorises as ‘high’. Of the 12 countries, nine is an area with significant methodological challenges and it
have sufficient data to assess trends over time. Seven requires improvements in the availability of disaggregated
of these are seeing regional inequalities increase – the data (see Box 2).
Philippines,Vietnam, Gabon, Honduras, Ghana, Peru
and Bolivia.27 These countries have high and persisting Different forms of disadvantage also often overlap or
inequalities, probably deriving from systemic issues that intersect with each other.28 Children who experience
are preventing child mortality rates from falling in some more than one form of disadvantage are likely to have
disadvantaged regions as they have done in others. the lowest survival chances – for example, children living
in poor households in remote regions are likely to be
more at risk than those from affluent households in more
advantaged localities. Box 2 illustrates these intersecting
inequalities with reference to Nigeria.
Photo: Alejandro Kirchuk/Save the Children
Raida carries her daughter Evelyn, eight
months old, in Sotopampa, rural Peru.
Evelyn is recovering from pneumonia.
As there are no facilities that could treat
her in her district, Raida had to take
her to the hospital of Huancavelica, the
capital of the region.
10You can also read


