National Ecosystem Monitoring Network (NEMN)-Design - Monitoring Air Pollution Impacts across Sensitive Ecosystems
←
→
Page content transcription
If your browser does not render page correctly, please read the page content below
National Ecosystem Monitoring
    Network (NEMN)-Design
Monitoring Air Pollution Impacts across Sensitive Ecosystems

                             1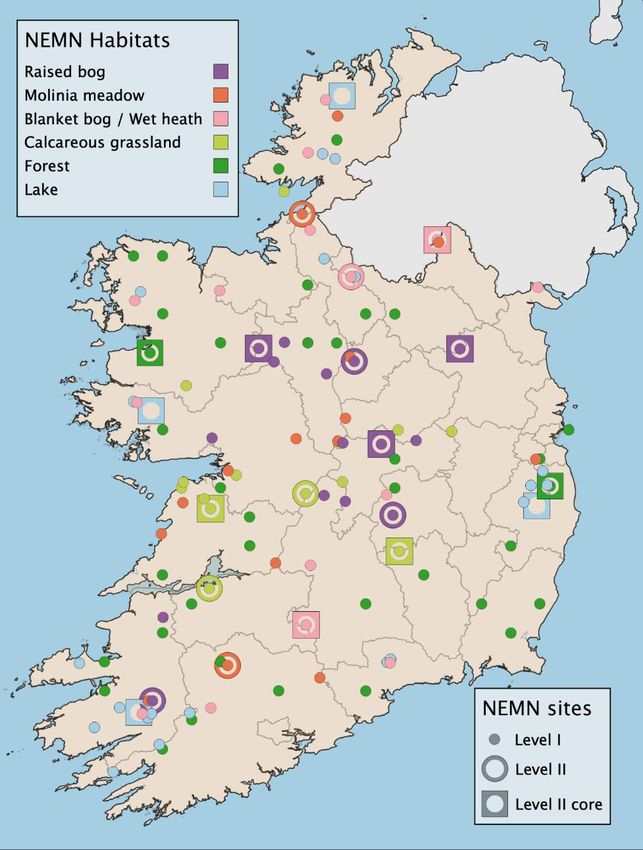
National Ecosystem Monitoring Network
                   (NEMN)-Design

      Monitoring Air Pollution Impacts across Sensitive Ecosystems

                                                 2021

                      Prepared for the Environmental Protection Agency
                                              by
            University College Dublin and the UK Centre for Ecology & Hydrology

                                                Authors:

 David B. Kelleghan1, Y. Sim Tang2, Ed C. Rowe3, Laurence Jones3, Thomas P. Curran1,
Keelan McHugh4, Simon Smart5, Cristina Martin Hernandez2, Philip Taylor2, Mhairi Coyle2,
 Massimo Vieno2, Felicity Hayes3, Lorna Marcham4, Katrina Sharps3, Thomas Cummins4

1
  UCD School of Biosystems and Food Engineering. Agriculture and Food Science Centre, University College
Dublin, Belfield, Dublin 4, Ireland
2
  UK Centre for Ecology & Hydrology, Bush Estate, Penicuik, Midlothian EH26 0QB, UK
3
  UK Centre for Ecology & Hydrology. Environment Centre Wales, Deiniol Road, Bangor, Gwynedd LL57 2UW,
UK
4
  UCD School of Agriculture and Food Science, Agriculture and Food Science Centre, University College Dublin,
Belfield, Dublin 4, Ireland
5
  UK Centre for Ecology & Hydrology, Lancaster Environment Centre, Library Avenue, Bailrigg, Lancaster, LA1
4AP, UK

                                                     1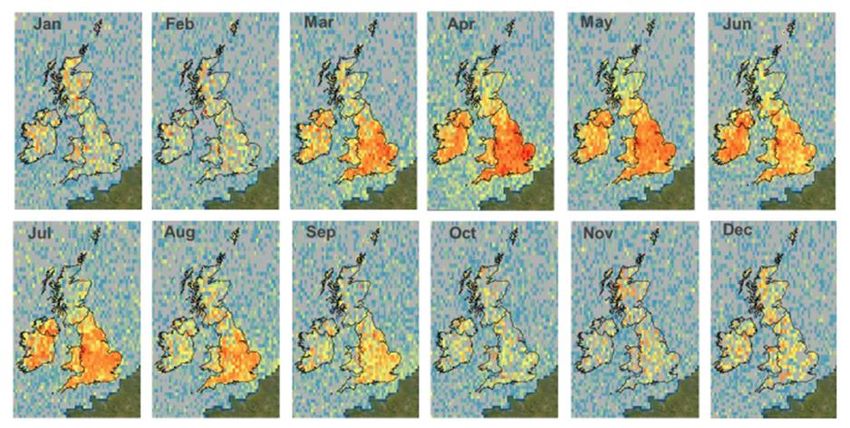
Citation: Kelleghan D.B., Tang Y.S., Rowe E.C., Jones L., Curran T.P., McHugh K., Smart
S., Martin Hernandez C., Taylor P., Coyle M., Vieno M., Hayes F., Marcham L., Sharps K. &
Cummins T. (2021) National Ecosystem Monitoring Network (NEMN)-Design: Monitoring
Air Pollution Impacts across Sensitive Ecosystems. Report to Environmental Protection
Agency, Johnstown Castle, Ireland. 96 pp.

                               ACKNOWLEDGEMENTS

This report was written as part of the NEMN-Design project, a requirement under the National
Emissions Ceilings Directive. The authors would like to acknowledge the support of the EPA
point of contact Ian Marnane, and National Parks and Wildlife Service staff Deirdre Lynn and
Andy Bleasdale, Margaret Ryan (Met Eireann), John McEntagart and Stephen Somerville
(EPA - EMEP).
We also want to thank other individuals for contributions, including Matt Saunders (TCD);
Rory Sheehan (CANN project); Maria Long, Sue Moles, Pat Ryan, Jimi Conroy, Mary
Sheehan, Danny O’Keeffe, Daniel Buckley, Emma Glanville, Laura Gallagher, Sean Breen,
Jack McGauley, Therese Kelly (NPWS); Dominika Krol, Macdara O’Neil (Teagasc), Klara
Finkele (Met Éireann); Suzanne Higgins (Agri-Food & Biosciences Institute Northern Ireland);
David O’Connor (TU Dublin); Elvira de Eyto (Marine Institute); Luke Heffernan, John
Redmond (Department of Agriculture Food and the Marine), Mark McCorry (Bord na Mona)
Michael Bowe and Peter Hennessy.
The NEMN-Design team owe a deep gratitude to the landowners who facilitated site access for
visits conducted by this project.

                                       DISCLAIMER
Although every effort has been made to ensure the accuracy of the material contained in this
publication, complete accuracy cannot be guaranteed. The Environmental Protection Agency,
the authors do not accept any responsibility whatsoever for loss or damage occasioned, or
claimed to have been occasioned, in part or in full, as a consequence of any person acting, or
refraining from acting, as a result of a matter contained in this publication. All or part of this
publication may be reproduced without further permission, provided the source is
acknowledged.
This report is based on research carried out/data from June – October 2020. More recent data
may have become available since the research was completed.

                                                2
Project Partners

David B. Kelleghan                              Y Sim Tang
School of Biosystems and Food Engineering       UK Centre for Ecology & Hydrology
Agriculture and Food Science Centre             Bush Estate
University College Dublin                       Penicuik
Belfield, Dublin 4                              Midlothian EH26 0QB
Ireland                                         UK
Tel.: +353 1 716 7484                           Tel: +44(0)131 4458562
Email: david.kelleghan@ucd.ie                   Email: yst@ceh.ac.uk

Thomas Cummins                      Ed C Rowe
UCD School of Agriculture and Food UK Centre for Ecology & Hydrology
Science                             Environment Centre Wales
Agriculture and Food Science Centre Deiniol Road, Bangor
University College Dublin           Gwynedd LL57 2UW
Belfield, Dublin 4                  UK
Ireland                             Tel: +44(0)1248 374524
Tel.: +353 1 716 7744               Email: ecro@ceh.ac.uk
Email: thomas.cummins@ucd.ie

Keelan McHugh                                   Laurence Jones
UCD School of Agriculture and Food              UK Centre for Ecology & Hydrology
Science                                         Environment Centre Wales
Agriculture and Food Science Centre             Deiniol Road, Bangor
University College Dublin                       Gwynedd LL57 2UW
Belfield, Dublin 4                              UK
Ireland                                         Tel:
Email: keelan.mc-hugh@ucdconnect.ie             Email: lj@ceh.ac.uk

Thomas P. Curran
School of Biosystems and Food Engineering
Agriculture and Food Science Centre
University College Dublin
Belfield, Dublin 4
Ireland
Tel.: +353 1 716 7362
Email: tom.curran@ucd.ie

                                            3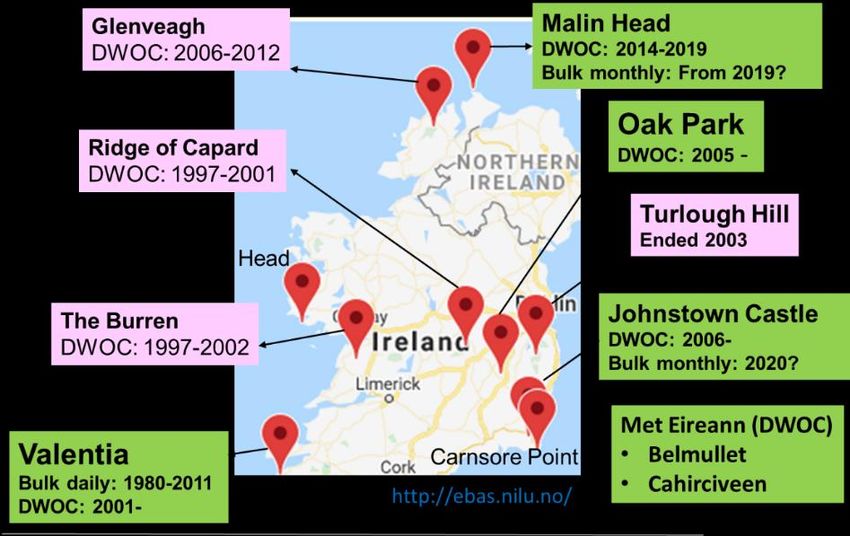
Contents
1. Introduction .......................................................................................................................... 12

         National Ecosystem Monitoring Network (NEMN) – legislative background .............. 12

         Current NEMN network ................................................................................................. 14

         Critical Loads and Critical Levels .................................................................................. 16

2. NEMN Structure ................................................................................................................ 17

         Tiered monitoring strategy ............................................................................................. 18

         Selecting sites for representative coverage of key habitats ............................................ 21

3. NEMN Site Identification .................................................................................................. 23

         Forests ............................................................................................................................ 23

         Freshwaters..................................................................................................................... 24

         Terrestrial Ecosystems ................................................................................................... 25
      3.3.1 Habitats .................................................................................................................... 26
      3.3.2 Ecological Monitoring Networks Summary ............................................................ 28

         Applying risk to sites...................................................................................................... 28

         Interpreting risk and other environmental gradients ...................................................... 30

         Terrestrial Ecosystem Level I Site Selection ................................................................. 32

         Terrestrial Ecosystem Level II Site Selection ................................................................ 33

         Proposed Terrestrial Ecosystem Sites ............................................................................ 34

         Building synergies to deliver cost-effectiveness ............................................................ 38

4. Methods for monitoring impacts (Level I)....................................................................... 40

         Monitoring frequency for impacts measurements .......................................................... 40

         Forests ............................................................................................................................ 40

         Freshwaters..................................................................................................................... 42

         Terrestrial Ecosystems ................................................................................................... 43

                                                                       4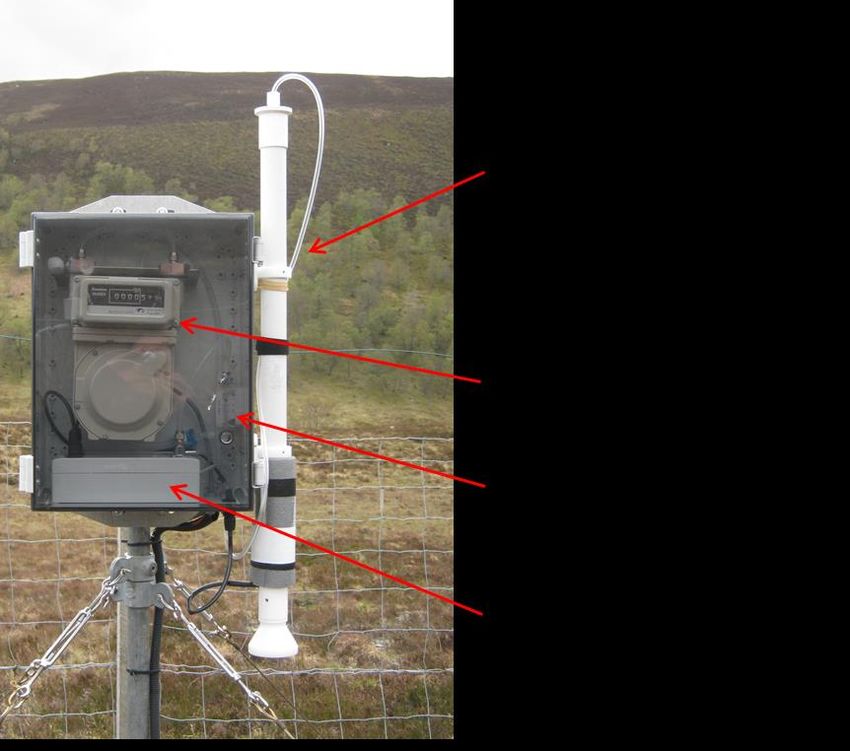
4.4.1 Measuring impacts of N and S on species composition and biodiversity ............... 43
      4.4.2 Spatial arrangement of Level 1 monitoring plots .................................................... 43
      4.4.3 Measuring biogeochemical impacts of N and S ...................................................... 45
      4.4.4 Recording site management..................................................................................... 45
      4.4.5 Assessing impacts of ozone ..................................................................................... 46

5. Methods for monitoring air quality pollutants ............................................................... 47

         Air quality parameters .................................................................................................... 47

         Sulphur and Nitrogen ..................................................................................................... 47

         Ozone ............................................................................................................................. 48

         Air monitoring protocols ................................................................................................ 49

         Atmospheric concentrations of Ammonia, NH3 ............................................................ 51

         Atmospheric concentrations of Nitrogen Dioxide, NO2 ................................................ 55

         Atmospheric concentrations of Sulphur Dioxide, SO2 .................................................. 55

         Precipitation chemistry methods - wet deposition ......................................................... 55

         Ozone concentrations and fluxes.................................................................................... 57
      5.9.1 Modelled concentrations.......................................................................................... 58
      5.9.2 PODy and exceedance flux-based critical levels: O3 ............................................... 58

          Modelling concentrations and deposition of Nitrogen and Sulphur ............................ 58

          Remote sensing ............................................................................................................ 60

6. Conclusions and Recommendations ................................................................................. 62

         Sites ....................................................................................................................................
             62

         Surveys ........................................................................................................................... 64

         Habitats........................................................................................................................... 65

         Management ................................................................................................................... 65

7. References ........................................................................................................................... 67

                                                                        5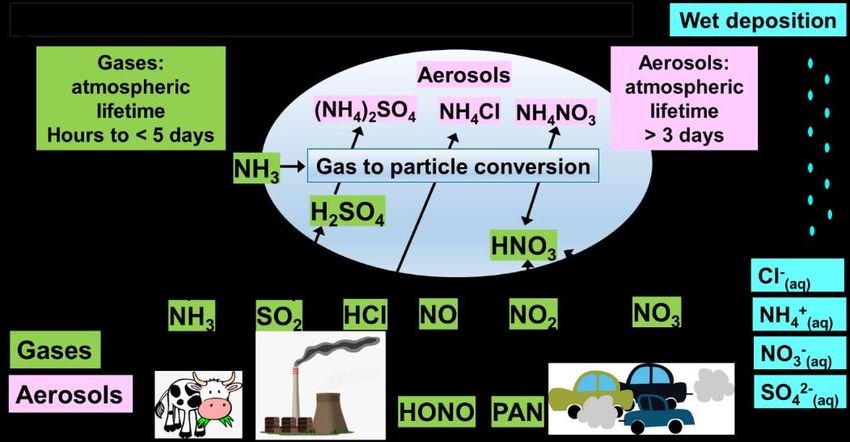
List of Figures
Figure 1-1. Seven steps for identifying additional monitoring sites for inclusion in NEMN,
adapted from European Commission feedback (WER, 2019). ................................................ 14
Figure 1-2. Monitoring sites in the National Ecosystem Monitoring Network (NEMN) for
Ireland reported in 2018 and 2019 to European Commission in compliance with the National
Emission Ceilings Directive. Left: Level I sites. Right: Level II sites. ................................... 15
Figure 2-1. Tiered monitoring strategy for air pollution monitoring in NEMN ...................... 18
Figure 2-2. Reaction scheme showing the emissions, atmospheric chemistry and fate of NH3,
acid gases and NH4+ aerosols. (reproduced from Tang, 2020a). ............................................. 20
Figure 2-3.Core proposed National Ecosystem Monitoring Network, including existing and
proposed sites. .......................................................................................................................... 20
Figure 3-1. NEMN Forest and Freshwater Level I and Level II sites. .................................... 25
Figure 3-2. NPWS monitoring sites for potential inclusion within NEMN. Left – Priority
habitats for this phase for inclusion within this phase of the NEMN. Right – Habitats to consider
for future phases of the NEMN. ............................................................................................... 28
Figure 3-3. Identified risk parameters for risk assignation. A. Nitrogen deposition. B. Sulphur
deposition. C. NH3 concentration. D. NH3 concentration (finer resolution model). E. Nitroindex
(based on nitrogen sensitive lichens). F. Rainfall from Met Éireann (1981-2010). ................ 29
Figure 3-4. Figure 3-4. Nitrogen deposition on potential sites featuring priority habitats for
inclusion within the NEMN. .................................................................................................... 30
Figure 3-5. Potential approach to site selection for calcareous grasslands, showing additional
filtering by rainfall band. N deposition is split into 5 bands, and symbols differentiate low
(1500 mm) rainfall sites...................................................... 31
Figure 3-6. Potential approach to site selection for raised bogs. N deposition is split into 5
bands. Numbers next to points refer to specific sites within the bogs dataset. ........................ 31
Figure 3-7. Potential approach to site selection for blanket bog and wet heaths. N deposition is
split into 5 bands, Numbers next to points refer to specific sites within the blanket bog and wet
heaths dataset. .......................................................................................................................... 32
Figure 3-8. Potential approach to site selection for Molinia meadows. N deposition is split into
5 bands, Rainfall is split into High (>1500 mm), Med and Low (
Figure 5-1. Trends, projected emissions and ceilings for target years in SO2, NOx, NH3, PM2.5
and non-methane volatile organic carbons, NMVOCs (1990 – 2030) in Ireland. (Data source:
Ireland’s air pollutant emission 2018 (1990-2030), June 2020). ............................................ 48
Figure 5-2: Types of passive diffusion samplers. .................................................................... 52
Figure 5-3. Left: wind-solar powered DELTA® system. Right: low voltage 6 volt DELTA®
system. Denuder-filter pack sample trains are housed within the detachable external holder.53
Figure 5-4. (LEFT) Annual averaged gas and aerosol concentrations (2007 – 2010) of sites in
the pan-European NitroEurope DELTA® network, grouped according to ecosystem types:
crops, grassland, semi-natural and forests. (RIGHT) the same data expressed as percentage
composition of gas and aerosol components (Tang et al., 2020b). There were three sites from
Ireland: Carlow, Dripsey and Solohead. .................................................................................. 54
Figure 5-5. Left: Eigenbrodt Daily wet only collector used at wet deposition sites in Ireland.
Right: Map of both active and discontinued wet deposition measurements at EMEP and Met
Eireann sites in Ireland. (https://www.eigenbrodt.de/en/products/sampler-collectors-
instruments/nsa-181k-cooled/). ................................................................................................ 57
Figure 5-6.Modelled NH3, SO2 and O3 for Ireland – EMEP4UK. ........................................ 60
Figure 5-7. Modelled dry and wet nitrogen deposition for Ireland – EMEP4UK. .................. 60
Figure 5-8. IASI satellite NH3 data (total column NH3, molecule cm-2) from 2008 – 2018,
averaged in calender month “bins” (reproduced from Brown, 2020). ..................................... 61
Figure 6-1. Existing and proposed sites for NEMN. ............................................................... 63

                                                                7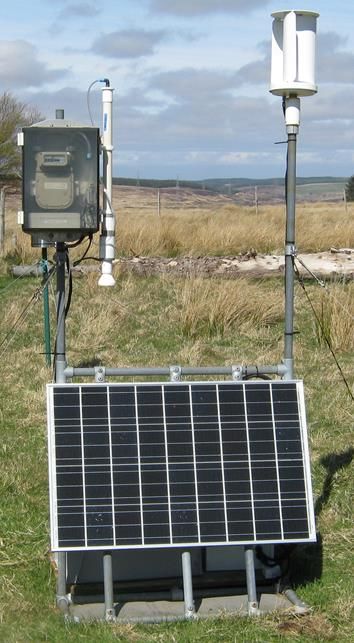
List of Tables
Table 1-1. National Ecosystems Monitoring Network (NEMN) sites for which data were first
reported in 2019 to the EC. ...................................................................................................... 15
Table 2-1. Proposed inclusion of new sites from five key Annex 1 habitats in NEMN that are
nationally important sensitive habitats for Ireland................................................................... 21
Table 2-2. Priority ranking of habitats considered for inclusion within this phase of the NEMN.
Critical Load values shown are the ranges given in Bobbink & van Hettelink (2011). .......... 22
Table 3-1. Proposed forest ecosystem sites for this phase of the NEMN. ............................... 35
Table 3-2. Proposed freshwater ecosystem sites for this phase of the NEMN. ....................... 36
Table 3-3. Proposed terrestrial ecosystem sites for this phase of the NEMN. ......................... 37
Table 3-4. Partners, networks, and synergies relevant to NEMN monitoring. ........................ 39
Table 4-1 Surveys at ICP Forests plots in Ireland. .................................................................. 41
Table 5-1. Summary table of air quality measurement methods and models for air quality
parameters recommended for Article 9 monitoring and reporting. ......................................... 49
Table 5-2. Upper and Lower plausibility limits for passive monitoring of air quality ............ 50
Table 5-3. Data completeness and measurement period. ......................................................... 51
Table 5-4. Data Quality Objectives (DQO). ............................................................................ 51
Table 5-5. Ammonia monitoring with ALPHA® samplers at EMEP sites in Ireland. ........... 53
Table 5-6. Ammonia monitoring with DELTA ® samplers at EMEP sites in Ireland (Tang et
al. 2020b). Acid gases (HNO3, SO2, HCl) and aerosols (NH4+, NO3-, SO42-, Cl-, Na+, Ca2+,
Mg2+) were also measured at the same locations (see Figure 5-4). ......................................... 53
Table 5-7: A comparison of bulk precipitation collector design recommended by ICP (based
on World Meteorological Organisation) versus the NILU collector design used in Ireland. .. 56
Table 5-8. Reporting on parameters for acidification and eutrophication – bulk deposition
measurements (Article 9 Template) ......................................................................................... 56
Table 5-9. Summary of modelling approaches for acidifying, eutrophying air pollutants and
ground level ozone. .................................................................................................................. 59
Table 6-1. Surveys recommended for NEMN in reporting cycle ending 2022/2023. ............. 64
Table A1.1.6-2: Indicative costs of monthly monitoring of NH3 measurements with ALPHA®
samplers. Actual costs have been censored to ensure open fair competition. ........................ 75

                                                                   8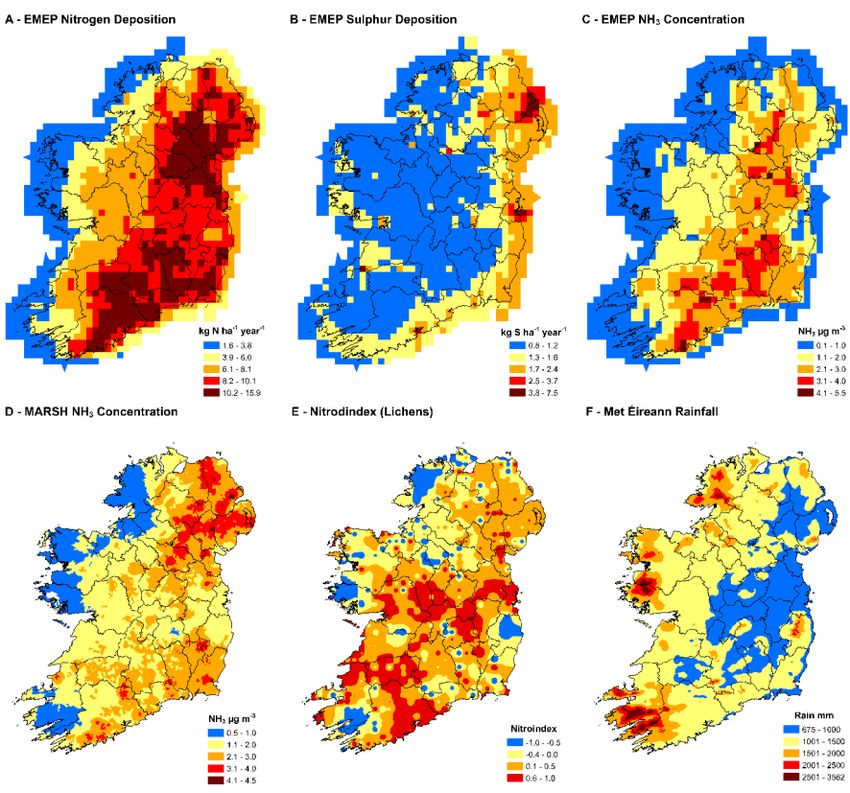
Executive Summary
Under the EC National Emissions Ceiling Directive (NECD 2016/2284), EU member states are
required to monitor (Article 9) and report (Article 10.4) air pollution pressure and impacts on
ecosystems that are representative of each country’s freshwater, forest, natural and semi-natural
habitats. Ireland developed the National Ecosystem Monitoring Network (NEMN) in 2018, with the
first data submission on 1st July 2019. In response to recommendations from the EC, Ireland is
seeking to improve its NEMN. In this document, we propose methods for monitoring air quality and
ecosystem parameters, and for selecting sites to be included in NEMN to improve representative
coverage across sensitive habitat types and major pollution gradients. The air pollution impacts of
interest are in the first instance those relating to the substances for which reduction commitments
are set in Annex II to the NECD (i.e. SO2, NOX, NMVOC and NH3), that is those contributing to
acidification and eutrophication of ecosystems, and as precursors of ozone damage to vegetation
growth and biodiversity changes. The development of the NEMN is intended to be an iterative
process, with incremental improvements over time. The existing network is composed of
International Co-operative Programme (ICP) Forests and Waters sites operated under the Air
Convention (UN-ECE CLRTAP) and Water Framework Directive (2000/60/EC), respectively. The
existing network structure is based on that of ICP Forests, which is composed of two networks with
different monitoring intensity, Level II and Level I.
Level II: sites are used to install permanent or semi-permanent equipment to continuously monitor
atmospheric concentrations and deposition of pollutants. The current NEMN contains eight
identified Level II sites: four ICP Waters sites, two ICP Forests sites and two semi-natural habitat
sites. The four ICP Waters sites are monitored by the EPA, and results were submitted to the
European Commission under the NECD in 2019 (NECD 2016/2284). The two ICP Forests sites,
one in Wicklow and a second in Mayo, were intensively monitored in the period 1991–2017.
Monitoring on these two sites was suspended in 2017 due to lack of funding, and are reliant on
inclusion within the NEMN to continue, including satisfying Ireland’s (non-binding) commitments
under the Air Convention (UN-ECE CLRTAP). Two sites intended to represent semi-natural
habitats were proposed for inclusion within this network in 2018. However, as no relevant data has
yet been collected on these sites, this report will review their suitability for retention based on both
the risk posed to the sites and their suitability for long term monitoring.
Level I: sites are used to monitor long-term pollutant impacts on soil and vegetation, so can be
visited comparatively infrequently, for periodic surveys, and do not require monitoring equipment
installed on site. Cost-effectiveness is an important consideration for the design of the network,
and some estimated costs are presented in Appendix 1 of this report. Not all costs for options could
be prepared, due to uncertainty around public procurement, and these costs must be seen as
tentative. The current network includes 35 Level I sites, on ICP Forests Level I sites, with locations
selected as a subset of the systematic National Forest Inventory grid.
Feedback from the EC on the first round of NECD reporting showed that the submitted data from
Ireland do not sufficiently capture ecosystem types particularly sensitive to impacts of air pollution,
such as heathlands, bogs and acid-sensitive grasslands and strongly recommended expanding
the network to include these non-forest habitats. This requires some changes to methodology,
which in turn provides an opportunity to focus on monitoring methods that are cost-effective and
can provide robust scientific evidence of air pollution impacts and recovery. Changes in the floristic
composition of the vegetation are particularly useful for detecting air pollution effects on
ecosystems, as are some relatively cheap biogeochemical measurements such as soil pH and
nitrogen content of bryophytes. Effects of pollution on these ecosystem parameters are mainly
gradual, so monitoring once every four years is adequate. This report makes recommendations for
site selection and monitoring methods for the next phase of NECD data submission, notably: a)

                                                   9
including only a limited number of habitats in this phase, to ensure an adequate number of sites
per habitat; and b) establishing permanent plot locations, to be more certain of detecting real
change in future surveys.
The terrestrial ecosystem habitats were selected based on their sensitivity to air pollution, in
particular N deposition and gaseous ammonia (of conservation importance in Ireland). The NEMN-
design team recommend expanding the network to including five semi-natural terrestrial habitats,
15 sites per habitat, surveyed every 4 years: Raised Bog, Blanket Bog, Wet Heath, Calcareous
Grassland and Molinia Meadow. Other existing networks will provide sites and data for Level I
Forests and Level II Freshwaters. This phase of network design focuses primarily on expanding
terrestrial ecosystem monitoring, where Level II sites are split into Level II and Level II core. Level
II will receive less intensive monitoring but cover a greater number of sites, and Level II core will
focus on intensive monitoring on very few sites. This report recommends using 15 Level II
terrestrial ecosystem sites across the country, to include 7 Level II core sites. The primary focus
of this approach is to represent the range in pressure from pollutant nitrogen (N), in particular the
range in ammonia concentration, which is highly spatially variable. Nitrogen pollution is of particular
concern for ecosystems in Ireland and globally. Sites should be representative of N risk and take
account of co-correlated or modifying factors such as rainfall, S, O3, management and size. A
stratified selection process ensures the 15 sites per habitat are balanced across the N deposition
gradient and rainfall. Practicalities and links to other networks were also considered, in addition to
a proposed Level I Freshwater network.
Deposition of both reduced (ammonia and ammonium) and oxidised nitrogen causes
eutrophication, leading to dominance by tall and fast-growing species, and acidification, both of
which result in species loss. Ammonia has direct toxic effects, especially on sensitive bryophytes
and lichens. Monitoring ammonia concentration allows this pressure to be characterised, and also
provides evidence useful for estimating total N deposition. Ireland currently lacks a long-term
continuous ammonia monitoring network. The proposed network has the potential to greatly
improve the accuracy of concentration and deposition modelling carried out for Ireland.
Additionally, this report recommends seeking partnership with other atmospheric monitoring
schemes such as those carried out by the Integrated Carbon Observation System (ICOS),
Teagasc, the Northern Irish Environment Agency (NIEA), Ulster Wildlife, the CANN project, etc.
The monitoring carried out under these schemes is relevant to the required NECD data
submission, e.g. for monitoring carbon flux, ammonia concentrations and additional meteorological
parameters. Potential synergies in terms of site access are limited, since many of these networks
do not typically focus on habitats of interest to the NEMN (with the exception of surveys carried
out by the CANN project). However, their integration as additional sites would improve the
resolution of atmospheric monitoring used to validate national models.
This phase of the NEMN highlights the importance of linking with National Parks and Wildlife
Service (NPWS) biomonitoring for Level I Terrestrial Ecosystem sites. Where previous monitoring
can be used to identify suitable sites for inclusion, they are also indicative of sites where
biodiversity data has been collected in the form of relevés*. These can be linked with impacts from
atmospheric pollution, as has been carried out in existing literature. In addition to providing historic
data, a long-term link with future surveys would be invaluable to the NEMN. As the NPWS will
carry out repeat surveys on nationally important habitats, identifying sites to which return visits
should be carried out to benefit the NEMN will maximise the synergy with existing monitoring
schemes. The inclusion of at least 5 relevés per habitat type of interest to the NEMN, may already
be carried out in such surveys, though highlighting it now as a bare minimum for the NEMN is
* A small plot within which vegetative species are recorded.
10important and the importance of fixed relevés highlighted. While this phase of the network focused
on including sites recommended to the EC for Ireland, namely bogs, heaths and grasslands, other
habitats were also reviewed for potential inclusion in future phases. These are upland lakes,
limestone pavements, sand dunes, and oak woodlands, which should be considered for future
inclusion. NPWS biomonitoring also occurs on limestone pavement, sand dunes and oak
woodlands. Aligning the Habitats Directive reporting cycle of 6 years to the four-year NEMN
reporting and monitoring cycle will require an increase in monitoring frequency on the selected
sites.
Once sites from past NPWS monitoring schemes were identified, the relevant habitats were
extracted, and the pressure from atmospheric pollutants was estimated for each site based on the
most recently modelled EMEP data, and also recently published Irish literature. Nitrogen deposition
is the most important driver of biodiversity impacts from atmospheric pollution in Ireland, and as
such was used as the predominant driver of the required risk-based approach. Sites were
categorised based on the modelled amount of total nitrogen deposited. This phase of the NEMN
focused on identifying sites representative of five relevant habitat types, namely, raised bogs,
calcareous grassland, wet heaths, blanket bogs, and Molinia meadows. It is recommended that
each habitat has at least 15 Level I sites. If the number of sites is cost limited, the number of
habitats should be reduced, not the number of sites within a habitat. For each habitat type, 15
Level 1 sites were selected from the prepared list, to represent the gradient of atmospheric
pollution for each of these 5 habitats. The total number of terrestrial ecosystem Level I sites in the
proposed network is 60, since some sites have more than one habitat, in particular blanket bog
and wet heath. The number of Terrestrial Ecosystem Level II sites for each habitat type was based
on sensitivity of the habitat and likelihood of impacts, where 6 sites are recommended for raised
bogs, 4 for calcareous grassland, 3 for wet heath/blanket bog and 2 for Molinia meadows. The
Level II core sites were selected to represent the high and low ends of the gradient for each habitat
type (though a third site is recommended for raised bogs), and are included within the Level II sites
i.e. 15 Level II sites and 7 Level II core. There are no additional sites proposed for the previously
submitted Forest and Freshwater Level II sites, though additional monitoring required for these
sites are detailed.
Site visits were carried out to review the suitability of identified Level II terrestrial sites. This required
interviewing and meeting individuals familiar with the sites, typically NPWS conservation rangers.
This ruled out some previously selected sites (namely Split Hills and Long Hill Esker SAC), but
also identified new more suitable sites such as Moanour SAC. While not all proposed Level II sites
were visited, their inclusion in previous NPWS monitoring networks indicates they may be suitable.
However, it is still recommended that the remaining sites be visited in the near future.
The current proposed NEMN features 37 ICP Forest Sites (2 Level II and 35 Level I), 25
Freshwater Sites (4 Level II and 21 Level I), and 60 Terrestrial Ecosystem Sites (nested design,
15 Level II, 7 Level II core). Monitoring across these sites will be carried out by a variety of
stakeholders alongside the EPA. Additionally, the NEMN-design team have made a number of
recommendations for improving this network as it progresses in the future, including;
• Inclusion of other sensitive habitats (dry heaths, limestone pavement, sand dunes and oak
woodlands)
• A review of the potential for additional surveys on Level I forests within NEMN network.
• Ensuring at least 15 Level I sites with 5 relevés per habitat of interest
• Using an expanded Level II network with reduced equipment to function as a required
continuous long term national NH3 monitoring network
• Expanding the Level II network further by including synergies with other atmospheric
monitoring in Ireland (i.e. NIEA/Ulster Wildlife, ICOS, Teagasc).
• Utilising an expanded Level II network to validate national concentration and deposition
modelling (i.e. EMEP, EMEP4IE, MARSH).
111. Introduction
National Ecosystem Monitoring Network (NEMN) – legislative background
Under the EC National Emissions Ceiling Directive (NECD 2016/2284), EU Member States are required
to develop national networks to monitor (Article 9) and report (Article 10.4) air pollution pressures
and impacts on sensitive freshwater and terrestrial ecosystems (see Box 1).
Article 9(1) of the NEC-Directive requires that Member States conduct monitoring on the basis of:
ecosystem types
'a network of monitoring sites that is representative of their freshwater, natural and semi-natural
habitats and forest ecosystem types, taking a cost-effective and risk-based approach'.
and
the impacts of interest
‘The air pollution impacts of interest for the ecosystem monitoring are in the first instance those
relating to the substances for which reduction commitments are set in Annex II to the Directive (i.e.
SO2, NOX, NMVOC, NH3 and PM2,5), that is: acidification, eutrophication, and ozone damage to
vegetation growth and biodiversity. While the impacts of other pollutants (e.g. heavy metals) are
also of concern, a stepwise approach is appropriate and it is proposed that the first phase of
monitoring focus on these three impacts.’
Ireland’s response is the development of the National Ecosystems Monitoring Network (NEMN)
which will carry out required monitoring on Ireland’s freshwaters, forests, and other semi-natural
habitats. A first submission of NEMN monitoring sites and indicators was made to the European
Commission in June 2018, followed by the first submission of NEMN data in the Article 9 reporting
template in June 2019.
Box 1. Requirements for monitoring negative impacts of air pollution on sensitive
ecosystems, under the NEC Directive (2016/2284).
Article 9 of the NECD requires Member States to develop and implement a monitoring system
which:
• Can identify negative impacts of air pollution on ecosystems (acidification, eutrophication
and ozone damage),
• Covers a network representative of the Member State’s habitats.
Annex V of the Directive sets out a list of optional parameters the Member States may use in
implementing the obligation. The Directive states that ‘Member States shall report the following
information referred to in Article 9 to the European Commission and the European Environment
Agency (https://rod.eionet.europa.eu/obligations/767):
• To report by 1 July 2018 and every four years thereafter, to the Commission and the
European Environment Agency, the location of the monitoring sites and the associated
indicators used for monitoring air pollution impacts (Article 10(4)(a));
• To report by 1 July 2019 and every four years thereafter, to the Commission and the
European Environment Agency, the monitoring data referred to in Article 9.
A review of the first Article 9 submissions commissioned by the EC made a number of
recommendations for Member States in their national reporting before the next round in 2022 and
122023 (WER, 2019). In particular, countries are encouraged to identify key habitats of national
importance, and to develop a “Level I” network for monitoring air pollution impacts on these
habitats. The review made recommendations in three areas (see Box 2).
For Ireland, the report noted the provision of extensive datasets for forests and surface waters, but
identified evidence gaps for assessing impacts of air pollution on the biodiversity of other terrestrial
habitats such as grasslands, heathlands and bogs (WER, 2019). This report proposes changes
and extensions to the existing NEMN, with the aim of improving the monitoring and reporting of air
pollution pressure and impacts on a representative coverage of relevant ecosystems for Ireland.
Box 2. Recommendations to the EC following the first NECD reporting round (WER, 2019).
Representative coverage across major ecosystem types (MAES Level II):
• Additional monitoring sites representing grassland, heathland and shrub, wetland and cropland
sites
• Inclusion of additional terrestrial key parameters should be considered to enhance the breadth
of data available.
• Each ecosystem type to contain at least one active monitoring site reporting indicators at
recommended frequency (Annex V).
• A triad of similar sites to increase robustness of monitoring data.
• Level I monitoring at all sites.
• Level II monitoring at sensitive ecosystems and areas of higher pollution pressure
Representative coverage across major pollution gradient:
• Sites in areas of high S and N deposition, and high O3.
• Sensitive ecosystem sites (e.g. nutrient-limited grasslands and heathlands, wetlands (receiving
high rainfall)).
• Sites with unfavourable conservation status (HD) or below ‘good’ ecological quality (WFD).
• Background sites for comparison
Representative coverage across conservation status
The feedback to the EC (WER, 2019) made recommendations on collection and reporting of
monitoring data, summarised in Box 3.
Box 3. Recommendations from the EC on monitoring data following the first NECD reporting
round.
• Air quality data: some modelled data allowed, e.g. flux-based ozone and critical level
exceedances.
• Ecosystem parameters should be collected via monitoring.
• Re-use data collected under Habitats Directive, Water Framework Directive and Ambient Air
Quality Directive.
• The Commission and member states to facilitate development of manuals on wetlands,
grassland, and heathland with standardized methods and criteria for harmonized sampling,
assessment, monitoring and analysis of the effects of air pollution.
The review report recommended a step-wise approach in identifying sites for inclusion within each
Member States; national networks, outlined in Figure 1-1. In designing the next phase of the NEMN,
the seven steps were adopted to ensure that the network would be:
• Cost-effective (e.g. linking and forming synergies with existing networks),
• Representative of nationally important habitat types,
• Representative of national air pollution pressures,
• Representative of level of protection they are afforded and that they are adequately
spatially distributed.
13Figure 1-1. Seven steps for identifying additional monitoring sites for inclusion in NEMN, adapted
from European Commission feedback (WER, 2019).
Current NEMN network
The current NEMN for Ireland (2019 reporting) comprises 43 sites, 37 of which are sites drawn
from ICP Forests level I and II sites (Table 1 – 1, Figure 1-2). As identified in the EC review (WER,
2019), grasslands, heathland and shrubs, and inland wetlands (Bogs) are poorly, or not
represented at all in the NEMN. The current levels of active monitoring and data collection on these
sites vary substantially. While freshwater sites are monitored (quarterly) by the EPA under ICP
Waters and the Water Framework Directive (2000/60/EC) (European Communities, 2000),
monitoring on ICP Forests Level II had ceased prior to inclusion in the NEMN. There is also a need
to increase the number of terrestrial indicators for monitoring and reporting.
In this document, we propose methods for selecting sites and for monitoring to reinforce and
improve the Irish NEMN. This will provide the evidence needed to determine the state of, and
predict changes in, terrestrial and freshwaters ecosystems due to the impacts of air pollution, in
particular by nitrogen (especially ammonia), ozone and sulphur. These changes include
eutrophication, acidification, ozone damage and biodiversity loss.
14Table 1-1. National Ecosystems Monitoring Network (NEMN) sites for which data were first
reported in 2019 to the EC.
MAES Ecosystem
Level 1 EUNIS Habitat classes (Level 1) No. of NEMN sites
Type (Level 2)
Urban ecosystems Not relevant
I: Regularly or recently
Cropland cultivated agricultural, horticultural none
and domestic habitats
1: Ballymachugh
E: Grasslands and land dominated by
Grassland (new site – no data
forbs, mosses or lichens.
Terrestrial reported)
G: Woodland, forest and other wooded 35: ICP Forests Level I
Woodland and Forest
land 2: ICP Forests Level II
Heathland and Shrub F: Heath, scrub and tundra none
Sparsely or un-vegetated
Not relevant
land
1: Clara Bog
Inland wetlands D: Mires, bogs and fens Level II (new site – no data
Freshwater reported)
1: ICP Waters
Rivers and lakes C: Inland surface waters
3: Acid Lakes
TOTAL 43
Figure 1-2. Monitoring sites in the National Ecosystem Monitoring Network (NEMN) for Ireland
reported in 2018 and 2019 to European Commission in compliance with the National Emission
Ceilings Directive. Left: Level I sites. Right: Level II sites.
15The ICP Forest Level II sites have collected data on acidification and eutrophication of habitats
since 1987, which ceased after 2017. Since 2017, one survey has been carried out on ICP Forests
Level I, which was assessment of crown condition (Figure 1-2 - Left). While crown condition is not
a requirement of the NECD data submission, the inclusion of these sites will rely on the monitoring
of relevant parameters in Annex V. To maintain continuity of the long-term dataset, It is
recommended that monitoring that has ceased on these sites are restarted, Additional parameters
to be measured at the ICP level II sites are also proposed which are covered in the following
sections.54
Critical Loads and Critical Levels
The concepts of critical load (CLo), a rate of pollutant input above which there may be harmful
effects on ecosystems, and critical level (CLe), a gaseous concentration above which harmful
effects may occur, have been important in air pollution policy. The CLo and Cle values are set
according to scientific evidence (Bobbink & van Hettelink 2011; APIS 2020; Centre for Ecology
and Hydrology, 2016), and have been subject to periodic review and revisions – for example, the
ICP-M&M Coordination Centre for Effects is currently coordinating a review of empirical critical
loads for nutrient-N. Current reporting of ecological impacts of air pollution (acidification,
eutrophication and ozone damage) in the Article 9 template relies to a large extent on CLo and
CLe exceedances as a proxy for whole ecosystem damage. Future reporting from the NEMN will
therefore continue to report these metrics, in line with any agreed revisions in CLo and Cle values.
To provide supporting evidence, we propose to include monitoring and reporting of key parameters
that can be linked more clearly with indicators of direct air pollution effects and impacts on
ecosystems, discussed in this report.
For the purpose of sites selection to cover a gradient of risk, modelled total N deposition rather
than CLo or CLe exceedance was used, since the latter are available for designated features only
(e.g. with Eunis classifications such as SACs, SPAs). Future modelling of critical loads and levels
should be validated by this monitoring network, benefitting national modelling of impacts.
162. NEMN Structure
The aim of the NEMN is to provide evidence for negative impacts of air pollution on representative
terrestrial and freshwater ecosystems for Ireland, including evidence for ecosystem recovery time
when pollution pressure is reduced. The data collected will constitute the national response under
NECD. The design of the network also needs to be statistically robust. A well-designed network is
likely to support many scientific studies and thus contribute to reviews of critical loads and levels
at country and EU scale.
An assessment of air pollution impacts on ecosystems must be based on reliable evidence and
make best use of resources, that will inform policy and management needs:
Evidence needs:
• Detect changes in air quality (AQ) pollutant concentrations, and from the ecosystem
measurements identify the relationships to air pollution levels.
• Use of indicators that can be linked to air pollution impacts, distinguishable from climate
change impacts.
• Evidence must include receptor-based monitoring to detect, characterise and quantify
potential ecological changes in response to any potential improvements in air quality.
• Due to cumulative effects of reactive nitrogen (Nr) inputs and long time lags, rate of
ecosystem recovery are expected to be slow.
• Climate change is a key driver of ecological changes. Evidence from receptor-based
measurements must be able to distinguish between the effects of climate change and air
pollution.
• Both historic and current management practices will also affect ecological changes.
Best use of resources:
• Use of data from existing monitoring networks, national level surveys, modelled and Earth
observation data to contribute effectively to the NEMN monitoring and reporting.
• Coordination and synergies with existing national monitoring programmes, in particular
those established under the EU air quality legislative framework (EPA ambient air quality
network), NPWS, EMEP and Met Eireann networks and the ICP Forest Level I and II
network).
Air pollution effects on ecosystems are best assessed by monitoring both pressure and impacts.
Pressure measurements include pollutant concentrations (e.g. µg m-3 NH3) and deposition fluxes
(e.g. kg N ha-1 yr-1). In the case of ozone, it is the ozone uptake into leaves, i.e. the accumulative
uptake of ozone into leaves over a specified growing period or Phytotoxic Ozone Dose (PODy;
mmol/m2). Impact indicators include measurements that show whether the system is under threat,
sometimes called midpoint indicators, such as soil pH or N concentration in plant tissue (Rowe et
al., 2017). Impact indicators may also be endpoints, measurements that are directly relevant to
people’s experience of and concern for the environment (Rowe et al., 2017). Endpoints include
biodiversity indicators such as species-richness, and also biogeochemical targets such as the
Nitrates Directive limit of 50 mg NO3 L-1 for drinking water.
17Tiered monitoring strategy
A tiered monitoring strategy is proposed. Air pollution pressures on ecosystems will mainly be
assessed through a “Level II” network of monitoring stations and modelling of concentrations and
deposition; whereas impacts will be assessed through infrequent monitoring of a more extensive
“Level I” network, which includes the nested Level II network within it, in order to directly align
pressures with impacts at key sites. Nesting of Level II sites within the Level I network also allows
benchmarking of the national dispersion and deposition models required to estimate the pressures
(i.e. air pollution concentrations or deposition load) at each of the Level I sites, in order to assess
their contribution to observed impacts on ecosystems. Changes to semi-natural ecosystems
caused by air pollution are in many cases gradual, so Level I sites require monitoring only once
every several years. Such changes may be difficult to separate from the effects of other
environmental pressures and gradients. To detect air pollution impacts, data on floristic
composition and “slow” environmental variables such as soil pH or plant tissue N content are often
most useful, since these metrics integrate change over time (Rowe et al. 2017). Monitoring
pollution pressure requires more frequent, long-term continuous measurements and greater
annual costs, so fewer Level II sites are proposed.
A tiered approach is proposed for cost-efficient monitoring and reporting of air pollutant
concentrations and depositions in the NEMN (Figure 2-1.). Long-term data in air pollutant
concentrations and depositions are needed as evidence to detect changes in pressure from air
pollutants, and from the ecosystem measurements identify the relationships to air pollution levels.
A combination of modelling and on-site measurements of the key pollutants will provide the
necessary evidence to assess changes and potential recovery in ecosystem responses following
reduction in their emissions. The data will also provide the evidence to test how effective
abatement measures are in reducing their emissions.
Figure 2-1. Tiered monitoring strategy for air pollution monitoring in NEMN
18Level I
Additional clarifications from the EC to Article 9 monitoring states that “As a general rule and for
the sake of improved accuracy of the analysis, modelling should not replace measurements.
However, modelling can, for some parameters such as atmospheric NOX concentrations, usefully
complement monitoring data, especially when monitoring networks are of lower density and for
those sites where there are still gaps on measured parameters. Where applied, the use of
modelling to complement measuring should primarily concern atmospheric concentrations and
only if unavoidable also deposition of pollutants.” (EC, 2019b). Member States are strongly
encouraged to gradually extend and develop their monitoring networks to make sure that modelling
is only an interim solution, as measurements are the preferred option for all parameters in the
template (and measurements are also needed for the validation of models) (EC, 2019b).
Level II
It is recommended to carry out long-term, continuous measurements of NH3 with passive diffusion
samplers (e.g. ALPHA® samplers) at all level II sites, to detect changes in NH3 concentrations and
deposition, NH3 is a highly reactive, water-soluble gas with substantial spatial variability in
concentrations and deposition at a local scale. Studies have shown that reactive N deposition in
the vicinity of NH3 sources are dominated by dry NH3-N deposition (e.g. Pitcairn et al. 1998,
ROTAP 2012). Dry deposition of NH3 is generally largest in the high emission areas, where NH3
concentrations are also greatest, and intensively fertilized areas may in fact act as a net source for
NH3 rather than a sink. Therefore, deposition will mainly occur to nearby unfertilised land with a
small N content, and the amount of deposited N increases substantially close to the source. Semi-
natural ecosystems and conservation areas (which are of low N status) near emission source are
therefore particularly at risk. Also, while the centre of a large reserve may be less at risk than the
overall national assessments suggests, smaller reserves and the edges of large reserves are much
more at risk. For a robust assessment of ecological impacts of atmospheric NH3 at a sensitive site,
it is necessary to quantify the site-specific local NH3 concentrations and NH3-N dry deposition. It is
therefore proposed that monitoring efforts in the NEMN to focus on quantifying the site-specific
contribution by NH3 concentrations and deposition (NH3-N dry deposition) to the total N deposition
to the sensitive receptor.
Where current Level II sites, namely forests and freshwater will continue as planned (with some
modifications proposed in following sections), this distinction applies to terrestrial ecosystem Level
II sites. Level II sites for forest and freshwater sites will follow the proposed Terrestrial Ecosystem
Level II core monitoring plan.
Terrestrial Ecosystem Level II core
N deposition from other reactive nitrogen species in the atmosphere include dry deposited N from
HNO3, NO2 and NH4+, and wet deposited N from NH4+ and NO3- (Figure 2-2). Ammonium sulphate
and ammonium nitrate aerosol are formed by the atmospheric oxidation and reaction of precursor
gases (SO2, NOx) with NH3 and comprise a major component of fine particulate matter (Figure
2-2). In this form, PM2.5 makes an important contribution to sulphur and nitrogen deposition. The
gases and aerosols are removed from the atmosphere by wet (in precipitation) or dry (direct uptake
by vegetation and surfaces) deposition processes. The availability of concentration data will
decrease the uncertainty in estimating dry deposition and therefore total deposition of sulphur and
nitrogen species.
19Figure 2-2. Reaction scheme showing the emissions, atmospheric chemistry and fate of NH3, acid
gases and NH4+ aerosols. (reproduced from Tang, 2020a).
The low deposition velocity of particulate NH4+ to most types of vegetation (the exception would
be forest edges) means deposition from particulate NO3-, SO42- and NH4+ is expected to be small.
However, while the gases deposit locally close to sources, the aerosols can be transported longer
distances and contribute to pollution in places far from sources, including across national
boundaries. Ammonium in particle form is therefore a transboundary pollutant, exchanged
between Ireland and other countries.
Figure 2-3.Core recommended National Ecosystem Monitoring Network, including existing and
proposed sites.
20Selecting sites for representative coverage of key habitats
Six major categories of ecosystems (MAES Level II) are considered relevant for the NEC-Directive:
Grasslands, Cropland, Forests and Woodlands, Heathland and Shrub, Wetlands, and Rivers and
Lakes. These are also the key habitats listed in Annex I of the Habitats Directive. This phase of
network development focused on three priority habitats that are not well represented in the NEMN.
This included Grasslands, Heathland and Shrub, and Inland Wetlands (specifically bogs) (Sect.
1.2; Table 1-1). These were selected on the basis that they are sensitive to air pollution, in
particular to gaseous ammonia and N deposition, and that they are habitats of particular
conservation importance within Ireland. Feedback on Ireland’s 2018 submission of monitoring sites
required under Article 10 (4) b of the NECD 2016/2284 (European Union, 2016), stated
“Preferentially more (natural) grassland sites. Given the importance of the Irish mores and peat
bogs, more sites in these ecosystem types would also be welcomed” (WER, 2018). We therefore
recommend that this phase of the network focuses on these five specific Annex I habitats,
representing three of the MAES Level 2 ecosystems: 1) Grassland, 2) Heathland and Shrub and
3) Inland wetlands (Table 2-1.).
Table 2-1. Proposed inclusion of new sites from five key Annex 1 habitats in NEMN that are
nationally important sensitive habitats for Ireland.
MAES Ecosystem No. NEMN sites New sites to be
Annex I habitats NEMN Category
Type (Level 2) / reported 2019 reported 2023
Semi-natural dry
grasslands and
scrubland facies on 1: Ballymachugh
calcareous substrates (new site – no data 15
(Festuco-Brometalia) reported in 2019)
Grassland important orchid sites
(6210)
Molinia meadows on
calcareous, peaty or
clayey-silt-laden soils none 15
(Molinion caeruleae)
(6410) Terrestrial Ecosystem
Northern Atlantic wet
Heathland and Shrub heaths with Erica none 15
tetralix (4010)
Blanket bogs (7130) none 15
Active raised bogs
Inland wetlands 1: Clara Bog
(7110)/Degraded
Level II (new site –
raised bogs still 15
no data reported in
capable of natural
2019)
regeneration (7120)
35: ICP Forests
Level I
Woodland and Forest Forest No change
2: ICP Forests Level
II
1: ICP Waters 20 Upland Lakes
Rivers and lakes Freshwater
3: Acid Lakes 1 Marine Institute Lake
Urban ecosystems - none Not considered relevant
Cropland - none Not considered relevant
Sparsely or un-
- none Not considered relevant
vegetated land
81 new sites + 41
TOTAL number of
43 existing sites = 122
sites
sites in total
*Wet heath is commonly associated with blanket bog and we recommend only surveying this habitat on sites that
have blanket bog
21In Table 2-2, habitats are ranked in order of priority for inclusion in the Terrestrial Ecosystem Level
I network. This is mainly based on sensitivity to N deposition, according to their threshold for Critical
Load for nutrient-N. However, we considered it important to represent grasslands, in particular two
classes that can be very species-rich in Ireland, calcareous grasslands and Molinia meadows. If
there is insufficient resource to include sites from all five Annex 1 habitats, we recommend
prioritising the inclusion of the most sensitive habitats in the first phase (e.g. habitats with higher
ranking in Table 2-2), and considering the excluded habitats in the second phase instead. This
would be preferable to reducing replication (15 sites per habitat) or reducing the suite of monitoring
to be implemented at each site (see later).
Table 2-2. Priority ranking of habitats considered for inclusion within this phase of the NEMN.
Critical Load values shown are the ranges given in Bobbink & van Hettelink (2011).
Critical Load
Rank Habitat Likelihood of impact
(kg N ha-1 yr-1)
1 Raised Bog 5-10 High
2 Blanket Bog 5-10 High
3 Wet Heath 10-20 High
4 Calcareous Grassland 15-25 High
5 Molinia Meadow 15-25 Low – Medium
Bogs are particularly sensitive to N pollution, as indicated by their low Critical Load thresholds.
Raised and blanket bogs are distinct habitats and are typically monitored under separate
programmes by the NPWS, hence it was deemed appropriate to monitor both habitat types
separately within the NEMN. Of Ireland’s raised bogs, 44 were monitored as part of the 2013 raised
bog monitoring project (Fernandez et al., 2014). These sites are prioritised for inclusion within the
NEMN (see also Sect. 3.6).
Some of the sites identified for possible inclusion have multiple habitats present within the
ecosystem area. We recommend that the current phase focuses on the five habitats above (Table
2-2.), but that the potential for extending the survey to other habitats at the same sites is also
considered during site visits. We recommend that later phases of the network focus on other
pollution-sensitive habitats that are important in Ireland. These include:
• Dry heaths (4030)
• Lowland hay meadows (Alopecurus pratensis, Sanguisorba officinalis) (6510)
• Arable
• Improved grassland
• Limestone pavements
• Sand dunes
• Atlantic oak woodlands
• Alpine and Boreal heaths (4060)
Upland lakes are typically mapped to greater detail than MAES Level 2, and are mapped to either
Fossitt Level 2, or to Annex I habitat level, providing the required information for step 2 (Figure
1-1). However, limestone pavements, sand dunes, oak woodlands and upland lakes are also
nationally important habitats for Ireland and as such should be considered for future inclusion. This
network proposes site selection based on Annex I habitat, which will allow for more in-depth
comparison of impacts across sites. There are advantages to including sites from the Natura 2000
network, in particular in terms of habitat continuity, since these sites are afforded the strictest level
of protection in Ireland.
22You can also read