Smart prepayment & fuel poverty - A report for eaga charitable trust Contributing authors: Centre for ...
←
→
Page content transcription
If your browser does not render page correctly, please read the page content below

Smart prepayment
                  & fuel poverty
                  A report for eaga charitable trust

                  Contributing authors:
                  Nicky Hodges
                  Simon Roberts
                  Karen Smith
                  Toby Bridgeman
                  Nick Banks
                  Molly Asher
Photo: Eve Dias

                   October 2016
This research was made possible through grants from the
Smart prepayment                     Eaga Charitable Trust and Citizens Advice.

& fuel poverty                       It was also funded by USmartConsumer, a programme of
                                     the European Union.

A report for eaga charitable trust                                                           Co-funded by the

October 2016                                                                                 Intelligent Energy
                                                                                             Europe Programme of
                                                                                             the European Union

                                     The sole responsibility for the content of this publication lies with the authors. It does not represent
                                     the opinion of the European Union. Neither EASME nor the European Commission are responsible
                                     for any use of the information contained therein.
Contributing authors:
Nicky Hodges                         Project steering group members: Simon Roberts, CSE
Simon Roberts                        (chair); Colin Griffiths, Citizens Advice; Dhara Vyas,
                                     Citizens Advice; Daniel Walker-Nolan, Citizens Advice;
Karen Smith                          Stew Horne, Ofgem; Rosie McGlynn, Energy UK; Victoria
Toby Bridgeman                       Mason, BEIS; Daniel Alchin, Energy UK.
Nick Banks
Molly Asher                          Thanks to the project steering group for their input of
                                     advice and information early in the project and during the
                                     reporting phase. CSE is responsible for the reporting,
                                     including the findings and conclusions presented in this
                                     report. Individual steering group members or their
                                     organisations may not agree with all the findings and
                                     conclusions presented in the report.

                                     A special thank you to John, a volunteer who conducted
                                     the home visit interviews with Karen Smith, and to all the
                                     research participants.

                                                                         3 St Peter’s Court
                                                                         Bedminster Parade, Bristol BS3 4AQ
                                                                         0117 934 1400
                                                                         info@cse.org.uk
                                                                         www.cse.org.uk
                                                                                 www.twitter.com/@cse_bristol
                                                                                 www.youtube/user/csebristol
                                                                                 www.facebook.com/EnergySavingAdvice
                                                                         Charity 298740 | Company 2219673
                                                                         Founded 1979
Executive Summary
Purpose and context
This research was designed to contribute towards a better understanding of the effects of the
growing use of smart prepayment (PPM) meters on fuel poverty, particularly amongst households
already using conventional PPMs, a group that has historically been poorly served by the energy
market. As a part of this research, we also sought to gain insights into the views and experiences of
householders who have switched to smart PPM, so as to identify what further policy, regulatory and
practice measures might be appropriate to enable such households to maximise the benefits of
smart PPMs, including tackling fuel poverty and its harmful effects.
The study was originally timed to fit with the then-programmed smart meter main rollout – from a
then-timetabled DCC live date in September 2015. However, the rollout programme has been
repeatedly delayed since then, with the DCC live date currently programmed for ‘pre-Christmas
2016’. The study period also coincided with the Competitions and Market Authority (CMA)’s Energy
Market Investigation (EMI), which included consideration of detriment to prepay consumers; the
CMA’s final decision on remedies was published on 24 June 2016. The implementation of CMA
remedies for prepay consumers (assuming these are implemented) and the smart meter rollout will
together shape the institutional context for PPM tariffs and smart PPM installations up to 2020.
Supplier and consumer responses to these remedies can, in turn, be expected to influence fuel
poverty amongst prepayment consumers.
The research drew on published evidence concerning the prepayment segment of the domestic
energy market and sought insights from interviews with energy supplier representatives regarding
the future smart prepayment market. Qualitative research investigated the views and experiences
of households who have recently switched to smart PPM. Quantitative modelling was undertaken to
predict the potential effects on fuel poverty rates of a number of scenarios regarding smart PPM
uptake and changing prepayment tariffs. Using a small set of actual customer smart meter data, it
explored analytical opportunities to generate useful understanding of customer’s changing energy
usage patterns for future application with a larger sample covering a longer time period.

Findings

The emerging smart PPM market
Early smart PPM rollout is unevenly distributed across energy suppliers. Utilita, Ovo and British Gas
are at the forefront, with E.ON and Utility Warehouse also understood to be installing growing
numbers of smart PPMs. Marketing to date of smart prepay has almost exclusively focused on
conventional PPM consumers. Suppliers’ future marketing strategies for smart PPM remain under
wraps.
During early rollout, suppliers have installed SMETS 1 meters or ‘smart-type’ meters (which offer
some, but not all, of the functionalities included in SMETS-compliant meters). Smart Meter
Equipment Technical Specification (SMETS) is the minimum technical requirements of smart
metering equipment installed if it is to count towards suppliers’ rollout obligations. SMETS 2 is the

specification for mass rollout, which works with the DCC technology.1 As part of the rollout, all
suppliers are required to provide an unconditional offer of an in-home display (IHD) (see below)
when installing a smart meter system.
The CMA’s interim price cap, if implemented, is likely to be highly influential on the pace and
strategy for smart PPM marketing. It should see all PPM (conventional and smart) tariffs lowered
from January 2017. The higher specification ‘SMETS 2’ meters, which will offer improved ability to
switch suppliers or tariff type for PPM consumers, are exempt from the price cap. This is intended to
encourage suppliers to advance the pace of the SMETS 2 rollout, given the greater potential
customer benefits of PPMs meeting this specification.

Modelled effects on fuel poverty
Modelling undertaken for this study indicates that between 95,000 and 181,000 households would
be brought out of fuel poverty as a result of switching to a cheaper smart PPM tariff. The biggest
reduction would be achieved where 90% of existing convention prepay consumers switch to smart
PPMs tariffs equivalent to direct debit tariffs.
Despite a number of households remaining in fuel poverty after switching from conventional PPM to
smart PPM, many households are predicted to experience a reduction in their fuel poverty gap, with
the average fuel poverty gap (in the same scenario) reduced from £449 to £341.2
Assuming implementation of the CMA’s PPM proposed price cap (2017 – 2020) on prepayment
tariffs for conventional and smart (but not SMETS 2 ) meters, the cap would initially be more
important as a driver of this tariff-reduction benefit for fuel poverty than the switch from
conventional to smart PPMs.
With the rollout of SMETS 2, the comparative costs of prepay and credit tariffs and the improved
ability to switch to more competitive tariffs will become more important in shaping the ability of
consumers to move out of fuel poverty. The modelling did not factor in changes in customer
behaviour affecting their ability to reduce consumption and so save money. Whilst some behavioural
change may be expected as a result of smart meters being installed, many low income households
already tightly restrict their energy consumption to manage fuel costs and may have little
opportunity to reduce their energy consumption further. In the absence of any robust evidence of
this impact, it was decided that attempting to account for associated changes in energy consumption
would make the modelling more complex without necessarily bringing additional accuracy or insight.

Household experiences of smart PPM
The qualitative research explored householders’ experiences of using smart PPMs, in-home displays
(IHDs) and supplier-provided proprietary apps.
Smart PPM consumers predominantly used their IHD to monitor their credit balance and check
messages rather than to check historic or real-time usage. Less than half the householders, prior to

1
    DECC (2015) Smart metering equipment technical specifications: second version
2
 Fuel poverty gap is defined as the amount by which the assessed energy needs of fuel poor households
exceed the threshold for reasonable costs (the national median)
receiving a home visit, had explored other screens, such as screens showing historic usage. The
number of householders reporting use of the history screen increased from six to eleven (out of
fifteen) following a home visit. One reported this screen as particularly useful:
“Yeah, that’s [history screen] the function I use the most I reckon. I like to break it down over a week
and see what my cost is and if I’m within my target…. I like to try and keep tabs of what I’m using and
to budget really.”
Target setting, setting credit alerts and the visual display of live energy use were also notably under-
used functions prior to the home visit. Following the visit, there was increased use of these
functions, with some having set daily targets during or following the home visit.
A third of all householders (n=30) reported reduced electricity costs since switching to smart PPM,
with reasons including a cheaper tariff and increased awareness of energy use, leading to efforts to
reduce energy use. These efforts included more economical use of energy-hungry appliances,
turning appliances off standby more frequently and changing their heating practices. Householders
did not recall being provided with energy efficiency guidance on use of their IHD during its
installation.
Householders reported reduced anxiety as a benefit of their smart PPM, including worrying less
about running out of credit because they were able to top up online or over the phone at home or
when they are away. The ability to use so called ‘friendly credit’ without being charged any extra was
valued by those with children.
The supplier-provided proprietary apps used by case study householders did not offer real-time
energy use, making them unsuitable for checking baseload or appliance costing. This is an additional
reason in support of the Government requirement that any proprietary app should be additional to,
not instead of, the offer of an IHD.3

Discussion and Recommendations
This research provides evidence in support of the government’s requirement that suppliers provide a
genuine offer of an IHD with all smart meters and for any other proprietary device or app to be
offered as additional, not as an alternative to the IHD. IHDs offer greater functionality than
proprietary apps to help low income households identify energy saving opportunities in their home.
It also provides evidence in support of the importance of the smart meter installation code of
practice (SMICoP) minimum standards, particularly the sections on ‘Demonstrating the System to
the Customer’ and ‘Provision of Energy Efficiency Guidance’ for prepayment consumers. The
installation process is a key opportunity for delivery of information and advice to help vulnerable
and fuel poor PPM consumers get the most from smart metering and their IHD as a helpful tool to
reduce energy waste and manage their fuel bills. Recommendations are focused around this process.

3
 A range of other reasons were put forward in responses to consultation DECC (2016) In-Home Display Licence
Conditions: consultation response https://www.gov.uk/government/consultations/smart-meter-in-home-
display-licence-conditions including, amongst others, that an app on a person’s phone won’t be useable by all
members of a household, and does not provide a traffic light system for at a glance use.
OFGEM
Request and review material evidence of compliance with SMICoP minimum standards, in
particular on ‘Demonstrating the System to the Customer’ and ‘Provision of Energy
Efficiency Guidance’. OFGEM should satisfy itself that for prepayment consumers, energy
efficiency guidance is not being skipped over to fit in time for demonstration of the
prepayment functions, particularly where installers are under pressure to achieve high
target numbers of installations so that suppliers can meet the 2020 deadline.
Request suppliers to review and report on prepayment customer feedback regarding energy
efficiency advice and prepayment functions.
Encourage supplier-led trials of ‘beyond the minimum standards’ energy efficiency advice to
smart PPM consumers.
Department for Business, Energy and Industrial Strategy (BEIS)
Work with OFGEM to identify where suppliers need to be pushed harder and held to
account as part of the smart meter rollout towards reducing fuel poverty.
Smart Energy GB
Develop campaign materials aimed at smart PPM consumers that promote awareness of the
use of IHDs as helpful tools to reduce and manage energy use as well as more convenient
top up and credit-checking.
Energy UK
Support and co-ordinate efforts by suppliers to fulfil SMICoP minimum standards,
particularly ‘Demonstrating the System to the Customer’ and ‘Provision of Energy Efficiency
Guidance’ for their prepayment consumers.
Encourage suppliers in their development of a smart PPM ‘pre-installation to post-
installation’ customer engagement strategy to enable vulnerable and fuel poor PPM
consumers to realise the benefits of smart metering as fully as possible.
Energy Suppliers
Develop a smart PPM ‘pre-installation to post-installation’ customer engagement strategy.
Pre installation
Produce videos to communicate how consumers can use their IHD to achieve energy
demand reduction and budgeting activities as well as prepayment functions.
During installation
Installers carry tablet-type devices for consumers to view videos or tutorials which:
o prepare consumers (including all energy users in home) for their use of different
functions on the IHD;
o help consumers to think about their energy practices and where they could reduce
energy waste; and
o encourage consumers to ask the installer questions and play with the display
themselves.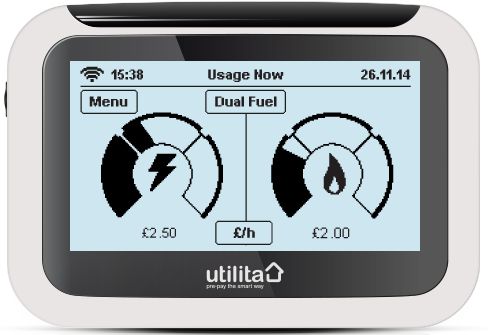
Post-install
Design and implement an annual programme of post-install energy efficiency messages
delivered via the messaging function on their displays.
Frame energy advice to PPM consumers as helping to encourage healthy and less wasteful
energy choices.
Provide energy reports to households which present the cumulative effects of their energy
efficiency actions on their fuel use/bill.
Offer a phone top-up registration service for consumers who want to top up by phone but
don’t have internet access.
Resource and support community-based advice, such as local trained energy champions.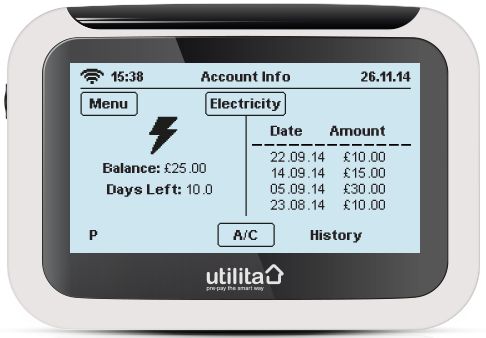
Contents
Executive Summary.................................................................................................................... 3
Table of Figures .......................................................................................................................... 1
1      Introduction ........................................................................................................................ 3
2      Approach and Methodology ............................................................................................. 10
3      Smart PPM market and regulatory context ..................................................................... 14
4      Qualitative research with conventional PPM switchers .................................................. 26
5      Qualitative case studies of smart prepay consumers ...................................................... 31
6      Modelling a switch to Smart Prepay................................................................................. 55
7      ‘Proof of concept’ experimental analysis of customer data ............................................ 67
8      Discussion ......................................................................................................................... 70
9      Implications for research, policy and practice ................................................................. 73
Appendix 1: Experimental analysis of Smart PPM Customer Data of Households in
Qualitative Quasi-Experimental Research ............................................................................... 76
Appendix 2: Home Visit Form and Follow Up Phone Call Sheet for Case Study Householders
   82

Table of Figures
Figure 1: The modelled changed of method of payment arrangements for all households in England
under Option 1 (n = ~22.6 million households) .................................................................................... 59
Figure 2: Changing fuel poverty circumstances and method of payment arrangements for houses
experiencing a change in either fuel poverty or method of payment fopr electricity under Option 1.
[Note: Households not experiencing chaning in circumstances are not shown] (n = ~5.9 million
households)........................................................................................................................................... 60
Figure 3: Option 1: Number of households switching to smart PPM and average bill savings, by
disposable income decile ...................................................................................................................... 65
Figure 4: Option 2: Number of households switching to smart PPM and average bill savings, by
disposable income decile ...................................................................................................................... 65
Figure 5: Option 3: Number of households switching to smart PPM and average bill savings, by
disposable income decile ...................................................................................................................... 66
Figure 6: Average half hourly energy consumption each month for all consumers by gas and
electricity. ............................................................................................................................................. 68
Figure 7: Average half hourly energy consumption each month for all consumers by gas and
electricity. ............................................................................................................................................. 77
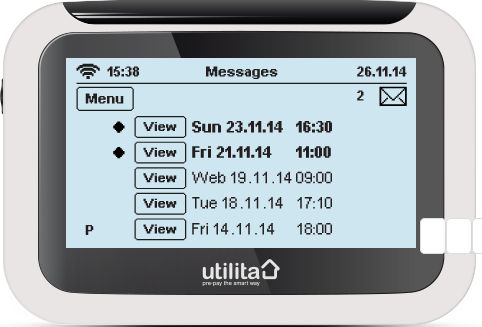
Figure 8: Average half hourly average energy consumption for all cases over a typical week (a week
starts at 00:00 Sunday and runs until 23:59 Saturday)......................................................................... 78
Figure 9: Before and after average weekly electricity consumption profile of households experiencing
a reduction in their electricity consumption. This combined test cases and control cases. ................ 79
Figure 10: Before and after average weekly electricity consumption profile of households
experiencing a reduction in their gas consumption following a home visit of advice via the phone. . 80
1      Introduction
This research was designed to contribute towards a better understanding of the effects of the
growing use of smart prepayment (PPM) meters on fuel poverty, particularly amongst households
using PPMs. This is in recognition that this group continues to be poorly served by the energy
market, paying higher tariff rates for their energy, facing barriers to switching energy supplier and/or
payment method (particularly consumers carrying debt4) and being more likely to self-disconnect
when facing short term choices about budgeting (e.g. eating or heating)5.
As a part of that wider aim, it also sought to gain insights into the views and experiences of
householders who have switched to smart PPM, towards identifying what further policy, regulatory
and practice measures might be appropriate to enable such households to achieve benefits from
smart PPMs, including tackling fuel poverty and its harmful effects.

1.1      Smart metering and fuel poverty evidence
The smart metering roll-out has been presented as a potentially enabling technology change in the
strategy to tackle fuel poverty, although it is recognised that there will be limits in how far smart
metering alone will be able to make a difference to consumption by households in fuel poverty,
Smart metering is expected to help enable consumer behavioural changes to reduce their energy
consumption and to switch to cheaper tariffs more easily and so save money on their energy bills,
though vulnerable customers are likely to require greater support.6 A variety of trials have been
undertaken to understand the potential for energy and cost savings associated with smart metering.
Evidence on the extent to which fuel poor households will have scope to achieve savings behavioural
changes has been challenged.7,8
The use of smart metering-enabled real live data for accurate identification of fuel poor households
and so better targeting of investment and activities is identified as another way in which smart
metering can contribute to tackling fuel poverty. However, as noted in the Smart Metering Early
Learning Project Synthesis Report, this requires customers to share their data and institutional
support to respond appropriately. So far, the potential significance of smart metering on fuel
poverty remains uncertain and contested.

4
    Reforming the switching process for indebted prepayment meter customers, Ofgem September 2014
https://www.ofgem.gov.uk/ofgem-publications/90376/openletter.pdf
5
 Topping up or dropping out: self-disconnection amongst prepayment meter users. Dhara Vyas, Citizens
Advice & Citizens Advice Scotland, October 2014.
www.citizensadvice.org.uk/Global/Migrated_Documents/corporate/topping-up-or-dropping-out.pdf
6
 Smart meter roll-out for the domestic and small and medium non-domestic sectors (GB) Impact Assessment.
http://bit.ly/1AZMCPJ
7
 See ‘Securing the benefits of the programme for consumers’ in Public Accounts Committee Update on
Preparations for Smart Metering 2014/15 http://bit.ly/2dBgr2O
8
 Darby, S., Liddell, C., Hills, D. & Drabble, D. (2015) Smart metering early learning project: synthesis report.
DECC.
1.2 Background on prepayment energy, smart metering and energy market
investigation
This section explains some of the technical terms used in the report which may be unfamiliar to
some readers of the report.
1.2.1 Prepayment and conventional PPMs
Prepayment is one method of paying for electricity or gas used in the home – it is paid for upfront,
before the energy is consumed. In addition to covering the standing charge and per unit charge, the
meter can be set up to pay off arrears on an energy debt. For this reason, prepayment meters
(PPMs) have frequently been installed in the properties of households with energy debt. Some
households request a PPM as an aid to budgeting whilst some rented properties also have PPMs
installed to avoid fuel debts being ‘left behind’ by ex-tenants. The number of consumers paying by
prepayment doubled from 7% in 1996 to 16% in 2015 (CMA, 2016). With a PPM, the supply of
energy can be interrupted when credit on the meter runs out. Self-disconnection happens when all
credit is exhausted, including emergency credit (a fixed value) or so called ‘friendly credit’ (periods of
the day when suppliers do not disconnect whatever the consumer’s usage or credit status).
Conventional PPMs are topped up with credit using a card or key – usually at local shops or Post
Offices with a PayPoint or Payzone facility.
1.2.2 Smart meters and the smart meter rollout
Smart meters are new gas and electricity meters that track energy use regularly through the day and
provide information about the energy used by a household directly to the householder and to their
energy supplier. This removes the need for manual meter readings and for estimated bills.
The smart meter rollout programme in Great Britain is being managed by the Department for
Business, Energy and Industrial Strategy (BEIS).9 The rollout requires energy suppliers to install smart
meters for their consumers as standard by the end of 2020. But there is no legal obligation on
individuals to have one. The smart meter roll out includes an early rollout stage (since 2012/2013)
and a mass rollout stage (from late 2016).
A new Data Communications Company (DCC) is responsible for linking smart meters in homes with
the systems of energy suppliers, network operators and energy service companies. DCC Live is the
date when this system will go live, after which the main rollout can commence. The DCC live date
has been repeatedly delayed and is currently understood to be ’before Christmas 2016’. At the time
this project was designed the DCC live date had been timetabled for autumn 2015. 10
Smart Meter Equipment Technical Specification (SMETS) is the minimum technical requirements of
smart metering equipment installed if it is to count towards suppliers’ rollout obligations. During
early rollout, suppliers have installed SMETS 1 meters or ‘smart-type’ meters (which offer some, but
9
Since this report was drafted, the former Department for Energy and Climate Change (DECC) has been
merged into the new Department for Business, Energy and Industrial Strategy (BEIS). All relevant DECC
responsibilities have been transferred to BEIS.
10
Utility Week (2015), “Government expects a 4 month delay to DCC’s smart meter plans”
4not all, of the functionalities included in SMETS-compliant meters). SMETS 2 is the specification for
mass rollout, which works with the DCC technology.11
As part of the rollout, all suppliers are required to provide an unconditional offer of an in-home
display (IHD) (see below) when installing a smart meter system.
The Smart Meter Installation Code of Practice (SMICoP) sets out consumer protection standards
during the installation process, including making sure the customer ‘knows how to use, and benefit
from, the smart metering equipment to improve the energy efficiency of their home’.12 The SMICoP
aim includes achievement of smart meter programme long term behavioural changes.
1.2.3 Smart PPMs
Smart meters can be set to operate in prepayment mode or in credit payment mode. For smart
meters operating in prepayment mode, the IHD provides additional functionality, to show
information on remaining credit, debt balance, emergency credit balance, and low credit alerts.
Smart meters also enable users to set target usage and limits on usage - functions which are likely to
be particularly useful for PPM users, who like the budgeting features of prepay. New smart PPMs
allow for prepayment online, by text or on the phone. For meters set in prepayment mode, the
SMICoP requires a demonstration of prepayment functions at the point of installation.
Unlike SMETS 1 and ‘smart-type meters’, the SMETS 2 technology will allow consumers to switch
suppliers without needing to get a new meter. Early adopter smart prepay consumers with SMETS 1
or ‘advanced’ meters will lose ‘smart’ functionality on switching supplier. Consumers would then
either have to revert to non-smart metering or request a new SMETS 2 meter.
1.2.4 In-home display
An in-home display (IHD) is a handheld electronic device kept in the home. It takes information from
the smart meter and shows a household’s energy consumption, including near real time energy use,
and energy usage in the last hour, week, month or year. It allows all energy users in the home to
view this information. Information on energy usage can be displayed in pounds and pence or in kWh
or carbon emissions. A visual display also shows whether current usage is high or low. The
government requires that every household is made a genuine offer of an IHD.13
During the early rollout, some energy suppliers have offered proprietary apps for smart phones
either as an alternative to, or in addition to the offer of an IHD. The government has since clarified
its requirement that suppliers are obliged to make an unconditional free offer of an IHD. In addition
to the IHD, suppliers may choose to offer other means of engaging with energy consumption, such
as via the internet or via proprietary apps, for use on smart phones or tablets.14 A grace period was
set for suppliers to come into compliance with this clarified requirement.
11
DECC (2015) Smart metering equipment technical specifications: second version
12
Smart Meter Installation Code of Practice (SMICoP) http://www.smicop.co.uk/SitePages/Home.aspx
13
Smart Energy GB ‘FAQs: What are smart meters?’ https://www.smartenergygb.org/en/faqs?category=what-
are-smart-meters
14
DECC (2016) In-Home Display Licence Conditions: consultation response
https://www.gov.uk/government/consultations/smart-meter-in-home-display-licence-conditions
51.2.5 CMA Energy Market Investigation
The Competition and Markets Authority (CMA)15 opened its energy markets investigation (EMI) in
June 2014, following a referral by Ofgem. It concluded the investigation in June 2016. Its final report
sets out a range of reforms, with the stated aims of driving down costs by increasing competition
between suppliers, whilst protecting those less able to benefit from competition. The measures also
include technical and regulatory changes intended to modernise the energy market and make sure it
works in consumers’ interests.16 In the press release accompanying publication of the final report, it
is stated:
‘The options to switch are far more limited for the 4 million households on prepayment
meters. For these customers, a transitional price cap will be introduced which will reduce
bills by around £300 million a year. The cheapest tariffs for such customers are currently
£260 to £320 a year more expensive than those available for direct debit customers. The
price cap will remain in place until the introduction of smart meters removes the
limitations on such customers accessing better deals.’17
It proposes that the interim price cap be in place from 2017 to 2020, by which time the smart meter
rollout is due to be completed. Interoperable SMETS 2 smart meters will not be subject to the cap.
15
The CMA is the UK’s primary competition and consumer authority, with responsibility for carrying out
investigations into mergers, markets and the regulated industries and enforcing competition and consumer
law.
16
https://www.gov.uk/cma-cases/energy-market-investigation
17
CMA (2016) Press release: CMA publishes final energy market reforms.
https://www.gov.uk/government/news/cma-publishes-final-energy-market-reforms
61.3 Original research design and questions
The original research identified the following stated research questions:
• Can smart PPMs provide an effective tool and solution to help address fuel poverty (by
helping consumers control and manage their energy use)?
• Are low income consumers realising the benefits promised from smart PPM and to what
extent?
• What additional benefits and opportunities could be realised with policy and practical
intervention?
• Will the smart meter roll out result in more low income households paying more than
they need to for energy as a result of them switching to smart PPM tariffs?
• What advice and help do low income/fuel poor households need to ensure they get the
full benefits from smart PPM when and if they are installed (i.e. to ensure smart PPM
has a positive impact in reducing vulnerability to fuel poverty)?
The original research design was devised to enable these questions to be answered using a mixed
methods approach, comprising: a published data review; quantitative analysis of datasets of smart
PPM customer’s energy consumption patterns; and quasi-experimental qualitative research
concerning the experiences of householders with smart PPM: firstly, with householders who had
switched from conventional PPM; secondly, with households who had switched from credit forms of
paying for their energy. Both qualitative research elements were intended to include a test ‘with
home visit advice’ group and a control ‘no advice received’ group, to enable consideration of how
attitudes and experiences varied according to the advice given.
In practice, the actual approach followed varied from this design, with the focus of investigation
revised, in the light of: external factors affecting the research assumptions and data availability;
insights gained in undertaking the research; and from the advice of the project steering group.
1.3.1 Effects of smart meter rollout delay on research assumptions and data availability
This research was intended to coincide with the planned start of the main smart meter rollout, to
generate early insights which could inform practice, particularly for the PPM segment as the rollout
proceeded. The main rollout has been repeatedly pushed back, first to April 2016, then to
September or October 2016, with remaining uncertainty regarding actual timing.18 The slippage of
the smart metering implementation programme has meant that just a handful of suppliers
proceeded with installation of smart (or smart-type) PPMs in customer households during the period
of the study. Installations were mainly by new entrant suppliers (notably Ovo Energy and Utilita) or
in trials by Big Six suppliers (notably, British Gas and E.On). Although numbers installed are
understood to be in the thousands, it proved more difficult than expected to secure a suitably-sized
sample of smart PPM customer energy consumption data for analysis using the intended approach.
Utilita collaborated to supply half hourly energy consumption data for thirty consumers who
participated in qualitative research and consented to their consumption data being shared for the
purpose of the research. By itself, however, this dataset was too small and covered too short a time
period to be suitable for answering questions of whether smart PPMs are helping consumers control
18
Utility Week (2015), “Government expects a 4 month delay to DCC’s smart meter plans”
7and manage their energy use. Nevertheless, it did prove useful as an experimental dataset, with
which to test the suitability of techniques for analysis of customer consumption data.
The difficulties in securing relevant customer datasets led us to instead adopt a modelling approach,
making use of suitable national representative household survey data. However, this necessarily
required a change in the focus of research questions investigated. The revised design and approach
is described further below.
The delay to the main smart meter rollout also affected our ability to undertaken one strand of the
envisaged qualitative research. An underlying assumption of the research design was that the smart
meter rollout would lead to an expansion of the prepay market through the marketing of new pay-
as-you-go tariffs, with tech-savvy consumers switching from credit tariffs to smart PPM tariffs. The
research design had included ‘credit to smart PPM’ switchers as a target population of interest, as
part of the second qualitative research. But during the research, it proved impossible to identify
households who have voluntarily switched from credit formers of payment to smart-enabled
prepayment. We surmise that this is partly due to the delayed rollout and the focus of early
marketing approaches taken by suppliers on households with conventional PPMs installed or existing
credit consumers in arrears.
1.3.2 Research team and project steering group led changes to the design
The research team and project steering group agreed on a number of changes to the research design
in response to constraints encountered, new intelligence gained and our own developing
appreciation of the context. The most noteworthy of these changes to be aware of are:
A methodological change to use of modelling-based approaches to understand the effects
of smart PPM on fuel poverty rates, in response to insurmountable difficulties in gaining
timely access to suitable customer consumption data for use in analysis;
The inclusion of informational interviews with supplier representatives as a source of
insights on the future direction of the smart PPM market, partly in response to limited
access to suitable published statistics and other evidence; and
The presentation of findings from one set of qualitative interviews as case studies, with
limited further analysis, to reflect recognised limitations in the suitability of the data to
generate generalizable findings. This arose from difficulties in identifying individuals who
fitted the intended profile of participants - consumers who had switched directly from a
credit-type tariff to a smart prepay tariff.
1.4 Revised design and research questions
1.4.1 Revised design
In light of the effects of external factors and the decisions of the research team and steering group,
the revised design comprised:
Contextual analysis of the existing and developing smart PPM sector, drawn from desk
analysis of published evidence and a set of three telephone interviews to gather the
perspectives from energy supplier representatives. This understanding served to frame the
revised design of other research elements as well as to inform interpretation of the primary
research findings.
8 Quantitative modelling, using nationally representative household survey datasets, to
predict how the smart meter rollout would potentially affect rates of fuel poverty (and
associated fuel bill savings for consumers), based on three scenarios.
Qualitative research with former conventional prepay consumers (n=30) who have had a
smart PPM installed, including a quasi- experimental comparison of the experiences of
householders who received a home visit advice session in use of their IHD and those who did
not.
Qualitative case study home visit and semi-structured interviews with smart prepay
consumers (n=3), including exploration of their use of apps instead of IHDs.
Experimental analysis of a small set of actual customer PPM energy consumption data
(n=30).
1.4.2 Revised research questions
The research questions explored using this revised design and reported here include:
Smart PPM market and supplier approaches to smart prepay
What has been the scale and nature of smart PPM installations as part of the early smart
meter rollout?
How will the move to smart prepay affect supplier’s communication with and support to
vulnerable prepay consumers?
What are supplier’s longer-term marketing strategies for smart PPM - and what is the place
of vulnerable and low income households within that?
Fuel poverty and household energy bill effects of smart PPM rollout
What is the likely quantitative effect of smart PPM rollout to 2020 for fuel poverty levels?
Consumer experiences of smart PPM; informed by contextual analysis and qualitative research
What has been the experience of consumers moving from conventional PPM to smart PPM?
How has the switch to smart PPM affected energy consumption in fuel-poor households?
How are households using their IHDs? With what effects for their energy behaviours,
lifestyles and finances?
What health effects are associated with the shift to smart prepayment?
What messages or actions merit further attention as possible means of enabling consumers
to more fully realise the benefits of smart PPM?
Analysis opportunities of using smart PPM consumer data in fuel poverty research; informed by
experimental analysis
What opportunities does analysis of actual customer consumption data offer to understand
the effects of smart PPM installation and experimental interventions on energy consumption
patterns and fuel poverty?
What methodological and data requirements are important in the design of future research
using such modelling analysis?
In the following chapters, the findings from each of the research activities are reported, leading on
to discussion of the findings and conclusions.
92 Approach and Methodology
The research used a mixed methodology to investigate the relevance of smart PPM rollout for fuel
poverty, with quantitative investigation of the effects for fuel poverty at a national and a household
level and qualitative investigation of the experiences of smart PPM consumers. A steering group met
at two points during the research, contributing towards revisions to the research approach and, in
the latter meeting, to reflect on draft findings and their potential application to inform future
research and policy.
The evidence sources, method of data collection and analysis methods used in each of research
component are described below. This includes outlining limitations specific to particular components
of the research.
2.1 Desk analysis and energy supplier key informant semi-structured interviews
Desk analysis of published reports and statistics on trends affecting prepay consumers provided a
contextual understanding of the emergent smart PPM market. It drew on attitudinal and tracker
surveys and reporting data published by BEIS and Ofgem, evidence produced as part of the CMA EMI
and Citizens Advice published research on PPM households.
A small number of semi-structured telephone informational interviews were conducted with senior
customer engagement executives representing energy suppliers active in the early smart PPM
rollout to draw out some industry insider insights on the developing smart PPM sector. The
interviews were guided by a pre-provided set of questions, asking about current and future
marketing approaches as well as communication with consumers, including vulnerable consumers.
This contextual research informed the design of research tools used in the qualitative research and
assumptions used in the modelling.
2.2 Quantitative modelling of the effects of smart meter rollout on fuel poverty in
England
The quantitative analysis element was significantly modified from the originally proposed approach
to undertake analysis of a large anonymised set of actual PPM customer energy consumption. It
proved impossible within the research timeframe to secure access to a large set of customer data
from energy suppliers.
From project inception, CSE contacted a number of energy suppliers to request they release a set of
anonymised customer smart PPM energy consumption data, ideally to include some ‘pre-smart’
consumption data to compare against. However, despite persistent efforts over a period of six
months, we were unable to negotiate the release of data. Particular barriers encountered included:
relatively frequent changes of contact person at suppliers without handover, requiring
recommencement of negotiations or non-response from suppliers; concerns about data disclosure
and data security arrangements; and prioritisation of in-house data analysis demands by suppliers.
Where reasons were given for not releasing data, reasons cited were:
That the smart prepay market is too underdeveloped as yet to be able to discern trends;
That in-house teams are doing analysis of the customer data and hence there is a reluctance
to make it available to others, and;
10 That they have insufficient numbers of smart prepay consumers to make available a dataset
to us (the supplier in question actually had several thousand).
Conversations continued with Ovo energy for longer than with the other energy companies
approached, but eventually they too were not able to provide data in the extended timescale
offered and we made the decision to stop pursuing that opportunity in April 2016.
Lessons learned for future projects include: pre-engagement with suppliers at research design stage;
setting out a clear strategy for negotiating and securing access, with suitable resource allocation;
production of a project brief for suppliers, to minimise duplication of effort and ensure consistency
of message; use of face-to-face meetings where possible; keeping an audit-trail style record of
contact with suppliers; and using steering group and internal review processes as opportunities to
review the effect of external or previously unknown factors on the timeliness and deliverability in
line with the proposed approach.
It was decided instead to undertake modelling to forecast the impact of smart PPM on fuel poverty.
The modelling applied an analytic model to socio-demographically representative samples of
households, according to a set of stated assumptions. The methodology used, including the
assumptions applied, is described in greater detail in 6.2 below. The analysis identified estimates of
the number of households in England estimated to be brought out of fuel poverty and the effects on
household fuel bills.
2.3 Qualitative research with prepay consumers who have moved to smart PPM
The research included a test group of 15 Utilita customers with smart PPMs, who had previously had
‘conventional’ PPMs as customers of a different supplier. Home visits were made to each household,
with a short follow-up telephone interview conducted approximately four to six weeks following
their home visit. The home visit consisted of a half hour interview which gathered information on
the property, occupancy, fuel payments, household energy-using practices and any energy-related
issues. This was followed by an interactive session in which energy advisers from the Centre for
Sustainable Energy (CSE) guided householders through all of the screens of their Utilita IHD and
explored with them how to use the display to manage and reduce energy use, tailored to their home
situation. In follow-up interviews, householders were asked questions about their use of their smart
meter display since the home visit, as well as on their views of the advice given. A control group of
15 Utilita smart prepay consumers participated in a short telephone interview about their
experiences in using their smart meter display only.
Householders were mainly recruited through telephone invitations, using contact details provided by
the energy supplier Utilita, with some householders recruited through CSE advice line calls and
workshops. Householders had their smart meter and display installed predominantly in the 3
months prior to the research (June-August 2015) with only 5 of the 30 interviewees having
installations before then. Interviews took place late August-December 2015. It was not possible to
explore space heating costs with every household as the heating was either not yet on, or had only
be used for a relatively short period. However, householders were able to discuss electricity costs.
11All interviews were audio recorded and transcribed, and then qualitatively analysed using thematic
analysis.19
This research component was separately funded by the Chesshire Lehmann Fund and the
USmartConsumer project. The findings, with write-ups of individual case studies, are reported in full
in Simpson et al (2016).20 Key findings relevant to this research are reproduced in this report.
Customer energy consumption data for gas and electricity over a period of 7 months for all
participating households was supplied to CSE by Utilita, with the permission of householders.
Analysis of this data was undertaken as part of the quantitative analysis component of this research
(see Chapter 7 below).
2.4 Qualitative research with consumers of different suppliers who have a smart PPM
This research component varied importantly from its originally intended scope. The proposed design
was to compare a test group and a control group of former credit payment consumers who have
switched to smart PPM. However, this proved unachievable. The limited rollout of smart PPM over
the relevant time period, with initial targeting by suppliers mainly of households with conventional
PPMs, meant that the research was unable to identify households fitting the profile of the intended
population of interest, namely former credit payment consumers who have switched to smart PPM.
The recruitment strategy was limited on practical grounds to within a reasonable travel distance of
Bristol. The reluctance of energy suppliers to provide access to existing consumers as a sampling
frame further impeded the ability to secure suitable participants.
Alternative recruitment strategies were pursued, including using CSE’s own social media channels
and customer database to recruit suitable participants and engagement of a research participant
recruitment agency, guided by an agreed screening process and with a more generous incentive
payment. The research was also promoted via a partner debt advice agency’s social media channels.
In recognition of the additional effort required per participant to recruit, a reduced target of 6-8
participants in each group was defined. However, in practice, just four participants from over 300
contacts were screened as meeting the criteria. Most of the contacts screened out as unsuitable had
a conventional PPM or used credit payment and had a smart meter. Furthermore, at the time of the
home visit, it transpired that every participant who was selected via the screening process had in
fact most recently switched from a conventional PPM to a smart PPM, rather than from credit
payment, which they had indicated in their answers to the screening questions. The study’s failure to
identify any suitable candidates suggests that to date a very limited number of households have
switched from a credit form of payment to use of a smart PPM.
As only a handful of participants were positively identified to participate, the research approach was
modified to conduct a home visit and follow-up phone call for each participant, to gather as rich as
possible data as a set of qualitative case studies. This was instead of the proposed quasi-
experimental design, which would have required larger numbers to have a meaningful test and
19
Thematic analysis is a method used in qualitative research which involves identifying, analysing and
reporting patterns in data
20
Simpson, K., Smith, K. & Thomas, K. 2016 Smart Prepayment meters: householder experiences.
Centre for Sustainable Energy https://www.cse.org.uk/smart-prepay-hh-experiences.pdf
12control group. Three case study household interviews were conducted, two of which were followed
up by a short phone calls concerning the advice provided on use of their IHD (the third participant
did not have an IHD so such advice could not be provided during the visit). One eligible participant
dropped out before the home visit was conducted.
The home visits consisted of an interview which lasted around 30 minutes, followed by an
interactive session in which the energy advisers from CSE guided the participants through all of the
screens of their IHD and/or smartphone app. In follow-up interviews, participants were asked
questions about their use of their smart meter display use since the home visit, as well as on their
views of the advice given. Screen shots of IHD screens and/or app views were taken as a record of
customer’s energy consumption history. All interviews were audio recorded and transcribed, and
then qualitatively analysed using thematic analysis. They were each written up as an individual case
study in order to provide a rich picture, with limited further analysis of findings from the small
number of cases.
2.5 ‘Proof of concept’ analysis of smart PPM customer energy consumption data
Analysis of patterns of actual smart PPM customer energy consumption data were conducted for 28
of the sample of 30 smart PPM Utilita consumers who participated in the qualitative quasi-
experimental research. Utilita provided CSE with energy consumption data for electricity and gas for
28 of the 30 households covering several months either side of the intervention. The data was
provided under a specific contract and data sharing agreement; CSE received permission to analyse
the data for the purposes of this project. This analysis compared the energy consumption patterns
by the test group and the control group using half-hourly energy consumption data. Supplementary
data, including the date and type of the intervention, was also used in the analysis.
The core set of data contains the meter number, fuel type, meter type and half hourly intervals of
energy consumption in kWh. In addition, some supplementary data, which included the date and
type of the intervention was used in the analysis.
Interventions occurred from the end of August to the end of October; before or in the early part of
the heating season. Pre-intervention data covering predominantly the spring and summer months,
although three consumers have data that starts in last week of January 2015 or early February.
However, the majority of customer data starts in May, June or July. Data collection continued after
the interventions until the end of December. This means that drawing any detailed conclusions on
the impact of the interventions is difficult; there is not sufficient data to establish baseline levels of
consumptions, nor account for seasonal influences. This was anticipated, with the principal purpose
of this element of the study being to test the efficacy of our analytical approach and reveal its
potential value if applied to a larger dataset, with more complete pre- and post- installation data.
Data for a four week period around the intervention for each household was interrogated – covering
the two weeks before and after the intervention (or the date of the telephone interview, for control
case).
133 Smart PPM market and regulatory context
3.1 Introduction
This section seeks to arrive at a clearer picture of the number and profile of smart prepay energy
consumers, the shape of the emerging smart PPM sector and the situation of vulnerable and fuel
households within that sector. It draws on published evidence and statistics on the smart PPM
market, including: Ofgem’s supplier performance on social obligations annual reporting; Citizens
Advice and Ofgem attitudes tracker and consumer surveys; and data captured by the CMA
investigation. It also incorporates insights from informational interviews with senior staff from three
energy suppliers, including two ‘Big Six’ suppliers and one independent supplier – all three have had
some early engagement in the roll out of smart PPMs.
3.1.1 Trends in numbers of prepay consumers
The number of consumers paying for their energy with a PPM has been increasing in recent years. In
2014 17% of all electricity accounts and 15% of all gas accounts were paid for through a PPM. This
was 2% more for electricity and 4% more for gas than at the end of 2013.21
PPMs are often used by suppliers to recover debt from consumers. This is particularly the case
where the consumer can only afford small repayments that would necessitate more than a year to
clear the debt. Prepay is often the only repayment method that suppliers will accept in these
circumstances. Once a PPM is installed then a supplier can gradually recover debt from the customer
as part of their meter top-ups. Additionally, many consumers find it is easier to budget for energy
with a PPM. With this payment method it is impossible to spend more than you have on your meter
and so impossible to build up a debt. This does mean, however, that if a customer gets their budget
wrong they will be left with no energy, which, particularly for vulnerable consumers, carries a
significant risk.22 Citizens Advice, in analysis exploring self-disconnection and self-rationing of energy
by prepay energy consumers, finds that a majority are not using their PPM to repay debt and tend to
refer this form of payment as a budgeting/lifestyle tool23.
3.1.2 Demographic characteristics of prepay energy consumers
An appendix to the CMA final report included analysis of the demographic characteristics of prepay
consumers24. It identified that:
compared with both direct debit and standard credit consumers, prepay consumers are
significantly: less likely to have a degree as their highest qualification; and more likely to
have a GCSE as their highest qualification. Compared with direct debit consumers, prepay
consumers are significantly more likely to have no qualifications.
21
Ofgem (2015), Domestic Suppliers’ Social Obligations: 2014 annual report
22
CSE is undertaking advice and advocacy work to support prepay consumers in the West of England including
to change supplier, tariff or payment method. Our direct practical experience is that if a customer wishes to
move to direct debit there are typically 3 to 4 key steps in the process with numerous interactions between
themselves and their suppliers.
23
Citizens Advice (2014), Topping-up or dropping-out: self-disconnection among prepayment meter users
24
CMA (2016) Energy Market Investigation: final report. Appendix 9.6: Prepayment.
14 compared with both direct debit and standard credit consumers, prepay consumers are
significantly less likely to have an income of over £36,000 and more likely to have an income
below £18,000;
compared with direct debit consumers, prepay consumers are significantly less likely to be
aged over 65 and more likely to be aged between 18 and 35. Further, when compared with
standard credit consumers, prepay consumers are significantly less likely to be aged over 65
and more likely to be aged between 35 and 44 or 45 and 54.
compared with both direct debit and standard credit consumers, prepay consumers are
significantly more likely to be disabled, be a single parent, or have more than one of the
following markers of vulnerability status: disabled, single parent and carer.
compared with direct debit consumers, prepay consumers are significantly less likely to live
in a property they own and more likely to live in rented housing, both social and private, and
other. In addition when compared with standard credit consumers, prepay consumers are
significantly less likely to live in a property they own outright and are more likely to live in
rented social housing and other housing.
This is consistent with research conducted by Ofgem in 2010, which found that prepay consumers
were more likely than the average customer to have a low income and be in receipt of a means-
tested benefit or disability benefit.25 Research by Ofgem also found that, whilst 36% of the lowest
two social grades (DE) use a PPM, usage of PPMs amongst the top two social grades (AB) is just 3%.
The same research found that 36% of tenants in rented property had a PPM compared to 9% of
those in other properties.26 Amongst respondents who report having a physical or mental
impairment, 25% report PPM as their payment method, whereas amongst respondents who do not
report having an impairment, 15% report PPM as their payment method.27
At present, there is insufficient data available on smart prepay consumers to know if there are any
significant differences in demographic characteristics when compared with conventional prepay
consumers. Given the reported focus to date on installation in homes of those with conventional
PPMs, it seems reasonable to conclude that the smart prepay consumers largely share the same
characteristics as conventional prepay consumers. However, as the smart prepay market evolves,
greater differentiation is likely to arise between the smart prepay customer segment and the
residual conventional prepay customer segment.
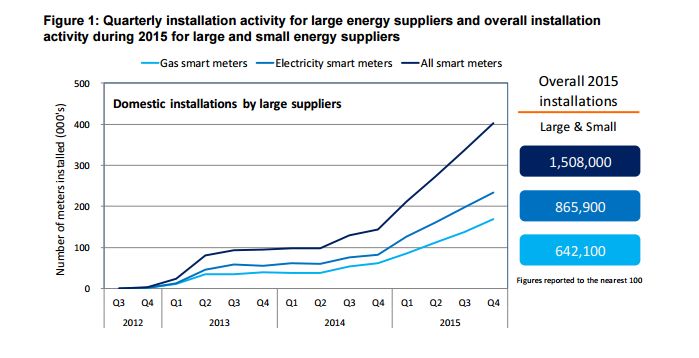
3.1.3 New installations of PPMs
In 2014 300,000 new electricity PPMs and 320,000 gas PPMs were installed. This represented an
increase in gas PPM installations of 9% but a fall in electricity PPM installation of 1%. Of the PPM
installations in 2014, 60% were installed to deal with debt.
This movement of people towards PPMs is happening despite prepayment tariffs generally costing
more than other payment methods. Thus, prepay consumers are on the highest tariffs, but are also
generally the least able to afford them.
25
Reforming the switching process for indebted prepayment meter customers, Ofgem September 2014
https://www.ofgem.gov.uk/ofgem-publications/90376/openletter.pdf
26
Ofgem (2015), “Customer engagement with the energy market – tracking survey 2015 dataset. T309 ”
27
Ofgem (2015), “Customer engagement with the energy market – tracking survey 2015 dataset. T310 ”
15You can also read