A Renewable Energy Roadmap - International Renewable Energy Agency
←
→
Page content transcription
If your browser does not render page correctly, please read the page content below
A Renewable Energy Roadmap
ACKNOWLEDGEMENTS
                                                      ABOUT IRENA                                                                      This report is part of the REmap 2030 programme. Asami Miketa
                                                      The International Renewable Energy Agency (IRENA) is an                          and Deger Saygin coordinated the preparation of the report.
                                                      intergovernmental organisation that supports countries in                        Rabia Ferroukhi led the preparation of the policy section.
                                                      their transition to a sustainable energy future, and serves                      Dolf Gielen, Diala Hawila, Ana Kojakovic, Divyam Nagpal,
                                                      as the principal platform for international cooperation, a                       Nawfal Saadi, Michael Taylor and Nicholas Wagner contributed
                                                      centre of excellence, and a repository of policy, technolo-                      to the report and various other IRENA staff provided valuable
                                                      gy, resource and financial knowledge on renewable energy.                        comments. Kevin Bennett and Khennas Smail (consultants)
                                                      IRENA promotes the widespread adoption and sustainable                           prepared background analysis. The report also benefitted from
                                                      use of all forms of renewable energy, including bioenergy,                       discussions at the Africa Renewable Energy Roadmap work-
                                                      geothermal, hydropower, ocean, solar and wind energy,                            shop that took place in Abu Dhabi on 8 June 2015. The workshop
                                                      in the pursuit of sustainable development, energy access,                        was attended by 50 participants representing 17 countries and
                                                      energy security and low-carbon economic growth and                               8 international organisations.
                                                      prosperity.

                                                      This report, a summary of findings and other supporting                          REPORT CITATION
                                                      material are available for download through
                                                                                                                                       IRENA (2015), Africa 2030:
                                                      www.irena.org/remap
                                                                                                                                       Roadmap for a Renewable Energy Future. IRENA, Abu Dhabi.
                                                      For further information or to provide feedback, please                           www.irena.org/remap
                                                      contact the REmap team at remap@irena.org
                                                      or secretariat@irena.org                                                         This report is available for download from
          COPYRIGHT © IRENA 2015
                                                                                                                                       www.irena.org/publications
     Unless otherwise stated, this publication
          and material featured herein are the
         property of IRENA and may be freely       DISCLAIMER
            used, shared, copied, reproduced,      This publication and material herein are provided “as is”. Neither IRENA nor any of its officials, agents, data or other third-party content providers provides any
              or reprinted, so long as IRENA is    warranty, including as to accuracy, completeness, or fitness for a particular purpose or use, or regarding the non-infringement of third-party rights, and they
        acknowledged as the source. Material       accept no responsibility or liability with regard to the use of this publication and the material therein. The information herein does not necessarily represent the
    attributed to third parties may be subject     views of the Members of IRENA, nor is it an endorsement of any project, product or service provider. The presentation and designations employed do not imply
        to third-party copyright and separate      the expression of any opinion on the part of IRENA concerning the legal status of any region, country, territory, city or area or of its authorities, or concerning
                  terms of use and restrictions.   the delimitation of frontiers or boundaries.
2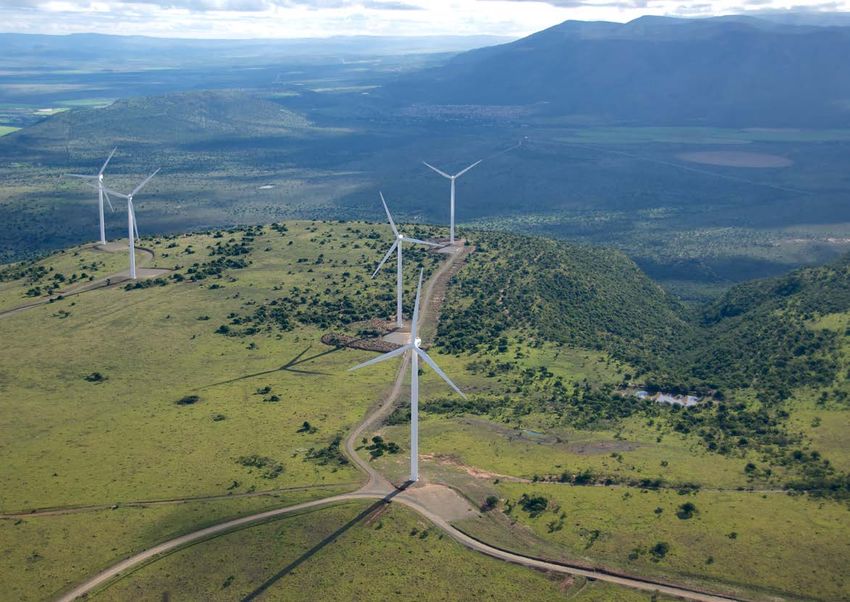
FOREWORD

Africa faces an enormous energy challenge. Its growing population and economic progress has sent energy demand soaring. This calls for
a rapid increase in supply on the continent, to which all forms of energy must contribute in the decades ahead. Africa therefore has a unique
opportunity to pursue sustainable energy development as a basis for long-term prosperity.

Africa is richly endowed with fossil-based and renewable energy sources. However, a continued reliance on oil and gas along with traditional
biomass combustion for energy will bring considerable social, economic and environmental constraints. Tackling today’s energy challenge on
the continent, therefore, requires a firm commitment to the accelerated use of modern renewable energy sources.

Countries like Egypt, Ethiopia, Kenya, Morocco and South Africa are leading this effort, while some of Africa’s smaller countries including
Cabo Verde, Djibouti, Rwanda and Swaziland have also set ambitious renewable energy targets. Others are following suit, and renewable
energy is on the rise across the continent.

Africa 2030, IRENA’s comprehensive roadmap for the continent’s energy transition, illuminates a viable path to prosperity through
renewable energy development. Part of an ongoing global REmap 2030 analysis, Africa 2030 is built on a country-by-country assessment
of supply, demand, renewable energy potential and technology prospects. It highlights possible roles for various renewable energy
technologies across the five regions of Africa until 2030.

Africa can deploy modern renewables to eliminate power shortages, bring electricity and development opportunities to rural villages that        Adnan Z. Amin
have never enjoyed those benefits, spur on industrial growth, create entrepreneurs, and support increased prosperity across the continent.      Director-General
Modern renewables can also facilitate a cost-effective transformation to a cleaner and more secure power sector.
                                                                                                                                                International Renewable
Some technology solutions are relatively easy to implement but require an enabling environment, with appropriate policies, regulation,          Energy Agency
governance and access to financial markets. As a promising sign of things to come, several African countries have already succeeded in
making steps necessary to scale up renewables, such as adoption of support policies, investment promotion and regional collaboration.

Africa 2030 builds on a large body of background studies developed in close co operation with African experts. With momentum
building in support of renewable energy, IRENA is committed to further collaboration with governments, multilateral organisations
and existing national, regional and global initiatives. By making the right decisions today, African countries can usher in a sustainable
energy landscape for generations to come.

                                                                                                                                                                          3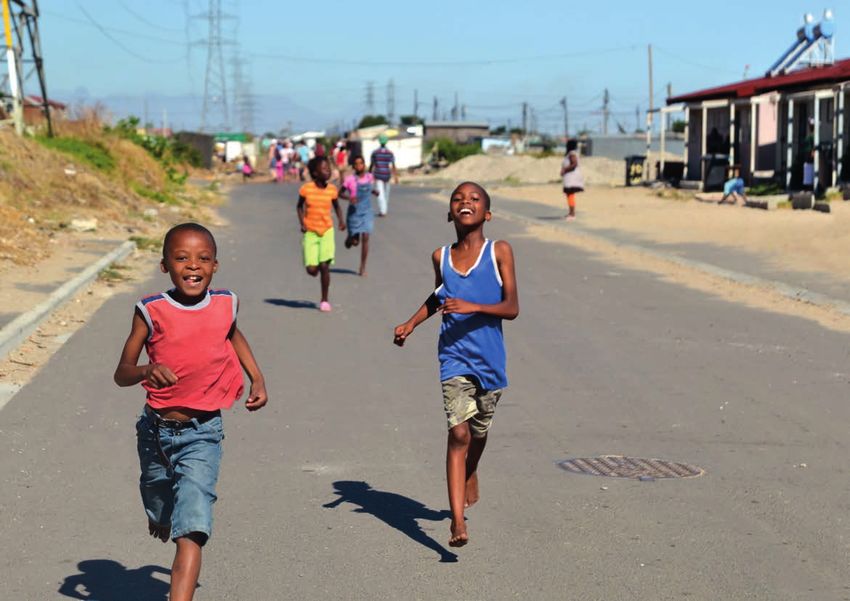
TABLE OF CONTENTS

                                                                                                       PART 1           TECHNOLOGIES TO HARNESS AFRICA’S ABUNDANT
                                                                                                      		                RENEWABLE RESOURCES . . . . . . . . . . . . . . . . . . . . . . . . . . . . . . . . . . . . 12
                                                                                                      		 1.1                   Solar. . . . . . . . . . . . . . . . . . . . . . . . . . . . . . . . . . . . . . . . . . . . . . . . . . . . 14
    Foreword. . . . . . . . . . . . . . . . . . . . . . . . . . . . . . . . . . . . . . . . . . . 3   		                1.2. Wind. . . . . . . . . . . . . . . . . . . . . . . . . . . . . . . . . . . . . . . . . . . . . . . . . . . . 18
                                                                                                      		                1.3. Hydropower. . . . . . . . . . . . . . . . . . . . . . . . . . . . . . . . . . . . . . . . . . . .  20
    Executive Summary. . . . . . . . . . . . . . . . . . . . . . . . . . . . .  6                     		                1.4. Geothermal energy. . . . . . . . . . . . . . . . . . . . . . . . . . . . . . . . . . . . . . . 22

    INTRODUCTION                                                                                      		                1.5. Woodfuel. . . . . . . . . . . . . . . . . . . . . . . . . . . . . . . . . . . . . . . . . . . . . . . . 24

    African Energy Landscape . . . . . . . . . . . . . . . . . . . . . . 8                            		                1.6. Biomass residues. . . . . . . . . . . . . . . . . . . . . . . . . . . . . . . . . . . . . . . .  26
                                                                                                      		                1.7. Energy crops for liquid biofuels. . . . . . . . . . . . . . . . . . . . . . . . . . . . 28

                                                                                                       PART 2           TRANSFORMATION OF AFRICA WITH RENEWABLE
                                                                                                      		                ENERGY: PROSPECTS. . . . . . . . . . . . . . . . . . . . . . . . . . . . . . . . . . . . . . . .  30
                                                                                                      		                2.1. REmap 2030 for Africa. . . . . . . . . . . . . . . . . . . . . . . . . . . . . . . . . . . . 32
                                                                                                      		                2.2. Renewable energy to fuel industrial growth . . . . . . . . . . . . . . . .  36
                                                                                                      		                2.3. Renewable energy for power sector transformation. . . . . . . . .  38
                                                                                                      		                2.4. Renewable energy to support lifestyle changes. . . . . . . . . . . . . . 42
                                                                                                      		                2.5. Renewable energy for rural community development. . . . . . . . 45
                                                                                                      		 2.6. Spurring technology innovation and diffusion:
                                                                                                      			     biomass transformation . . . . . . . . . . . . . . . . . . . . . . . . . . . . . . . . .  46

                                                                                                       PART 3           WAY FORWARD TO ACHIEVING REMAP 2030
                                                                                                      		                PROSPECTS IN AFRICA. . . . . . . . . . . . . . . . . . . . . . . . . . . . . . . . . . . . . .  48
                                                                                                      		                3.1. Strategic planning. . . . . . . . . . . . . . . . . . . . . . . . . . . . . . . . . . . . . . .  50
                                                                                                      			                      National energy plans. . . . . . . . . . . . . . . . . . . . . . . . . . . . . . . . . . . .  50
                                                                                                      			                      Regional energy plans . . . . . . . . . . . . . . . . . . . . . . . . . . . . . . . . . . . . 52
                                                                                                      		                3.2. Overview of the policy landscape and financing mechanisms. . . 53
                                                                                                      			                      Support for renewables in the power sector. . . . . . . . . . . . . . . . . 53
                                                                                                      			                      Support for renewables for rural electrification . . . . . . . . . . . . .  56
                                                                                                      			                      Support for renewables for heating/cooling. . . . . . . . . . . . . . . .  60
    Annex . . . . . . . . . . . . . . . . . . . . . . . . . . . . . . . . . .  66                     			                      Support for renewables for transport. . . . . . . . . . . . . . . . . . . . . . . 61
    Bibliography . . . . . . . . . . . . . . . . . . . . . . . . . . . .  67                          			                      Support policies to maximise renewable energy benefits . . . . . 62
    List of abbreviations . . . . . . . . . . . . . . . . . . . . .  70                               		                3.3. Accelerating the energy transformation in Africa. . . . . . . . . . . .  64

4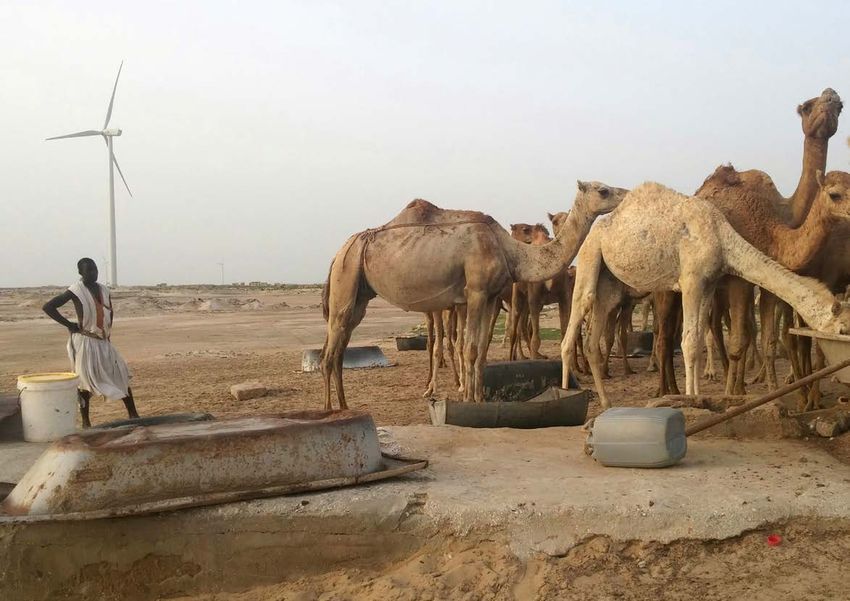
LIST OF FIGURES/TABLES/BOXES                                                                                                                                                                                     TABLE OF CONTENTS

LIST OF FIGURES                                                                                                              LIST OF TABLES
Figure 1    Africa’s energy landscape: Present. . . . . . . . . . . . . . . . . . . . . . . . . . . . . . . . 9              Table 1   Wind generation installations during 2014. . . . . . . . . . . . . . . . . . . . . . . . . 19
Figure 2    Breakdown of total primary energy supply of Africa, 2013. . . . . . . . . . . 10                                 Table 2   Hydro generation and technical potential . . . . . . . . . . . . . . . . . . . . . . . .  21
Figure 3    African climate zones. . . . . . . . . . . . . . . . . . . . . . . . . . . . . . . . . . . . . . . . . . . 14    Table 3   Renewable energy use in 2013 and REmap Options for 2030. . . . . . . . 33
Figure 4    Solar PV cost ranges in Africa by market segment and size. . . . . . . . . . 17                                  Table 4   Cumulative investment needs between 2015 and 2030 . . . . . . . . . . . .  40
Figure 5    Modern renewable energy use in 2013 and 2030. . . . . . . . . . . . . . . . . .  34                              Table 5   Renewable energy targets of African countries. . . . . . . . . . . . . . . . . . .  51
Figure 6    Total final energy consumption and electricity demand                                                            Table 6   Support policies that have been used in Africa. . . . . . . . . . . . . . . . . . . .  54
            in the industry sector. . . . . . . . . . . . . . . . . . . . . . . . . . . . . . . . . . . . . . . . . . . 37
                                                                                                                             Table 7   Programmes to support renewable energy technologies
Figure 7    Final renewable energy use in the industry sector in 2013                                                                  for heating in rural Africa. . . . . . . . . . . . . . . . . . . . . . . . . . . . . . . . . . . . . . .  60
            and the share of modern renewable energy use in each region . . . . . . 37
                                                                                                                             Table 8   REmap 2030 options for Africa . . . . . . . . . . . . . . . . . . . . . . . . . . . . . . . . .  66
Figure 8    Capacity development of REmap Options in 2030 . . . . . . . . . . . . . . . .  39
Figure 9    Average regional substitution cost of REmap Options in 2030. . . . . . . 41
Figure 10   Share of modern renewable energy use in building
                                                                                                                             LIST OF BOXES
            and transport sectors. . . . . . . . . . . . . . . . . . . . . . . . . . . . . . . . . . . . . . . . . .  43
Figure 11   REmap Options for the building sector by 2030,                                                                   Box 1     Renewable energy analysis requires better biomass statistics . . . . . . . 35
            contribution to TFEC. . . . . . . . . . . . . . . . . . . . . . . . . . . . . . . . . . . . . . . . . . .  44    Box 2     National energy plans. . . . . . . . . . . . . . . . . . . . . . . . . . . . . . . . . . . . . . . . . .  50
Figure 12   Ethanol and biodiesel use in 2030. . . . . . . . . . . . . . . . . . . . . . . . . . . . . . . . 47              Box 3     Feed-in-tariff in Kenya. . . . . . . . . . . . . . . . . . . . . . . . . . . . . . . . . . . . . . . . . . 53
                                                                                                                             Box 4     Non-price competition in Uganda’s small power
                                                                                                                                       producer auctions. . . . . . . . . . . . . . . . . . . . . . . . . . . . . . . . . . . . . . . . . . . . . . 55
                                                                                                                             Box 5     Mauritius fiscal incentives . . . . . . . . . . . . . . . . . . . . . . . . . . . . . . . . . . . . . . . 55
                                                                                                                             Box 6     Renewable energy-based mini-grid solutions to expand
                                                                                                                                       access to electricity. . . . . . . . . . . . . . . . . . . . . . . . . . . . . . . . . . . . . . . . . . . . . 57
                                                                                                                             Box 7     Tanzania’s policy and regulatory framework to support
                                                                                                                                       small power producers. . . . . . . . . . . . . . . . . . . . . . . . . . . . . . . . . . . . . . . . .  58
                                                                                                                             Box 8     Incubation centres for energy enterprises:
                                                                                                                                       ECOWAS entrepreneur support facility . . . . . . . . . . . . . . . . . . . . . . . . . .  58
                                                                                                                             Box 9     Private participation in Rwandan hydropower development. . . . . . . .  59
                                                                                                                             Box 10    Solar water heater programmes in Tunisia. . . . . . . . . . . . . . . . . . . . . . . . . 61
                                                                                                                             Box 11    South Africa’s solar water heater programme. . . . . . . . . . . . . . . . . . . . . . 61
                                                                                                                             Box 12    Mandates for biofuel blending in Mozambique. . . . . . . . . . . . . . . . . . . . . 62
                                                                                                                             Box 13    Renewables Readiness Assessment and advisory services. . . . . . . . . . 62
                                                                                                                             Box 14    Solar Sister job creation initiative in sub-Saharan Africa. . . . . . . . . . . . . 62

                                                                                                                                                                                                                                                           5
A Renewable Energy Roadmap

                                                     SUMMARY
                                           Africa’s economy is growing at unprecedented speed. One of the      households, industry, transport and the power sector. The results
                                        core challenges as African countries continue to grow and develop      are shown for five African regions.
                                        is energy: meeting rising demand for power, transport and other          Africa 2030 analysis identified modern renewable technology
                                        uses in a way that is economically sustainable and safeguards          options across sectors, across countries, collectively contributing
                                        livelihoods. Economic growth, changing lifestyles and the need for     to meet 22% of Africa’s total final energy consumption (TFEC) by
                                        reliable modern energy access is expected to require energy            2030, which is more than a four-fold increase from 5% in 2013.
                                        supply to be at least doubled by 2030. For electricity it might        Four key modern renewable energy technologies with highest
                                        even have to triple. Africa is richly endowed with renewable           deployment potentials for Africa are modern biomass for cooking;
                                        energy sources, and the time is right for sound planning to            hydropower; wind; and solar power.
                                        ensure the right energy mix. Decisions made today will shape the
                                                                                                                 The power sector presents significant opportunity to be trans-
                                        continent’s energy use of decades to come.
                                                                                                               formed through the increased deployment of renewable energy
                                          The world is increasingly embracing modern renewable energy          technologies. The share of renewables in the generation mix could
                                        technologies. For many years they have been supported because          grow to 50% by 2030 if the REmap Options in this report are
                                        of environmental and energy security concerns but in a rising          implemented. Hydropower and wind capacity could reach 100 GW
                                        number of situations they are now seen as the most economic            capacity each, followed by a solar capacity of over 90 GW. For
                                        option. The use of modern renewables is growing in Africa, and         the power sector this would be an overall tenfold renewable
                                        fostering this growth is imperative. African countries are in a        energy capacity increase from 2013 levels. It would result in a
                                        unique position: they have the potential to leapfrog the traditional   reduction of 310 megatonnes of carbon dioxide (Mt CO2) in
                                        centralised-utility model for energy provision.                        emissions by 2030 when compared to the baseline scenario.
Kenya, Photograph: IRENA/R. Ferroukhi     Africa 2030 is part of IRENA’s global REmap 2030 analysis,             In all regions of Africa except the North, hydropower will
                                        which outlines a roadmap to double the share of renewables in          continue to play an important role. North, Eastern and Southern
                                        the world’s energy mix within the next 15 years. It is based on        Africa can all derive renewable power from other sources, such as
                                        a country-by-country assessment of energy supply, demand,              wind energy, while concentrating solar power (CSP) will matter
                                        renewable-energy potential, and practical technology choices for       specifically in North Africa. Additional renewable power capacity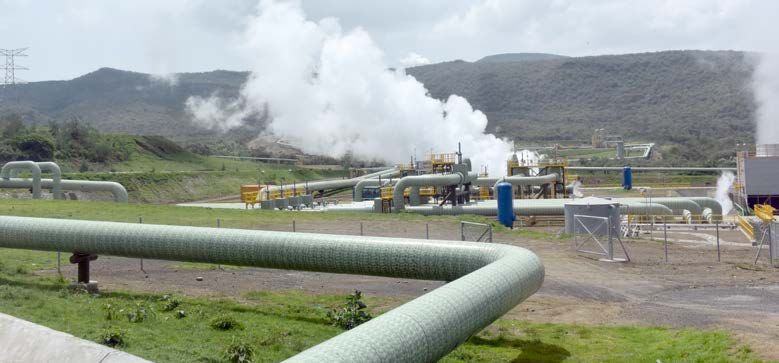
EXECUTIVE SUMMARY

is expected from geothermal sources in East Africa, while solar photovoltaics (PV) will      Modern renewables also offer great potential in empowering local communities.
be important in the North and Southern regions.                                            These resources can be harnessed locally at a small scale, contributing to rural
  This transformation would require on average USD 70 billion per year of investment       development and electrification without the cost of extending national grids to
between 2015 and 2030. Within that total, about USD 45 billion would be for generation     remote places. Local projects also offer economic opportunities to locals. However
capacity. The balance of USD 25 billion would be for transmission and distribution         accomplishing this requires clear policy signals, an enabling framework of laws,
infrastructure. With the REmap Options implemented, two thirds of the total invest-        regulations and institutional set-up as well as viable business schemes to ensure
ments for generation capacity – USD 32 billion – come from renewables options.             accelerated renewables deployment.
Realising this opportunity will create significant new business activity in Africa.           Thus far, many African leaders have seen the opportunity that renewables present
  Whilst the power sector is the most visible candidate for an energy transformation,      for their nations, and national energy plans and announced targets reflect this vision.
opportunities in the heating and transport sectors are also significant. A complete        As power sectors and institutional frameworks mature, regulatory policies such as
overhaul of Africa’s energy supply will require increased renewable energy penetration     auctions and net metering are likely to be introduced. Policies are needed to entice
across the three sectors, and would provide enormous socio-economic benefits. One          private capital include public-private partnerships, to share costs and risks, and to
of the main ones would be the reduced reliance on the traditional use of biomass –         build capacity in local financial sectors to increase access to loans and other forms of
typically foraged wood in inefficient cookstoves. Modernising biomass use is not only      financing.
beneficial for the economy but it will also improve human health and release women            Regional cooperation is crucial in bringing about the efficiencies and economies
and children from foraging to find enough supply of firewood. REmap identified             of scale by deploying renewable energy technologies in a coordinated manner. Such
options that reduce the use of traditional cookstoves by more than 60% by 2030             an approach is particularly effective in large-scale deployment of shared renewable
(compared to 2013). That would result in significantly reduced health impacts of           resources for power generation. Adopting an integrated approach to trans-boundary
indoor air pollution, which would translate to the reduced external costs of between       issues such as trade, regulatory frameworks and policies, regional infrastructure and
USD 20 billion and USD 30 billion in 2030. The benefits of such action would far           other cross border issues would allow the countries to benefit from accessing regional
exceed the cost.                                                                           renewable resources at affordable prices.
  Whilst the resource base varies for renewables in Africa, all of its countries do have     Creating an overall enabling environment for renewables in Africa requires finding
significant renewables potential. Their biomass, geothermal, hydropower, solar or          the right mix of policies and incentives and multi-stakeholder collaboration at country
wind resources are among the best in the world. The abundance and high quality of          and regional levels. The rewards accruing to countries that meet the challenge will be
renewable-energy resources render renewables economically competitive, in partic-          immense. Modern renewables can eliminate power shortages, bring electricity and
ular as the costs of renewable technologies are rapidly decreasing. Recent renew-          development opportunities to rural villages, spur industrial growth, create entre-
able-energy project deals concluded in Africa will deliver power at some of the lowest     preneurs, and support the ongoing lifestyle changes across the continent. At the
costs worldwide.                                                                           same time, leveraging renewables would facilitate a cost-effective transformation to a
                                                                                           more secure and sustainable power sector. IRENA, through a number of cooperation
                                                                                           instruments, will continue to work with African countries to support their efforts to
                                                                                           appraise the full potential of modern renewable energies and their benefits.

                                                                                                                                                                                      7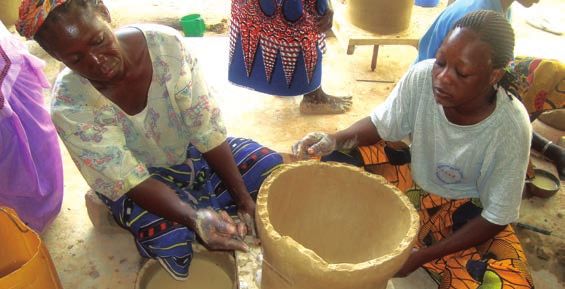
Mauritania, Photograph: IRENA/C. Ruiz Sanchez

INTRODUCTION

  Africa has seen rapid economic growth this century, with a                                       As Figure 1 shows, different regions face different challenges.
corresponding increase in the demand for energy. Keeping pace                                   Gross Domestic Product (GDP) per capita is generally three to
with rising energy needs is at the top of the agenda for policy                                 five times higher in North Africa, where less than 2% of the
makers, to enable economic growth and extend access to                                          population is without access to electricity. In contrast, about
modern energy to those lacking it now. These are not easy                                       half of people in West Africa and three quarters in East
challenges. Supply lags demand, and in as many as 30 countries                                  Africa and most of Southern Africa lack access to electricity
in Africa recurrent electricity outages and load shedding are the                               (although only 15% in South Africa lack electricity access).
norm. About 600 million people in Africa do not have access                                     North Africa on average consumes eight times more electricity
to electricity, and approximately 730 million people rely on                                    per capita than the rest of the continent, excluding South Africa.
traditional uses of biomass (IEA, 2014a).

Figure 1 | Africa’s energy landscape: Present*                                                   Population           GDP billion/yr              Access to electricity   Electricity
                                                                                                 (million people)     (current international $)   (% population)          (KWh per capita)

                                                                          N   North Africa

                                                                                                         175                   1 936                           98%
                                                                                                                                                                               1 574

                                                                                                         327
                                                                          W West Africa
                                                                                                                                                                               188
                                                                                                                               1 310                           47%

                                                                          E   East Africa

                                                                                                         303                    646                            23%
                                                                                                                                                                               91

                                                                          C   Central Africa

                                                                                                                                                                               167
                                                                                                         115                    227                            25%
                                                                          S   Southern Africa

                                                                                                                                1 100                                          2061
                                                                                                         177                                                   43%
* Note: statistics refer to 2013, except for access to electricity which refers to 2012.
                                                                                                                                                                                                            9
INTRODUCTION

                            Figure 2                                                                                      Africa’s current energy needs are met through a mix of bio-
        Breakdown of total primary                                                                                      mass and fossil fuels (Figure 2). Biomass accounts for approxi-
       energy supply of Africa, 2013
                                                                                                                        mately half of Africa’s total primary energy supply. Coal and
                                                                                                                        natural gas account for about 14% each, and oil approximately
                                                                                                                                               Biofuels and waste
                           Biofuels and waste                                              Crude oil and oil products   22%. Hydropower represents about 1% of the total primary energy
                                                                                                                                               Crude, NGL and feedstocks
                                                                                                                        supply in Africa.
                                                                                                                                                Coal and coal products
                                                                                                                          The total primary energy supply of Africa has been increasing
                                                                                                                                                 Natural gas
                                                                                                                        at an annual rate of about 3%, the highest among all continents.
                                                                                                                                                 Nuclear
                                                                                                                        The energy mix has been more or less constant for the last 30
                                                                                                                                                 Hydro
                                                                                             Coal and coal products     years. Extensive fossil-fuel reserves, including recent natural gas
                                                                                                                        discoveries, could temptGeothermal
                                                                                                                                                  some countries to disregard the benefits
                                                                                                                                                 Solar/wind/other
                                                                                                                        of a more balanced energy     mix.
                                                                                                                                                Electricity
                           Geothermal
                           Solar/wind/other
                           Electricity                                                                   Natural gas

                           Nuclear                                                                            Hydro
     Source: IEA (2015)

                                                Madagascar, Anton_Ivanov, © shutterstock
10
INTRODUCTION
At the same time, massive global deployment of renewable tion with country representatives and regional organisations. Re-
energy has led to significant cost reductions and performance newable solutions for Africa are at the centre of IRENA’s work as
improvements. Some African countries are already reaping witnessed by four prospective studies: Scenarios and Strategies
benefits from proven renewable energy technologies. Along with for Africa (IRENA, 2011a); Prospects for the African Power Sector
helping to meet energy needs in a cost-effective, secure and (IRENA, 2011b); Africa’s Renewable Future: the Path to Sustainable N North Africa
environmentally sustainable manner, renewable energy can Growth (IRENA, 2013a); Africa Power Sector: Planning and Pros-
strengthen socio-economic development. Africa has massive pects for Renewable Energy – Synthesis Report (IRENA, 2015a).
renewable potentials in all forms. Africa 2030 is a part of IRENA’s global renewable energy road-
Regional definition used in this report
mapping exercise, REmap 2030 (IRENA, 2014a). W West Africa
N North Africa
Renewables can play a transformative role in the African N North Africa
N North Africa
North Africa
energy mix. Abundant fossil fuels and renewable sources in many The chapters that follow identify nearly 10 exajoules (EJ) of Algeria, Egypt, Libya, Mauritania,
countries on the continent mean policy makers have a choice. But options in 2030 for sustainable development using modern Morocco, Tunisia
for a diversified, sustainable energy mix, it is more important than renewable energy resources and technologies, known in this
W West Africa
West Africa
ever to ensure that renewables play as large a role as possible. report as “REmap Options”. Together these could account for E
W East Africa
West Africa
W West Africa
Benin, Burkina Faso, Cabo Verde,
This analysis elaborates on the costs and benefits, as well as 22% of the continent’s TFEC in 2030, up from 5% in 2013. About Cote d’Ivoire, The Gambia, Ghana,
discussing regional approaches for putting those findings into 50% of the final energy provided by these options would be Guinea, Guinea Bissau, Liberia, Mali,
N Niger,
North Africa
Nigeria, Senegal, Sierra Leone,
practice in the coming 15 years. Africa 2030 builds on a large biomass-based heat applications, while 40% come from the
body of IRENA background studies conducted in close coopera- power sector. E Togo
East Africa
E
E East Africa
East Africa
C Central Africa
Central Africa
Cameroon, Central African Republic,
W West Africa
Chad, Comoros, Congo,
Democratic Republic of Congo,
Equatorial Guinea, Gabon,
C Sao
Central Africa
Tome and Principe
C Central
C Africa
S Central Africa
South Africa
E East
East Africa
Africa
Burundi, Djibouti, Eritrea, Ethiopia,
Kenya, Rwanda, Somalia, South Sudan,
Sudan, Tanzania, Uganda
S South Africa
S Southern
S South
Africa
Africa
South Africa
Angola, Botswana, Lesotho,
C Madagascar,
Central Africa Malawi, Mauritius,
Mozambique, Namibia, Seychelles,
South Africa, Swaziland, Zambia,
Zimbabwe
South Africa, © shutterstock
11
S South AfricaTECHNOLOGIES TO HARNESS AFRICA’S ABUNDANT RENEWABLE RESOURCES PART 1
The African continent is endowed with large renewable energy potential, varying in
type across diverse geographic areas. Solar resources are abundant everywhere, while • Abundant fossil and renewable energy resources are available across Africa.
biomass and hydropower potential are more plentiful in the wet, forested central and With rapid economic growth, changing lifestyles and the need for reliable
southern regions. Wind resources are of the highest quality in the north, the east, and modern energy access, the continent’s energy demand is set to double by 2030.
the southern regions, while geothermal energy is concentrated along the Great Rift • Renewable energy is growing rapidly around the world, driven by economics,
Valley. These resources, and the settings in which they exist, can point to country- environmental concerns and the need for energy security. The use of modern
specific renewable energy solutions to fit each state’s strengths and needs. Part 1 renewable energy technologies is also on the rise across Africa, where countries
of this report describes the renewable energy resources available in Africa along are uniquely positioned to leapfrog the traditional centralised energy supply
with the technologies to harness that energy potential. The resources considered model.
include hydropower, solar energy, wind energy, geothermal energy and various • Renewable energy technologies can be deployed locally, at small scale, opening
types of biomass. Biomass falls into three categories: woodfuel; agricultural and up new forms of financing and productive uses, as well as broadening electricity
industrial residues; and energy crops. Africa’s extensive coastline also suggests access.
long-term ocean energy potential, but this is unlikely to be a significant source by • The costs of renewable technologies are decreasing rapidly; recent project
2030. deals for renewables in Africa have been among the most competitive in the
The possible applications for all these resources include power generation, heating world.
and cooling for both industrial and domestic applications, lighting, transport and • While the resource base varies, all African countries possess significant
direct uses of mechanical energy. renewable energy potential. The continent’s biomass, geothermal, hydropower,
solar and wind energy resources are among the best in the world. Clear policy
signals and an enabling framework can produce accelerated renewable energy
deployment.
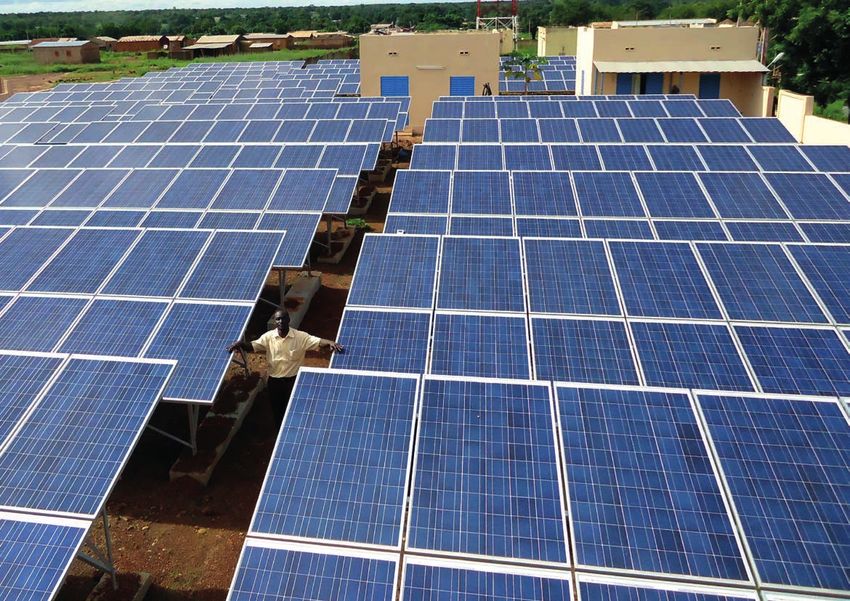
131.1 SOL AR
1.1 SOLAR
Africa has an exceptional solar resource that can be harnessed POWER APPLICATIONS
for electricity generation and for thermal applications. The desert Two types of technologies exist for power generation: solar
regions of North Africa and some parts of Southern and East photovoltaic (PV) and CSP. The former can be universally used,
Africa enjoy particularly long sunny days with a high intensity in applications ranging from household systems to utility-scale,
of irradiation. Sahelian and Tropical conditions also feature while the latter is typically a technology that performs optimally
strong solar irradiation. Solar energy can be utilised at various in utility scale projects situated in the desert regions. Overall,
scales, making it suitable from the household and community Africa’s solar power generation potential exceeds future demand
levels to industrial and national scale operations. by orders of magnitude. Even the smallest countries on the
continent have at least a few gigawatts of potential for either
Figure 3 technology.
African
climate zones
UTILITY SCALE – SOLAR PV AND CSP
Africa’s solar PV capacity has grown exponentially in recent
years, but from a low base. Cumulative installed capacity at the end
of 2014 was 1 334 megawatt (MW), more than ten times larger than
in 2009 (127 MW). South Africa is leading this rapid growth, adding
1)
The African statistics include nearly 780 MW between 2013 and 20141. Kenya has also seen
data for the French oversea sizable investments in solar PV, with 60 MW installed by 2014
territory of Reunion, whose
(IRENA, 2015b). This accelerated
Mediterranean growth will continue, as more
capacity by 2014 is 167 MW, Mediterranean
than 14 GW of solar PV Desert and 6 GW of CSP are either announced or
second following South Africa. Mediterranean
Mediterranean Desert
in the pipeline (GlobalData, 2015). For example, a single company,
Desert Desert Sahelian
Sahelian
Sahelian Sahelian
SkyPower, has bilateral agreements in place to install 7 GW of solar
Tropical
Tropical PV capacity in the coming Tropical
five years in Egypt, Kenya and Nigeria.
Tropical
Humid Tropical
Humid Tropical
Humid Tropical
Humid Tropical
Equatorial Equatorial
Equatorial Equatorial
14TECHNOLOGIES TO HARNESS AFRICA’S ABUNDANT RENEWABLE RESOURCES PART 1
Of 350 African solar PV projects data in the GlobalData (2015), a shine. CSP systems with thermal storage have higher investment
majority have production capacity of between 10 MW and 100 MW, costs, but they allow higher capacity factor and dispatchability.
with capacity factors from as low as 11% to as high as 33%. This
CSP projects are capital intensive. Project investment costs for
range corresponds to utility-scale solar PV applications, though
the six commissioned CSP plants vary between 5 800 USD/kW (no
in some countries much smaller systems, in the range of 1 MW to
storage) and 10 150 USD/kW (with 7 hours of storage). This range
10 MW, are also used at a utility scale. Much bigger systems, up to
is higher than the typical range of USD 1 820/kW to USD 4 880/kW
500 MW, are already under construction, for example in Namibia.
for solar PV projects. The gap is narrowing however, and cutting-
Mirroring the rapid reduction of PV module costs worldwide, Mauritius, Photograph: IRENA/E. Taibi
edge CSP technologies are being deployed in Africa: the Red-
which fell by 75% from 2009 to 2015, the levelised costs of
electricity (LCOE) of best practices for African utility-scale projects stone CSP project in South Africa, developed by ACWA power and
SolarReserve (100 MW with 12 hours of storage) was contracted
2)
Unless otherwise noted, all
in the continent has also rapidly fallen. According to IRENA’s
prices are in constant 2013 USD.
Costing Alliance Database (IRENA, 2015c), LCOE for African for USD 0.124 per kWh. This project will come online in 2018 and is
solar PV utility projects in 2013 and 2014 ranged between USD 0.13 well below the range of LCOE for recent CSP projects worldwide,
and USD 0.26 per kilowatt-hour (/kWh). 2 The lowest cost for utility- between USD 0.20/kWh and USD 0.36/kWh (IRENA, 2015d).
scale PV in South Africa is below USD 0.075 per kWh, which is
among the most competitive PV projects worldwide. This gap DISTRIBUTED SOLAR PV
between the best practice and cost range in Africa suggests Smaller scale PV systems can be used with or without
further cost reduction potential. connection to a power grid. Off-grid PV markets have seen
Deployment of CSP in Africa is in the earliest phase, as is the particularly dynamic development in a wide range of African
case worldwide. Four African countries, Algeria, Egypt, Morocco countries.
and South Africa, have deployed a total of six CSP projects as of Small-scale distributed solar PV systems can provide power to
March 2015. Their installed capacity amounts to just over 180 MW Burkina Faso, Photograph: IRENA/H. Lucas
houses and buildings for essential services such as lighting and
(IRENA, 2015b). Projects totalling 6.4 GW are underway, including
charging electric appliances. They are already providing alternatives
some in Botswana, Namibia, Sudan, Tunisia (GlobalData, 2015).
in rural settings to electricity from distribution lines connected
CSP is attractive because its efficiency increases with irradiation
to national transmission lines. Extending a national or regional grid
level, which is not the case for solar PV where efficiency declines
to remote villages has often been an expensive solution to rural
with rising collector temperatures. Given that the irradiation
level corresponds also with the demand for air conditioning, electrification. Solar PV (with or without battery storage) can
solar CSP would reduce the need for peak capacity. This feature is also help significantly reduce fuel costs in existing mini-grids.
attractive in desert countries where solar irradiation is particularly Even where a connection to the existing network is available, if an
strong. CSP systems offer the opportunity to store solar energy as uninterrupted supply is required, such as in health-care settings,
heat, for use to generate electricity during periods of low or no sun- solar PV systems with battery storage can be an economic solution. Mimadeo, © shutterstock
151.1 SOL AR
There are already sizeable markets for solar PV home systems in Telecom towers are also considered a provider of steady demand,
countries like Kenya and Tanzania, which are estimated at around on the back of which investment cases can be made for mini-grid
4 MW and 6-8 MW respectively. This may appear modest, but with systems at the community level. In 2013, Africa had around eight
solar PV home systems often sized as low as 20 watts (W), these million solar systems installed to power public lighting (IRENA,
gains represent tens or even hundreds of thousands of individual 2015e).
systems installed annually. At such a small scale these systems are Solar PV systems are also increasingly deployed for industrial
closer to consumer electronics than energy systems, and prices applications. In the mining sector there is a trend towards hybrid
vary widely depending on margins. IRENA’s latest analysis of diesel and PV systems to lower the cost of electricity supply in
investment costs for more than 200 versions of these systems in
remote locations without grid access, and to allow for backup
Africa (IRENA, forthcoming) revealed a range between USD 2.2/W
supply in case of grid blackouts (Gifford, 2015). An example is
and USD 17/W (Figure 4). System size influences the cost. For
Sibanye Gold in South Africa, which is installing 150 MW of PV.
example, the best practice investment cost for solar home
systems below 1 kW in size (around USD 4/W) is almost twice as
high as for systems above 1 kW. Wide cost differentials between HEAT APPLICATIONS
average and best-practice investment point to significant potential
SOLAR WATER HEATING – DOMESTIC APPLICATIONS
for cost reductions.
In addition to generating electricity, a number of modern
Small-scale stand-alone PV systems are also used for mini-grid
Marrakesh, KMW Photography, technology applications have been deployed to provide heat
© shutterstock
service in rural communities as well as for other community
services, such as street lighting, solar kiosks, mobile-phone charging for domestic and industrial heating needs. Two major domestic
stations, telecom towers and pumping water. These energy ser- heating needs in Africa are cooking and hot water. For cooking,
vices have historically been using diesel fuel, but solar PV systems there have been many projects aimed at deploying solar cookers
offer a cost-effective alternative. Mini-grid based rural electrification and they have met with mixed success. The initial cost of a solar
has been implemented in many African countries, and diesel based cooker is often above the means of the rural communities
mini-girds are being upgraded with PV-diesel hybrid systems. and eating at the time when the solar irradiance is at its best
Solar PV is especially suited for water pumping, as the operation is not always convenient or traditional. On the other hand,
can be adjusted to the availability of solar electricity. Sizeable domestic water heating using solar power has been encouraged
markets for solar water pumping include nearly 300 MW of in many parts of Africa, and the market is growing fast in selected
installed capacity in Algeria. In Egypt 9% of PV applications are for countries including South Africa, Tunisia, and Morocco. By the end
water pumping. The two phases of the Regional Solar Programme of 2013, over 1 gigawatt-thermal (GWth) of solar thermal capacity
(RSP), implemented by the Permanent Interstate Committee for was installed in South Africa, followed by Tunisia at 0.5 GWth , and
Drought Control in the Sahel, have resulted in the deployment Morocco at 0.4 GWth (IEA Solar Heating and Cooling Programme,
of solar pumping stations systems in nine countries, providing 2015). In North Africa the primary use is residential applications.
improved access to water and electricity for 2 million people.
16TECHNOLOGIES TO HARNESS AFRICA’S ABUNDANT RENEWABLE RESOURCES PART 1
Issues affecting the uptake of domestic solar water heaters WATER DESALINATION WITH SOLAR PV AND SOLAR CSP
include the high up-front installation costs compared with gas Solar energy has been used for water desalination in North Africa,
and electric boilers, the complex process and associated costs to a region facing increasing stress on freshwater resources. Current
integrate solar thermal systems into existing housing, competition global capacity for renewable-energy desalination accounts for
with heat pumps, and in some cases the competition with PV less than 1% of total desalination capacity. Of that small amount,
panels for rooftop space (IRENA and IEA-ETSAP, 2015a). More- 43% of renewable capacity uses solar PV and 27% solar thermal
(European Union, 2008). In North Africa the total volume of
over in parts of Africa electricity and fossil fuel subsidies have
desalinated water is estimated to account for less than 1% of total
acted as inhibitors to large-scale deployment.
regional water demand. Yet the amount of energy used for
desalination in Algeria, for example, is as high as 10% of the total
SOLAR HEATING AND COOLING – INDUSTRIAL APPLICATIONS
electricity consumed in 2010. With desalination increasingly
For industrial facilities, solar heaters can be used to produce important – it could be relied on to meet as much as 50% of new
process heat, primarily in low- to medium-temperature ranges. water demand – the implications for future energy demand are
Uses include the drying of goods, heating of water, and steam significant (World Bank, 2012). The combination of solar techno-
generation. Compared to other parts of the world, a higher share logies and desalination technologies also provides a flexible
of Africa’s manufacturing sector consists of activities that are not demand option for non-dispatchable solar technologies. * Note: costs include equipment as well
as installation, planning, civil works,
energy-intensive. Examples include processing food or wood,
infrastructure, construction etc.
and producing textiles. Up to 70% of demand for heat for these
Figure 4 Solar PV cost ranges in Africa by market segment Source: IRENA (forthcoming)
activities calls for low-temperature heat, and solar heaters are
and size*
sufficient to provide it. The current use of solar heating for
USD/W
industrial applications is negligible in Africa. Modern solar dry- 20 20
ing technologies have been piloted mainly to increase value Project cost range Utility-scale project installed cost range
added to products when compared with the traditional way
of drying products by sunlight. This is achieved by conducting 15 15
the drying process in a controlled environment, which yields
higher-quality products protected from dust, variable temperatures
10 10
and insects or animals. Although the application potential of
this technology may be considered a small market, it could offer
significant benefits to this niche of economic activity. 5 5
It is also possible to utilise solar energy for cooling. These
installations are of particular relevance for remote medical clinics
as well as industries, such as the dairy industry, that require 0 0
SHS >1 kW Off-grid mini grid Off-grid mini grid
cooling to enable product storage. with battery without battery 2012 2013 2014 2015 2016
171.2 WIND
1.2 WIND
Wind is converted into useful energy utilising wind turbines, POWER GENERATION
for use either to drive electrical generators or to directly power
By the end of 2013, total installed wind capacity in Africa was
pumps and other machinery.
1 463 MW. In 2014, 999 MW of new capacity was installed, bringing
The theoretical potential for wind in Africa exceeds demand the total to 2 462 MW at the end of 2014 (IRENA, 2015b). Locations
by orders of magnitude, and about 15% of the potential is char- are indicated in Table 1. Even with the remarkable growth rate in
acterised as a high-quality resource. This enormous capacity South Africa during 2014, Morocco still had the largest installed
is not evenly distributed: East, North and Southern Africa have wind capacity in Africa. East Africa is also seeing growth, with the
particularly excellent wind resources. Countries with especially 300 MW Turkana project under construction. Additionally, 140
high wind quality include all those in North Africa; Niger in West African wind farms are in various stages of preparation, totalling
Africa; Chad in Central Africa; Djibouti, Ethiopia, Kenya, Sudan, 21 GW of new capacity expected to become operational between
Somalia, Uganda in East Africa; and in Southern Africa Lesotho, 2014 and 2020 (GlobalData, 2015). In Egypt, the government’s
Malawi, South Africa, Tanzania and Zambia. goal is to have 7 GW of wind power installed by 2020. Morocco
has set a target of 2 GW by 2020, and South Africa plans to
install 8.4 GW of wind power by 2030 (IRENA, 2015f). Scenarios
prepared by the Global Energy Wind Council (GWEC) predict that
installed wind power capacity in Africa will rise to between 75 GW
and 86 GW by 2030 (GWEC, 2014).
The typical range of African wind power projects is smaller than
150 MW. However, projects in the pipeline are increasingly of a
larger scale, with projects between 300 MW and 700 MW under
consideration.
In general, on-shore wind is now one of the lowest-cost sources
of electricity available, and in Africa the LCOE range is between
USD 0.046 to USD 0.145/kWh for projects installed in 2013 and
South Africa, Grobler du Preez, © shutterstock
18TECHNOLOGIES TO HARNESS AFRICA’S ABUNDANT RENEWABLE RESOURCES PART 1
2014. The corresponding weighted average is USD 0.055/kWh WIND WATER PUMPING
(IRENA, 2015d). A recent tender in Egypt resulted in bids as low as The use of wind for off-grid applications, and particularly for
USD 0.041/kWh, a new record for Africa. However, many projects water pumping in the agricultural sector, is widespread in Africa
in Africa will require considerable additional investments to bring and particularly in Southern Africa, where over 300 000 units are
power from the best wind locations to biggest demand centres, in operation. The technology is simple and the systems are robust,
which can raise supply costs by USD 0.05 to USD 0.20 per kWh. with low maintenance requirements. Given the variable nature
Investment costs for recent projects in Kenya, Morocco and South of wind, water storage capacity is often incorporated in these
Africa ranged between USD 1 600/kW and USD 3 000/kW, with projects to ensure a continuous supply. A cost comparison
the average being USD 2 210/kW. This is similar to some average between wind pumping and diesel pumping in Sudan found
international prices observed in 2013 and 2014 in the United States that using wind is 30% less expensive than diesel (Omer, 2008).
and Europe. In China and India, the average total installed cost However, most of the ongoing renewable-energy water pumping
was significantly lower, at USD 1 300/kW. Costs in Africa are initiatives focus on solar water pumping, rather than wind water
expected to drop further with increased availability of locally pumping (IRENA, 2015g).
manufactured components such as towers and blades.
Table 1 Wind generation installations during 2014
Total
Country End 2013 New 2014 (End 2014)
Morocco 487 300 787
South Africa 10 560 570
Egypt 550 60 610
Tunisia 200 55 255
Ethiopia 171 0 171
Cabo Verde 24 0 24
Other 21 10 31
Total 1 463 999 2 462
Source: IRENA (2015b) South Africa, michaeljung, © shutterstock
191.3 HYDROPOWER
1.3 HYDROPOWER
Africa has abundant hydropower resources. It is estimated that of hydro generating capacity. Thus, when planning the utilisation
around 92% of technically feasible potential has not yet been of this resource, the seasonality and annual variability of hydro
developed (IRENA and IEA-ETSAP, 2015b) (Table 2). Central Africa resources must be factored in.
has about 40% of the continent’s hydro resources, followed by East
and Central Africa, each having about 28% and 23% respectively LARGE-SCALE HYDRO
(Hydropower and Dams, 2014). At the end of 2014 there was Hydropower plant projects with a combined new capacity of
28 GW of hydro capacity installed in Africa (IRENA, 2015b). This 17 GW are currently under construction in Africa (Hydropower
makes hydropower by far the most important renewable power- and Dams, 2014). Given that large hydro projects often have
generation option deployed today. Of the resources available, the outputs far in excess of the national demand for electricity, it is
Congo River has the largest discharge of African rivers, followed necessary to develop these as regional projects. Two projects
by the Zambezi, the Niger and the Nile. of note are the Grand Inga project and the Great Millennium
Hydropower resources can be utilised in a number of ways, Renaissance Dam.
depending on the size of the resource. Large-scale hydro resources The Grand Inga project on the Congo River envisages the
are often utilised in combination with a storage dam and are installation of 40 GW of hydro generating capacity, which would
suitable for the production of grid electricity. Small hydro plants, make it the largest hydro facility in the world. It is to be developed
(1 MW to 10 MW capacity) may or may not incorporate dams, while in 8 phases. The current phase of development, Inga 3, has a total
mini- (100 kW to 1 MW), micro- (5 – 100 kW) and pico-hydro (less potential of 7.8 GW, and of that total 4.8 GW of capacity is under
than 5 kW) are suited to run-of-river (no storage dam) installations development, to be commissioned by 2023 (World Bank, 2014a).
for the provision of distributed electricity to areas remote from A significant share of electricity is destined for exports, which will
the electricity grid. go as far as South Africa. Transmission lines totalling 1 850 kilo-
Hydropower is dependent on a reliable supply of water, and meters (km) are to be developed to support Inga 3 exports of
periods of drought have a detrimental effect on the availability electricity.
of hydropower stations. The droughts in Kenya at the turn of the
decade resulted in extensive power outages due to a shortage
20TECHNOLOGIES TO HARNESS AFRICA’S ABUNDANT RENEWABLE RESOURCES PART 1
The Great Millennium Renaissance Dam, situated on the Nile SMALL HYDROPOWER
River in Ethiopia is currently under construction and will add
Small hydro is suitable for connection to existing grids or for the
a further 6 GW to the grid. Ethiopia has ambitious plans for provision of electricity in remote areas. Given their smaller size,
hydropower expansion including electricity delivery to neigh- any dams associated with these plants will have a significantly
bouring countries. smaller environmental impact. Africa already has a total capacity
Hydropower is well suited to meet large-scale industrial of 525 MW from hydro plants with individual capacities of less
demand, which provides a reliable revenue stream for future hydro than 10 MW, with 209 MW in Eastern Africa alone (IRENA, 2015b).
power developments. In the past, hydropower plants have been Mini- and micro-hydro offer cost-effective solutions to distributed
power generation requirements, particularly when the supply is
designed with energy-intensive aluminium smelters as planned
at the village or household level. For these installations, water
offtakers, including in Ghana and in Mozambique. In the latter, the
may be diverted from a rudimentary dam to power a small water
aluminium industry is now a significant economic activity. For the
turbine. Mulanje Micro Hydro Scheme for
Grand Inga project, 1 GW in capacity is to be allocated to local N North Africa
Where available, the implementation of small hydro plants is a electricity generation for households,
industrial projects, according to current plans.
cost-effective off-grid solution for rural areas. Capacity factors schools and clinics
Hydropower currently offers the most economical solution for areNhigh
Northand
Africa generation costs can be relatively low, with an Photograph: Drew Corbyn, Practical Action
large-scale renewable electricity generation, as the technology average LCOE of about USD 0.05/kWh. The weighted average
W West Africa
is mature and the resources are very large in comparison with installation costs for small-scale hydro in Africa is USD 3 800/kW
Africa’s current energy demand. It is less expensive than (IRENA, 2015d).
W West Africa
most technologies of any type for power production – costs in
Africa can be as low as USD 0.03/kWh, and the average is
E 2EastHydropower
Table Africa generation and technical potential Source: Hydropower and Dams (2014)
approximately USD 0.10/kWh. The weighted average installed
N North Africa
cost for large-scale hydro in Africa is USD 1 400/kW (IRENA, Hydro generation in 2013 Technically feasible Ratio between hydro generation
2015d). Since hydropower is a mature technology, there are limit- E
N East Africa
North Africa or most recent/average hydropower potential and technically feasible
Region (GWh/yr) (GWh/yr) hydropower potential
ed options for cost reductions.
W West Africa
The construction of dams associated with large hydro projects N North
C Africa
North
Central Africa
Africa 16 728 59 693 28%
can present some problems. Popular or activist opposition can W West Africa
West Africa 19 445 101 492 19%
arise from the displacement of individuals and whole towns,
C Central AfricaAfrica
Central 14 614 570 730 3%
the submersion of heritage sites and sensitive ecosystems and
W
E West Africa
EastEast Africa
Africa 26 215 334 600 8%
environmental impacts. Neighbouring states may object to altered
flows in shared bodies of water, in particular those downstream. S Southern
South Africa Africa 44 896 415 857 11%
E East Africa
However, working with various stakeholders can provide valuable
Total 122 538 1 584 670 8%
additional benefits such as flood control and irrigation reservoirs. S South Africa
E East Africa
C Central Africa 21
C Central Africa1.4 GEOTHERMAL ENERGY
1.4 GEOTHERMAL ENERGY
Geothermal energy is a resource of considerable importance In December 2014, for the first time, power generation from
in East and Southern Africa. It is estimated that the continent geothermal sources in Kenya accounted for more than half of
has a potential of 15 GW, all of it found along the Rift Valley, Kenya’s electricity output. Kenya is the main hub of the African
which runs from Mozambique to Djibouti (Geothermal Energy continent in terms of geothermal technology capacity building
Association, 2015). As of 2014 there was 606 MW of geothermal and is considering to host the Centre of Excellence for Geothermal
capacity installed in Africa, of which 579 MW was in Kenya Development in Africa.
(IRENA, 2015b). Kenya’s capacity more than doubled in 2014,
an indication of the rapid rate of implementation of this techno-
logy in the country. Kenya has production experience and
additional projects with a combined capacity of nearly 3 GW
have already been identified. Some are also under development
in Ethiopia and Tanzania and aim to increase the generating
capacity of these countries by 640 MW by 2018. Djibouti is aiming
for projects to come on-stream in 2020.
Olkaria geothermal complex and power station.
All photos taken during the visit organized for the
Global Geothermal Alliance Stakeholder Meeting
in Nairobi, Kenya (June, 2015, IRENA)
22TECHNOLOGIES TO HARNESS AFRICA’S ABUNDANT RENEWABLE RESOURCES PART 1
Geothermal plants are capital intensive and hence development Geothermal heat could also be applied directly to industrial
costs have risen along with increasing engineering, procurement processes that require low-temperature heat. These processes
and construction costs. Capital costs for recent projects in East dominate a large share of Africa’s manufacturing industry, and
Africa have ranged from USD 2 700/kW to USD 7 600/kW, with geothermal heat is a low-cost and secure substitute for fossil
a weighted average of USD 4 700/kW (IRENA, 2015d). The price fuels. For example, in Kenya, geothermal direct heat is being
tag for projects planned for the period 2015 to 2020 is expected successfully used in the flower industry. However, it is more likely
to drop from current levels, but overall these high upfront costs, that industrial demands will be met by electricity generated from
along with associated uncertainties, are the key barriers to the geothermal resources, and then only in East Africa.
development of geothermal power plants. In many instances
geothermal projects also require long-distance transmission
lines. Suitable risk-mitigation and transmission-network develop-
ment approaches are important for the development of these
resources.
231.5 WOODFUEL
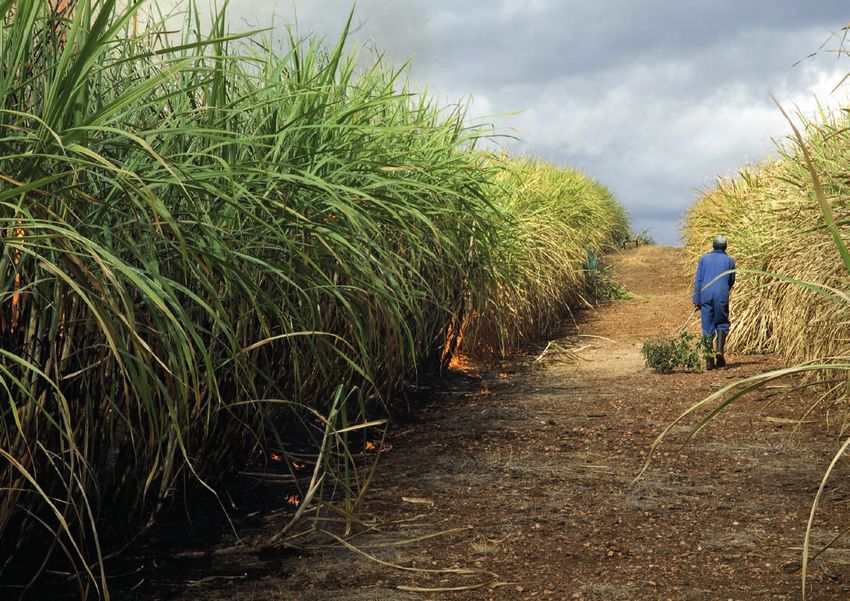
1.5 WOODFUEL
Woodfuel is the single most important primary energy source in these settings. Yet, without subsidies they are often more
across the African continent. With almost 15 EJ, it accounted for expensive and therefore not affordable for the urban poor.
nearly half of total primary energy supply in 2013 (IEA, 2015). In general woodfuel-based products are commonly produced
Woodfuel is primarily used for cooking and heating in the and used in traditional ways, characterised by low efficiency
residential sector, though sizable amounts are also used by small and adverse impacts on human health and living conditions. It is
and medium size industries for metal processing, food processing estimated that nearly 600 000 people died of indoor air pollution
and brick making. Wood is used either directly as firewood or in the in Africa in 2012 (WHO, 2015), and women and children spend a
form of charcoal. It is estimated that about one fifth of harvested few hours per day collecting firewood, deprived of time otherwise
South Sudan, John Wollwerth,
woodfuel is converted to charcoal. used for more productive activities.
© shutterstock
Continuous trends of deforestation in many African countries More efficient end-use of traditional biofuels is a key part of the
over the past two decades, on the one side, and a growing energy transition towards sustainable bioenergy supply. This should be
coupled with sustainable forest management and efficient biofuel
demand on the other, point to an unsustainable level of forest
conversion technologies.
harvesting. This is especially evident around densely populated
peri-urban and urban areas. Governments are taking initiatives to In addition to sustainable management of natural and planted
Ghana, Sopotnicki, © shutterstock slow down the speed of deforestation, but considering that 90% forest, fast growing woodfuel plantations also provide feed-
stock for modern bioenergy production. IRENA estimates the
of final energy used by households comes from woodfuel, it is
wood supply potential from surplus forest (beyond what is
clear that a transition to sustainable bioenergy supply requires
needed for non-energy purposes) in Africa at around 1.85 EJ/yr.
more effort.
About 35% of this potential is situated in East Africa and
Firewood is often the cheapest option for rural populations a further 31% in West Africa (IRENA, 2014b). There are already
to satisfy their basic energy needs and it is also a source of income 11 wood based power plants, with a total installed capacity of
for those involved in the charcoal supply chain. In urban areas, almost 30 MW, operating in Ghana, Congo, Ethiopia, Tanzania,
charcoal is available on the market, and thus more accessible Namibia and Swaziland, and a number of new plants are planned
and often more preferred than firewood. Electricity, kerosene or under construction (Platts McGraw Hill Financial, 2015). There
and liquefied petroleum gas (LPG) are alternative cooking fuels are also examples of co-firing wood-chips with coal.
24You can also read


