GLOBAL TRENDS
IN RENEWABLE
ENERGY
INVESTMENT
2020
←
→
Page content transcription
If your browser does not render page correctly, please read the page content below
GLOBAL TRENDS IN RENEWABLE ENERGY INVESTMENT 2020
Frankfurt School-UNEP Centre/BNEF. 2020.

    Global Trends in Renewable Energy Investment 2020, http://www.fs-unep-centre.org (Frankfurt am Main)

    Copyright © Frankfurt School of Finance & Management gGmbH 2020.

    This publication may be reproduced in whole or in part in any form for educational or non-profit purposes
    without special permission from the copyright holder, as long as provided acknowledgement of the source
    is made. Frankfurt School – UNEP Collaborating Centre for Climate & Sustainable Energy Finance would
    appreciate receiving a copy of any publication that uses this publication as source.

    No use of this publication may be made for resale or for any other commercial purpose whatsoever without
    prior permission in writing from Frankfurt School of Finance & Management gGmbH.

    Disclaimer

    The designations employed and the presentation of the material in this publication do not imply the
    expression of any opinion whatsoever on the part of the Frankfurt School, the BNEF and the United Nations
    Environment Programme concerning the legal status of any country, territory, city or area or of its authorities,
    or concerning delimitation of its frontiers or boundaries. Moreover, the views expressed do not necessarily
    represent the decision or the stated policy of the Frankfurt School, the BNEF and the United Nations
    Environment Programme, nor does citing of trade names or commercial processes constitute endorsement.

    Geographical disclaimer

    The designations employed and the presentation of the material in this report do not imply the expression of
    any opinion whatsoever on the part of the authors, of the Frankfurt School, the BNEF or the United Nations
    Environment Programme concerning the name or legal status of any country, territory, city or area, nor of its
    authorities, nor concerning the delimitation of its frontiers or boundaries.

    Cover photo courtesy of Orsted.

    Photos on pages 13, 19, 21, 28, 40, 42, 44, 54, 62, 67, 69, 70 from Bloomberg Mediasource.

    Photos on other pages reproduced with the permission of: Mainstream Renewable Power (pages 15 and
    48); Iberdrola (page 25); Orsted (pages 26 and 33); Alcazar Energy (page 39); BayWay r.e. (pages 47 and 53);
    Greencoat Capital (page 56); EDF Energies Nouvelles (page 59); Angus McCrone (pages 60 and 73); NextEnergy
    Capital (age 75); Mott MacDonald (page 76).

2
TA B L E O F C O N T E N T S

TABLE OF CONTENTS

FOREWORD .. ....................................................................................................................................................   5
LIST OF FIGURES .............................................................................................................................................      7
METHODOLOGY AND DEFINITIONS ..............................................................................................................                         9
KEY FINDINGS ................................................................................................................................................. 11
FOCUS CHAPTER: THE IMPACT OF 2030 TARGETS ........................................................................................ 12
-  Government 2030 renewable energy targets
-  Private sector renewable energy targets
-  Investment implied by targets
-  Box: Targets for low-carbon transport
-  Box: Targets for renewable heat
1.    RENEWABLE CAPACITY GROWTH IN 2019 ............................................................................................. 22
-     Dollars deployed
-     Capacity added
-     The cost revolution continues
-     Renewables versus fossil fuels
-     Box: Investment over the decade 2010-2019
2.    CAPACITY INVESTMENT – GLOBAL ......................................................................................................... 32
-     Technology split
-     Asset finance
-     Becoming ‘bankable’
-     Small distributed capacity
-     Box: Large hydro-electric projects
3.    CAPACITY INVESTMENT – DEVELOPING COUNTRIES ............................................................................ 42
-     China
-     India
-     Middle East and Africa
-     Latin America
-     Emerging Asia-Pacific excluding China and India
4.    CAPACITY INVESTMENT – DEVELOPED COUNTRIES .............................................................................. 52
-     United States
-     Europe
-     Other developed economies
5.    TOTAL RENEWABLE ENERGY INVESTMENT ............................................................................................ 58
-     Financing continuum
-     Overall investment
6.    INVESTMENT IN RENEWABLE ENERGY COMPANIES ............................................................................. 64
-     Research and development
-     Venture capital and private equity
-     Public markets
7.    ACQUSITION ACTIVITY ............................................................................................................................. 72
-     Corporate transactions
-     Private equity buy-outs
-     Asset transactions
GLOSSARY ....................................................................................................................................................... 78

                                                                                                                                                                       3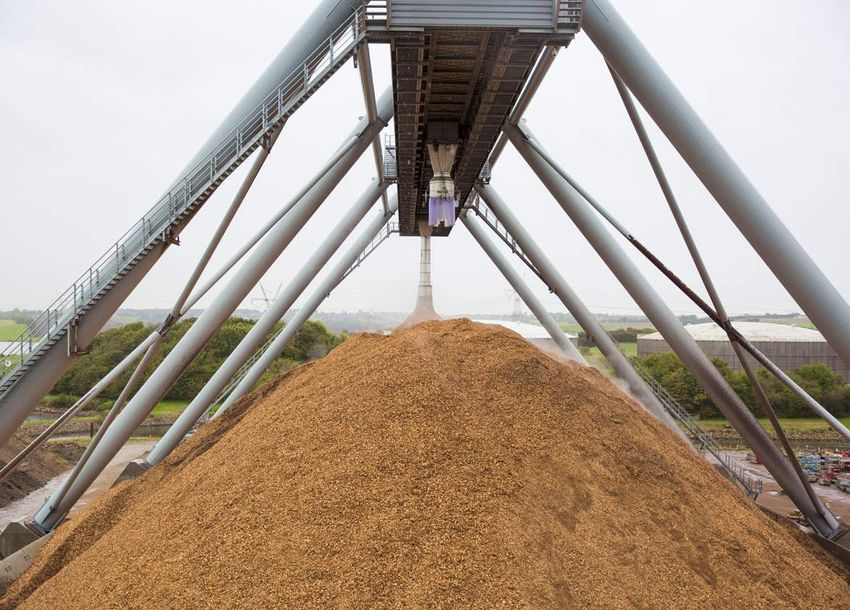
ACKNOWLEDGEMENTS

ACKNOWLEDGEMENTS

    This report was commissioned by UNEP’s Economy Division in cooperation with Frankfurt
    School-UNEP Collaborating Centre for Climate & Sustainable Energy Finance and produced in
    collaboration with BloombergNEF.

    CONCEPT AND EDITORIAL OVERSIGHT
    Angus McCrone (BloombergNEF) (Lead Author, Chief Editor)
    Ulf Moslener (Frankfurt School) (Lead Editor)
    Francoise d’Estais (UNEP) (Lead Editor)
    Christine Grüning (Frankfurt School)
    Malin Emmerich (Frankfurt School)

    CONTRIBUTORS
    Tayo Ajadi (BloombergNEF)
    Victoria Cuming (BloombergNEF)
    Rohan Boyle
    David Strahan
    Matthias Kimmel (BloombergNEF)
    Michael Logan

    COORDINATION
    Angus McCrone (BloombergNEF)

    DESIGN AND LAYOUT
    The Bubblegate Company Limited

    MEDIA OUTREACH
    Sophie Loran (UNEP)
    Terry Collins
    Veronika Henze (BloombergNEF)
    Robert Leonhardt (Frankfurt School)
    Vera Klopprogge (Frankfurt School)

    THANKS TO THE FOLLOWING EXPERTS WHO REVIEWED AND PROVIDED FEEDBACK
    ON THE DRAFT REPORT:
    Rob Macquarie (Climate Policy Initiative), Baysa Naran (Climate Policy Initiative),
    Valerie Furio (Climate Policy Initiative), Mark Fulton, Wolfgang Mostert, Laird Reed (ICF),
    Gunter Fischer (EIB), Carsten Jung (GIZ), Danielle Wards

    Supported by the Federal Republic of Germany

4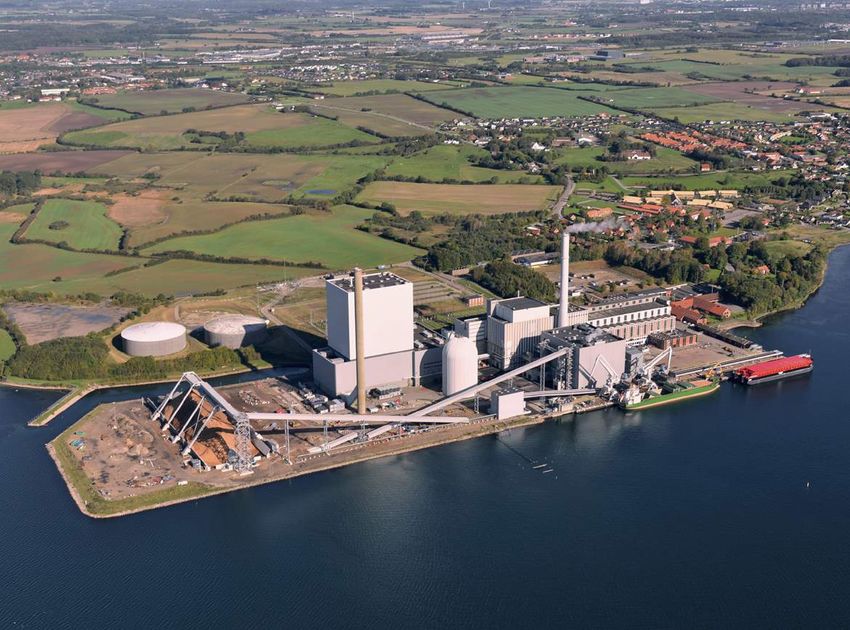
FOREWORD

FOREWORD FROM INGER ANDERSEN,
NILS STIEGLITZ AND JON MOORE

                   INGER                                  NILS STIEGLITZ                          JON MOORE
                   ANDERSEN
                                                          President                               Chief Executive
                   Executive Director
                                                          Frankfurt School                        BloombergNEF
                   UN Environment                         of Finance and
                   Programme                              Management

It is nothing new to say that clean energy is better     This is great progress, but there is room to do
for the planet, and humanity, than energy derived        much more. Nations and corporations have made
from fossil fuels. Its benefits in avoiding greenhouse   clean energy commitments over the next decade.
gas emissions, delivering cleaner air and bringing       Analyzing them in its focus chapter, the report
energy to marginalized communities are essential         finds commitments for 826GW of new non-hydro
to a better future for all. What is new is that the      renewable power capacity by 2030, at a likely cost
world has a unique opportunity to accelerate clean       of around $1 trillion. However, these commitments
development by putting renewable energy at the           fall far short of what is needed to limit the rise in
heart of Covid-19 economic recovery plans.               global temperatures to less than 2 degrees Celsius
                                                         under the Paris Agreement. It also falls short of
Governments will inject huge amounts of money            last decade’s achievements, which brought around
into their economies as they look to bounce back         1,200GW of new capacity for $2.7 trillion.
from Covid-19 lockdowns, which have saved lives
but stopped growth and cost jobs. This new report,       This lack of ambition can be rectified in economic
Global Trends in Renewable Energy Investment 2020,       recovery packages. Simply repeating the investment
shows that putting these dollars into renewables will    of the last decade over the next would buy far more
buy more generation capacity than ever before, and       clean energy than it did before. The slump in the
help governments deliver stronger climate action         fossil fuel sector due to Covid-19, combined with the
under the Paris Agreement.                               resilience clean energy has shown during this period,
                                                         made it clear that clean energy is a smart investment.
The report shows that renewable energy capacity,
excluding large hydro, grew by a record 184              If governments take advantage of the ever-falling
gigawatts (GW) in 2019. This was 20GW, or 12%,           price tag of renewables to put clean energy at the
more than new capacity added in 2018. Yet the 2019       heart of Covid-19 economic recovery, instead of
dollar investment was only 1% higher, at $282.2          subsidizing the recovery of fossil-fuel industries,
billion. Meanwhile, the all-in cost of electricity       they can take a big step towards clean energy and a
continues to fall for wind and solar, thanks to          healthy natural world – which ultimately is the best
technology improvements, economies of scale and          insurance policy against global pandemics.
fierce competition in auctions. Costs for electricity
from new solar photovoltaic plants in the second
half of 2019 were 83% lower than a decade earlier.

                                                                                                                    5
"The chorus of voices calling on governments to use their Covid-19 recovery
     packages to create sustainable economies is growing. This research shows that
     renewable energy is one of the smartest, most cost-effective investments they
     can make in these packages.

    “If governments take advantage of the ever-falling price tag of renewables to
     put clean energy at the heart of Covid-19 economic recovery, they can take a
     big step towards a healthy natural world, which is the best insurance policy
     against global pandemics.”

     Inger Andersen, Executive Director of the UN Environment Programme

    “Renewables such as wind and solar power already account for almost 80%
     of newly built capacity for electricity generation. Investors and markets are
     convinced of their reliability and competitiveness.

    “The promotion of renewables can be a powerful engine for the recovery of
     the economy after the Coronavirus crisis, creating new and secure jobs. At the
     same time, renewables improve air quality thus protecting public health. By
     promoting renewable energies within the framework of Coronavirus economic
     stimulus packages, we have the opportunity to invest in future prosperity,
     health and climate protection.”

     Svenja Schulze, Minister of the Environment,
     Nature Conservation and Nuclear Safety, Germany

    “We see the energy transition is in full swing, with the highest capacity of
     renewables financed ever. Meanwhile, the fossil fuel sector has been hit hard
     by the Covid-19 crisis – with demand for coal- and gas-fired electricity down in
     many countries, and oil prices slumping.

    “The climate and Covid-19 crises – despite their different natures – are both
     disruptions that command attention from policy makers and managers alike.
     Both crises demonstrate the need to increase climate ambition and shift the
     world’s energy supply towards renewables.”

     Nils Stieglitz, President of Frankfurt School of Finance & Management

    “Clean energy finds itself at a crossroads in 2020. The last decade produced
     huge progress, but official targets for 2030 are far short of what is required to
     address climate change. When the current crisis eases, governments will need
     to strengthen their ambitions not just on renewable power, but also on the
     decarbonization of transport, buildings and industry.”

     Jon Moore, Chief Executive of BloombergNEF

6
LIST OF FIGURES

LIST OF FIGURES

Figure 1. Renewable power additions required to meet government targets with deadlines
between 2020 and 2030, GW                                                                                         14

Figure 2. Renewable power additions required to meet government targets with deadlines
between 2020 and 2030, by country, GW                                                                             14

Figure 3. Growth of corporate members of RE100                                                                    15

Figure 4. Projected renewable electricity shortfall for the RE100, TWh                                            16

Figure 5. Capacity additions to 2030 implied by targets, versus required for 2 degrees, GW                        17

Figure 6. Number of governments that have announced plans to phase out combustion vehicle sales                   18

Figure 7. Share of renewable energy for heating and cooling in the EU 27, 2004-2018, %                            20

Figure 8. Global renewable energy capacity investment, 2004 to 2019, $bn                                          23

Figure 9. Global investment in renewable energy capacity by sector in 2019, and growth on 2018, $bn               23

Figure 10. Investment in renewable energy capacity by region, 2019, $bn                                           24

Figure 11. Investment in renewables capacity by top 30 country or territory 2019, and growth on 2018, $bn         24

Figure 12. Renewable energy capacity investment in the U.S., Europe and China, 2004-2019                          25

Figure 13. Investment in renewable energy capacity, developed vs developing countries, 2004-2019, $bn             26

Figure 14. Global capacity in renewable power, 2004-2019, GW                                                      27

Figure 15. Renewable energy capacity investment in $bn vs GW capacity added, 2005-2019                            27

Figure 16. Levelized cost of electricity, by main renewable energy technology, 2009 to 2019, $ per MWh            28

Figure 17. Renewable power generation and capacity as a share of global power, 2007-2019, %                       29

Figure 18. Net power generating capacity added in 2019 by main technology, GW                                     29

Figure 19. Renewable energy capacity investment over the decade, 2010-2019, $bn                                   31

Figure 20. Renewable energy capacity investment from 2010 to 2019, top 20 markets, $bn                            31

Figure 21. Renewable energy asset finance and small distributed capacity investment by sector, 2019,
and growth on 2018, $bn                                                                                           33

Figure 22. New investment in wind and solar projects worldwide, by sub-sector, 2004-2019, $bn                     34

Figure 23. Asset finance investment in renewable energy by mode of finance, 2004-2019, $bn                        35

Figure 24. Largest asset finance deals in renewable energy in 2019                                                36

Figure 25. Global auctioned renewables capacity, 2003-2019, $bn                                                   37

Figure 26. Global volume of corporate power purchase agreements signed, by region, 2008-2019, GW                  37

Figure 27. Small distributed capacity investment, 2004-2019, $bn                                                  38

Figure 28. Small PV system cost in Germany, the U.S. and Australia, and trend in Chinese module prices,
$ per Watt                                                                                                        39

Figure 29. Capacity investment in renewables: developed countries, China and India,
other developing economies, 2019, and growth on 2018, $bn                                                         43

                                                                                                                        7
LIST OF FIGURES

LIST OF FIGURES

    Figure 30. Renewable energy capacity investment in China by sector and sub-sector, 2019,
    and change on 2018, $bn                                                                                      43

    Figure 31. Renewable energy capacity investment in India by sector and sub-sector, 2019,
    and change on 2018, $bn                                                                                      45

    Figure 32. Renewable energy capacity investment in Middle East and Africa by country, 2019,
    and change on 2018, $bn                                                                                      46

    Figure 33. Renewable energy capacity investment in Latin America by country, 2019, and change on 2018, $bn   49

    Figure 34. Renewable energy capacity investment in non-OECD Asia (excluding China and India),
    2019, and change on 2018, $bn                                                                                50

    Figure 35. Renewable energy capacity investment in the U.S. by sector and sub-sector, 2019,
    and change on 2018, $bn                                                                                      53

    Figure 36. Renewable energy capacity investment in Europe by sector and sub-sector, 2019,
    and change on 2018, $bn                                                                                      54

    Figure 37. Renewable energy capacity investment in Europe by country, 2019, $bn, and growth on 2018          55

    Figure 38. Renewable energy capacity investment in other major developed economies, 2019,
    and growth on 2018, $bn                                                                                      57

    Figure 39. Financing continuum                                                                               58

    Figure 40. Global new investment in renewable energy by asset class, 2004 to 2019, $bn                       61

    Figure 41. Global transactions in renewable energy, 2019, $bn                                                61

    Figure 42. Global Trends In Renewable Energy Investment 2020 data table, $bn                                 62

    Figure 43. R&D investment in renewable energy by sector 2019, $bn                                            65

    Figure 44. Corporate and government renewable energy R&D 2004-2019, $bn                                      66

    Figure 45. VC/PE new investment in renewable energy by stage, 2004-2019, $bn                                 66

    Figure 46. VC/PE new investment in renewable energy by sector, 2019, $bn                                     66

    Figure 47. VC/PE new investment in renewable energy by sector, 2004-2019, $bn                                67

    Figure 48. VC/PE new investment in renewable energy by region, 2004-2019, $bn                                67

    Figure 49. Some of the largest VC/PE equity raisings in renewable energy in 2019, $m                         68

    Figure 50. Public market new investment in renewable energy by stage, 2004-2019, $bn                         68

    Figure 51. Public markets new investment in renewable energy by sector, 2019, $bn                            69

    Figure 52. Public markets investment in renewable energy by sector, 2004-2019, $bn                           69

    Figure 53. Biggest public equity raisings in 2019, $m                                                        70

    Figure 54. NEX vs selected indices, 1 January 2019 to 31 December 2019                                       71

    Figure 55. Largest companies in the NEX Index, by market capitalization, $bn                                 71

    Figure 56. Acquisition transactions in renewable energy by type, 2004-2019, $bn                              72

    Figure 57. Acquisition transactions in renewable energy by sector, 2004-2019, $bn                            73

    Figure 58. Largest corporate M&A deals in renewable energy in 2019, $m                                       74

    Figure 59. Asset acquisitions and refinancings by region, 2004-2019, $bn                                     77

8
METHODOLOGY AND DEFINITIONS

METHODOLOGY AND DEFINITIONS

All figures in this report, unless otherwise credited,      Annual investment is estimated for small-scale
come from BloombergNEF, or BNEF, which maintains            commercial and residential projects such as rooftop
the world’s most comprehensive database of                  solar. These figures, referred to in the investment
investors, projects and transactions in clean energy.       charts of the report as ‘small distributed capacity',
                                                            are based on annual installation data provided by
The BloombergNEF database at www.bnef.com                   industry associations and governments.
collates all organizations, projects and investments
according to transaction type, sector, geography            This report does not cover larger hydro-electric
and timing. It covers many tens of thousands                dams of more than 50MW, except for brief
of organizations (including start-ups, corporate            mentions in Chapters 1 and 2.
entities, venture capital and private equity
providers, banks and other investors), projects             The BNEF database also covers all deals in the
and transactions.                                           following categories: equity raising by specialist
                                                            renewable energy companies from venture capital
METHODOLOGY                                                 and private funds and public market investors;
                                                            all acquisitions of specialist renewable energy
The BNEF database seeks to cover the following              companies or strategic stakes in those; and all
types of asset: all solar, biomass and waste-to-            acquisitions and refinancings of renewable energy
energy, geothermal, and wind generation projects            projects and assets.
of more than 1MW; all hydropower projects of
between 1MW and 50MW; all wave and tidal                    Figures on research and development by specialist
energy projects; all biofuel projects with a capacity       renewable energy companies are collated annually
of one million litres or more per year.                     from the Bloomberg Terminal and other sources.
                                                            Those on government R&D are estimated annually
Where deal values are not disclosed, BNEF                   using a variety of official and third-party sources.
assigns an estimated value based on comparable
transactions. Deal values are rigorously back-              All of this is a dynamic process: as the sector’s
checked and updated when further information is             visibility grows, information flow improves,
released about particular companies and projects.           new deals come to light and existing data are
The statistics used are historical figures, based on        refined, meaning that historical figures are
confirmed and disclosed investment.                         constantly updated.

   This 2020 report contains revisions to a number of investment figures published in the 2019 edition of
   Global Trends in Renewable Energy Investment. Revisions reflect improvements made by BloombergNEF
   to its data during the course of the last 12 months, and also new transactions in 2018 and before that have
   since come to light.

                                                                                                                    9
METHODOLOGY AND DEFINITIONS

     DEFINITIONS                                                 Venture capital and private equity (VC/PE): all
                                                                 money invested by venture capital and private
     Investment categories in this report are defined            equity funds in the equity of specialist companies
     as follows:                                                 developing     renewable     energy     technology.
                                                                 Investment in companies setting up generating
     Capacity investment: all money invested in                  capacity through special purpose vehicles is counted
     renewable energy generation projects, large or              in the asset financing figure. This is discussed in
     small. It covers both asset finance of utility-scale        Chapter 6.
     projects, whether from internal company balance
     sheets, from loans, or from equity capital, and the         Public markets: all money invested in the equity of
     financing of small-scale solar systems of less than         specialist publicly quoted companies developing
     1MW. The Focus Chapter and Chapters 1 to 4 of this          renewable energy technology and clean power
     report concentrate entirely on capacity investment.         generation. This is discussed in Chapter 6.

     Total renewable energy investment: this brings              Acquisition activity: the value of existing equity
     together capacity investment with the R&D, VC/PE            and debt purchased by new corporate buyers,
     and public markets categories listed below. It also         in companies developing renewable energy
     incorporates an adjustment for re-invested equity           technology, or setting up or operating renewable
     (generally when money raised from VC/PE or public           power and fuel projects. It includes refinancing.
     markets is then re-invested in renewable energy             Acquisitions are not included in total renewable
     assets). The adjustment prevents double-counting.           energy investment because they represent money
     Total renewable energy investment is discussed in           changing hands, rather than new money coming
     Chapter 5.                                                  into the sector. They are discussed in Chapter 7.

     Research and development (R&D): all money                   Commonly used terms in the report are defined in
     invested in early-stage renewable energy                    the Glossary after the end of Chapter 7.
     technologies and techniques, whether financed
     out of government budgets or from the balance
     sheets of specialist renewables companies. This is
     discussed in Chapter 6.

        REN21’s annual Renewables Global Status Report (GSR) was first released in 2005. The Global Status Report
        is the sister publication to UNEP Global Trends in Renewable Energy Investment, and its latest edition will
        be released June 2020. The GSR grew out of an effort to capture comprehensively, for the first time, the
        full status of renewable energy worldwide. Over the years, the report has expanded in scope and depth,
        in parallel with tremendous advances in renewable energy markets and industries. The GSR is the industry
        standard on the status of renewables. The report is based on thousands of data points, hundreds of reports
        and other documents, and personal communications with experts from around the world.

10
KEY FINDINGS
KEY FINDINGS
n
Governments and companies around the world n Investment in offshore wind hit its highest ever,
have committed to adding some 826 gigawatts at $29.9 billion, up 19% year-on-year thanks to
of new non-hydro renewable power capacity in a fourth-quarter surge, most notably in China
the decade to 2030, at a likely cost of around $1 but also in France – the first financial close in its
trillion. Those commitments fall far short of what offshore program – and the U.K. The year saw
would be needed to limit world temperature Taiwan secure its first three financings for sea-
increases to less than 2 degrees Celsius. They also based arrays.
look modest compared to the $2.7 trillion invested
during the 2010-2019 decade, as recorded by this n
The U.S. edged ahead of Europe in terms of
Global Trends report. renewables investment last year. The U.S. invested
$55.5 billion, up 28%, helped by a record rush of
n The Covid-19 crisis has slowed down deal-making onshore wind financings to take advantage of tax
in renewables in recent months, along with that credits before their expected expiry, while Europe
in other sectors, and this will affect investment committed $54.6 billion, down 7%.
levels in 2020. However, governments now have
the chance to tailor their economic recovery n
Developing countries continued to outpace
programs to accelerate the phase-out of polluting developed economies in renewables investment.
processes and the adoption of cost-competitive In 2019, they committed $152.2 billion, compared
sustainable technologies. to $130 billion for developed countries. But there
was a shift in the mix, with China and India both
n
The stakes are high. If this chance is missed, it slipping back, while ‘other developing countries’
may be even more difficult to find the funding jumped 17% to a record $59.5 billion. Included in
to decarbonize the energy system in a post- the latter figure was the largest financing ever in
Covid-19 global economy characterized by the solar sector: $4.3 billion for the Al Maktoum IV
elevated government debt and squeezed private solar thermal and photovoltaic complex in Dubai.
sector finances.
n
Once again, renewables dwarfed conventional
n
In 2019, the amount of new renewable power generation sources in terms of both capacity
capacity added (excluding large hydro) was the additions and investment. Nearly 78% of the
highest ever, at 184 gigawatts, 20GW more than net gigawatts of generating capacity added
in 2018. This included 118GW of new solar systems, globally in 2019 were in wind, solar, biomass and
and 61GW of wind turbines. waste, geothermal and small hydro. Investment in
renewables excluding large hydro was more than
n Falling costs meant that this record commissioning three times that in new fossil fuel plants.
of green gigawatts could happen in a year when
dollar investment in renewable energy capacity n Renewable technologies (excluding large hydro)
stayed almost flat. In 2019, renewable energy raised their share of global generation to 13.4%
capacity investment was $282.2 billion, just 1% in 2019, from 12.4% in 2018 and just 5.9% in 2009.
higher than the previous year. That share is increasing slowly because of the
large, established fossil fuel fleet. However, that
n Capacity investment in solar slipped 3% to $131.1 amount of renewable electricity production last
billion in 2019, while that in wind climbed 6% year was enough to prevent the emission of an
to $138.2 billion – the first time that wind has estimated 2.1 gigatonnes of CO2.
outweighed solar in terms of dollars committed
since 2010. Falling capital costs, and a further n The all-in, or levelized, cost of electricity continued
slowdown in China’s PV market, held back the to fall for wind and solar, thanks to technology
solar total. improvements, economies of scale and fierce
competition in auctions. For solar PV, it stood in
the second half of 2019 some 83% lower than a
decade earlier, while the equivalent reductions
for onshore and offshore wind were 49% and
51% respectively.
11FOCUS CHAPTER
THE IMPACT OF 2030 TARGETS
n This Focus Chapter of the Global Trends report looks ahead to the new decade, and the additions
in renewable energy capacity that are implied by official government targets and company
voluntary targets. It compares those extra gigawatts with what would be required to bring global
power system emissions into line with the need to limit climate change. It also looks at some
specific targets to bring low-carbon alternatives into other parts of the energy system, such as
heat and transport.
n Renewable energy 2030 targets already written into official policy by 87 governments around the
world would mean the construction of an estimated 721 gigawatts of new capacity in wind, solar
and other non-hydro renewable power technologies over the next decade, according to analysis
by BloombergNEF.
n Meanwhile, those private sector companies that have joined the RE100 group, pledging to source
100% of their power from renewables, will need to buy an estimated 210 terawatt-hours of green
electricity by 2030, on top of what they consume now, in order to be on track. This could prompt
the construction of an estimated 105 gigawatts of new wind and solar plants.
n Taken together, these commitments by governments and companies would imply 826GW of new
capacity. This could entail around $1 trillion of investment globally during the next 10 years, or an
average of $100 billion per year.
n However, the targets above – and the implied investment – are only a fraction of what would
be required to put the world on a path to reduce carbon dioxide emissions sufficiently to limit
temperature increases to “well below” 2 degrees Celsius, as stated in the Paris Agreement.
This message of a shortfall in ambition is in tune with the message of the latest UNEP Emission
Gap report.1
n The 2030 targets are also modest compared to what has already been done. As shown in Chapter
1 of this report, in the decade 2010-2019, the world added 1,213 gigawatts of renewable power
capacity (excluding large hydro-electric dams), investing nearly $2.7 trillion.
The beginning of a new decade provides an This chapter looks at the amount of new renewable
opportunity for the Global Trends report to feature power capacity that will need to be built in the
this forward-looking chapter. True to the report’s years up to 2030 to meet the official targets of
established role, the usual analysis of renewable governments around the world, and then at
energy investment in the year just past is contained the additional amount implied by targets set by
in the subsequent Chapters 1 to 7. private sector companies. It then compares those
numbers with what would be necessary to meet
international climate goals.
https://www.unenvironment.org/resources/emissions-gap-report-2019
1
12FOCUS CHAPTER
The Focus Chapter takes a full 10-year view. It is world cities during ‘lockdown’ periods, could lead
written at a time when the coronavirus is hitting to stronger pressure on governments to phase out
countries around the world, one after the other. polluting power stations and modes of transport.
The pandemic’s direct economic effects will be
severe in the short term, but are likely to fade as In addition, governments are likely to use stimulus
the decade unfolds. programs to try to accelerate economic recovery,
as they did in 2009 after the financial crisis.
Health imperatives have understandably diverted the These programs could prioritize work that would
attention of governments away from climate and “kill two birds with one stone” – boosting both
decarbonization priorities, and COP26 due to be held in economic activity and decarbonization, for instance
Glasgow in November 2020 has now been postponed by building electricity transmission lines to link
to 2021. In the private sector, many investment deals renewables to the grid, or expanding charging
in clean energy will take longer to complete this year networks for electric vehicles. Another option
than usual because of the difficulties of bringing might be to include ‘green conditionality’ on the
participants together. And some company boards will provision of support funds.
be concentrating during 2020 on financial survival
rather than longer-term sustainability. However, there is a risk of the opportunity
being missed. Some governments could end up
However, the coronavirus outbreak may also have spending heavily on ‘traditional’, carbon-intense
a more lasting influence on the energy transition. infrastructure, in so doing cramping their fiscal
For instance, the focus on health and respiratory room to fund more climate-friendly investments
problems, and citizens’ experience of cleaner air in later in the decade.
GOVERNMENT 2030 RENEWABLE
ENERGY TARGETS
Governments around the world have written
into official policy, or put into law, targets that
would raise the amount of renewable power
capacity installed by 2030. The figures, drawn from
analysis by BloombergNEF, 2 indicate that some
721 gigawatts of wind, solar, biomass and waste-
to-energy, geothermal and marine power plants
would need to be built over the coming decade
to meet those targets. How this compares to what
was achieved in the 2010-2019 period, and to what
is needed to curb emissions, is discussed later in this
chapter, starting on page 17.
Note that this analysis of targets is not based on
the Nationally Determined Contributions, or NDCs,
as prepared by countries in the context of the
Paris Climate Agreement of December 2015. Some
of those aspirations have been translated into
government policy statements or laws, but others
have not. This chapter concentrates on what is
written into official policy so far, and therefore has
the clearest momentum behind it.
2
he analysis covers 87 countries that have targets relating to 2030, or to earlier years. It does not seek to guess progress toward longer-term
T
targets for years after 2030.
13FOCUS CHAPTER
One clear message from Figure 1 is FIGURE 1. RENEWABLE POWER ADDITIONS REQUIRED TO MEET
that governments as a whole have GOVERNMENT TARGETS WITH DEADLINES BETWEEN 2020 AND 2030,
GW
been more ambitious about setting
targets for solar than they have for
any other non-hydro renewable
energy technology. This reflects the
fact that three countries (China,
India and Germany) would need
to build a further 70GW, 68GW
and 48GW respectively by 2030
or earlier, in order to meet their
ambitious solar targets. The U.K.,
India and Germany would need
to build 32GW, 30GW and 17GW
respectively, to meet their offshore
wind targets.
In addition, governments have
official targets to install 488
gigawatts of hydro-electric Source: UNEP, Frankfurt School-UNEP Centre, BloombergNEF
capacity, large and small, by 2030.
Large hydro-electric dams of more FIGURE 2. RENEWABLE POWER ADDITIONS REQUIRED TO MEET
than 50 megawatts are outside GOVERNMENT TARGETS WITH DEADLINES BETWEEN 2020 AND 2030,
the main scope of this report, BY COUNTRY, GW
although they are discussed briefly
in Chapters 1 and 2. Smaller hydro
projects are included in the report,
but official government targets
do not usually split out small from
large hydro.
These targets for low-carbon power
generation come from no fewer
than 87 governments, representing
both high-income countries that
were early movers in green energy
10-20 years ago, and developing
economies. Some of the latter are
established backers of renewable
power. Others have come to it more
recently as a result of improved
For targets based on electricity consumption or generation, the equivalent volume of
cost-competitiveness, and the capacity was devised, based on BloombergNEF’s New Energy Outlook 2019 estimates for
climate change emergency. future demand and capacity factors for the relevant technologies.
Source: UNEP, Frankfurt School-UNEP Centre, BloombergNEF
Developed economies 3 account for
just over two-fifths (297GW) of the new non-hydro The latter category includes relatively modest targets
renewables capacity implied by 2030 government for non-hydro capacity in 2030 in some economies
targets around the world,4 with the two most that have invested significantly already, such as Brazil
populous developing economies of China and and Mexico, but also ambitious ones for relative
India accounting for 206GW and ‘other developing newcomers to wind and solar, such as Saudi Arabia,
countries’ for the remaining 219GW. the United Arab Emirates and Algeria. Figure 2 shows
On the definition used in this report (all OECD countries, except for Mexico, Chile and Turkey).
3
Actual investment in 2019 by developed countries was close to this proportion, at 46% of the world total.
4
14FOCUS CHAPTER
the top 20 countries by the size of FIGURE 3. GROWTH OF CORPORATE MEMBERS OF RE100
their targeted non-hydro renewable
power additions between 2020
and 2030. Note that the U.S. is not
covered in Figure 2, because it has
no national renewables deployment
targets. Sub-national targets, such as
the Renewable Portfolio Standards
of certain U.S. states, are not included
in the analysis in this Focus Chapter.
Many countries that built significant
green power capacity in the 2010-
2019 decade (see Figure 20 in
Chapter 1) feature only modestly
in the 2030 official targets. They
may well end up adding far more
renewables than the targets imply.
Data to end of January 2020
Source: UNEP, Frankfurt School-UNEP Centre, BloombergNEF
Equally, some of the countries that
have set official policy targets for
renewable energy in 2030 may not meet them. Or Private sector entities can too, and more and more
they may decide in the interim to amend policies in companies have been doing exactly that. Figure 3
order to have different targets. However, legislated shows the sharply rising trend in the number of
targets do provide an indication of intent as far corporations joining the RE100 group, which brings
as adding renewable energy over the decade together organizations that have set a target to
is concerned. source 100% of their power from renewables by a
particular date in the future.
PRIVATE SECTOR RENEWABLE ENERGY TARGETS
Prominent members of RE100 include Apple,
It is not only governments that set targets for Facebook and Microsoft, all of which have been
the decarbonization of the electricity system. prolific signatories of renewable energy power
15FOCUS CHAPTER
purchase agreements,5 but also FIGURE 4. PROJECTED RENEWABLE ELECTRICITY SHORTFALL FOR THE
a wide range of companies from RE100, TWH
countries as diverse as Japan, the
U.K. and India. The list includes 19
of the 100 largest companies in the
world by revenue.6
RE100 is just the tip of the iceberg,
because many other companies
have set targets for a lower
proportion than 100% or have set
no actual target but are actively
seeking to raise the share of
renewables in their energy mix.
Corporations are making
these efforts in order to help
demonstrate the sustainability of
their business models, as well as for Certificate purchases are assumed to step down 10% each year. Onsite generation and
contracted wind and solar purchases remain flat through 2030. Electricity demand and
economic reasons. One audience
7
renewable electricity demand don’t intersect in 2030, as some companies have targets
is customers, since many of these, extending out past 2030
Source: UNEP, Frankfurt School-UNEP Centre, BloombergNEF
particularly the young, may want
to choose brands that are perceived
as environmentally friendly. Another is investors, RE100 has increased rapidly year-on-year, and
many of whom now have sustainability mandates could well continue to do so – raising the required
or are putting pressure on corporate boards to gigawatts of extra wind and solar capacity. For
improve their performance on ESG (environmental, another, RE100 members also have supply chains,
social and governance) issues. A third is staff and with other companies selling them components,
potential recruits – many people prefer to work for materials and services. Members are increasingly
a company that takes sustainability seriously. looking at moves to encourage, or even oblige,
suppliers to ‘go green’ with their own electricity
Figure 4 looks at what is implied between consumption.
now and 2030 by the commitments of existing
RE100 members. BloombergNEF estimates that There are inevitably a number of assumptions
these RE100 members would need to source an behind Figure 4. One is that the electricity
additional 210 terawatt-hours (TWh) of green consumption of these companies continues to
electricity by 2030. Meeting this 210TWh shortfall increase at the same rate as in recent years, despite
by 2030 could underpin 105GW of new solar and continuing efforts to improve energy efficiency;
wind plant construction globally by 2030, if the another is that they raise the renewable share of
current members relied solely on offsite solar and their electricity consumption in line to hit their
wind power purchase agreements (PPAs).8 For 100% targets by their chosen end-date; a third
context, this is more than the U.K.’s 101GW power assumption is that their method of doing so is by
fleet, and comes on top of 16.4GW of existing PPAs signing PPAs with renewable power providers,
already signed by RE100 members. rather than by buying ‘green certificates’ on the
market.9 It is harder to argue that a company is
It may be that the total new renewable energy causing new green power capacity to be built if
capacity built as a result of RE100 commitments they are merely buying green certificates, than if
turns out to be even greater than this. For one they are signing PPAs with to-be-constructed wind
thing, the number of companies signing up to farms, solar parks or other green power plants.
5
See Chapter 2, Figure 26 for aggregate statistics on corporate PPA activity.
6
According to the Fortune Global 500 list.
7
In many cases, also locking in long-term electricity prices that are lower than would have been the case a few years ago, because of the
falls in the costs of wind and solar.
8
Onsite renewables could also play a role but, for simplicity, they are not included in the estimate.
9
Including Renewable Energy Certificates in certain U.S. states, ‘el-certs’ in Sweden and Norway, and Guarantees of Origin in other
European countries.
16FOCUS CHAPTER
INVESTMENT IMPLIED BY TARGETS generation (assuming that those organizations do
not decide to abandon their targets). However, the
The estimates above, based on actual commitments implied 826GW of additional non-hydro renewable
by governments and companies, imply a total of power capacity, plus the 488GW of extra hydro dams
826GW of new non-hydro renewable energy capacity in government plans, would be far below estimates
would need to be built between now and 2030.10 of what would be needed for the electricity system
The actual investment involved in building these to contribute its share to achieving global climate
gigawatts would depend on the mix of renewable goals (see Figure 5).
energy technologies chosen (for example, offshore
wind has a much higher average capital cost per As part of the Paris Agreement in 2015 countries
megawatt than solar photovoltaics), on where the agreed to a common goal of limiting the rise in
new capacity is located, and also on how the costs of global temperatures this century to “well below”
those technologies evolve during the 2020s. 2 degrees Celsius, with an aim of keeping the
increase at 1.5 degrees. Even limiting the increase
At 2019 global benchmark capital costs per to 2 degrees would require the gross addition
megawatt, 826GW of new capacity might have an of some 2,836GW of new non-hydro renewable
upfront capital cost of some $900 billion – if the energy capacity by 2030, according to the base-case
technology split was 75:25 between utility-scale scenario in BloombergNEF’s New Energy Outlook
PV and onshore wind. Or $1.1 trillion if it was 2019. The latter’s projection of the technology mix,
70:20:10 between utility-scale PV, onshore wind based on the evolution of relative costs, is for this
and offshore wind.11 to consist of 1,646GW of solar, 1,156GW of wind,
and 34GW of other non-hydro renewables, at an
However, the consensus expectation is for the costs estimated cost of $3.1 trillion over the decade.12
for all three of those technologies to continue
to fall during the 2020s – not necessarily as This section supports the message of the latest UNEP
spectacularly as they did in the decade just ended, Emission Gap Report that there is a big gulf between
but still appreciably, as manufacturing techniques countries’ current ambitions, even those as expressed
improve further and (in offshore wind) even larger in their Nationally Determined Contributions for the
and more powerful machines are introduced. Paris Agreement, and what the science tells us needs
to be done about global emissions by 2030.
Both the amount of new capacity
projected as a result of these
FIGURE 5. CAPACITY ADDITIONS TO 2030 IMPLIED BY TARGETS,
commitments and the amount of VERSUS REQUIRED FOR 2 DEGREES, GW
investment (even at today’s costs)
look modest compared to what
the world achieved in the 2010-
2019 period. During that decade,
as shown in Figures 14 and 19 in
Chapter 1, some 1,213 gigawatts
of renewable power capacity
(excluding large hydro) were
commissioned globally, and nearly
$2.7 trillion invested.
The above estimates for additional
renewables capacity resulting from
public and private sector targets
provide reassurance that the world
Required for 2 degrees is the additional capacity shown in BNEF’s New Energy Outlook 2019
will continue to invest in low-carbon base case. This includes specific assumptions on efficiency, electrification of transport, etc.
Source: UNEP, Frankfurt School-UNEP Centre, BloombergNEF
10
The assumption made here is that none of the 105GW in corporate targets end up counting toward the government-targeted 721GW.
11
Capex estimates per megawatt are from BloombergNEF New Energy Outlook 2019 https://www.bnef.com/core/insights/20917
12
BNEF’s estimate also sees the addition of 167GW of hydro capacity, and 130GW of nuclear, plus large amounts of battery storage to balance the
system. See https://about.bnef.com/blog/solar-wind-batteries-attract-10-trillion-2050-curbing-emissions-long-term-will-require-technologies/
17FOCUS CHAPTER
Electricity is a vital part of the overall energy system, and In the boxes below, we look at two areas that,
for that system’s CO2 emissions, but it is far from the like electricity, are becoming subject to specific
only part. In 2016, it was responsible for 42% of global government targets, and are attracting rising
energy-related emissions, with transport contributing interest among companies and investors. One is
24% and buildings and industry a further 32%. transport, and the other is heat.
TARGETS FOR LOW-EMISSION FIGURE 6. NUMBER OF GOVERNMENTS THAT HAVE
ANNOUNCED PLANS TO PHASE OUT COMBUSTION
TRANSPORT VEHICLE SALES, 2015-2019
In transport, many of the targets
that countries have put in place have
concerned the phase-out of internal
combustion engine (ICE) vehicles, rather
than the share of electric vehicles per
se. For instance, Norway’s government
has a target to end sales of new internal
combustion engine cars within five years,
while Denmark, Iceland, Ireland, Israel,
Netherlands, Slovenia and Sweden have
targets to do the same within 10 years.
See Figure 6 for the rising trend in target
setting around the world.
Source: UNEP, Frankfurt School-UNEP Centre, BloombergNEF
Major economies, meanwhile, have
regulations restricting the pollution from both in models achieving a 35-50% share of new car
passenger and commercial vehicles. The U.S., for sales by that date.
instance, has Corporate Average Fuel Economy, or
CAFE, standards that govern the fuel economy of A third approach is direct incentivizing of electric
cars and light trucks sold there. These pertain to the vehicle sales. China in 2020 has subsidies available
entire fleet of vehicles sold by each manufacturer, for electric vehicles (EVs) with more than 250km
and have had the effect of pushing many of them range, starting at $1,400 and going up to $3,600 for
to introduce electric models to reduce the average those with a range of more than 400km. The same
fuel consumption of their annual sales in the U.S. country also has a target for ‘New Energy Vehicles’
The Trump administration recently announced its – encompassing both electric and fuel-cell models –
new targets for 2021-26. These will require only to account for 25% of total sales of passenger and
limited improvements in fuel economy, effectively commercial vehicles by 2025.
reducing the requirement for automakers to sell
more electric vehicles. States and NGOs will try to Nevertheless, EVs still make up only 2-5% of total
disallow this change, via the courts. passenger car sales in the large markets around the
world, and the rate of growth of their sales globally
In the European Union, there is a target for has been slowing. The coronavirus crisis is likely to
emissions from passenger vehicles requiring make a dent in electric vehicle sales growth in 2020,
average CO2 emissions per kilometer to be and the collapse in oil prices in the early part of
reduced to half of their current levels by 2030. this year may also prompt some consumers to stick
Nearly half of this could be achieved through with gasoline and diesel cars. The penetration of
greater fuel efficiency in combustion-engine electric drivetrains in commercial vehicle fleets has
vehicles, according to BloombergNEF analysis, been even slower so far, but they have made more
but the majority would need to come from plug- progress in buses, particularly in China.
18FOCUS CHAPTER
Faster uptake of EVs is likely to depend on the In 2018, renewable energy (mainly biofuels) made
timing of further reductions in battery costs. up 8% of the fuel used in road transport in the
Lithium-ion battery prices per kilowatt-hour have European Union, up from 5.2% in 2010 and short
already fallen by 85% since 2010, but will have to of a 2020 target of 10%. In 2018, the EU adopted
drop by a further 30-40% to bring upfront and a target for 2030 of 14% renewable energy in
lifetime costs of electric cars into line, or below, transport, including a 3.5% carve-out for ‘advanced
those of combustion-engine equivalents. biofuels’ and biogas. It put a cap of 7% on the use
of first-generation biofuels.13
There continue to be mandates for the use of
biofuel in road transport in economies such as The limited role of biofuels suggests that electric
the U.S., Brazil and the European Union, but vehicles are likely to be the main low-carbon option
those mandates have grown only slowly, at best, between now and 2030, at least for passenger
in recent years and are not expected to become cars, buses and light commercial vehicles. However,
significantly more ambitious in the 2020s. exactly how sustainable EVs are depends hugely
on what is used to generate the electricity they
consume – coal, gas, nuclear, hydro, wind or solar.
https://www.europarl.europa.eu/factsheets/en/sheet/70/renewable-energy
13
19FOCUS CHAPTER
TARGETS FOR RENEWABLE HEAT
Heat is arguably the most difficult nut to crack All these options would have more chance of
when it comes to the decarbonization of the energy economic competitiveness, with the imposition of
system. In electricity, renewable technologies such carbon prices or carbon taxes – or sharp increases
as wind and solar are more and more cost-effective in those that already exist. Forcing CO2 emitters to
against fossil fuel alternatives, and batteries pay for their pollution in this way would leave it
are becoming an increasingly viable option for up to the market to decide which heat technologies
balancing supply and demand over periods of should prevail.
seconds to a few hours. In transport, electric models
are forecast to be cost-competitive with combustion European Union countries have been the most
engine rivals by the mid or late 2020s. active in specifically targeting the use of renewable
heat. The EU as a whole raised the proportion of
Heat – for residential or business buildings – has no one residential, commercial and industrial heating
low-carbon answer. District heating linked to biomass and cooling coming from green sources from
or waste-to-energy plants may be a cost-effective 17% in 2010 to 21.1% in 2018. However, the
option for the residential areas of some Northern trend flattened off noticeably toward the end of
Hemisphere cities, and biogas for others, particularly this period (see Figure 7). In addition, the overall
close to agricultural land. Biomass stoves may be average masked sharp differences between member
economic, particularly if the building is close to sources states, with Sweden as high as 65% in 2018, and the
of waste wood. Heat pumps are another contender, Netherlands down at 6%.14
but they struggle to compete without subsidy against
gas-fired heating where natural gas prices are low, The EU has set an indicative (non-binding) target
and their low-carbon credentials depend in any case to increase the share of renewable heat by 1.3
on the mix in the local electricity grid. percentage points per year from 2021 onwards.
FIGURE 7. SHARE OF RENEWABLE ENERGY FOR HEATING AND COOLING IN THE EU 27, 2004-2018, %
Source: Eurostat
https://ec.europa.eu/eurostat/statistics-explained/index.php/Renewable_energy_statistics#Share_of_renewable_energy_almost_doubled_
14
between_2004_and_2018
20FOCUS CHAPTER
That could be done entirely from increasing the The amount of investment required could be
use of biomass, waste and biogas in industrial reduced if the EU continued to require less
processes and in district heating and home heat year-on-year. Between 2010 and 2018, the
heating. Since the EU27 used some 467 million fuel consumed for heating and cooling in the
tonnes of oil equivalent for heating and cooling in EU27 fell by 9% in tonnes of oil equivalent. This
2018,15 that could mean increasing the renewable reflected greater energy efficiency, and perhaps
element by 6 million tonnes of oil equivalent also the shift of some heavy industrial processes
each year. The cost would depend on the type of overseas. If this total continued to fall in the
technology used to produce the renewable heat, 2020s, then increasing the share of renewables by
and whether most of the new capacity was utility- 1.3 percentage points per year could be achieved
scale plants or small-scale systems and stoves. without building so much new capacity.
https://ec.europa.eu/eurostat/web/energy/data/shares
15
21CHAPTER 1
RENEWABLE CAPACITY GROWTH
IN 2019
n The world invested $282.2 billion in new renewable energy capacity (excluding large hydro) in
2019. This was a mere 1% higher than the total for the previous year, and it was 10% below the
record figure of $315.1 billion set in 2017.
n However, the amount of new renewable power added in 2019 was the highest ever, at 184
gigawatts, a full 20GW more than in 2018. Steep falls in capital costs have meant that more
capacity in wind and solar can now be added than ever before, for the same number of dollars.
n Investment trends in renewables in 2019 varied sharply between sectors and regions. Wind
attracted a record $138.2 billion, up 6%, helped by a boom in offshore project financings. Solar
saw a 3% fall to $131.1 billion, while biomass and waste grew 9% to $9.7 billion.
n China suffered an 8% fall in investment to $83.4 billion, its lowest since 2013, on a continuing
government cutback in support for solar. However, financings in the U.S. leapt 28% to
$55.5 billion, as developers rushed to qualify for tax credits before they expire.
n Renewables excluding large hydro dams accounted for a record 77.6% of the net new capacity
added in all generation technologies in 2019. They produced 13.4% of global electricity, up from
12.4% in 2018.
n Over the 2010-2019 decade as a whole, nearly $2.7 trillion went into building out new
renewables capacity around the world, with $1.4 trillion of this going into solar and $1.1 trillion
into wind.
2019 saw a continuation of several of the trends It is likely that 2020, with the coronavirus health
in renewable energy investment that had been crisis and resulting economic recession, will mark
underway in the second half of the decade at least a temporary break in some of those trends.
just ended. The overall level of investment, at However, green energy costs look likely to continue
$282.2 billion, up 1% on 2018, was only $10 billion to fall, and governments and private sector entities
or so below the five-year average – despite another will still face the climate change emergency when
trend (the continuing fall in costs for wind, and economies start to unfreeze.
particularly, solar power).
DOLLARS DEPLOYED
Also consistent with earlier years were the growth
of offshore wind, and the spread of large project Figure 8 shows that the world invested
financings to new markets (in 2019, the United $282.2 billion in renewable energy capacity in 2019,
Arab Emirates and Taiwan saw particularly large some $2 billion more than in the previous year. The
deals). A final trend was the dominant share of total for last year was made up of $230.1 billion
renewables in the net new capacity added to the of financings for utility-scale renewable energy
world power generation mix. projects of more than 1MW, down 5% on the 2018
22CHAPTER 1
total; and $52.1 billion of spending FIGURE 8. GLOBAL RENEWABLE ENERGY CAPACITY INVESTMENT, 2004
on small-scale solar systems of less TO 2019, $BN
than 1MW – up 37%. The trends in
these two types of investment are
discussed in Chapter 2.
Global investment in renewables
capacity has been relatively consistent
since 2014, fluctuating in a $50 billion
range between $265 billion and
$315 billion. But beneath the headline
figures, much has been changing on
the unit costs of new additions, on
the geographical split of investment,
and on the mix between different
technologies.
Looking at the sector dimension
first, Figure 9 highlights again how
wind and solar tower over the other
Total values include estimates for undisclosed deals
renewable energy technologies in Source: UNEP, Frankfurt School-UNEP Centre, BloombergNEF
terms of investment. Last year, wind
attracted a record $138.2 billion,
up 6% on 2018, while solar got
FIGURE 9. GLOBAL INVESTMENT IN RENEWABLE ENERGY CAPACITY BY
$131.1 billion, down 3% and its lowest SECTOR IN 2019, AND GROWTH ON 2018, $BN
since 2013.
The reasons for these changes are
explored in detail in later chapters,
but two of the key ones were the
further rise in activity in offshore
wind, both off the coasts of Europe
and in the sea off mainland China
and Taiwan; and the downward
trend in costs per megawatt for
solar photovoltaics.
Biomass and waste-to-energy
maintains a consistent third
place among renewable energy
sectors, with investment in 2019
up 9% at $9.7 billion. There were
strong pockets of activity last year,
Total values include estimates for undisclosed deals.
notably in waste incineration Source: UNEP, Frankfurt School-UNEP Centre, BloombergNEF
plants in the U.K. and China.
The remaining sectors all languished in terms of project financings. Biofuels took $500 million
dollars committed in 2019. Small hydro-electric in new investment, down 43% and the lowest
projects of less than 50MW saw investment slip for three years, while marine (tidal and wave)
3% to $1.7 billion, while geothermal had a 56% energy saw no significant new financings at all.
decline to $1 billion on a paucity of large new
23You can also read