Government of Tonga Energy Efficiency Master Plan - Climate ...
←
→
Page content transcription
If your browser does not render page correctly, please read the page content below
The United Nation’s Climate Technology Centre and Network

      Government
       of Tonga
        Energy
       Efficiency
      Master Plan
                                                                                 August 2018

   CTCN is managed by the United Nations

   Printed with a renewable-source ink on paper containing at least 50% wastepaper, including 10% post-consumer waste.

   Publication Date: August 2018
Draft – Pre-decisional

EXECUTIVE SUMMARY
At the request of the Tonga government, the Climate Technology Centre and Network has worked closely with the
Tongan Energy Department to develop a Tonga Energy Efficiency Master Plan (TEEMP) for adjustment and
adoption by the relevant Tongan entities. The plan is based on study of existing frameworks, plans, programs, and
projects; extensive stakeholder consultations; and data development and analysis. The TEEMP encompasses
electricity use and ground transportation. The TEEMP complements the approach of the 2009 Tonga Energy Road
Map 2010–2020 (TERM). The TERM focuses on reducing Tonga’s fossil fuel dependence through increased energy
efficiency and improved supply chains in an effort to mitigate the price volatility of imported products as well as
reduce greenhouse gas (GHG) emissions and improve national energy security.

A baseline assessment of Tonga’s GHG emissions was built from Tonga’s nationally determined contribution
(NDC), which identifies the key emitting sectors as transport (40%), electricity generation (23%), agriculture (21%),
waste (11%), and other energy (5%). The TEEMP addressed 55% of these total GHGs: electricity generation (23%)
and ground transportation (32%). A Sankey analysis determined energy source flows by fuel type for building
electricity consumption and transportation. Roughly half of all diesel consumption goes towards transportation and
the other half is consumed by electricity generation for building electrical use (primarly space cooling, lighting, and
appliances in the residential and commercial sectors). The remainder of transportation fuel is petrol.

As of 2017, the total installed electricity generating capacity on Tonga’s largest island, Tongatapu, was 17.8
megawatts (MW), with 14 MW of conventional capacity from diesel generators, 2.3 MW from solar photovoltaics,
0.5 MW from wind, and a 1 MW battery storage system. This installed capacity is an increase from 2012, when
Tongatapu had 12.6 MW of conventional capacity and 1.3 MW of renewables. The growth in capacity is attributable
to government leadership to deploy more renewable energy (RE) generation, and increased electrical load, primarily
driven by increased ownership of electrical appliances. Tonga Power Limited (TPL), the vertically integrated utility,
owns and operates most of Tonga’s in-front-of-meter electricity generation, as well as its transmission and
distribution assets. Electricity rates have important implications for incentivizing or disincentiving energy efficiency
investments. Despite differences in generation cost, the TPL tariff rates are standardized across the four main island;
as of February 2018, the tariff was set at 0.8514 Tongan Pa’anga (aka TOP) per kilowatt-hour (kWh). There is also a
subsidized “lifeline tariff” of 0.7 TOP for the first 100 kWh of monthly consumption, applicable to all customers.
Given that most of Tonga’s electricity is generated from diesel, the price of electricity is sensitive to fluctuations in
fuel costs.

Tonga’s estimated energy intensity is 216.8 gigajoules (GJ) of imported fuel per U.S. dollar of gross domestic
product per capita, rising under the business-as-usual (BAU) scenario to 259.8 GJ by 2030. In 2017, the residential
sector accounted for 44% of electricity consumption, with commercial, religious, government, and public service
accounts making up the remaining 56%. The TERM indicates an expected growth in energy consumption of 28% by
2020 compared with 2010 levels. An estimated baseline for transportation is more than 16,000 vehicles in Tonga for
residential, commercial, and government use in 2016. Most vehicles were either cars (6,031) or light
trucks/vans/sport utility vehicles (7,103). Heavy duty vehicles, taxis and rentals, motorcycles, and buses accounted
for the remaining 3,690 vehicles. Current average vehicle kilometers traveled per person was estimated to be 2,289
in 2016 and is projected to grow to 5,103 by 2050, tracking with anticipated gross domestic product increases. These
vehicles used more than 25 million liters of gasoline and diesel in 2015, which was projected to grow to 38.5 million
liters in 2030 resulting in the emission of 118,000 metric tons of carbon dioxide equivalent.

Key policy options identified for transportation include vehicle import tariffs or registration fees aimed at improving
fuel economy, restrictions in heavy-duty vehicle idle time, introduction of a 10% biodiesel blend, deployment of
electric vehicles, and policies that reduce vehicle kilometers traveled by supporting pedestrians, bikers, carpoolers,
and bus riders. These reductions in energy use in the transportation sector would result in an estimated 28%
reduction in GHGs below BAU levels by 2030, which is an increase of 1% over the 2018 baseline.

In the building sector, Tonga’s electricity consumption is driven by building design, appliance use, and energy
consumption behaviors. Given Tonga’s tropical climate, cooling commercial, government, and nongovernmental
buildings with air conditioning is widespread and increasing. There may be opportunities to reinstitute design
practices from historical buildings, such as passive ventilation and large overhangs to provide shading. Leading

                                                            ii

                                        Climate Technology Centre and Network
                                   Government of Tonga: Energy Efficiency Master Plan
Draft – Pre-decisional

energy use reduction options in the buildings sector center around increased deployment of RE, reductions for
implementation of minimum energy performance standards, improvements to space cooling, increased appliance
efficiency, and reductions in energy used for lighting (in building and streetlighting applications).

Taken together, reductions in energy use in both transport and buildings would offer a reduction of 106,000 metric
tonnes of carbon dioxide equivalent per year by 2030, which is a 50.5% reduction from BAU emissions of 210,000
metric tonnes of carbon dioxide equivalent. As shown in Figure E1, transportation accounts for a 30.4% of the
reduction, renewable electricity for 40% of the reduction, and energy efficiency in buildings and lighting for 29.6%
of the reduction. If Tonga reaches 70% RE by 2030, it is assumed there will only be a slight increase in petroleum
energy intensity by 2030. But if RE penetrations are greater than 50%, this energy intensity could be reduced,
thereby also supporting Tonga’s energy independence and security.

                                      Simplified Tonga GHG Emissions with Policy Options and RE

                               250
 Thousand Metric Tonnes CO2e

                               200

                               150

                               100

                                50

                                 0
                                 17

                                        18

                                               19

                                                      20

                                                             21

                                                                     22

                                                                            23

                                                                                     24

                                                                                            25

                                                                                                   26

                                                                                                            27

                                                                                                                   28

                                                                                                                          29

                                                                                                                                 30
                               20

                                      20

                                             20

                                                    20

                                                           20

                                                                   20

                                                                          20

                                                                                   20

                                                                                          20

                                                                                                 20

                                                                                                          20

                                                                                                                 20

                                                                                                                        20

                                                                                                                               20
                               Unabated Emissions    RE Generation        EE Policy Options       Transportation Policy Options

                                              Figure E1. Wedge analysis of Tonga’s greenhouse gas emissions

Tables E1 and E2 provide further assessments of the top ten policy options for transport and electricity in buildings
and streetlighting that could support the GHG reductions identified in the wedge analysis (additional policy options
and measures are identified in this report). The options are ranked by the magnitude of GHG reductions, up-front
cost, time to implement, ancillary benefits, and support available in terms of financing and political will. Green
indicates positive attributes, yellow neutral, and red negative attributes.

                                                                             iii

                                                           Climate Technology Centre and Network
                                                     Government of Tonga: Energy Efficiency Master Plan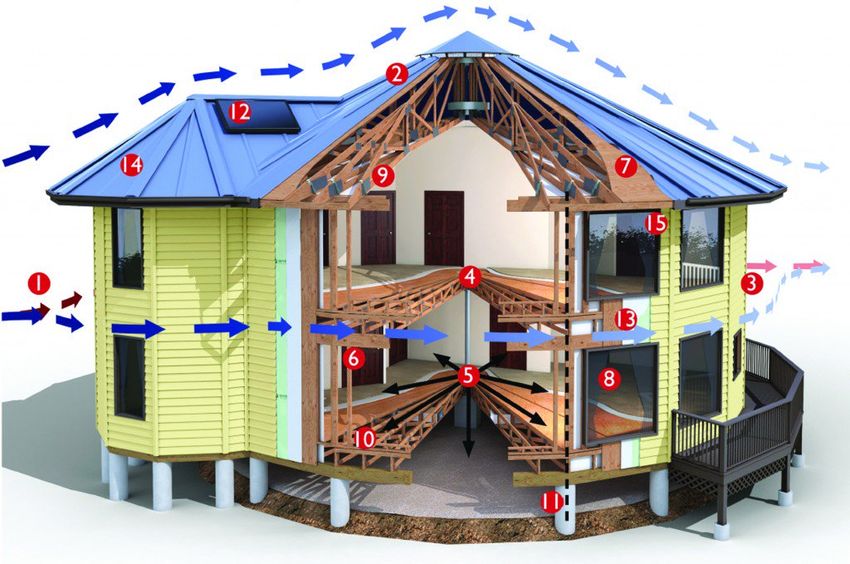
Draft – Pre-decisional

               Table E1. Top 10 Policies and Projects to Reduce Greenhouse Gas Emissions from Transportation

                                                                                                           GHG         Upfront      Time to      Ancillary      Support
       Wedge                                      Policy Options / Projects
                                                                                                         Reduction      Cost       Implement     Benefits       Availible
   VKT Reduction       Use a platform such as NextBus to track and coordinate busses                       High         Low          Low           High           High
   VKT Reduction       Enact a safe bicycle passing law                                                    High         Low          Low           Med            High
                       Send a mechanic to HEV/EV maintenance training in Japan or New
    EV and HEV                                                                                              High          Low           Low        Med            High
                       Zealand
                       Provide pedestrians (particularly school children) and cyclists with safety
   VKT Reduction                                                                                            Med           Low           Low        High           High
                       reflectors and lights
                       Install rumble strips and painted lines demarcating lane boundaries parallel to
   VKT Reduction                                                                                            High          Low           Low        Med            Med
                       sidewalks to increase pedestrian safety
   Idle Reduction      Limit idle time with the help of fleet partners and idle reduction technologies      Med           Low           Low        High           Med
                       Adjust vehicle registration tax and import tariff according to vehicle weight,
  Vehicle Efficiency                                                                                        High          Low           Low        Med            Low
                       displacement, or fuel economy
     Biodiesel         Blend diesel fuel with waste grease and coconut oil biodiesel at 10% blend           High          Low           Med        Low            High
   VKT Reduction       Begin a water taxi in the laguna (and some associated dredging)                      High          Med           Med        High           Med
                       Build a strategic parking lot and bus stop at intersection of Taufa’ahau Rd.
   VKT Reduction                                                                                            High          High          Med        High           High
                       and Loto Rd. and accompaly with Nuku'alofa parking policy

               Table E2. Top Eleven Policies and Projects to Reduce Greenhouse Gas Emissions from Electricity

                                                                                                   GHG
                               Policy Options / Projects                                         Reduction        Upfront     Time to         Ancillary      Support
                                                                                                                   Cost      Implement        Benefits       Available
   Implement building standards for resilience and energy efficiency (e.g.
                                                                                                     High          Low           Med            High           High
   passive ventilation and daylighting with appropriate external shading)
   Perform energy audits of buildings to create baselines and implement                              High          Low           Med            High           Med
   energy conservation measures
   MEPs for equipment and appliances                                                                 High          Low           Med            Med            High
   Set packaging and recycling standards to limit the amount of waste                                High          Low           Med            High           Med
   imported to Tonga
   Implement a public awareness campaign on energy efficiency and
                                                                                                     High          Low           Med            Med            Med
   conservation
   Establish a demand-side management revolving loan or rebate program
   to aid in financing more efficient equipment (residential, commercial and                         High          Med           Med            High           Med
   industrial)
   Prioritize on-site RE with islanding controls and energy storage within                           High          High          Med            High           High
   critical infrastructure
   Implement distributed energy generation projects that incorporate RE and
   fossil fuels to enhance resilience and reduce emissions associated with                           High          High          Med            High           Med
   diesel generation, particularly when electrifying new areas or islands
   Work with TPL to create an integrated resource plan to incorporate RE,
                                                                                                     High          Med           High           Med            High
   EE, and more efficient reciprocating engines that can be dual fuel
   Data collection exercise/database to manage energy data by sector                                 Med           Med           Low            High           Med

Given Tonga’s vulnerability to climate change and tropical storms, it is important to consider how improvements in
the electric and transport sectors can also support increased resilience in terms of enhancing the ability of energy and
transportation infrastructure to withstand and recover more quickly from natural and manmade disasters. The
primary ways in which Tonga can strengthen its resilience are by:

     1.     Incorporating resilience into building codes to enable buildings and structures to better withstand storms
            while also supporting energy-efficient, passive design
     2.     Continuing to harden transmission and distribution lines and power generation by burying strategic lines
            and installing minigrids and on-site RE, among other measures
     3.     Diversifying the fuel mix from diesel to biodiesel and exploring fuel procurement from sources other than
            Singapore
     4.     Improving vehicle efficiency, which enables more transport options if fuel supplies are diminished
     5.     Reducing dependence on roads, which may become damaged in a disaster, by enabling additional modes of
            transport such as water taxis, and shortcutting large sections of road with a bridge
     6.     Optimizing use of appropriate vehicles—such as buses with raised clearance—and using the bus system
            effectively to support evacuations.

                                                                                      iv

                                                         Climate Technology Centre and Network
                                                  Government of Tonga: Energy Efficiency Master Plan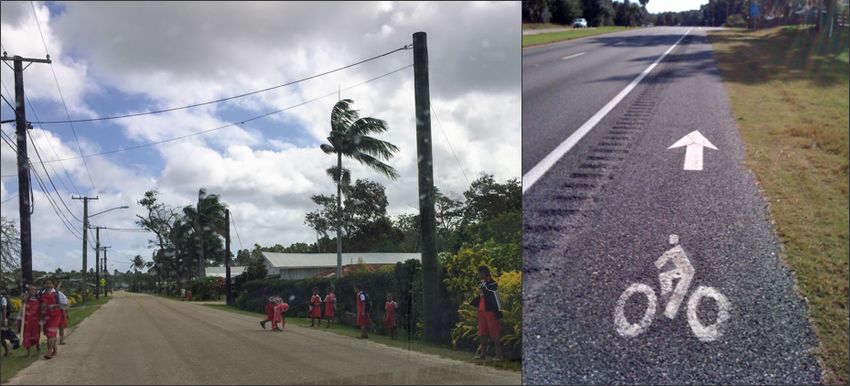
Draft – Pre-decisional

TABLE OF CONTENTS
Acronyms ................................................................................................................................................
1 Context .............................................................................................................................................1
              Background and Focus of Effort ....................................................................................1
              About Tonga..................................................................................................................3
2    Baseline............................................................................................................................................3
              Electricity Baseline ........................................................................................................5
              2.1.1       Generation, Transmission and Distribution ....................................................................6
              2.1.2       Consumption ................................................................................................................9
              Baseline Transportation...............................................................................................18
          2.2.1 Land Transportation Fuel Usage ................................................................................. 18
          2.2.2 Vehicle Kilometers Travelled....................................................................................... 18
          2.2.3 Vehicles...................................................................................................................... 21
          2.2.4 Other Baseline Data of Interest ................................................................................... 22
3    Business-as-Usual Projections ..................................................................................................... 23
              Tonga Transportation Fuel Business-as-Usual Projection ...........................................23
              Tonga Electricity Business-as-Usual Projection ...........................................................25
4    Proposed Reduction Targets ........................................................................................................ 27
              Transportation Wedge Analysis ...................................................................................28
              Electricity Wedge Analysis ..........................................................................................29
              Combined Wedge Analysis .........................................................................................31
              Energy Flow Diagrams of 2017 Baseline and 2030 Goal .............................................31
              Energy Intensity with TEEMP Policy Changes.............................................................32
5    Projects and Policies to Reduce GHG Emissions ........................................................................ 33
              Transportation Policies and Projects ...........................................................................34
              Electricity Energy Efficiency Policies and Projects .......................................................39
              Resilience Considerations ...........................................................................................41
6 Conclusion ..................................................................................................................................... 43
Appendix A. Supporting Documentation ............................................................................................ 44
Appendix Figure 1: Yearly A1 Jet Fuel Consumed in Tonga .................... Error! Bookmark not defined.
Appendix Figure 2: Tonga CO2E Emissions Reductions with Sectoral Breakdown ... Error! Bookmark
   not defined.
Endnotes .............................................................................................................................................. 46

                                                                            v

                                                   Climate Technology Centre and Network
                                             Government of Tonga: Energy Efficiency Master Plan
Draft – Pre-decisional

Acronyms
BAU                business as usual
CO2e               carbon dioxide equivalent
CTCN               [United Nation’s] Climate Technology Centre and Network
EE                 energy efficiency
EV                 electric vehicle
GDP                gross domestic product
GHG                greenhouse gas
GJ                 gigajoule
HDV                heavy-duty vehicle
HEV                hybrid electric vehicle
IRP                integrated resource plan
JICA               Japanese International Cooperation Agency
kWh                kilowatt-hour
LED                light emitting diode
LDV                light-duty vehicle
MCCTIL             Ministry of Commerce, Consumer, Trade, Innovation, and Labour
MEIDECC            Ministry of Meteorology, Energy, Information, Disaster Management, Environment, Climate
                   Change, and Communications
MEPS               minimum energy performance standards
MET                Ministry of Education and Training
MOI                Ministry of Infrastructure
MWh                megawatt-hour
NDC                nationally determined contribution
PCREEE             Pacific Centre for Renewable Energy and Energy Efficiency
PRDR               Pacific Regional Data Repository
PV                 solar photovoltaic
RE                 renewable energy
TEEMP              Tonga Energy Efficiency Master Plan
T&D                transmission and distribution
TERM               Tonga Energy Road Map
TPL                Tonga Power Limited

UN ESCAP           United Nation’s Economic and Social Commission for Asia and the Pacific
VKT                vehicle kilometers traveled

                                          Climate Technology Centre and Network
                                      Government of Tonga: Energy Efficiency Master Plan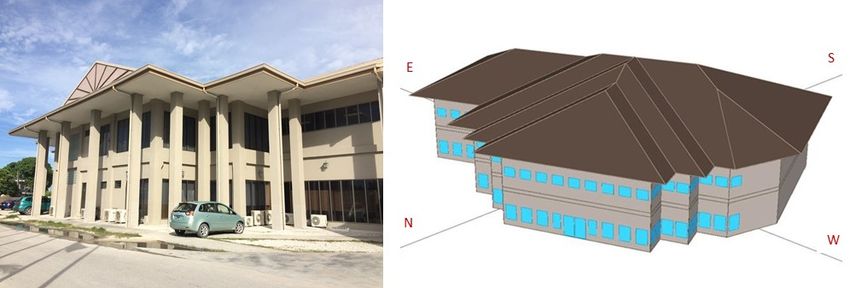
1 Context
Tonga is dependent on imported petroleum to meet its energy needs for electricity and transportation. Electricity
generation consumes nearly 13 million liters of fuel per year, at a cost equivalent to about 10% of total gross
domestic product (GDP) and transportation consumes 25 million liters at a cost close to 20% of GDP.1 Dependence
on imported fuels places Tonga in a vulnerable position due to volatile fuel prices, which have a downstream effect
on electricity, transportation, and cost-of-living expenses. This study provides background information for setting an
energy and emissions baseline and establishing a business-as-usual (BAU) projection. The data collection methods
and sources highlighted in this report will also help Tonga track energy use and emissions in the future. The BAU
scenario was then taken as a starting point to assess the options, magnitude, and feasibility of reducing Tongan
greenhouse gas (GHG) emissions. The Tongan Energy Department requested technical assistance from the United
Nation’s Climate Technology Centre and Network (CTCN). Under the CTCN, support was provided for technical
assistance and capacity building surrounding the development and implementation of a Tonga Master Energy
Efficiency Action Plan (TEEMP). A training was held in Nuku’alofa in June 2018 with the dual purpose of capacity
building and in-depth review of the TEEMP by Tongan officials. This document hereby represents the flagship
deliverable of this effort and reflects extensive research conducted in 2017 and 2018 via in-person stakeholder
consultations, policy and regulatory analysis, and modeling.

        Background and Focus of Effort
In 2009 Tonga developed the Tonga Energy Road Map 2010–2020: Ten Year Road Map to Reduce Tonga’s
Vulnerability to Oil Price Shocks and Achieve an Increase in Quality Access to Modern Energy Services in an
Environmentally Sustainable Manner, known as the TERM.2 The goal of the TERM was to create an approach to
reduce Tonga’s dependence on fossil fuels through cost-effective and sustainable efforts. The process of developing
the TERM was a joint effort among the Government of Tonga, the electricity generator and distributor Tonga Power
Limited (TPL), and other development partners. The TERM focuses on electric energy efficiency (EE), improving
supply chains to mitigate the effect of price fluctuations in imported products, reducing GHG emissions, and
improving national energy security. The TERM establishes a goal of approving a policy to supply 50% of electricity
generation through renewable resources by 2020. The TERM includes improvements in the petroleum supply chain
to reduce the price and price fluctuation of imported petroleum products, increase the efficiency of converting
petroleum to electricity (i.e., through increases in efficiency and reductions in losses at TPL), and improve the
efficiency of converting electricity into consumer electrical services (demand-side management measures). It also
includes replacing a portion of current or future grid-based generation with renewable energy (RE).3 Transportation
is not a focus of the TERM.

Policies and initiatives that have been implemented since the creation of the TERM include:

    •    The National Strategic Planning Framework (2009)
    •    The Electricity Act (2007)4
             o Established an energy commission appointed by the monarch in council, which has broad
                  regulatory authority. The Act sets standards for generation, supply, and distribution concession
                  contracts submitted to the commission.
    •    The Renewable Energy Bill (2008)5
             o Established a renewable energy authority, consisting of members appointed by the monarch in
                  council and tasked with developing renewable standards, conducting research, relaying
                  international obligations to the monarch, and enforcing violations of RE policy against offenders.
    •    Joint National Action Plan on Climate Change Adaption and Disaster Risk Management (2010)6
             o Assesses geographic risk posed by natural disasters such as cyclones and tsunamis. Provides
                  framework and financing structure to integrate disaster and risk planning into budgeting at all
                  levels.
    •    Ozone Layer Protection Act (2010), amended (2014)7
             o Bans the importation of products (refrigerators, freezers, dehumidifiers, air conditioners, heat
                  pump units, vehicle air conditioners, ice machines, water coolers, aerosol products, fire
                  extinguishers, insulation boards, and pre-polymers) that contain hydrochlorofluorocarbons (which
                  are ozone-depleting substances and also potent GHGs).
    •    Tonga Village Network Upgrade Project (2012)8
             o Reduced line losses from 18% to 12% in 20 villages, working to expand to more.

                                                          1

                                       Climate Technology Centre and Network
                                  Government of Tonga: Energy Efficiency Master Plan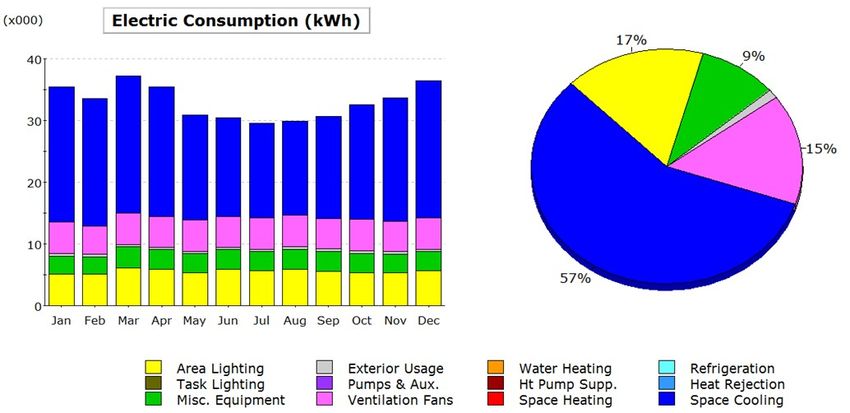
•   Promoting Energy Efficiency in the Pacific (2014)9
        o Funded by Asian Development Bank, Australia, and Japan
        o Residential light replacements saving 383,999 kilowatt-hours (kWh)/year
        o Public Service Building light replacements saving 158,706 kWh/year
        o Streetlight upgrades saving 97,219 kWh/year.
•   Tonga’s Intended Nationally Determined Contribution
        o Formalizes 50% renewable electricity goal by 2020, 70% by 2030
        o Reduce line losses to 9% by 2020
        o Formally deposited, rendering it a nationally determined contribution (NDC).
•   Tonga Strategic Development Framework II (2015–2025)10
        o Revisits the original TERM goal of 50% renewable from 2012 to 2025; 2020 for rural
             communities (this contradicts the NDC released the same year)
        o Sets a goal of no more than 12% transmission and distribution (T&D) losses by 2020
        o Sets a short-term goal of converting 75% of the diesel-based water pumping systems in Tongatapu
             to solar photovoltaics (PV)
        o Establishes a goal of 80% of retail stores selling reliable compact fluorescent lightbulbs at the
             “same cost” as incandescents
        o Banning import of inefficient electrical appliances
        o Banning all inefficient electrical appliance at border control.
•   Outer Island Renewable Energy Project (2017)11
        o The first phase of the Tonga Renewable Energy Plan
        o Project to rebuild ‘Eua’s grid announced in 2012
        o Invitation for international bids announced in February 2017.
•   Tonga Renewable Energy Plan (2017)12
        o A project supported by the Green Climate Fund to finance projects intended to contribute towards
             Tonga’s 50% renewable by 2020 plan. Total project cost is estimated at $84.47 million, with
             $64.37 million requested from the Green Climate Fund, $9 million from the government of Tonga,
             and $6.10 million from TPL.
        o Phase 3 of a broader plan, including the Outer Island Renewable Energy Project (Phase 1), and
             power purchase agreement procurement of solar and wind resources (Phase 2).
        o Includes the installation of a new biomass plant on Tongatapu along with battery storage, PV, and
             wind.

                                                    2

                                Climate Technology Centre and Network
                            Government of Tonga: Energy Efficiency Master Plan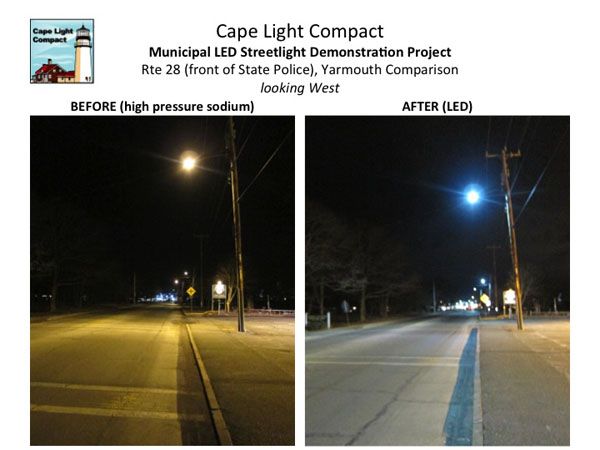
About Tonga
Tonga’s geographic location, demographics, and
governance structure have important implications for the
energy sector. Tonga is in the Pacific Ocean, as shown in
Source: University of Texas

Figure 1,13 and comprises 170 islands, 36 of which are
populated.

Tonga is prone to both earthquakes and tropical cyclones.
Notable instances include a 2009 magnitude 8.1 earthquake
and subsequent tsunami, as well as 2014’s Cyclone Ian,
which struck Ha’apai directly, damaging or destroying 90%
of T&D lines.14 In 2018, Cyclone Gita brought the
strongest winds Tonga had seen in 60 years, damaging
40%–50% of Tongatapu’s electric grid.15 In the average El
Nino year, 1.88 cyclones affect Tonga, 1.63 in La Nina
years, and 1.67 during neutral years.16 Tonga’s government
vocally attributes the increasing severity of tropical
cyclones to climate change; in response, policy documents
focus on planning for resiliency.

Due to its small economy and lack of a significant local
manufacturing base, Tonga imports almost all its goods,
including fuel for energy generation and transportation,
vehicles, appliances, and electronics. The TERM                                        Source: University of Texas
recognizes the vulnerability that results from this                                    Figure 1. Map of Tonga
                                                                                                    s
dependence and outlines some goals to address the
challenges created by relying on imported goods and fuels.

The monarch remains a significant power broker in Tonga—policy changes, related to energy or not, are subject to
the consideration of both the king and the prime minister.17 Both the king and the prime minister are supportive of
reducing Tonga’s climate vulnerability and improving the nation’s energy independence. In a move symbolic of
“wider leadership,” the monarch of Tonga joined the Solar Head of State program at the Conference of the Parties
23 in November 2017. The program will install a rooftop PV system on the king’s residence, the first royal palace in
the world to do so.18

The legislature established a National Statistics Department in 2015 tasked with conducting a census and compiling
administrative records of government departments.19 Although the availability of information from government
ministries has markedly improved since the passing of this act, a lack of consistency in statistics reported year-to-
year and a difficulty in obtaining this information persists. These problems are also apparent for state-owned
enterprises such as TPL. Data availability has important implications for analyzing and tracking changes and
opportunities in the energy sector, and, thus, for the design of the TEEMP. Specific recommendations broached later
on include engaging TPL in developing an integrated resource plan (IRP), collecting sectoral data, surveying energy
usage habits in future censuses, and standardizing data collection of customs and annual ministerial reporting.
Regional organizations such as the Pacific Centre for Renewable Energy and Energy Efficiency (PCREEE), the
United Nation’s Economic and Social Commission for Asia and the Pacific (UN ESCAP), and the Pacific Regional
Data Repository (PRDR) already exist to aggregate applicable data sets, and working with such organizations would
open opportunities for regional knowledge sharing and project financing. UN ESCAP regularly hosts expert
consultations with statisticians to assist in capacity building for collecting and housing data.20

   2 Baseline
As reported in Tonga’s NDC and based on Tonga’s GHG emissions breakdown in the inventory conducted in 2006,
Tonga’s major emissions arise from transport (40%), electricity generation (23%), agriculture (21%), waste (11%)
and other energy (5%). A baseline study was conducted as part of the TEEMP process to determine where savings
                                                            3

                                       Climate Technology Centre and Network
                                  Government of Tonga: Energy Efficiency Master Plan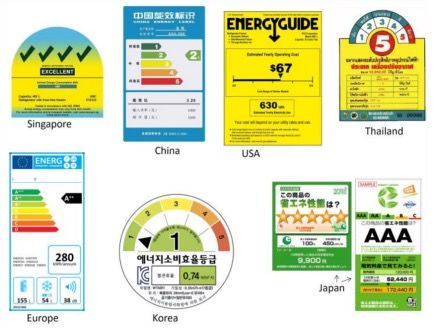
could be achieved within each of the sectors to assist Tonga in achieving goals established in various legislation and
policies. Using available data, the breakdown of Tonga’s emissions was estimated, as shown in Data Sources: Tonga
NDC and MCCTIL

Figure 2. It is important to note that only 55% of the emissions in Tonga’s overall portfolio are being addressed
through the TEEMP: electricity generation (23%) and ground transportation (32%). The remaining emissions from
agriculture, waste, air and sea transport, and others are not covered by TEEMP.

                                           Data Sources: Tonga NDC and MCCTIL
  Figure 2. Tonga’s nationally determined contribution reported emissions and Tonga Energy Efficiency Master Plan-
                                           related greenhouse gas emissions
Tonga’s NDC states that transportation is responsible for 40% of emissions, and electricity generation is responsible
for 23% of Tonga’s overall emissions; however, the NDC uses GHG data from a 2006 inventory. Since the time that
the NDC was submitted, TPL’s billed customer consumption has risen by approximately 47%, most likely as a result
of an increase in electrification efforts, so the proportion of Tonga’s emissions from electricity are assumed to be
higher than stated in the NDC. It is assumed that emissions from non-TPL generators are negligible.

It is unlikely that emissions from the transportation sector have risen at a similar pace, so the proportion of Tonga’s
emissions from electricity are assumed to be higher than stated in the NDC. The transportation segment of the NDC
includes air and marine, but the TEEMP only addresses ground transportation, such as light- and heavy-duty
vehicles. The TEEMP estimates that ground transportation accounts for 80% of Tonga’s total transportation-related
emissions as calculated in the NDC.

Using the available data from MCCTIL, a Sankey diagram was created to demonstrate the energy flows, by fuel
type, for electricity consumption and transportation fuel consumption for Tonga, as shown in Data Source: MCCTIL

Figure 3. These energy flows are influenced by the climate and infrastructure of the islands.

                                                           4

                                        Climate Technology Centre and Network
                                   Government of Tonga: Energy Efficiency Master Plan
Data Source: MCCTIL
Figure 3. Tonga’s current energy flows by fuel type in the electricity and ground transportation sectors
Electricity Baseline
Census figures indicate the 2016 population in Tonga was 100,651.21 A 2010 survey indicated that 80% of the rural
population and 100% of the urban population have access to electricity; in aggregate, the study reported that 92% of
the population had access to electricity.22 The 2016 census indicates that 16,662 households get power from the
public power supply, 767 from self-owned solar, and 44 from their own generators. TPL saw a 9% growth in new
customer accounts between 2016 and 2017.23 In total, the residential sector accounted for 44% of electricity
consumption in 2017. TPL does not break down sectors further, but the remaining 55% of consumption is spread
across commercial, religious, government, and public service accounts. There are two peak demands during
weekdays—one in the morning and another in the late afternoon. Typically, this type of peak load profile indicates
commercial customers are using energy (computers, lighting, air conditioning) when they arrive during the morning
hours, and a second peak when energy needs shift to the residential sector as lighting and appliances are used in
homes in the evening.
Based on TPL’s 2017 Annual Report, the TEEMP model assumes that the weighted average efficiency of TPL’s
diesel generators is 4.15 kWh per liter of diesel fuel. The model allows for generator efficiency to be updated if
overhauls or refurbishments are performed in the future. The interaction between RE technologies and diesel
generators can also affect the efficiency of generators if they are required to cycle on and off frequently. The
installation of battery storage systems as planned can help alleviate this. For both the electricity and transportation
analysis, data from the greenhouse gases, regulated emissions, and energy use in transportation (aka GREET) model
emissions database24 were used to estimate emissions of diesel fuel at 3.29 kilograms of CO2e/liter.25 This number is
a life cycle emissions calculation for the United States, so it includes emissions associated with the extraction and
transportation of fuels within and to the United States; emissions associated with transportation of fuel to Tonga are
most likely higher. The TEEMP model also accounts for reductions in line losses; Tonga’s NDC sets the target of
9% by 2020 (the Tongan Energy Department estimates they are around 10% as of 2018). In the model, line losses
are applied evenly to all generation sources (diesel and renewables). In reality, renewable installations are likely to
be located closer to loads and therefore will have lower line losses than diesel.
In 2009, Tonga’s energy intensity was reported as shown in Figure 4.26 Through data collected for the TEEMP,
Figure 5 shows the 2018 energy intensity per capita, indicating efficiency improvements. This analysis identified an
energy intensity of 216.8 gigajoules (GJ) of imported fuel per U.S. dollar of GDP per capita, rising under the BAU
scenario to 259.8 GJ by 2030.
5
Climate Technology Centre and Network
Government of Tonga: Energy Efficiency Master PlanFigure 4. Tonga’s energy intensity per capita, 2009
280
260
GJ / $1 GDP per Capita
240
220
200
180
160
140
120
100
17
18
19
20
21
22
23
24
25
26
27
28
29
30
20
20
20
20
20
20
20
20
20
20
20
20
20
20
BAU
Figure 5 Tonga’s energy intensity per capita, 2017-2030 (business as usual)
2.1.1 Generation, Transmission, and Distribution
TPL is a vertically integrated utility responsible for generation, transmission, and distribution of electricity, and
operates four grid systems in Tonga. The largest grid is on the island of Tongatapu, followed in size by the islands of
Vava’u, Ha’apai, and ‘Eua. The following sections detail how energy is generated, transmitted, and distributed, as
well as areas of consumption, where such data are available. Conservation and management of energy is important
for meeting specific targets and goals. Demand-side management, energy conservation, EE, and supply-side
management are common practices.
Supply-side management refers to the practice of electric utilities building generating plants to serve
whatever demand customers require. This practice was common until the 1970s and now includes incorporation of
more efficient generation sources. These are either higher efficiency generators or diversified generation portfolios
that include lower-emission fuels (such as natural gas), or RE (such as solar or wind power). Demand-side
management is typically undertaken by a utility to change the level or timing of energy use on the customer side of
the electricity meter, generally with the intention of optimizing existing and planned generation and transmission
assets on the utility side of the meter. It encompasses utility-initiated actions to improve EE, increase energy
conservation, and reduce peak electricity demand. Demand-side management activities include rebates, incentives,
6
Climate Technology Centre and Network
Government of Tonga: Energy Efficiency Master Planand utility investments that improve the EE of building systems (e.g., envelopes, heating and cooling equipment, and
lighting systems) as well as rate structures that shift demand from times of peak energy use to off-peak hours.
Energy conservation involves using less energy, and typically requires a change in behavior (e.g., turning off lights
when not in use, walking stairs rather than using an elevator, and adjusting thermostats on air conditioners to use
less energy). Behavior change can be accomplished through education and awareness programs. Implementing
higher efficiency technologies or building components (e.g., cool roofing materials) is another standardized practice
for conserving energy across building portfolios. EE involves consuming less energy through technological
improvements while delivering the same services. An example is switching out incandescent lightbulbs with more
efficient compact fluorescent lighting or light emitting diodes (LEDs), which use less energy to provide the same
amount of light and produce less heat, resulting in a more energy-efficient lighting system. To understand the
opportunities for efficiency and conservation, the grid system and energy consumption within Tonga are discussed
in this section.
The 2017 installed capacity of the four island grid systems is shown in Table 1, by source and grid type.
Tongatapu’s system represents most of the installed capacity, predominantly supplied by diesel fuel. As of June
2017, the total installed capacity on Tongatapu is 17.8 MW, with 14 MW of conventional capacity from diesel
generators, 2.3 MW from PV, 0.5 MW from wind, and a 1 MW battery storage system. In 2012, Tongatapu had 12.6
MW of conventional capacity and 1.3 MW of renewables. The apparent growth in capacity is attributable to
renewable-oriented policy ambitions, and increased electrical loads, primarily driven by ownership of electrical
appliances. Two additional renewable projects are currently under construction: a 1.3 MW wind farm funded by the
Japanese International Cooperation Agency (JICA), and a 2 MW PV project developed by Chinese investors
through power purchase agreements with TPL.
Table 1. 2017 Installed Generation Sources (Sources: TPL and MEIDECC)
Location Grid Status Conventional RE Capacity Battery Capacity
Capacity (MW)
Tongatapu TPL grid (11kV) 14.00 MW 2.80 MW 1.00 MW
Vava’u TPL grid (medium voltage) 1.87 MW 0.42 MW 0.20 MW
Ha’apai TPL grid (medium voltage) 0.37 MW 0.50 MW 0.66 MW
Eua TPL grid (medium voltage) 0.37 MW 0.20 MW
Nomuka (Ha’apai) Non-TPL (6.6 kV) 0.09 MW
Ha’afeva (Ha’apai) Non-TPL (6.6 kV) 0.06 MW
Ha’ano (Ha’apai) Non-TPL (6.6 kV) 0.06 MW
‘Uiha (Ha’apai) Non-TPL (6.6 kV) 0.09 MW
Household generators & solar home Off-grid 0.05 MW
systems (Tongatapu)
Household generators & solar home Off-grid 0.06 MW
systems (Ha’apai)
Household generators & solar home Off-grid 0.13 MW
systems (Vava’u)
Household generators & solar home Off-grid 0.04 MW
systems (Niuas)
TOTAL 16.91 MW 4.2 MW 1.86 MW
Figure 6 illustrates the gradual increase in capacity to meet rising demand. The figure also shows that solar output
remains consistent month-to-month, while diesel generation decreases during the cooler months (June–August), and
increases during the warmer months (December–February). TPL already has at least one 11 kW small-scale wind
turbine in operation, and a JICA feasibility study concluded that construction should proceed on their 1.3 MW fixed-
tilt wind generator.27
7
Climate Technology Centre and Network
Government of Tonga: Energy Efficiency Master Plan7 GWh
6 GWh
Monthly GWh Production
5 GWh
4 GWh
3 GWh
2 GWh
1 GWh
0 GWh Sep-13
Sep-14
Sep-15
Sep-16
Mar-13
Mar-14
Mar-15
Mar-16
Mar-17
Jul-13
Jul-14
Jul-15
Jul-16
Jan-13
Jan-14
Jan-15
Jan-16
Jan-17
May-13
May-14
May-15
May-16
May-17
Nov-13
Nov-14
Nov-15
Nov-16
Solar Diesel
Source: TPL Monthly Generation Data (June 2017)
Figure 6. Energy generation mix for Tonga (monthly GWh)
Voltages and T&D losses vary between the four grid systems. Voltages on Tongatapu are 11 kV for primary
distribution; three phases: 415 V; single phase: 240 V. However on Vava’u, Ha’apai, and ‘Eua, the voltages are 6.6
kV for primary distribution; three phases: 415 V; single phase: 240 V. Most of the primary distribution network on
all islands consists of aerial lines supported by wooden poles, the exposure of which makes the grid vulnerable to
both parasitic and line losses. Table 2 below demonstrates that although some improvements have been made on the
outer islands, T&D losses still remain relatively high. Although official data have only been reported through 2016,
Tongan officials have indicated that system-wide line losses stand at around 10% as of 2018.
Table 2. Transmission and Distribution Losses
(Source: TPL Annual Reports [2014/15, 15/16, 16/17])
TPL (Total) Tongatapu Vava’u Ha’apai ‘Eau
2014 2015 2016 2014 2015 2016 2014 2015 2016 2014 2015 2016 2014 2015 2016
Line 9% 8% 9% 9% 8% 9% 11% 10% 4% 8% 5% 2% 11% 10% 7%
Losses
Parasitic 2% 3% 3% 3% 3% 3% 2% 2% 2% 2% 2% 2% 2% 2% 2%
Losses
Billed 89% 89% 88% 89% 89% 88% 87% 88% 94% 90% 93% 96% 88% 89% 91%
The costs of generation vary from island to island due to diesel fuel transport costs. However, in 2009, TPL changed
the structure across the four islands to create a more uniform price, providing the same retail tariff across all major
islands. The cost per kWh on each island as of February 2018 was 0.8514 Tongan Pa’Anga (aka TOP). Figure 7
details the monthly retail electricity rate in Tonga, along with the associated cost of diesel fuel import to Tonga
where available. A spike in the cost of diesel in 2008 rapidly increased rates. In April 2017, in order to lessen the
impact of rate increases on consumers, the government introduced a subsidized lifeline tariff, with a fixed rate at 0.7
TOP for the first 100 kWh of monthly consumption, applicable to all customers. Although this rate structure may
provide some economic benefit, especially to low-income households, it may also reduce the motivation to install
EE or RE technologies and practice energy conservation.
8
Climate Technology Centre and Network
Government of Tonga: Energy Efficiency Master Plan3.5
3.0
Retail Electricity Tariff (TOP)
2.5
2.0
1.5
1.0
0.5
0.0
Jul-2001
Jul-2002
Jul-2003
Jul-2004
Jul-2005
Jul-2006
Jul-2007
Jul-2008
Jul-2009
Jul-2010
Jul-2011
Jul-2012
Jul-2013
Jul-2014
Jul-2015
Jul-2016
Jul-2017
Jan-2001
Jan-2002
Jan-2003
Jan-2004
Jan-2005
Jan-2006
Jan-2007
Jan-2008
Jan-2009
Jan-2010
Jan-2011
Jan-2012
Jan-2013
Jan-2014
Jan-2015
Jan-2016
Jan-2017
Jan-2018
Price of Diesel (TOP / liter) Electricity Tariff (TOP / kWh) Electricity Tariff (First 100 kWh)
Source: TPL Demand and Prices, PICTS Electricity Tariff Database
Figure 7. Electricity tariff and associated fuel costs
Energy is consumed by different sectors and the load profiles change based on weather. TPL typically reads
customer meters manually, taking up to 25 days to complete meter readings, whereas other meters can be read
remotely the last day of every month. The difference in meter readings means that TPL uses a 12-month moving
average to adjust for anomalies and determine total monthly generated power, parasitic losses, and customer
consumption. To improve reporting and power delivery, TPL is completing a meter replacement program.
According to TPL’s 2017 Annual Report, 3,000 single-phase meters and 500 three-phase meters were installed in
2016 as Phase 1 of a 2-year project to replace customer meters to improve smart metering capabilities (i.e., remote,
automatic meter reading). TPL is planning on upgrading all meters by 2018. The new meters are intended to provide
alternative methods of billing and allow TPL to detect faults and power quality issues remotely. The smart metering
program may also help improve detection of parasitic losses or line losses. Line losses are determined by subtracting
the power consumed by the customer from the power generated.28
2.1.2 Electricity by End-Use Application
Tonga’s overall energy consumption is dictated by building design, building energy-using systems (such as
appliances), and behavior around energy consumption. In tropical areas such as Tonga, building cooling loads
typically are a large proportion of energy consumption. The use of mechanical air-conditioning systems is
widespread and increasing. Thermal comfort and indoor air quality (e.g., managing humidity and indoor pollutants)
is being achieved by air conditioning more frequently than relying on vernacular architecture. Historic buildings in
Nukuʻalofa were designed to use passive ventilation, have large overhangs to prevent solar gains from entering
buildings, and, as a result, use less energy than the more modern office buildings, which rely on air-conditioning
systems.
This section is broken into the four areas that are commonly associated with the highest energy consumption:
building design, residential end uses, commercial end uses, and streetlighting.
2.1.2.1 Building Design
Typically, energy consumption is dictated by the building design and by the equipment or appliances in use within
each building type. For example, churches in Tonga are mostly open-air to allow passive ventilation rather than
needing air conditioning. This is a great building design to reduce the need for energy for cooling. Daytime services
and activities also reduce the need for lighting. The largest energy end uses in churches are lighting, amplification
systems (e.g., microphones), and electric fans in open-air buildings designed to use natural ventilation. TPL’s largest
customer is a Church of Latter-Day Saints complex built in 2007, which uses an average of 116,000 kWh per month,
9
Climate Technology Centre and Network
Government of Tonga: Energy Efficiency Master Planor 1.35% of the total billed consumption on Tongatapu.29 This level of consumption indicates an architectural design
with closed windows and doors, and a large air-conditioning load. Similarly, office buildings that are not designed to
use passive ventilation require air conditioning to prevent mold growth, reduce humidity, and cool to a comfortable
temperature. Commercial buildings such as offices use cooling and lighting technologies and also use computers,
data processors, printers and facsimile machines, refrigerators, coffee pots, microwaves, etc., all of which generate
heat internally, which increases the need to extract the heat for occupancy comfort or cool the interior of the
building.
It requires knowledge of a building’s specific context to evaluate, design, and implement EE measures. Different
types of buildings require different skills, with residential buildings being fairly straightforward and uniform,
whereas commercial and industrial buildings vary in their complexity. There are typically more retrofit opportunities
than new construction opportunities because the building stock “turns over” very slowly, with perhaps ten times as
many retrofit projects as new construction projects. Energy auditing and improved construction codes can lead to
reductions in the energy consumption of buildings. Training can help prepare energy auditors, but there is no
substitute for experience, and the best auditors have a long background in system installation or operations and
maintenance and evaluating technical feasibility and cost-effectiveness of various technology options.
Once an auditor identifies measures, a designer can be engaged to specify the size and type of replacement
components and detail how the measures will be implemented in construction drawings and specifications. This
portion of the project is often opened for bidding from developers, and implemented by building trades such as
electrical, mechanical, lighting, refrigeration/air-conditioning, and control system contractors. Depending on
complexity, a commissioning agent may be engaged to ensure that the retrofit system is operating according to the
intent of the design. Due to the fact that opportunities are distributed within buildings and varied and detailed in
nature, it requires significant labor to deliver benefits compared to central RE plants, but the benefits are robust and
permanent. The best kWh is a kWh not used, and EE is recognized as a prerequisite to sizing and procuring RE
systems. RE and the appropriate controls and system designs within buildings may also be needed to meet supply-
side management and resilience goals.
Tonga implemented building codes in 2007. The Building Control Division is responsible for enforcement and
planning of related policy and regulation within the building construction sector in Tonga. A complete revision of
the current building code, regulations, and implementation/enforcement of codes is being planned. The Building
Control Division plans to increase building inspection activities and to improve public awareness programs to ensure
the general public and key stakeholders are updated on changes to building codes and regulations. The goal of the
Building Control Division is to “achieve more reliable, safe, and affordable buildings and ensure structures are more
inclusive, sustainable, affordable, safe, and reliable.”30 One way in which the goals can be met is through updating
building codes to include EE.
Energy-efficient and resilient building technologies are deployed as a result of public policy. This is even the case
when the cost of EE measures may not be significantly more than traditional methods or when investments in
energy-efficient technologies result in energy savings. A study conducted by the U.S. National Institute of Building
Science in 2005 determined that the return on the incremental investment in resilience pays off over the life of the
building.31 The study concludes that for every $1 spent on hazard mitigation, an average of $4 is saved during the
disaster recovery phase. In December 2017, that report was revised to show that the savings are now a ratio of 1:6,
rather than 1:4. Similarly, not only will updating building codes in Tonga save energy, but it will likely lead to fewer
costs associated with disaster recovery with anticipated severe weather (e.g., increased cyclones and larger storm
surges). It is recommended that climate change considerations be incorporated into building codes along with EE
requirements, which will also help promote sustainable development, reduce poverty levels associated with energy
bills, and accelerate recovery from severe climate-related events.
Some considerations for Tonga are to create setback zone guidelines or a policy to protect buildings from sea level
rise and increasing storm surges. Elevated structures may be needed in certain areas to protect from the same threats.
Additionally, mandating the secure attachment of roofs or features like PV panels can help protect against higher
wind levels associated with cyclones. Tonga may need to identify threats, vulnerabilities, and risks; identify the
technical measures to reduce the impacts associated with those risks; and integrate energy requirements at the same
time.
Energy-efficient and resilient building codes will address the following considerations:
10
Climate Technology Centre and Network
Government of Tonga: Energy Efficiency Master Plan• For new buildings, siting to reduce impact from climate-related threats (e.g., setback from shore and
building height of no more than two stories)
• Passive survivability techniques to reduce energy consumption and allow the building to be occupied
without power (e.g., natural daylighting, natural ventilation, and rainwater collection)
• Energy and water storage on the site to allow for continued operation without utility services (e.g., PV with
islanding controls and battery storage and cistern collectors with graywater systems)
Rolling out codes to first target critical infrastructure such as schools, hospitals/medical clinics, evacuation centers,
fire stations, and police stations will help communities be more resilient during natural disasters. Focusing on
residential and commercial buildings after critical infrastructure will help lower energy costs within those sectors as
well as make them more resilient. Codes should address new construction and renovations. Examples of codes can
be found for the region and specific sectors, as well as studies on the topic of passive design codes for specific
climates. An example of a cyclone-resistant design with energy-efficient and passive design is shown in Figure 8 for
illustrative purposes.32
1. Design shape influences how wind moves
around a building
2. Roof pitch (6/12) can reduce lift and
deflect wind
3. Circular structure transfers wind pressure
most efficiently
4. Radial floor and roof trusses distribute
weight and wind loading
5. Wind is dispersed
6. 2400 psi framing is twice as strong as
typical framing material
7. Five ply 5/8” sheathing instead of OSB
exterior walls, roof and floor hardens
buildings and prevents flying debris
penetration
8. Reinforced windows prevent wind and
water infiltration
9. Oversized truss hangers keep roof system
Source: Ecobuilding Pulse anchored to walls
Figure 8. Example of resilience measures for passive design and 10. Multiple construction ties add structural
cyclone resistance stability and transfer shear forces
11. Continuous metal strapping increases
structural stability
12. Solar water heat provides on-site hot water
13. Enhanced insulation maintains internal
temperatures and reduces energy
consumption; reflective coating or cool
roof reflects heat gain
14. Passive solar design helps cool building
through appropriate window placement
and roof overhang/shading
2.1.2.2 Residential End Use
The 2016 population census indicates there are 18,005 private households in Tonga; Tongatapu has the largest
population with 12,953 private households. According to TPL’s 2017 data, approximately 45% of total load was
from residential accounts. Residential accounts in tropical climates typically use energy for space cooling equipment
11
Climate Technology Centre and Network
Government of Tonga: Energy Efficiency Master Plansuch as air conditioning and fans; lighting; domestic appliances like televisions, clothes washing machines (labeled
as Elec Washer), and electric water heaters; and kitchen appliances such as refrigerators (fridges), freezers, and
cooking appliances. Census data indicate that most Tongans cook with fuels rather than on electric burners, and also
use a number of ancillary cooking devices (such as microwaves, electric kettles, or food processers), which are
captured by the cooking category in Figure 9. Additionally, most Tongans own energy-efficient twin-tub, or
nonelectric clothes washing machines. Census data indicate, however, that as GDP per capita increases, a higher
percentage of Tongans are purchasing electric clothes washing machines. In order to better understand how this
electricity is being consumed, residential end-use consumption was modeled using the following methodology:
1. Using a variety of census data, surveys, and proxy data, the household ownership of various appliances was
estimated.
2. Data from TPL estimating average monthly consumption from appliances were used to calclulate the total
monthly consumption of households based on the number of households that own a given appliance.
3. These data were then normalized to TPL’s actual (and for future years, projected) billed consumption,
using the 2017 portion of total consumption from residential accounts.
4. Using an estimate of appliance adoption rates tied to household GDP, residential consumption by end use
was modeled through 2030. The resulting data are displayed in Figure 9.
60
Annual kWh Billed (Millions)
50
40
30
20
10
-
2017 2018 2019 2020 2021 2022 2023 2024 2025 2026 2027 2028 2029 2030
TV Fridge Freezer Lighting Fans AC Elec Washer Elec Water Heater Cooking Other
Figure 9. Residential electricity business-as-usual by end use
Due to Tonga’s geographic location, appliances are most commonly imported from Australia, New Zealand, Fiji,
China, and Singapore. The minimum energy performance standards (MEPS) or energy labeling schemes vary in
these countries, and the point of origin (i.e., the place where the good is manufactured) may not be the same as the
country from which the good is imported. This creates a challenge when determining the energy performance of
appliances imported through customs.
Australia and New Zealand have more stringent MEPS. However, less expensive products with less stringent
energy standards may be available from Asia or Fiji. In a 2017 Pacific Community survey of Tongans, 58% had
seen an Australian or New Zealand energy rating label, and the vast majority of these respondents said they had seen
the label on an appliance in their own home, in the home of a neighbor, or on a television advertisement. Figure 10
shows the percent of Tongan respondents who recognized an energy performance label by source country when
prompted with an example. An earlier study estimating the percentage of appliances in Tonga that already meet an
existing standard is used as a baseline in modeling the effectiveness of new MEPS.33 Although Tonga is currently in
the process of implementing MEPS as organized by the Pacific Community,34 exact performance requirements are
unavailable. As such, modeling for the TEEMP uses standard efficiency requirements applied in Australia and New
Zealand. In some situations, such as the curtailment of non-LED lights, the model extends beyond the MEPS
imposed by Australia and New Zealand. Figure 11 shows the various labels included on appliances sold in Tonga. 35
12
Climate Technology Centre and Network
Government of Tonga: Energy Efficiency Master PlanYou can also read