Does eviction cause poverty? Quasi-experimental evidence from Cook County, IL
←
→
Page content transcription
If your browser does not render page correctly, please read the page content below
Does eviction cause poverty? Quasi-experimental evidence
                     from Cook County, IL∗
                John Eric Humphries, Nick Mader, Daniel Tannenbaum & Winnie van Dijk†

                                                       December 26, 2018

                                                PRELIMINARY DRAFT
                                            [most recent version available here]

                                                             Abstract

       Each year more than two million U.S. households have an eviction case filed against them.
       Influential work in sociology has hypothesized that eviction is a cause, and not merely a
       consequence, of poverty. This paper uses the near-universe of eviction court cases in Cook
       County, IL for 2000-2016, linked to credit bureau and payday loans data, to provide evidence on
       the link between eviction and financial strain. We first provide new descriptive evidence showing
       that there is significant distress and an increase in demand for high interest loans in the run-up
       to eviction court for both evicted and non-evicted tenants. We then estimate the causal effect of
       an eviction order on financial strain, proxies for durable goods consumption, household moves,
       and neighborhood quality, leveraging the random assignment of cases to judges in eviction court
       for identification. The effects are small relative to the financial strain experienced by tenants in
       the run-up to eviction court.

    ∗
      The authors gratefully acknowledge financial support from the National Science Foundation (SES-1757112, SES-1757186, SES-1757187),
the Laura and John Arnold Foundation, the Spencer Foundation, and the Kreisman Initiative on Housing Law and Policy. We would like
to thank Lawrence Wood and others at the Legal Assistance Foundation in Chicago, Melissa C. Chiu at the U.S. Census Bureau, Leah
Gjertson and Robert Goerge at Chapin Hall, Lydia Stazen Michael at All Chicago, Emily Kristine Metz and Ruth Coffman at UChicago
Urban Labs, Joe Altonji, Luis Bettencourt, Angela Denis Pagliero, Manasi Deshpande, Michael Dinerstein, Bill Evans, Alex Frankel, Pieter
Gautier, Michael Greenstone, Jim Heckman, Ali Hortaçsu, Peter Hull, Louis Kaplow, Ezra Karger, Paymon Khorrami, Scott Kominers,
Thibaut Lamadon, Jeff Lin, Maarten Lindeboom, Sarah Miller, Magne Mogstad, Derek Neal, Matt Notowidigdo, Ed Olsen, Azeem Shaikh,
Beth Shinn, Jim Sullivan, Chris Taber, Alex Torgovitsky, Bas van der Klaauw, Chris Walters, Laura Wherry, and seminar participants at
the Summer 2017 University of Chicago Crossing Disciplinary Boundaries workshop, the 2017 Fall APPAM conference, the University of
Chicago applied microeconomics seminar, SOLE, the Philadelphia Fed, and the 2018 NBER Summer Institute, and the University of Oslo
for helpful discussion. Ella Deeken, Deniz Dutz, Michael Harvey, Katherine Kwok, Ezra Max, Sebastian Seitz, Diego Suarez Touzon, and
Yao Xen Tan provided excellent research assistance. Any errors are our own.
    †
      Humphries: Department of Economics, Yale University (e-mail: johneric.humphries@yale.edu). Mader: Chapin Hall at the Univer-
sity of Chicago (e-mail: nmader@chapinhall.org). Tannenbaum: Department of Economics, University of Nebraska - Lincoln (e-mail:
dtannenbaum@unl.edu). van Dijk: Department of Economics, University of Chicago (e-mail: wlvandijk@uchicago.edu).

                                                                   1
... and no one knew whether the house was mine or yours because there was no disagreement
            between me and you. But now I am being subjected to violence by your very own Ptolema,
            who sent me word to this effect: “Give up the house. Otherwise your household furnishings
            will be put out.”
            - Letter from the third century A.D. by an Egyptian tenant to his landlord (Frier, 1980).

       1     Introduction
       Each year more than two million U.S. households have an eviction case filed against them.1
       Many of these households live in poor urban communities where eviction is a frequent occurrence;
       in some census tracts, more than 10 percent of renter households are summoned to eviction
       court annually. The high incidence and geographic concentration of evictions have motivated
       pioneering ethnographic and survey-based research asking whether housing instability, and
       eviction in particular, is responsible for increasing the financial strain on low-income families.2
           This hypothesis is challenging to evaluate because, until very recently, little or no data has
       been collected on evictions. In addition, eviction is likely to occur in conjunction with other
       adverse life events, such as job loss, financial shocks, or deteriorating health, making it difficult
       to isolate its causal impact on outcomes associated with poverty.
           In this paper, we present new evidence on the link between eviction and measures of financial
       distress. In the first part of the paper, we provide descriptive evidence on financial strain and
       housing instability surrounding the eviction filing. In the second part, we assess the causal link
       between eviction and subsequent outcomes, using a judge instrumental variables design. Overall,
       we aim to test the hypothesis that eviction is a driver of urban poverty and to examine the
       potential channels through which eviction affects families. There are several reasons eviction
       may generate significant costs for tenants. First, the disruption and relocation of the home
       environment is costly, and tenants may have to relocate farther from their workplace. Second,
       eviction court records are publicly observable, which may negatively impact a tenant’s ability to
       secure a new lease or access credit. Third, tenants may be cut off from or become ineligible for
       rental assistance following an eviction. On the other hand, an eviction may not be without some
       benefit for tenants, since they are released from the obligations of their lease and may relocate
       to a lower-rent unit, increasing their ability to pay balances on existing loans.
           We begin our analysis by documenting a series of descriptive facts about eviction in Cook
       County, IL, which includes the city of Chicago. Drawing on a newly-assembled linked administra-
   1
    Although data on the annual number of eviction cases in the U.S. are not collected or reported by statistical
agencies, between 2.3 and 2.7 million cases were filed in 2016; approximately 900,000 of them ended in eviction orders
(Marr, 2016; Desmond et al., 2018a). For comparison, there were 2.9 million foreclosures in the peak year of the great
recession.
   2
    See, e.g., Crane and Warnes (2000); Desmond (2012); Desmond and Kimbro (2015); Desmond and Gershenson
(2016), and Desmond (2016).

                                                          2
tive data set that includes the near-universe of eviction court cases in Cook County, we provide
       new evidence on the scope and incidence of evictions. We document that evicted households are
       negatively selected when compared to observationally similar households from the neighborhood
       that do not have an eviction case filed against them; these comparisons are common in the
       literature and are often interpreted in the literature as evidence of eviction’s harmful effect.
       However, we show that this comparison can be misleading because of selection into eviction court.
       For instance, the difference in credit scores observed in the 13-36 months after eviction is reduced
       by more than 75 percent when the comparison is between evicted and non-evicted tenants in
       eviction court, rather than between evicted tenants and observationally similar tenants from the
       neighborhood.
          Throughout the remainder of our analysis, we focus on tenants with an eviction case filed
       against them, and define the treatment as an eviction order issued by a judge. In the Cook
       County Circuit Court, this is called an “order for possession,” which grants the landlord the legal
       authority to have the sheriff change the locks on the unit and reclaim the property. Our analysis
       studies the effect of such a court-ordered eviction against the counterfactual of dismissal of the
       eviction case.3
          We next present new descriptive evidence, using an event study design, characterizing the
       evolution of financial strain in the run-up and aftermath of eviction court for both winners and
       losers of eviction cases. Our main outcomes are credit score, unpaid bills, an indicator for having
       an open auto loan or lease, which serves as a proxy for durable goods consumption (Dobkin
       et al., 2018), and high-interest loan inquiries and openings.4 We also study the evolution of the
       tenant’s neighborhood quality, measured at the zipcode level, and study the cumulative number
       of zipcode-level moves.
          The event studies reveal four important findings. First, regardless of the outcome of the
       case, households in eviction court show signs of financial strain 2-3 years prior to having a case
       filed against them, with credit scores falling and unpaid bills rising. Second, the comparison
       of evicted and non-evicted tenants reduces the selection bias considerably; nonetheless, there
       remains selection on observables, with evicted tenants having lower credit scores and more debt
       prior to the court cases. Third, the event studies do not lend support to the hypothesis that
       an eviction order triggers a downward spiral in financial health, but they do suggest that an
       eviction exacerbates the initial decline and slows the recovery. Finally, eviction filings coincide
       with a reduction in durable goods consumption, and a large increase in unpaid bills, for both
   3
    We emphasize that the treatment we study in this paper is more narrow than an “involuntary move,” terminology
which is sometimes used in the sociology literature on eviction. As such, our analysis is not directly informative on
cases in which tenants are coerced or illegally forced to move, and which operate outside the legal system. Our focus is
on court-ordered eviction, which is well-defined by the legal system and has a clear, policy-relevant counterfactual.
   4
    The high-interest loans are single payment microloans that originate either from traditional storefront or online
subprime lenders. This data was collected and provided to us by the largest subprime credit bureau in the U.S. For
brevity, we refer to these loans throughout the paper as “payday loans,” even though not all of these microloans are
required to be repaid on the individual’s payday.

                                                           3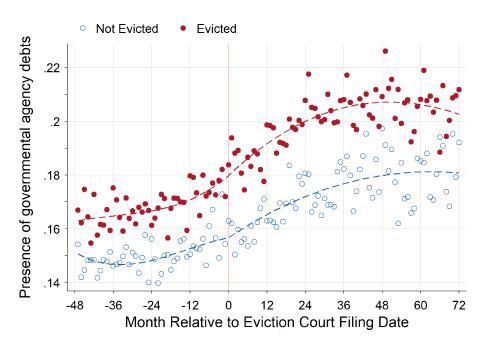
evicted and non-evicted tenants. For instance, both winners and losers in eviction court have on
         average more than $3,000 of collections debt in the 1-2 years prior to the eviction filing, and this
         debt increases by $500-1000 for both groups in the 1-2 years after filing and does not return to
         pre-eviction levels in the 7 years after filing.
             We next turn to an analysis of the causal effect of eviction, using a quasi-experimental
         research design that leverages random assignment of court cases to judges who differ in their
         stringency toward tenants, which we measure by their tendency to grant eviction orders. Our
         analysis is able to recover the local average treatment effect: the causal effect of an eviction for
         the group of tenants whose case outcome is affected by the stringency of the judge.5 The linked
         credit bureau data allows us to evaluate the costs as well as the potential benefits of eviction.
         Our findings show that eviction has a small negative effect on short- and long-run credit scores,
         and a relatively small and statistically insignificant positive effect on collections balances. We
         do find a large negative effect on the probability of having an auto loan or lease. This effect
         persists for several years, and, taken together with the results from the event studies, suggests a
         long-lasting negative effect on consumption.
             Our research speaks to an active policy debate on how, if at all, the government should
         address the high frequency of evictions. For example, New York City recently introduced legal
         aid for tenants in eviction court, and Richmond, Virginia is considering a diversion program to
         place tenants on a court-supervised payment plan in lieu of eviction.6 Our work develops critical
         input into this policy debate by providing an assessment of the costs of eviction on tenants. The
         eviction court process is important for a well-functioning rental market, but, given the prevalence
         of evictions, it is important to know how tenants might be affected by policies that make eviction
         court proceedings more lenient toward them. Our results speak directly to this question. Given
         the financial strain experienced by tenants in the run-up to eviction and the modest additional
         effect of an eviction order, one broad takeaway for policy design is that intervening after a case
         has been filed may be too late to help prevent the large increase in financial strain associated
         with eviction.
             This paper contributes to the growing body of work in sociology on eviction. Recent studies
         find that eviction has a negative association with physical and mental health of tenants (Burgard
         et al., 2012; Desmond and Kimbro, 2015; Sandel et al., 2018), and a positive association with
         depression, stress, and material hardship (Desmond and Kimbro, 2015), suicide (Fowler et al.,
         2015), job loss (Desmond and Gershenson, 2016), and homelessness (Crane and Warnes, 2000;
         Phinney et al., 2007). Desmond and Bell (2015) provide an overview of this literature. Due to the
         limited availability of data on evictions, the evidence is largely based on ethnographic research
         and short-term surveys of households at risk of eviction, including the influential Milwaukee Area
   5
    Several recent studies in other settings rely on random assignment of cases to judges for identification, including
Kling (2006); Berube and Green (2007); Green and Winik (2010); Dahl et al. (2014); Maestas et al. (2013); Dobbie and
Song (2015); Aizer and Doyle (2015); Bhuller et al. (2016); Mueller-Smith (2016); Dobbie et al. (2018).
   6
       See Appendix B for a review of recently proposed or passed reforms.

                                                            4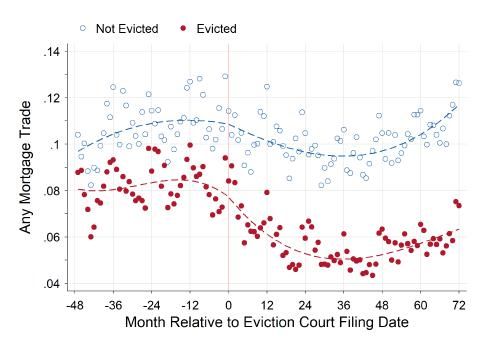
Renters Study. We contribute to this literature by assembling a large-scale administrative data
       set of eviction cases in Cook County that are linked to a panel of credit reports, including payday
       loan account openings and inquiries. We provide new descriptive evidence on the evolution of
       financial strain surrounding an appearance in eviction court, and study the causal effect of an
       eviction order using a quasi-experimental design. Our study presents some of the first evidence
       on the effects of eviction that addresses the endogeneity resulting from correlated unobservables
       and simultaneity. One closely related study is Collinson and Reed (2018), an independent and
       contemporaneous working paper that studies recipients of public assistance appearing in eviction
       court in New York and examine the effect of eviction on income, mental health, public assistance,
       and homelessness using a similar judge design.7 In addition, Desmond et al. (2018a) has recently
       assembled and made available area-level data on the number of eviction court cases. Both of
       these research efforts are complementary to our paper and make important advances in data
       collection on evictions.
          Our paper also contributes to the economics literature on housing instability and economic
       mobility. Several studies of housing vouchers and the Moving to Opportunity program have
       found small benefits of moving to a better neighborhood for adults, and much larger effects for
       children (Kling Jeffrey et al., 2007; Gennetian et al., 2012; Chetty et al., 2016; Chyn, 2018).
       Evans et al. (2016) shows that emergency financial assistance is a cost-effective tool for reducing
       homelessness. There is surprisingly little economics research on evictions, although the social
       costs have the potential to exceed the amount under dispute.8 We aim to fill this gap by studying
       the dynamics of financial strain surrounding an eviction filing and by bringing a rich research
       design to identify the causal effect of an eviction order. Our credit panel allows us to assess the
       evidence for the Desmond hypothesis by studying several stress points on which eviction is likely
       to leave an empirical signature.9 One advantage of our credit bureau data is that we can follow
       individuals across neighborhoods, not only within Cook County but throughout the US, which
       is typically difficult in studies of the urban poor. Another feature of the data is we are able to
       observe a tenant’s interaction with subprime lenders, which we believe is a first in the housing
       instability literature, and allows us to observe demand for credit.
          The remainder of the paper is organized as follows. Section 2 provides background information
       on evictions in Cook County and a detailed description of the institutional setting. Section
       3 describes our data collection and linking process and detailed description of the population
   7
    There are important distinctions in the design worth highlighting. First, the choice of treatment in Collinson and
Reed (2018) is the City Marshal carrying out the eviction order. Second, their specification differs in that it is based
on courtroom leniency rather than judge leniency.Despite these differences, Collinson and Reed (2018) find a similar
pattern of small causal effects,and we view their results as complementary to those presented in this paper.
   8
    In the literature on foreclosure and bankruptcy, for example, researchers have studied the costs of default, and
the potential for improving the contracting environment (Campbell et al., 2011; Molloy and Shan, 2010; Dobbie et al.,
2017). The household finance literature more generally has focused on home ownership, rather than tenancy.
   9
   Several recent papers use credit bureau data in the context of studying the economic costs of hospitalization
(Mazumder and Miller, 2016; Dobkin et al., 2018), and bankruptcy (Dobbie et al., 2017).

                                                           5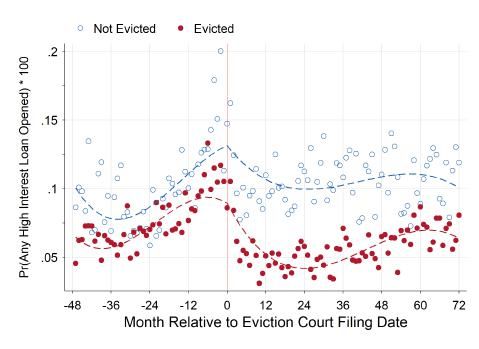
of tenants in our baseline sample. Section 4 provides new descriptive evidence using an event
study design. Section 5 formalizes our research design and tests the key underlying assumptions.
Section 6 presents the main findings of the causal impact of eviction and a discussion of the
mechanisms. Section 7 concludes.

2      Background and institutional details
This section first provides aggregate empirical facts about eviction court cases in Cook County
and the city of Chicago based on our newly assembled data, and then describes the details of the
eviction process.

2.1      Evictions in Cook County: scope and spatial incidence
Thirty to forty thousand evictions cases are filed every year in Cook County. Figure 1 shows the
number of eviction cases filed and the number evictions ordered by a judge in Cook County from
2000 to 2016. There is a downward trend in both the number of evictions and the number of
cases filed, but evictions have been a relatively stable feature of the rental housing market over
this period. For comparison, Figure 1 also shows the number of foreclosure filings between 2005
and 2016, which only surpasses eviction filings during the financial crisis.

                        Figure 1: Evictions in Cook County, 2000-2016.

        50000

        40000

        30000

        20000

        10000

           0
                2000         2002           2004    2006           2008         2010     2012          2014          2016

                  Evictions filed, Cook County     Evictions ordered, Cook County      Foreclosures filed, Cook County

Notes: This figure depicts yearly counts of evictions filed and ordered in Cook County, IL. For comparison, it also
depicts the number of foreclosure filings in Cook County, IL. Data on foreclosures is obtained from the data portal
maintained by the Institute for Housing Studies at DePaul University (IHS, 2018).

    Evictions are concentrated in low-income neighborhoods. Figure 2 presents a map of the

                                                               6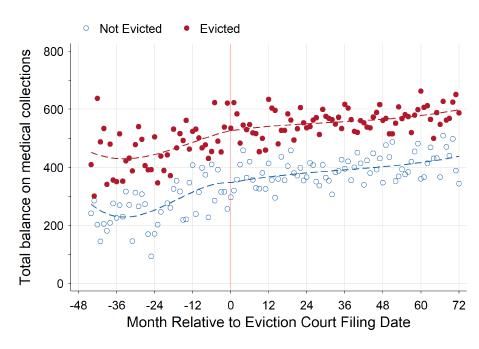
first municipal district of Cook County, which includes the City of Chicago, and depicts the
number of evictions relative to the total number of occupied rental units in each census tract,
for the year 2010. While evictions occur across all of Cook County, they are concentrated in
Chicago’s poorer south and southwest side neighborhoods. We find that, more than 44 percent
of the cases occur in Census tracts with more than 20 percent of residents living below the
poverty line, and more than 22 percent of cases occur in Census tracts with more than 30 percent
of residents living below the poverty line This finding is consistent with Desmond (2012) and
Desmond and Shollenberger (2015), who find that eviction is a relatively common occurrence in
poor communities in Milwaukee. In the city of Chicago, the highest concentration census tracts
have more than 10 percent of rental units with an eviction filing per year, or more than four
times the 2.4 percent filing rate for the city as a whole.
2.2 The court process
This section summarizes the eviction process.10 To begin an eviction, the landlord must serve
the tenant a written termination notice, which includes the reason for termination of the lease,
and the requisite number of days until the lease will terminate. The termination notice must
name all tenants whose names are on the lease and will typically also refer to tenants who are
not on the lease as “any and all unknown occupants.” The termination period varies depending
on the reason for terminating the lease; for instance, non-payment of rent has a 5-day notice
period, as does using the property for the furtherance of a criminal offense, whereas breaking a
rule in the lease such as a prohibition of pets has a 10 day notice period. Our data does not allow
us to observe the reason for eviction; however, studies in other cities have found non-payment of
rent the most common reason for eviction (Desmond et al., 2013).11
Whether to serve a termination notice is entirely at the landlord’s discretion. Chicago has no
grace period on the number of days a tenant can be late on the rent before the eviction process
can be initiated.
Once the number of days in the written termination notice have elapsed without resolution,
the landlord has a right to take legal action and file an eviction court case with the clerk in
the Circuit Court of Cook County; the case filing is the starting point from which we observe
evictions in our study and is our unit of analysis. The landlord must file the case in the district
where the property is located.12 At filing, the landlord must decide whether to file a single action
case, in which she seeks only possession of the property, or a joint action case, in which she seeks
10
We provide more detail in Appendix A. See also the Municipal Code of Chicago Residential Landlords and Tenants
Ordinance (RLTO) and the Illinois Compiled Statutes (ILCS).
11
Following the notice, if the tenant pays the full amount, the landlord must accept the payment and loses the right
to evict the tenant. In the City of Chicago, and in many other jurisdictions, accepting partial payment will cause the
landlord to lose the right to evict the tenant based on the filed notice.
12
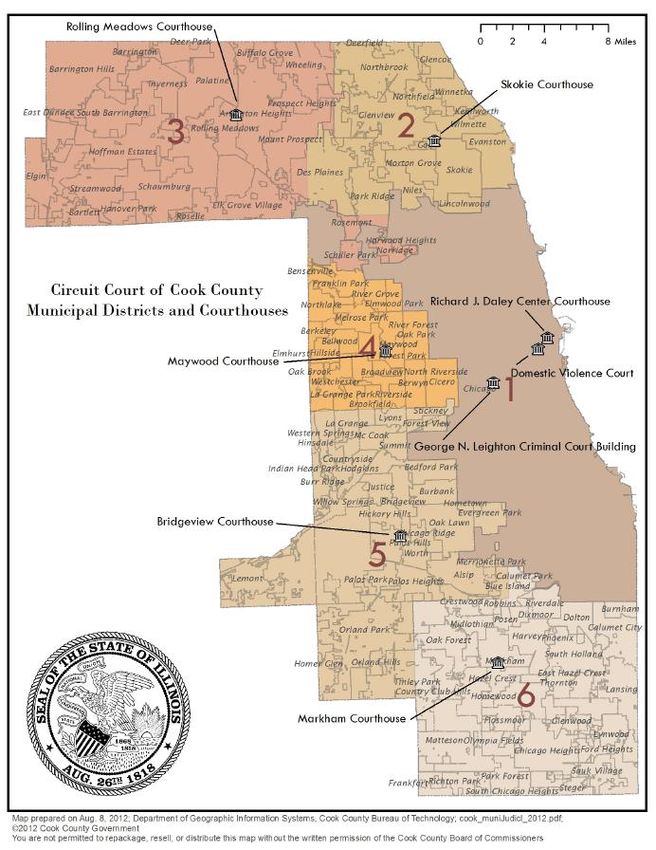
See Appendix A.2 for a map of the six districts in Cook County.
7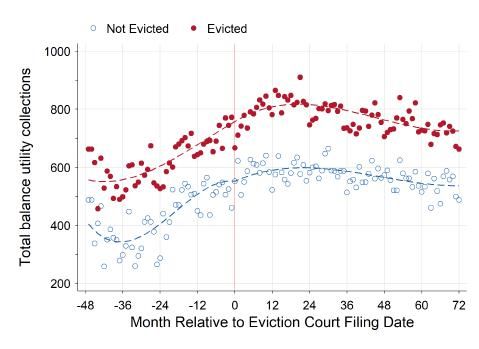
Figure 2: Eviction rate in 2010.

Notes: This figure depicts the locations of properties for which the court ordered an eviction in Chicago, along
with the rate of eviction orders by census tract. The rate is defined as the number of evictions divided by the
number of (occupied) rental units in the census tract (based on 2006-2010 American Community Survey 5-Year
Data). Estimates exclude evictions of businesses and other non-residential evictions. Overall, we find that in 2010
the eviction rate from occupied rental units was approximately 2.46 percent. This estimate uses occupied rental
units as the denominator, which may omit houses that could be, or were previously, rented. Using all housing
units in the census tract, we find an eviction rate of 0.93 percent, which provides a very conservative estimate.
There is substantial heterogeneity across tracts, with 9 tracts having eviction rates above 10 percent.

both possession and a money judgment. At the time of filing, the landlord or her attorney can
select a return date, which in Chicago is at least 14 days from the date the case is filed. In our

                                                        8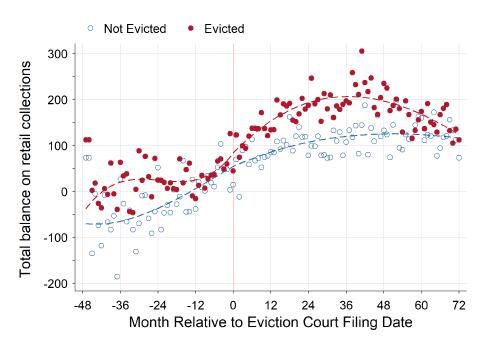
data the earliest available date is almost always selected.
             At the time of filing, the case is randomized to a courtroom on the selected date by computer
         assignment, according to the Cook County Circuit Court official policy, which became effective
         June 2, 1997 (General Order 97-5). The landlord receives a court room and time to which the
         case has been randomly assigned but does not know the name of the judge who will preside
         over the hearing. Our data allows us to recover the initial judge assignment, which we use to
         construct our instrument.13 We formally test for balance on observables in Section 5.3.
             We use the initial judge assignment for our instrument construction; however, cases may end
         up being ruled on by a different judge for three reasons. First, if the defendant has not been
         successfully served a court summons by the date scheduled for the first hearing, a new attempt
         must be made to serve the tenant, and the first hearing is rescheduled.14 In some cases, this
         means that the case is assigned to a different judge; for example, if the currently assigned judge
         is transferring out of evictions court or is on leave. Second, either party has a right to request a
         new judge assignment once, which is then re-randomized. Third, either party can request a trial
         by jury, which will result in the assignment of a jury trial judge, but these cases are rare and
         occur in approximately 3 percent of cases. Because requests for a new judge may be endogenous
         to the initial judge assignment, we use the the initial judge assignment to construct our leniency
         measure.15
             Eviction hearings are fast. Court observation studies have found that the average eviction
         hearing is completed in less than 2 minutes in Cook County (Doran et al., 2003), a finding that
         is consistent with studies of eviction court hearings elsewhere in the United States. The judge’s
         main decision is whether to grant the landlord an order for possession. In joint action cases,
         in which the landlord is also seeking a money judgment, the judge also decides the amount of
         the award. If the judge decides against an eviction order, the case is dismissed, and no money
         judgment is awarded.
             Figure 3 provides an overview of possible trajectories an eviction case can take through the
         court, as well as a breakdown of the fraction of cases that follows each path in our data. About
         two in three cases decided by a judge result in an order for eviction.
             If an eviction order is granted, the landlord then files the order for possession with the sheriff’s
         office and pays a non-refundable $60.50 administrative fee. The sheriff will then execute the
         eviction order, which involves changing the locks and removing the tenants’ possessions. The
  13
    The name of the judge potentially could be deduced in advance from public information on room assignments, but
to receive a new judge assignment, the landlord would need to appear at the first hearing and request a new judge,
which in practice rarely occurs.
  14
    If the tenant cannot be served after multiple attempts, the judge can allow the case to proceed without the
defendant, though in that case no money judgment can be awarded. In about 10 percent of cases, the case is withdrawn
prior to the tenant being successfully served which may occur if the tenant has moved out or if the tenant and landlord
reach an agreement.
  15
       We provide further details in Appendix C.3 describing how we derive this information from the case histories.

                                                            9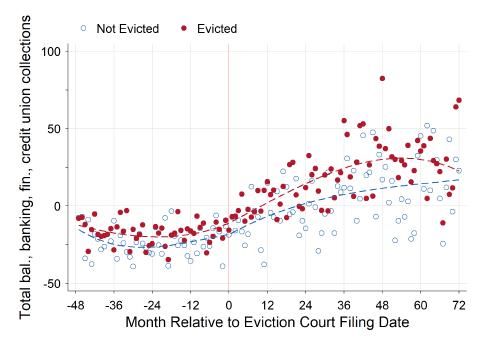
sheriff does not execute all orders for possession, because occupants can voluntarily leave after
       the judge’s order, or because the landlord may neglect to pay the sheriff or sign the required
       paperwork. Only 50 percent of the cases in our data with an eviction order are then filed with the
       sheriff’s office, and 54 percent of those are executed. Executed evictions take place on average
       two months after the eviction order is filed with the sheriff’s office, though tenants do not know
       the exact date the eviction will be executed. The Cook County sheriff’s office publishes their
       planned schedule only 3 days in advance.16

       2.3     How representative is Cook County?
       Cook County’s eviction process is broadly similar to the eviction process in many other eviction
       courts across the United States (Krent et al., 2016). Cook County is similar to other county
       courts in how long the eviction process takes, with the process from filing an eviction case to
       the execution of an eviction order taking several months. The high proportion of unrepresented
       tenants and swiftness of eviction hearings is also similar to other courts where data is available
       (Desmond, 2012; Seedco Policy Center, 2010). Cook County also has minimal public- or rent-
       controlled housing which can change landlords’ incentives to evict (Diamond et al., 2017). Like
       most cities, Cook County does not have a comprehensive social safety net aimed at preventing
       housing instability or homelessness. For example, Cook County does not have a “right to shelter”
       which would guarantee recently evicted individuals access to a homeless shelter.17
           One point of distinction between Cook County and other urban settings is that it is legal
       for a landlord to decline to extend a lease beyond its stated termination date without a specific
       reason.18 A second point of distinction is that in Cook County eviction court records are publicly
       observable even if the case ends in dismissal, whereas some courts limit the observability of
       tenants’ names in these cases.
           The backlog in the execution of eviction orders is a common feature of eviction courts in large
       metropolitan areas. Unlike warmer climate settings, however, Cook County may exhibit a more
       seasonal pattern of delays until the execution of eviction orders due to restrictions on evictions
       on cold weather days. Appendix A.2 provides further detail on Cook County’s eviction process.
  16
    Delays are around 1 month in the summer and around 3 months in the winter. Delays are determined by the
capacity constraints of the sheriff’s office and by the fact that evictions are not executed if the temperature is below 15
degrees, and typically no evictions are executed between Christmas and New Years, though the number of days for
which evictions are halted varies by year.
  17
    One way to characterize ‘generous’ homelessness policy is by whether a place has a ‘right to shelter’: a legal
mandate for local government to provide temporary homes to those who would otherwise sleep on the street. At the
moment, only D.C., Massachusetts, and New York City have RTS. In New York City, the right to shelter has been in
place for 40 years.
  18
    This is sometimes called a “no cause” eviction and is allowed in most U.S. cities. However, places that prohibit or
place restrictions on “no cause” evictions include Seattle, San Francisco, Oakland, Berkeley, LA, San Diego, New York
City, New Jersey, and New Hampshire.

                                                            10
Figure 3: The eviction court process in Cook County.
Time of randomization
Order for possession Money judgement
(66%) (74%)
Judge
(97%)
Dismissal (34%)
Landlord files court case First hearing
Order for possession Money judgement
(57%) (53%)
Jury
(3%)
Dismissal
(43%)
Notes: This figure depicts the possible paths eviction cases can take through the court system. Percentages are
calculated for our baseline analysis sample.
3 Data
This section describes our data sources, linkage procedures, and sample selection criteria.19
3.1 Court records
Our data set on court histories includes the near universe of single action and joint action eviction
cases filed in Cook County in the years 2000-2016. We assembled this data through collection
of public records, supplemented with data sourced from Record Information Services (RIS), a
private company that compiles public records in Illinois. The resulting case-level data set includes
the defendant’s name and address, which we use for linking, and includes detailed histories of the
events that were entered into the electronic case file, beginning with the filing by the landlord or
his attorney. Case details include information on the case type (single or joint action), filing date,
plaintiff name, defendant name, attorney name (on both sides), judge name, presence of legal
assistance, the amount of money claimed by the plaintiff in a joint action case, details of each
19
Further details on data cleaning and linkage are available in Appendix C.3.
11hearing and motion filed throughout the case history – including information such as a request
for a trial by jury, and the judge ruling at the conclusion of the case. Importantly, the court
records include all eviction orders and all money judgments issued by the judge. We supplement
these data with records from the sheriff’s office on court summons and the timing of forcible
evictions from 2010-2016, which were obtained via FOIA request. Using tenant addresses, we
also append detailed information on neighborhood characteristics using public-use 2010 census
data.
Sample restrictions on court records Our sample of court cases includes all cases filed
between January 1, 2000 and December 31, 2016. We exclude from our analysis cases that were
not concluded by the end of this period. The full sample includes 772,846 named individuals
in 583,871 cases. As laid out in Appendix Table 9, we first drop eviction cases associated with
businesses, cases associated with condominiums, cases where the name of the defendant is not
provided, and cases involving more than $100,000 in claimed damages. After these restrictions,
we are left with 729,125 named individuals across 560,670 cases, which represent our main sample
of court records. We use this sample to construct leniency measures and link to credit bureau
data. For our IV analysis, we further restrict cases to those seen by judges who oversaw at
least 10 cases that year and to weeks in which at least two judges were assigned to cases in
that district. This sample of cases includes 615,965 named individuals in 477,919 cases, and
includes 251 judges who see more than 10 cases in any year, and nearly 750 judge-year stringency
observations. The average judge in our sample oversees more than 700 cases per year.
Conceptualizing treatment and counterfactual
We define a case as ending in eviction if the judge issues an order for possession. An order for
possession is the legal authorization for the landlord to have the sheriff execute a lockout and
remove the tenant from the unit. Throughout the paper, we will refer to an order for possession
as an ‘eviction order’ for clarity of exposition.20
Cases that do not end in an eviction order are dismissals. Importantly, there are multiple
types of dismissals. A dismissal “with prejudice” means the landlord is not allowed to bring
another eviction case with the same allegations against the tenant; a dismissal “without prejudice,”
on the other hand, permits the landlord to bring the case again.21
Dismissals have many benefits over eviction for the tenants. Tenants whose cases end in
dismissal avoid the stigma associated with an eviction order, such as additional screening or
penalty in future rental contracts. Tenants may additionally avoid having a civil judgment on
20
Our definition of an eviction order is similar to the one used by Desmond et al. (2018b) which estimates the number
of evictions by county.
21
Dismissals may also be recorded as “dismissed by stipulation or agreement,” which may involve settlements in which
the tenant agrees to move out or a payment agreement is made. A dismissal does not necessarily mean the tenant will
continue to live in the unit.
12their credit report, which occurs if there is a money judgment in a joint action case. Finally,
dismissals make it more likely that the tenant will be able to remain in their current residence,
though this is not guaranteed. For example, cases can be dismissed without prejudice due to the
landlord and the tenant reaching an agreement where the tenant moves out. Table 10 decomposes
cases by their outcomes and shows that less than 3 percent of cases end with a verdict for the
defendant or the case being dismissed with prejudice, the outcomes that are most likely to allow
the tenant to stay in the unit.
We explore robustness to our definition of the binary treatment in Appendix F.5. In particular,
we consider three alternative definitions of the treatment: (1) cases with either a dismissal with
prejudice or a verdict for the defendant, in which the tenant is more likely to remain in the unit
(2) an eviction order that is also sent to the sheriff’s office and executed. Approach (2) is not our
preferred empirical approach, however, because the exclusion restriction under this specification
is unlikely to hold, since only 50 percent of eviction orders are filed with the sheriff’s office, and
only 27 percent are filed with the sheriff’s office and executed. Orders filed with the sheriff’s
office conditional on the judge granting an order for possession are not random, and we do not
have an additional source of exogenous variation to identify the separate effects of sheriff’s office
filing or execution.
3.2 Credit bureau records
Our primary measures of financial strain come from credit files held by Experian, one of the
3 largest credit bureaus in the United States. Avery et al. (2003) provide a detailed overview
of this data. Our credit report data are biennial snapshots from March of 2005 to 2017, and
September of 2010. For our analysis of residential moves, we exclude the September 2010 sample
for ease of interpretation so that move probabilities are defined over constant two-year intervals.
We have two credit panels. One is the panel that is linked to our courtroom sample. The second
is a panel of a 10 percent random sample of individuals from Cook County zipcodes.
We analyze the following sets of financial outcomes: overall financial health, unpaid bills,
and an indicator for having an open auto loan or lease, which serves as a proxy for durable
consumption. We also study the effect on home ownership, which we observe as an open mortgage
trade in the credit file. We also study demand for high interest loans using subprime borrowing
data, described below.
The outcome measures are described in detail in the Appendix and are briefly described here.
All dollar amounts are expressed in 2016 dollars using the CPI-U for the Chicago metro area.
We measure overall financial health using VantageScore 3.0, which is on a scale of 300-850;
scores under 600 are considered subprime. We measure unpaid bills using total balances in
collection. Collections represent unpaid debt, such as credit card balances, which the original
lender decides to turn over to a collections agency following a period of delinquency (typically at
least 30 days). Our proxy for durable goods consumption is any positive balance on an auto
13loan or lease, following an approach similar to Dobkin et al. (2018) and Dobbie et al. (2018).
We also measure the presence of any open mortgage trade. An individual will appear in the
data as having a mortgage trade if they are a signatory on any mortgage loan with a positive
balance, whether it is for their primary residence, an investment property, or the co-signed loan
of a parent, relative, or partner.
The credit bureau has supplementary information including zip code of residence and demo-
graphic information including gender and year of birth.22 We use zipcode of residence to track
residential moves; a nice feature of the data is that it allows us to track moves throughout the
United States and its territories, which has not been done in the eviction setting. There are 215
zipcodes in Cook County, and hence we observe a relatively fine level of geography.23
Our credit bureau data is also linked to the largest database of subprime borrowing behavior,
which includes over 62 million consumers. We measure demand for high interest loans using
inquiries into and openings of high-interest single payment microloans. These account inquiries
and openings include those originating from either online or storefront subprime lenders. We
observe subprime loan inquiries for all months between September 2011 and November 2018; we
observe subprime account openings for all months between January 2010 and November 2018.
We emphasize that we only observe subprime borrowing activity for consumers who have a record
in our main credit file. Approximately 32 percent of our credit record sample have a payday
loan account inquiry at some point in the sample period, and about 6 percent open an account.
These data are described in more detail in Appendix C.2.
3.3 Data linkage and sample restrictions
Evictions case data were linked by Experian to credit report archives by searching name and
address identifiers against its master file that includes a name and address history. The overall
match rate is 61.2 percent, which is slightly lower but in the range of match rates of studies
that use a similar strategy to link administrative data sources.24 In our analysis, we restrict the
sample to those individuals who are matched to a credit report prior to the eviction filing date,
so that the match is not endogenous to the eviction order.
Our sample population are those who are “credit visible,” meaning they have a credit record.
22
Landlords do not observe evictions directly on a credit report, but evictions may be included in the aggregated
category of civil judgments if the eviction order includes a money judgment. In those cases, credit bureaus report the
presence of a money judgment and the judgment amount awarded by the court.
23
From our discussions with data experts at Experian, addresses are recorded through the reporting and inquiry
process, and the zipcode is not necessarily the most recent address reported, but is the modal address of recently
reported zipcodes. See Lee and van der Klaauw (2010) for a detailed description of the FRBNY consumer credit panel,
which is a similar dataset to the one used here, and Molloy and Shan (2010), which uses it to track residential moves
surrounding foreclosure.
24
For example, Dobkin et al. (2018) are able to match 72 percent of their Medicaid sample when additionally using
SSNs for matching, and the Oregon Health Experiment has a match rate of 68.5 percent.
14The Consumer Financial Protection Bureau reports that in low-income neighborhoods, slightly
more than 70 percent of adults have a credit record (Brevoort et al., 2015). We expect this
number to be far higher in our population, since having a utility bill alone would be enough to
generate a credit record, and individuals with their name on a lease are likely to have had a
utility bill.25
To better understand our sample and how it relates to the overall population of tenants in
eviction court, we explore characteristics of credit record matches in Appendix D. Appendix
Table 12 shows that evicted tenants are 1.8 percentage points less likely to be matched to a credit
record, male tenants are less likely to be matched, and tenants without legal representation are
1.5 percentage points less likely to be matched, while tenants in richer neighborhoods are more
likely to be matched.
We explore attrition in Appendix Table 11. We show that, conditional on being matched to a
baseline year t credit bureau file, the probability of appearing in a subsequent credit bureau file
is over 99 percent in each of the subsequent file years. We also show that attrition is unrelated to
stringency: we regress an indicator for appearing in a subsequent filing year on judge stringency
for each pair of years in the sample, and cannot reject a null effect of stringency on appearing in
a future credit bureau record for any pair of years.
3.4 Summary statistics
Table 1 presents summary statistics for the sample used in the IV analysis (columns 1 and 2),
and compares this sample to our 10 percent random sample from Cook County that has been
reweighted to match the neighborhood distribution of eviction cases (column 3).
There are a few interesting patterns to highlight. First, the eviction court sample is far
more likely to be female (61 percent compared to 50 percent) and is slightly younger than the
random sample (38 years old, on average, compared to 44.8 in the random sample). Evicted
tenants are more likely to be black than non-evicted tenants, although we note that our race
measure is imprecise because we use a probabilistic imputation based on first name, last name,
and neighborhood, and adopt an 85 percent probability threshold.
Note that the neighborhood characteristics are similar to the random sample by construction,
because of reweighting. It is striking how much debt tenants in eviction court are carrying
relative to the random sample from the neighborhood: the average collections balance for tenants
in eviction court is over $3,000, compared to about $1650 for the random sample. The event
studies presented in the next section will show that most of this debt originates from before the
25
Up until 2016, People’s Gas, the main natural gas provider in Chicago, provided “full-file” reporting to credit
bureaus, allowing individuals who would otherwise have no credit score due to thin or no credit history to have a credit
score, potentially helping many build credit (Turner et al., 2008, 2012). As pointed out by PERC (2006), Illinois was
one of the only states with any utility company making full-file reports, which suggests that a much larger portion of
our sample may have credit scores and credit histories compared to comparable cities in other states.
15Table 1: Summary statistics: IV sample
Evicted Not Evicted Random sample
Person characteristics
Age at case 38.321 (14.520) 38.269 (14.893) 44.790 (17.496)
Female 0.612 (0.487) 0.609 (0.488) 0.502 (0.500)
Black 0.527 (0.499) 0.490 (0.500)
Case Characteristics
Eviction order 1.000 (0.000) 0.000 (0.000)
Ad Damnum Amount (1000s) 2.585 (3.976) 2.275 (4.094)
Joint Action 0.838 (0.368) 0.800 (0.400)
Tenant Pro Se 0.970 (0.170) 0.945 (0.229)
Landlord Pro Se 0.254 (0.435) 0.246 (0.431)
Neighborhood Characteristics
Median household inc. (1000s) 47.171 (17.635) 49.555 (18.960) 47.704 (17.753)
Poverty Rate 18.644 (9.736) 17.673 (9.759) 18.401 (9.721)
Median Rent 961.337 (168.940) 983.322 (192.677) 967.762 (177.051)
Pct. White 0.351 (0.289) 0.382 (0.292) 0.358 (0.290)
Pct. Black 0.492 (0.375) 0.456 (0.372) 0.483 (0.374)
Subsequent Outcomes (12-36 mo.)
Credit Score 526.856 (66.656) 545.247 (79.027) 618.154 (103.580)
Total bal. collections 3,814.293 (4,752.086) 3,088.753 (4,379.230) 1,137.576 (2,693.680)
Any Auto Loan or Lease 0.138 (0.341) 0.197 (0.394) 0.118 (0.299)
Num. Payday Inquiries 1.129 (6.576) 1.190 (6.991) 0.623 (8.008)
Num. Payday Accounts Opened 0.033 (0.356) 0.047 (0.432) 0.023 (0.510)
The table above presents means and standard deviations (in parentheses) of key variables in our linked credit bureau sample used in the
IV analysis. The random sample has been reweighted to match the distribution of individuals across neighborhoods in the eviction sample.
See notes in the text for the sample restrictions. Race was imputed using last name and Census track (Imai and Khanna, 2016; Khanna
et al., 2017).
eviction filing.
One strength of our data is that we can follow individuals across different eviction cases
throughout our 2000-2016 sample period, using our anonymized credit bureau identifiers. The
table reports the fraction of our eviction sample with a subsequent eviction case, at the same
address and at a different address. Eviction tenants are likely to appear again in eviction court:
a tenant who is evicted has a 4 percent chance of appearing in eviction court again within 36
months at the same address, and a 17 percent chance of appearing in eviction court at a different
address, compared to 12 percent and 18 percent, respectively, for the non-evicted tenants. Note
that tenants who are evicted by the court may have a future case at the same address, if, for
example, the landlord decides to allow the tenant to remain in the unit after the first eviction
order or does not file the order with the sheriff.
164 Descriptive evidence: selection and the evolution
of financial strain
This section provides new descriptive evidence about selection into eviction court, the impact of
eviction, and how financial health evolves both before and after the eviction case is filed.
4.1 Selection into eviction
Our research design aims to address two forms of selection bias present when studying evictions.
First, selection into eviction court is not random and, second, the outcome of the court case is
not random.
The empirical approach that has been available to researchers studying eviction thus far is a
comparison of evicted tenants to observationally similar renters in the neighborhood (Desmond
and Gershenson, 2016; Desmond and Shollenberger, 2015; Desmond and Kimbro, 2015). This
literature uses multivariate regression or propensity score matching to estimate the effect
of eviction, assuming that, conditional on observables, eviction is effectively random. This
assumption is quite strong, because evicted individuals and individuals not facing an eviction
case may differ in unobservable ways – such as their health or job prospects – which are likely
correlated with eviction and likely to affect future outcomes. We now document the importance
of selection into eviction court and show how the effect attributed to eviction changes when the
comparison group is non-evicted tenants rather than renters from the neighborhood.
For our first analysis, we append the 10 percent random sample from Cook County to our
court sample, restricting the random sample to those over age 21 who are non-homeowners (i.e.
with no open mortgage trade) and randomizing a placebo filing month. We also re-weight the
regression sample so that the random sample of individuals matches our eviction court sample in
their distribution across neighborhoods.
Comparing our eviction court sample to the random sample, we can replicate the large
negative effect of eviction found in the literature. The first bar of Figure 4 shows the average
credit score difference between evicted individuals and individuals from similar neighborhoods
and shows a nearly 100 point difference. For context, the credit score is on a scale of 300-850,
and 300-579 is considered “very poor.” The second bar adds controls for age, gender, and year
and does little to close this gap. These analyses suggest large differences in level between evicted
individuals and similar individuals from the neighborhood, but do little to capture selection into
eviction court on unobservables such as recent financial or labor market shocks.
The third bar of Figure 4 compares evicted and non-evicted tenants within the eviction court
sample; the average difference in credit score is reduced to less than 30 points, providing strong
evidence that there is substantial selection into eviction court. This difference changes little
when controlling for observable covariates. Finally, the fifth bar additionally controls for lagged
17credit score prior to the eviction case. Controlling for baseline levels further reduces the gap by
approximately half, demonstrating that there is selection into the eviction decision even once we
restrict our comparison to those in eviction court.26
These results suggest that there are two important sources of selection that must be addressed
when considering the causal impacts of eviction: selection into eviction court and selection into
the eviction order. To deal with the first source of selection, we use court records that allow us
to compare evicted individuals to individuals in eviction court who were not evicted. To deal
with the second source of selection, we employ a judge-IV strategy which we describe in more
detail in Section 5. For the remainder of the paper we use the eviction court sample. We now
turn to the dynamics of financial strain surrounding the eviction filing.
Figure 4: Selection into eviction court
0
−20
Diff in Credit Score (12−36 m)
−40
−60
−80
−100
1 2 3 4 5
1) Evicted VS Matched 2) Evicted VS Matched (controls)
3) Evicted VS Not Evicted 4) Evicted VS Not Evicted (controls)
5) Evicted VS Not Evicted (controls and lag) 95% CI
Notes: This figure depicts selection into eviction court, and selection into an eviction order, conditional on having an eviction
filing. Column 1 plots the difference in credit score at 12-36 months after filing, for the court sample v. the random sample
(for which the filing date is assigned at random). Column 2 is reproduces column 1 with demographic controls (age, gender,
and year). Column 3 plots the difference in credit score at 12-36 months after filing, for evicted v. non-evicted in the court
sample. Column 4 reproduces column 3 with demographic controls. Column 5 reproduces column 4 with an additional control
for individual mean credit score over the pre-filing period.
26
Appendix Figure 12 depicts the time path of selection into eviction court for all main analysis variables. This
figure shows selection by financial strain, as measured by levels of indebtedness and demand for payday loans, for both
evicted and non-evicted tenants, relative to the random sample.
184.2 Event studies
This section presents the event study analysis, which is based on comparisons of court-ordered
evictions to dismissals, for the sample of tenants who appear in court. This analysis allows us to
study the dynamics into and out of eviction court separately by the outcome of the case. We use
the following regression, where r indexes the month relative to the eviction case filing:
F
X F
X
yit = γt + δ × Ei + βr + δr × Ei + it (4.1)
r=S r=S
In the above equation, Ei represents an indicator for the case outcome being eviction, βr
represents coefficients on indicators for month relative to the case filing month, and δr are the
coefficients on indicators for relative month interacted with the eviction outcome. For this
analysis S = −41, F = 72, and the omitted month is S = −42. The only controls included are
calendar year dummies (γt ). Figure 6 plots the βr , depicted as open circles, as well as these
coefficients added to δ + δr , depicted as closed circles; for both sets of coefficients we add in the
non-evict mean in S = −42 so that the magnitudes are easy to interpret.27
Overlaid on these nonparametric event studies, we depict a parametric specification of
Equation 4.1, where the right hand side variables include a cubic polynomial in relative month
prior to eviction filing (r < 0), a cubic polynomial in relative month for the months following
eviction filing (r ≥ 0), and these two cubic polynomials interacted with the eviction case outcome.
Again, we add in the baseline mean for ease of interpretation, and the only controls are calendar
year dummies. Note that we require the polynomials on either side of the eviction filing to meet
at r = 0, a choice motivated by the non-parametric event studies, which do not suggest a discrete
jump at the time of filing.
Figure 6 reports results of the event study for several sets of outcomes, while Appendix
Table 13 reports difference-in-difference estimates of the parametric specification at different time
horizons, relative to r = −12. As above, Figure 6 shows that tenants who appear in eviction court
have very poor credit in the run up to eviction and that those whose case ends in eviction have
worse credit than the non-evicted group in the baseline. Both groups experience deteriorating
credit scores in the 24 months prior to the filing date. Remarkably, the two groups’ credit scores
remain broadly parallel throughout the sample period, suggesting that eviction does not have
an additional scarring effect on credit score for the evicted group. We explore this hypothesis
further in the instrumental variables analysis. It is notable, however, that it takes 4-5 years for
the two groups to return to their pre-eviction peak.
The top right panel depicts a different pattern for total balances in collections. Collections
represent unpaid debt, such as credit card balances, which the original lender decides to turn
27
There is a tradeoff between including a longer time series and introducing composition effects in the coefficients.
Appendix Table 14 shows robustness to several alternative specifications that include restricting to a balanced panel,
adding individual fixed effects, and restricting the sample to individuals’ first cases.
19over to a collections company following a period of delinquency (typically at least 30 days).28
The top right panel of Figure 6 shows that in the run-up to eviction court, both groups have high
amounts of collections debt and experience rising balances in collections that are approximately
parallel. After eviction, the evicted group experiences a steeper rise in balances in collection.
The difference at 36 months is 159 dollars, a small difference relative to the average ad damnum
amount sought by the landlord. The difference is also small when compared to tenants’ average
pre-filing balance in collections. Appendix Figure 13 further disaggregates the collections into
the four largest collections categories, revealing that utilities and retail debt represent the biggest
increases, while medical debt increases only slightly.
Evictions may be mechanically related to collection debt if the defendant does not pay the
money judgment associated with the eviction case. In this situation, the plaintiff can use the court
process to collect the money, including obtaining a citation to discover assets, wage garnishment,
and using a collections agency. In Appendix Figure 13, we explore this possibility by presenting
the collections event study separately by case type. This figure shows a broadly similar evolution
of collections debt in cases for which the plaintiff seeks no money judgment, suggesting the
apparent effect is not mechanical. Note that the average collections debt never returns to the
pre-eviction court average.
The next two panels of Figure 6 depict the results for durable goods consumption and
homeownership.29 The auto loan variable exhibits a flat or slightly increasing trends in the
run-up to eviction court, followed by a drop after filing, along with a widening between evicted
and non-evicted tenants. This suggests a decrease in expenditures or consumption. Note that
even non-evicted tenants exhibit this pattern of decreased consumption following the filing, which
reflects that both groups of tenants are experiencing strain that coincides with the filing. We will
show in the next subsection that they both experience high move rates.30 With the mortgage
indicator, the most striking pattern is the steep drop in evicted tenants’ probability of having a
mortgage loan following eviction, from 8 percent to 4-5 percent, and this drop persists for the
entire 72 month period.
We now turn to subprime borrowing behavior, which includes single payment microloan
inquiries and account openings. Our data includes both online and storefront loans, and provides
insight into the demand for cash advances among tenants in eviction court. The left panel of
Figure 7 shows the event study for inquiries into payday loans, depicting a dramatic increase in
28
Collections remain on the credit report for up to 7 years from the date the debt first became delinquent and was
not brought current; after 7 years is it automatically removed from the report.
29
Following Dobbie et al. (2017) and Dobkin et al. (2018), we proxy durable good consumption with the presence of
an auto loan or lease
30
Note that these descriptive results are not sensitive to how we define a court-ordered eviction. In Appendix Table
17 we show event studies separately by whether a dismissal is “with prejudice,” meaning the case is dismissed and the
landlord may not bring the case again with the same allegations. These event studies disaggregated by case outcome
display the same broad descriptive facts.
20You can also read