The Galaxy Activity, Torus and Outflow Survey (GATOS) - arXiv
←
→
Page content transcription
If your browser does not render page correctly, please read the page content below
Astronomy & Astrophysics manuscript no. paper-I-GATOS-torus-revised                                                                     ©ESO 2021
                                               June 23, 2021

                                                            The Galaxy Activity, Torus and Outflow Survey (GATOS)
                                                                    I. ALMA images of dusty molecular tori in Seyfert galaxies
                                                  S. García-Burillo1 , A. Alonso-Herrero2 , C. Ramos Almeida3, 4 , O. González-Martín5 , F. Combes6 , A. Usero1 , S.
                                                 Hönig7 , M. Querejeta1 , E. K. S. Hicks8 , L. K. Hunt9 , D. Rosario10 , R. Davies11 , P. G. Boorman12 , A. J. Bunker13 ,
                                                L. Burtscher14 , L. Colina15 , T. Díaz-Santos16 , P. Gandhi7 , I. García-Bernete13 , B. García-Lorenzo3, 4 , K. Ichikawa17 ,
                                                     M. Imanishi18, 19 , T. Izumi18, 19 , A. Labiano15 , N. A. Levenson20 , E. López-Rodríguez21, 22 , C. Packham23 ,
                                                M. Pereira-Santaella15 , C. Ricci24, 25 , D. Rigopoulou13 , D. Rouan26 , T. Shimizu11 , M. Stalevski27, 28 , K. Wada29, 30, 31 ,
                                                                                                    and D. Williamson7
arXiv:2104.10227v2 [astro-ph.GA] 22 Jun 2021

                                                                                                  (Affiliations can be found after the references)

                                                                                                       Received: April, 2021; Accepted:–, –

                                                                                                                    ABSTRACT

                                               We present the first results of the Galaxy Activity, Torus and Outflow Survey (GATOS), a project aimed at understanding the properties of the
                                               dusty molecular tori and their connection to the host galaxy in nearby Seyfert galaxies. Our project expands the range of Active Galactic Nuclei
                                               (AGN) luminosities and Eddington ratios covered by previous surveys of Seyferts conducted by the Atacama Large Millimeter Array (ALMA)
                                               and allows us to study the gas feeding and feedback cycle in a combined sample of 19 Seyferts. We used ALMA to obtain new images of the
                                               emission of molecular gas and dust using the CO(3–2) and HCO+ (4–3) lines as well as their underlying continuum emission at 870 µm with high
                                               spatial resolutions (0.100 ∼ 7 − 13 pc) in the circumnuclear disks (CND) of 10 nearby (D < 28 Mpc) Seyfert galaxies selected from an ultra-hard
                                               X-ray survey. Our new ALMA observations detect 870 µm continuum and CO line emission from spatially resolved disks located around the AGN
                                               in all the sources. The bulk of the 870 µm continuum flux can be accounted for by thermal emission from dust in the majority of the targets. For
                                               most of the sources the disks show a preponderant orientation perpendicular to the AGN wind axes, as expected for dusty molecular tori. The
                                               median diameters and molecular gas masses of the tori are ∼ 42 pc, and ∼ 6 × 10⁵ M , respectively. We also detected the emission of the 4–3
                                               line of HCO+ in four GATOS targets. The order of magnitude differences found in the CO/HCO+ ratios within our combined sample point to a
                                               very different density radial stratification inside the dusty molecular tori of these Seyferts. We find a positive correlation between the line-of-sight
                                               gas column densities responsible for the absorption of X-rays and the molecular gas column densities derived from CO towards the AGN in our
                                               sources. Furthermore, the median values of both column densities are similar. This suggests that the neutral gas line-of-sight column densities
                                               of the dusty molecular tori imaged by ALMA contribute significantly to the obscuration of X-rays. The radial distributions of molecular gas in
                                               the CND of our combined sample show signs of nuclear-scale molecular gas deficits. We also detect molecular outflows in the sources that show
                                               the most extreme nuclear-scale gas deficits in our sample. These observations find for the first time supporting evidence that the imprint of AGN
                                               feedback is more extreme in higher luminosity and/or higher Eddington ratio Seyfert galaxies.
                                               Key words.     Galaxies: individual: NGC 613, NGC 1068, NGC 1326 NGC 1365, NGC 1433 NGC 1566, NGC 1672, NGC 1808 NGC 3227,
                                               NGC 4388, NGC 4941, NGC 5506, NGC 5643, NGC 6300, NGC 6814, NGC 7213, NGC 7314, NGC 7465, NGC 7582– Galaxies: ISM – Galaxies:
                                               kinematics and dynamics – Galaxies: nuclei – Galaxies: Seyfert – Radio lines: galaxies

                                               1. Introduction                                                              Herrero et al. 2018, 2019; Impellizzeri et al. 2019; García-
                                                                                                                            Burillo et al. 2019; Domínguez-Fernández et al. 2020). These
                                               The fueling of super-massive black holes (SMBHs), a common                   different manifestations of the outflow phenomenon constitute a
                                               element of the spheroidal components of galaxies, explains the               key ingredient to understanding the co-evolution of galaxies and
                                               onset of nuclear activity. High-resolution observations of molec-            SMBHs.
                                               ular gas in nearby Active Galactic Nuclei (AGN) have played                      The simplest version of the unified model of AGN explains
                                               a key role in addressing the question of AGN fueling (e.g. see               their observational properties as only due to different lines of
                                               reviews by García-Burillo & Combes 2012; Storchi-Bergmann                    sight toward the central engine. In type 2 AGN the obscuring
                                               & Schnorr-Müller 2019). These observations have also revealed                material blocks our view of the Broad Line Region (BLR) and
                                               that gas accretion onto SMBHs and their hosts can be regu-                   only emission from the narrow line region (NLR) is seen (e.g.
                                               lated through the launching of molecular outflows in galaxies                Antonucci & Miller 1985; Antonucci 1993; Krolik & Begelman
                                               (e.g. Fluetsch et al. 2019; Lutz et al. 2020; Veilleux et al. 2020).         1988; Urry & Padovani 1995). Type 1 AGN have an unobscured
                                               Molecular outflows have been mapped across a wide range of                   view and thus emission from both the BLR and NLR is observed.
                                               spatial scales in different galaxy populations. In the particular            Different observational properties led to an initial description of
                                               case of nearby AGN, these outflows have been imaged on nu-                   the obscuring material as an optically and geometrically thick
                                               clear scales in dusty molecular tori and their surroundings (∼tens           torus (e.g. Pier & Krolik 1992, 1993), although other geome-
                                               of pc), but also on the larger scales typical of circumnuclear disks         tries were also considered, including flared, tapered and warped
                                               (CND) (∼hundreds of pc) (García-Burillo et al. 2014; Morganti                disks (e.g. Sanders et al. 1989; Efstathiou & Rowan-Robinson
                                               et al. 2015; Gallimore et al. 2016; Aalto et al. 2017; Alonso-               1995). More recently, the simplest version of unifying theories
                                                                                                                                                                        Article number, page 1 of 41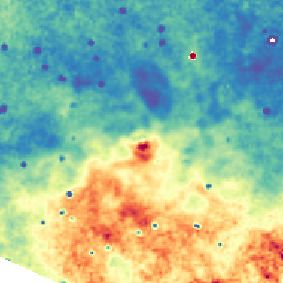
A&A proofs: manuscript no. paper-I-GATOS-torus-revised

has been debated due to the large observed spread in proper-           sure near the inner walls of the torus can lift up material from
ties of the toroidal obscuration in AGN (Ramos Almeida et al.          the equatorial plane and launch a dusty and molecular wind. Un-
2009a, 2011; Alonso-Herrero et al. 2011; Elitzur 2012; Mateos          der certain conditions part of this material can rain back down
et al. 2016; García-Bernete et al. 2019). The application of the       onto the equatorial plane (see Wada et al. 2016) or loop back to-
torus paradigm has also been questioned in the early universe,         wards the inner region on ballistic orbits (see Williamson et al.
where conditions may be significantly different from those ob-         2020). In this new scenario for the torus, the equatorial and po-
served locally (Netzer 2015).                                          lar components both contribute to the obscuration of the central
     In the canonical scheme, the torus is expected to be located      engine and the nature of the obscuring material around AGN is
between the BLR and the NLR and extend to parsec scales. More          complex (see reviews by Ramos Almeida & Ricci 2017; Hönig
complex models were developed in recent decades as the com-            2019).
munity started to probe the morphology, content, and radial ex-             Atacama Large Millimeter Array (ALMA) observations with
tent of the circumnuclear gas in active galaxies (see e.g. the re-     physical resolutions of a few parsecs to ∼ 10 − 20 pc are provid-
views by Bianchi et al. 2012; Ramos Almeida & Ricci 2017).             ing strong support for this scenario. The first ALMA detection
The first torus models were static and, for computational reasons,     of an AGN torus was for the Seyfert galaxy NGC 1068 (García-
the dust was distributed homogeneously (Pier & Krolik 1992,            Burillo et al. 2016; Gallimore et al. 2016; Imanishi et al. 2018;
1993; Granato & Danese 1994; Efstathiou & Rowan-Robinson               García-Burillo et al. 2019; Impellizzeri et al. 2019; Imanishi
1995). The torus size was allowed to range from compact (a few         et al. 2020). The measured torus diameter (ranging from 7 to up
parsecs) to a few hundred parsecs, depending on the model. With        to 30 pc) from a variety of molecular transitions and dust contin-
the introduction of the so-called clumpy torus model (Nenkova          uum emission is a factor of a few larger than found by the mid-IR
et al. 2002, 2008a,b), obscuration depends not only on the incli-      observations, which are tracing warmer emission originating in
nation but also on the number of clouds along the line of sight,       a more compact region. More recently, the K-band observations
i.e., on the covering factor. Clumpy torus models received obser-      done with the VLT/GRAVITY instrument have imaged the inner
vational support from the measurement of significant variations        dust sublimation region inside the torus of NGC 1068 (Grav-
in the absorbing column density derived from X-ray observa-            ity Collaboration et al. 2020). The NGC 1068 torus is not by any
tions on timescales ranging from days to years (e.g. Risaliti et al.   means unique. Relatively large (diameters of up to 20-50 pc) and
2002; Markowitz et al. 2014).                                          massive (∼ 105 − 107 M ) tori/disks are detected in cold molec-
     The detection of extended mid-infrared emission along the         ular gas in local Seyferts, low-luminosity AGN, and compact
torus polar direction, initially in NGC 1068 and later on in other     obscured nuclei (Aalto et al. 2017; Alonso-Herrero et al. 2018;
nearby AGN, prompted the inclusion of a polar component in the         Izumi et al. 2018; Salak et al. 2018; Alonso-Herrero et al. 2019;
models (see Efstathiou et al. 1995; Gallagher et al. 2015; Hönig       Aalto et al. 2019; Combes et al. 2019; Audibert et al. 2019; Aalto
& Kishimoto 2017; Stalevski et al. 2017). The mid-infrared polar       et al. 2020; Audibert et al. 2020). The nuclear tori/disks detected
component has been observationally resolved on parsec scales           with ALMA are not found in isolation at the centers of AGN but
with interferometry (Tristram et al. 2009; Hönig et al. 2012;          are well connected with molecular gas in the galaxy disk and can
Burtscher et al. 2013; Hönig et al. 2013; López-Gonzaga et al.         be decoupled both morphologically and kinematically from their
2014; Tristram et al. 2014; López-Gonzaga et al. 2016) and ex-         host galaxies. Rather than a simple compact rotating structure,
tends out to a few hundred parsecs as revealed by ground-based         the torus also appears to be highly turbulent (García-Burillo et al.
imaging facilities (Radomski et al. 2003; Packham et al. 2005;         2016) and possibly outflowing (Gallimore et al. 2016; Alonso-
Galliano et al. 2005; Roche et al. 2006; Asmus et al. 2016;            Herrero et al. 2018; García-Burillo et al. 2019; Impellizzeri et al.
García-Bernete et al. 2016; Asmus 2019). Polar dust might also         2019; Aalto et al. 2020). Theoretical arguments and dynamical
provide a natural explanation to the apparent isotropy of the in-      simulations suggest that these phenomena could be associated
frared emission observed in AGN, irrespective of obscuring col-        with the “outflowing torus” scenario described above.
umn density (e.g. Gandhi et al. 2009; Levenson et al. 2009; As-             This is the first paper in a series aimed at understanding the
mus et al. 2015; Fuller et al. 2019).                                  properties of the dusty molecular tori1 and the connection to
     The static “torus” and disk-wind models are effectively the       their host galaxies in nearby Seyfert sources. This is one of the
starting point for more realistic dynamical models to explain          main goals of our Galaxy Activity, Torus, and Outflow Survey
the formation, maintenance and the eventual disappearance of           (GATOS). In the second paper of this series (paper II: Alonso-
the obscuring material around AGN. On small scales the height          Herrero et al. 2021 in prep.; hereafter AH21), we will study the
of the obscuring material is proposed to be maintained by the          relation between the torus and polar dust emissions and compare
AGN radiation pressure (Pier & Krolik 1992), infrared radia-           them with predictions from disk+wind models. To select our
tion pressure (e.g. Krolik 2007; Williamson et al. 2019; Hönig         Seyfert galaxies, we used the 70 month Swift/BAT 14 − 195 keV
2019; Venanzi et al. 2020; Tazaki & Ichikawa 2020), magnetic           all-sky catalog (Baumgartner et al. 2013) to draw our parent
support (Emmering et al. 1992; Elitzur & Shlosman 2006; Chan           sample from. This catalog provides a sample that is unbiased
& Krolik 2017; Vollmer et al. 2018; Kudoh et al. 2020; Lopez-          of obscuration/absorption, even up to column densities of NH '
Rodriguez et al. 2020), and/or stellar feedback (Wada & Norman         1024 cm−2 as well as providing a nearly complete selection for
2002). Radiation hydrodynamical simulations including some of          nearby AGN at LAGN (14-150 keV)> 1042 ergs−1 . Optical and IR
these physical processes predict the launch of outflows. These         AGN surveys, on the other hand, can be incomplete for nearby
can extend to scales of tens of parsecs mostly along the polar         galaxies and biased against AGN with strong star-formation ac-
direction (Wada 2012, 2015; Wada et al. 2016; Chan & Kro-              tivity. We imaged with ALMA the emission of molecular gas and
lik 2016, 2017; Williamson et al. 2020). These simulations also        1
                                                                          Hereafter we use the term dusty molecular ‘torus’ to denote the com-
produce outflow components along the equatorial direction of           pact disk detected both in dust continuum and molecular line emission
the nuclear torus/disk. The new paradigm is now a “dynamical           around the central engine, and which tends to show an equatorial ge-
torus” that has the inflowing (but also outflowing, see Venanzi        ometry relative to the AGN wind/jet axis. The detailed internal mor-
et al. 2020) reservoir of fueling material along the equatorial        phology of this dusty molecular disk feature is nevertheless still to be
plane. The boosted acceleration due to infrared radiation pres-        determined.

Article number, page 2 of 41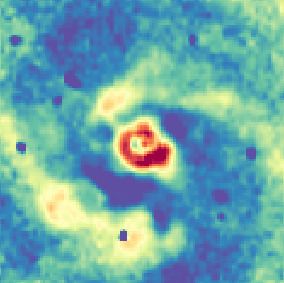
S. García-Burillo et al.: The Galaxy Activity, Torus and Outflow Survey (GATOS)
dust in the CND of our targets using the CO(3–2) and HCO+ (4– tios (∼10−6.5 –10−3.5 ) and AGN luminosities (LAGN (2-10 keV) ∼
3) lines and their underlying continuum emission, with spatial 1039.1−41.3 erg s−1 ) compared to the GATOS core sample (see
resolutions ' 000. 1 (7-13 pc). The use of these transitions al- Combes et al. 2019, and Table 1). Hereafter, when we refer
lows us to probe simultaneously a range of physical conditions to NUGA targets we will leave out NGC 1365, which satisfies
(n(H2 ) ' a few 104 -a few106 cm−3 , T K ≥ 20 − 50 K) that are the selection criterion used in the definition of GATOS sources.
well suited to probing the bulk of the gas reservoirs in the typ- The sample used in this paper, listed in Table 1, contains three
ical CND environments of AGN, which are known to host pre- additional GATOS targets that have already been observed by
dominantly dense and hot molecular gas (García-Burillo et al. ALMA in previous cycles in band 7 with a frequency cover-
2014; Viti et al. 2014; García-Burillo et al. 2016; Gallimore et al. age, a spatial resolution and sensitivity similar to those of the
2016; Imanishi et al. 2018; Impellizzeri et al. 2019; Imanishi core sample, namely, NGC 1068 (García-Burillo et al. 2019),
et al. 2020). As an additional advantage of the use of the 3–2 NGC 1365 (Combes et al. 2019), and NGC 3227 (Alonso-
line of CO, the analysis of the CO spectral line energy distribu- Herrero et al. 2019). As can be seen from Fig. 1, the selection
tion of the radiation-driven fountain model of the torus discussed of GATOS sources listed in Table 1 probes a range of ∼2 dex
by Wada et al. (2018) showed that the CO–to–H2 conversion fac- in AGN luminosities (LAGN (2-10 keV) ∼ 1041.4−43.5 erg s−1 )
tor has a comparatively weaker dependence on the intensity for and ∼2.7 dex in Eddington ratios (∼10−3.0 –10−0.3 ), encompass-
mid–J CO lines. Furthermore, the obtention of 351 GHz contin- ing both unabsorbed (NH 1022 cm−2 , ∼type 2) AGN including Compton-thick ob-
content of tori by keeping low the contribution from other mech- jects (NH >1024 cm−2 ). Furthermore, the combination of GATOS
anisms alien to thermal dust emission, which can be prevalent at and NUGA samples, contributing 13 and 6 targets, respectively,
lower frequencies. allows us to compile a list of 19 suitable nearby AGN. Our com-
The paper is organized as follows. We present in Sect. 2 the bined sample spans a range of ∼6 dex in Eddington ratios and
GATOS sample. Sect. 3 describes the ALMA observations and ∼4.5 dex in AGN luminosities. Since our combined sample cov-
ancillary data used in this work. Sect. 4 describes the decom- ers a relatively small volume (D < 28 Mpc), it probes prefer-
position of the submillimeter continuum images of our Seyfert entially lower luminosities with respect to the overall Swift/BAT
galaxies and derives the sizes, orientations and masses of their sample, as illustrated by the probability density functions (PDF)
dusty disks. A description of the molecular gas distributions de- shown in Fig. 1. One of the benefits of the Swift/BAT selec-
rived from the CO(3–2) line maps is included in Sect. 5. We tion criteria is that it allows us to recover a large fraction of
compare the images and line ratios derived from the CO(3–2) the Compton-thick AGN population in the luminosity range we
and HCO+ (4–3) lines in Sect. 6. Sect. 7 discusses the relation probe (see Fig. 3b of Ricci et al. 2015). We plan to extend
between the dusty molecular tori and X-ray emission in our our sample with ALMA to higher luminosities in a forthcom-
Seyferts. Sect. 8 compares the radial distribution of molecular ing study. The main difference between the Swift/BAT and the
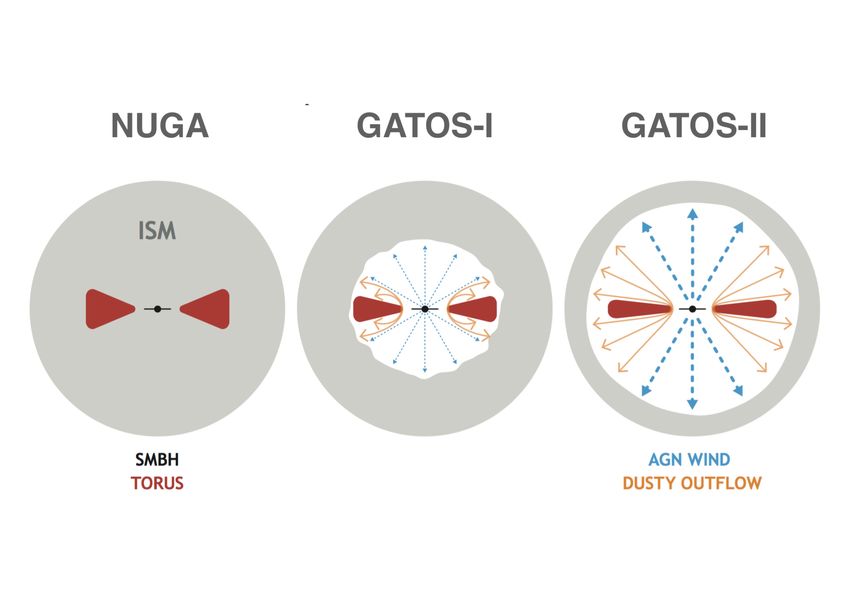
gas in NUGA and GATOS Seyferts and describes a scenario ac- NUGA+GATOS samples shown in Fig. 1 can be explained by
counting for the imprint of AGN feedback. The main conclu- the fact that the all-sky Swift/BAT survey is flux-limited (Baum-
sions of this work are summarized in Sect. 9. gartner et al. 2013). These differences are exacerbated when the
PDF of NUGA and Swift/BAT targets are compared, as NUGA
preferentially selects nearby (D < 17 Mpc; Combes et al. 2019)
2. The sample low-luminosity AGN.
We initially selected a volume-limited sample from the Appendix A provides a short description of some of the main
Swift/BAT catalog of AGN with distances of 10 − 40 Mpc in the properties derived from previous observations obtained at opti-
southern hemisphere (declinations below +20◦ ) for our ALMA cal, near infrared, radio centimeter and X-ray wavelengths for
observations. We set the lower distance limit in order not to the galaxies of the GATOS core sample. In particular, we adopt
include low luminosity AGN since these are targeted by other the orientation (major axis) and extent (opening angle) of the
ALMA programs (see below). The upper limit to the distance ionized winds in the galaxies of the core sample derived from the
allows for a reasonably sized sample of 31 local AGN and suf- references listed in Appendix A. Furthermore, the parameters of
ficient spatial resolution to isolate the dusty molecular tori with the ionized winds in the three additional GATOS targets listed
ALMA. All our targets have modeled 14-195 keV observations in Table 1 are adopted from Das et al. (2006) for NGC 1068
from which the X-ray column densities (NH ) and intrinsic (ab- (see also Barbosa et al. 2014; May & Steiner 2017; Mingozzi
sorption corrected) hard and ultra hard X-ray luminosities in the et al. 2019), Venturi et al. (2018) and Mingozzi et al. (2019) for
2 − 10 keV and 14 − 150 keV bands, respectively, are derived NGC 1365, and Alonso-Herrero et al. (2019) for NGC 3227.
(Ricci et al. 2017a).
We finally selected a subset of 10 targets within the GATOS
sample defined above for the new ALMA Cycle 6 obser- 3. Observations
vations presented in this paper. This is hereafter referred to 3.1. ALMA data
as the GATOS core sample. We limited the distances to <
28 Mpc to be able to spatially resolve tori as small as ∼ We observed the emission of the CO(3–2) and HCO+ (4–3) lines
10 pc with an angular resolution of ∼ 000. 1 and the luminosi- and their underlying continuum emission in the CND of our
ties to LAGN (14-150 keV) ≥ 1042 ergs−1 to complement ongo- targets with ALMA during Cycle 6 and 7 using band 7 re-
ing ALMA surveys of nearby Seyferts such as the Nuclei of ceivers (project-IDs: #2017.1.00082.S and #2018.1.00113.S; PI:
Galaxies (NUGA) survey (Combes et al. 2019; Audibert et al. S. García-Burillo). The phase tracking centers of the galaxies
2019). The NUGA sample includes seven nearby low-luminosity were taken from the All Sky–2MASS survey (Skrutskie et al.
Seyfert galaxies: NGC 613, NGC 1326, NGC 1365, NGC 1433 2006). We note however that the positions of the AGN in each
NGC 1566, NGC 1672, and NGC 1808. With the exception of galaxy have been determined in this work through a fit of the
NGC 1365, which is also originally part of the GATOS sam- continuum emission, as detailed in Sect. 4. We used a single
ple, the sources of NUGA have significantly lower Eddington ra- pointing with a field-of-view (FOV) of 1700 . Observations were
Article number, page 3 of 41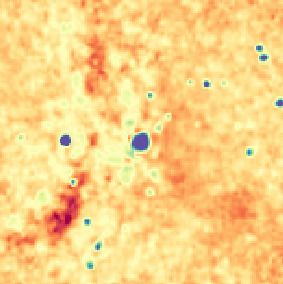
A&A proofs: manuscript no. paper-I-GATOS-torus-revised

                                                                                                                                                                          [e]
    Name         α[a]
                  2000           δ[a]
                                  2000      Dist[b]   Hubble type[b]      AGN type[b]        PAphot [c]   iphot [c]          [d]
                                                                                                                      log10 L14−150 keV
                                                                                                                                                 [d]
                                                                                                                                          log10 L2−10 keV   log10 LLAGN
                                                                                                                                                                    Edd
                                                                                                                                                                                          [d]
                                                                                                                                                                                log10 N(H)Xabs
                                 ◦ 0 00                                                          ◦           ◦
                 h m s
                                            Mpc            –                 –                                            erg s−1            erg s−1             —                   cm−2
    NGC6300   17:16:59.473   -62:49:13.98    14.0        SB(rs)b               Sy2             120          53              42.3               41.7             -1.9                23.3
    NGC5643   14:32:40.778   -44:10:28.60    16.9       SAB(rs)c               Sy2              98          30              43.0               42.4             -1.3                25.4
    NGC7314   22:35:46.230   -26:03:00.90    17.4      SAB(rs)bc           Sy1.9, S1h            3          70              42.2               42.2             -1.2                21.6
    NGC4388   12:25:46.820   +12:39:43.45    18.1        SA(s)b            Sy1.9, S1h           91          90              43.0               42.5             -1.1                23.5
    NGC4941   13:04:13.143   -05:33:05.83    20.5     (R)SAB(r)ab              Sy2              22          37              42.0               41.4             -2.4                23.7
    NGC7213   22:09:16.260   -47:09:59.95    22.0        SA(s)a        Sy1.5, radio-source     124          39              42.3               41.9             -3.0                20.0
    NGC7582   23:18:23.621   -42:22:14.06    22.5     (R’)SB(s)ab           Sy2 , S1i          156          68              43.2               43.5             -1.7                24.3
    NGC6814   19:42:40.576   -10:19:25.50    22.8      SAB(rs)bc              Sy1.5            108          52              42.6               42.2             -1.6                21.0
    NGC5506   14:13:14.901   -03:12:27.22    26.4      Sa peculiar         Sy1.9, S1i           89          90              43.2               43.0             -2.3                22.4
    NGC7465   23:02:00.952   +15:57:53.55    27.2      (R’)SB(s)0           Sy2, S3            162          64              42.0               41.9             -2.2                21.5
    NGC1068   02:42:40.771   -00:00:47.84    14.0       (R)SA(rs)b            Sy2               73          35              42.7               42.8             -0.3                25.0
    NGC1365   03:33:36.458   -36:08:26.37    18.3      (R’)SBb(s)b            S1.8              23          63              42.3               42.1             -2.8                22.2
    NGC3227   10:23:30.570   +19:51:54.30    23.0      SAB(s)a pec            S1.5             156          68              42.8               42.4             -1.2                21.0

Notes. [a] Phase tracking centers of the band 7 ALMA observations used in this work, which cover the GATOS core sample of 10 galaxies, listed
first, and three additional targets from the literature: NGC 1068 (García-Burillo et al. 2019), NGC 1365 (Combes et al. 2019), and NGC 3227
(Alonso-Herrero et al. 2019). [b] Distances are median values of redshift-independent estimates from the Nasa Extragalactic Database (NED)
after excluding select measurements from unreliable or outdated references; Hubble and AGN type taken from NED. In addition to the standard
classification as a function of AGN class (1, 2, and intermediate types: 1.n, where n ranges from 5 to 9 and numerically larger subclasses have
weaker broad-line components relative to the narrow lines, following the notation of Osterbrock (1981)), some objects are classified as S1h or S1i
if broad polarized Balmer lines or broad Paschen lines in the infrared are detected, respectively, according to the nomenclature of Véron-Cetty
& Véron (2006). [c] Position angle (PAphot ) and inclination (iphot ) of the optical disks based on photometric estimates taken from HyperLeda a .
[d] Luminosities of hard X-rays (L14−150 keV and L2−10 keV ) and gas column densities of obscuring material (N(H)Xabs ) are taken from Ricci et al.
(2017a); L14−150 keV and L2−10 keV are intrinsic luminosities (corrected for absorption) and re-scaled to the adopted distances. [e] Eddington ratios
( LLAGN
    Edd
        ) taken from Koss et al. (2017).
a
    http://leda.univ-lyon1.fr/

Table 1. Main properties of the sample used in this paper

    Name        σcont[MSR−HSR]     σCO[MSR−HSR]       σHCO+ [MSR−HSR]                     beamMSR                                       beamHSR                    FOV               LAS
                 µJy beam−1        mJy beam−1          mJy beam−1                00
                                                                                      × 00 @◦ (pc × pc)                       00
                                                                                                                                    × 00 @◦ (pc × pc)             00
                                                                                                                                                                    (kpc)            00
                                                                                                                                                                                       (pc)
    NGC6300         36-45           0.52-0.62           0.79-1.00          000. 13 × 000. 10@ − 44◦ (9 × 8)             000. 11 × 000. 08@ − 21◦ (8 × 6)          17 (1.2)          4 (280)
    NGC5643         32-38           0.52-0.57           0.77-1.00           000. 12 × 000. 10@114◦ (10 × 8)                000. 09 × 000. 08@122◦ (8 × 7)         17 (1.4)          4 (340)
    NGC7314         25-27           0.45-0.50           0.61-0.69         000. 17 × 000. 15@ − 4◦ (15 × 13)                000. 14 × 000. 10@11◦ (12 × 9)         17 (1.5)          4 (350)
    NGC4388         36-45           0.62-0.63           0.84-0.99           000. 14 × 000. 12@89◦ (13 × 11)             000. 12 × 000. 09@102◦ (11 × 8)           17 (1.5)          4 (360)
    NGC4941         24-33           0.48-0.58           0.60-0.73          000. 15 × 000. 11@103◦ (15 × 11)             000. 13 × 000. 07@103◦ (13 × 7)           17 (1.7)          4 (410)
    NGC7213         54-60           0.45-0.60           0.56-NA               000. 08 × 000. 07@107◦ (9 × 8)                000. 07 × 000. 06@93◦ (8 × 7)         17 (1.9)          4 (440)
    NGC7582         43-46           0.55-0.65           0.75-0.91          000. 17 × 000. 15@146◦ (19 × 17)                000. 13 × 000. 11@5◦ (15 × 12)         17 (1.9)          4 (450)
    NGC6814         24-29           0.42-0.54           0.53-NA           000. 12 × 000. 08@ − 61◦ (14 × 9)                000. 09 × 000. 07@99◦ (10 × 8)         17 (1.9)          4 (460)
    NGC5506         31-36           0.51-0.59           0.65-0.79         000. 21 × 000. 13@ − 61◦ (28 × 17)           000. 18 × 000. 09@ − 57◦ (24 × 12)         17 (2.2)          4 (530)
    NGC7465         23-30           0.42-0.56           0.49-0.67         000. 12 × 000. 08@ − 31◦ (16 × 11)            000. 08 × 000. 07@143◦ (11 × 9)           17 (2.3)          4 (540)
    NGC1068         46-46           0.23-0.23           0.28-0.28           000. 13 × 000. 07@100◦ (9 × 5 )                 000. 04 × 000. 03@74◦ (3 × 2)         17 (1.2)         1.8 (130)
    NGC1365           30               0.60                  –            000. 08 × 000. 06@ − 59◦ (12 × 10)                                 –                    17 (1.6)          3 (275)
    NGC3227           31               0.51                  –              000. 10 × 000. 09@21◦ (12 × 10)                                  –                    17 (2.0)          1 (120)

Notes. Columns (2), (3), and (4) list the range of 1σ sensitivities for the continuum as well as for the CO and HCO+ line observations. Line
sensitivities are derived for channels of 10 km s−1 -width (except for NGC 1068, where García-Burillo et al. (2019) used 20 km s−1 -wide channels).
The range in columns (2)–to–(4) accounts for the moderate spatial resolution data sets (MSR) and the high spatial resolution data sets (HSR)
obtained by using a different robust weighting parameter of the visibilities in the UV plane: robust = 1 (0.1) for the MSR (HSR) configuration;
these are available for all sources except for NGC 3227. Columns (5) and (6) list the range of spatial resolutions (in 00 and pc) reached for the MSR
and HSR observations respectively. The field-of-view (FOV) and largest scale recovered (LAS) are listed in columns (7) and (8) in 00 and kpc and
pc, respectively.

Table 2. Parameters of the ALMA observations

designed to cover the emission of molecular gas and dust in-                             that are mostly relevant to image both the dusty molecular tori
side the CND (r ≤ 600 − 1200 pc) of the ten selected Seyfert                             and the connection to their hosts (r ∼ 200 pc). Observations typ-
galaxies of the GATOS core sample using a common average                                 ically required the execution of two tracks (one track per each
angular resolution of ∼ 0.100 , which translates into a spatial scale                    configuration set) conducted between December 2017 and Au-
∼ 7 − 13 pc for the range of distances to our targets. We com-                           gust 2019 and the use of ∼ 43 − 49 antennas of ALMA (see
bined two sets of configurations of the ALMA array: extended                             Table 2 for details).
(C43-6) and compact (C43-3). This mix of configurations as-
sured that the largest angular scale recovered in our maps is                                Four spectral windows of 1.875 GHz-bandwidth were
about ∼ 400 = 300 − 500 pc, enough to recover a sizeable frac-                           placed, two in the lower side band (LSB) and two in the upper
tion of the flux inside the FOV and virtually all the flux at scales                     sideband (USB). This setup allowed us to observe the CO(J =
                                                                                         3 − 2) line (345.796 GHz at rest) and the continuum emission
Article number, page 4 of 41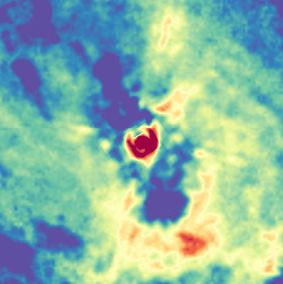
S. García-Burillo et al.: The Galaxy Activity, Torus and Outflow Survey (GATOS)

                            44
                                       Unabsorbed                  Absorbed              Compton thick
                                                                                      NGC7582
                                 log (L/LEdd)

                                 1
                                 2
     10keV(AGN) [erg s 1]

                                                               NGC5506
                            43   3                                                           NGC1068

                                                                            NGC4388              NGC5643
                                                NGC3227
                                                NGC6814NGC7314
                                                             NGC1365
                                                     NGC7465
                            42   NGC7213
     log L2

                                                                          NGC6300

                                                                              NGC4941
                                                                                                  GATOS
                                                                         NGC613                   NUGA
                            41     20                       22                      24                     26
                                                         X-ray log NH [cm 2]

Fig. 1. Left panel: Comparison of the distribution of intrinsic AGN luminosities measured in the 2-10 keV X-ray band (corrected for absorption)
and the column densities, NH , derived from hard X-rays, as measured by Swift-BAT in the 14-150 keV band for the combined GATOS sample
listed in Table 1 (star markers) (Ricci et al. 2017a). We also include the data of NGC 613 from the NUGA sample (Combes et al. 2019) (circle),
which also has NGC 1365 as a target in common with GATOS. Symbols are color-coded to reflect the Eddington ratios estimated by Koss et al.
(2017). Right panel: Comparison of the probability density function (PDF) of AGN luminosities in the 2-10 keV band for the combined sample
of GATOS and NUGA (gray-filled histogram) and the Swift-BAT sample of Ricci et al. (2017a) (blue histogram). We identify the distribution of
NUGA targets by the hatched area. This figure illustrates the complementarity of NUGA and GATOS samples in covering a significant (∼4.5 dex)
range of intrinsic AGN luminosities with the combined sample of 19 nearby Seyferts used in this work.

(343.901-344.101 GHz at rest) in the LSB bands, as well as                                                      were derived selecting areas free from emission in all chan-
HCO+ (J = 4 − 3) (356.734 GHz at rest) and the continuum                                                        nels. We summarize in Table 2 the relevant parameters of the
emission (355.845-358.000 GHz at rest) in the USB bands. We                                                     ALMA observations for the ten galaxies of the GATOS core
calibrated the data making use of the ALMA reduction package                                                    sample. We also list the parameters of the ALMA observations
CASA (McMullin et al. 2007)2 . The calibrated uv-tables were ex-                                                of the three galaxies used to complete the sample used in this
ported to GILDAS3 to proceed with the continuum subtraction                                                     work (NGC 1068, NGC 3227, and NGC 1365). For these galax-
and imaging procedures as detailed below. We first subtracted                                                   ies there are ALMA data published by García-Burillo et al.
the continuum from each of the spectral (u, v) data sets using                                                  (2019) (NGC 1068), Alonso-Herrero et al. (2019) (NGC 3227),
the GILDAS task UV-BASELINE. We fitted a baseline to the (u, v)                                                 and Combes et al. (2019) (NGC 1365), which have spatial reso-
data sets through a polynomial of degree zero masking the line                                                  lutions and sensitivity requirements comparable to those of the
emission around each transition with a range of velocity widths                                                 GATOS core sample.
∼ 300 − 600 km s−1 adapted for each target and subsequently ob-
tained continuum-free spectral line images for CO(J = 3−2) and
HCO+ (J = 4 − 3). We derived images of the continuum emission                                                   3.2. Ancillary data
by averaging in each of the two sub-bands centered around spec-                                                 3.2.1. Archival HST images.
tral lines those channels free of line emission using the GILDAS
tasks UV-FILTER and UV-CONT, making use of the same velocity                                                    We downloaded fully reduced optical images from the Hub-
width masks employed by the UV-BASELINE task. The line-free                                                     ble Legacy Archive (HLA)4 taken with the WFPC2/PC instru-
continuum emission images were combined with the genuine                                                        ment on board the Hubble Space Telescope (HST) using the
continuum images obtained in the remaining bands to produce                                                     broad-band filter F606W, except for NGC1068, for which we
a noise-weighted average image of the continuum emission at an                                                  use the narrower filter F547M. For the galaxy NGC7314 we also
average frequency range = 350.570 − 351.133 GHz (at rest).                                                      retrieved an image in the broad-band filter F450W. The HLA
     The flux accuracy is estimated to be about 10–15%, i.e., in                                                WFPC2 images are drizzled to a pixel size of 0.0500 using the
line with the goal of standard ALMA observations at these fre-                                                  MultiDrizzle software. In order to construct V − H color im-
quencies. We obtain for each galaxy two sets of angular reso-                                                   ages of the targets, we downloaded either NICMOS or WFC3
lutions by changing in the GILDAS task UV-MAP the robust pa-                                                    near-infrared images in the broad-band filter F160W, except for
rameter (b) from 1 (in the moderate spatial resolution data set,                                                the galaxy NGC7314, for which no near-infrared HST images
hereafter MSR) to 0.1 (in the high spatial resolution data set,                                                 are available and the two optical filters mentioned above were
hereafter HSR). The line data cubes were binned to a common                                                     used instead. Details of the optical and near-infrared observa-
frequency resolution of 11.7 MHz (equivalent to ∼10 km s−1 in                                                   tions are shown in Table B.1 of Appendix B. The HLA NIC-
band 7). The point source sensitivities in the line data cubes                                                  MOS and WFC3 images are drizzled to pixel sizes of 0.0500 and
                                                                                                                0.0900 respectively, whereas those downloaded from the Mikul-
2
    http//casa.nrao.edu/
3                                                                                                               4
    http://www.iram.fr/IRAMFR/GILDAS                                                                                https://hla.stsci.edu/

                                                                                                                                                     Article number, page 5 of 41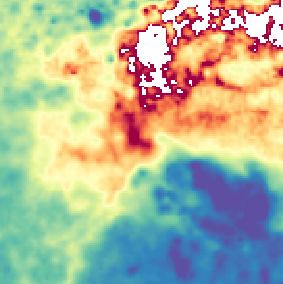
A&A proofs: manuscript no. paper-I-GATOS-torus-revised

ski Archive for Space Telescopes (MAST) Portal5 , which were             been seen to extend over scales of tens of parsecs in AGN
processed with either the CALNIC or CALWF3 pipelines, have               (Combes et al. 2019; García-Burillo et al. 2019; Alonso-Herrero
pixel sizes of 0.07500 and 0.12800 respectively. We corrected the        et al. 2019). Alternatively, dust emission may also arise from
astrometry of the images using the position of reference stars in        components oriented in the polar direction. Polar dust emission
the field from Gaia data release 2 (Gaia DR2; Gaia Collaboration         can extend over scales of tens or hundreds of parsecs.
et al. 2018). Corrections typically ranged from 000. 1 to 000. 5.            ALMA high-resolution images of the submillimeter contin-
                                                                         uum in the circumnuclear disks of Seyfert galaxies, similar to the
                                                                         GATOS sample galaxies shown in Figs 2-to-4, have neverthe-
3.2.2. X-ray observations: NuSTAR                                        less shown that this emission can also arise from various physical
The Nuclear Spectroscopic Telescope Array (NuSTAR) is the first          mechanisms not necessarily related to dust. A significant fraction
focusing hard X-ray telescope with high sensitivity6 . This gives        of the submillimeter continuum can also be attributed to non-
the advantage to observe with a single mode from 3 to 79 keV,            thermal synchrotron emission or to thermal free-free emission
perfectly suited to study the AGN reflection component. There-           of the ionized plasma. The former originates either from small
fore, we used the hard band spectrum observed with NuSTAR                radio-jets or from compact subparsec-scale AGN cores. While
(Harrison et al. 2013), including both FPMA and FPMB fo-                 these components are generally detected at cm wavelengths in
cal plane modules. We looked for NuSTAR observations for our             radio-quiet AGN (Nagar et al. 1999; Mundell et al. 2000; Ulves-
sample using the High Energy Astrophysics Archive Research               tad & Ho 2001; Orienti & Prieto 2010), they can also contribute
Center (HEASARC) archive7 , finding observations for 11 AGN              to the submillimeter flux at scales that would be unresolved by
of our sample. We chose the longest exposure if several observa-         ALMA (García-Burillo et al. 2014; García-Burillo et al. 2019;
tions were available.                                                    Alonso-Herrero et al. 2019; Combes et al. 2019; Pasetto et al.
    NuSTAR data reduction was done using the data analysis soft-         2019; Rosario et al. 2019).
ware NuSTARDAS (v.1.4.4) distributed by HEASARC. The cali-                   NGC 1068 is a well-studied case that illustrates the need
brated, cleaned, and screened event files were generated using           for high-resolution observations to disentangle this complexity.
the nupipeline task. A circular region of 1 arcmin radius was            García-Burillo et al. (2019) used the information available from
taken to extract the source and background spectrum on the same          cm and mm-wavelengths (e.g.; Hönig et al. 2008; Krips et al.
detector and to compute the response files (RMF and ARF files)           2011, and references therein) and estimated that the fraction of
using the nuproducts package within NuSTARDAS. Finally, we               the 870 µm-emission that can be attributed to dust at the location
used the grppha task to group the spectra with at least 60 counts        of the AGN source of NGC 1068 is ≤ 10% (knot S1, according
per bin. We used the NuSTAR data in the range 3–70 keV.                  to the nomenclature used by Gallimore et al. 1996). Most of the
                                                                         submillimeter flux in the S1 knot arises from free-free emission
                                                                         of the ionized plasma at scales ≤ 1 pc. However, after exclud-
4. Continuum maps                                                        ing the circumnuclear disk regions close to the radio-jet trail and
                                                                         the S1 knot (imaged by Gallimore et al. 1996, 2004), García-
4.1. Morphology of the emission                                          Burillo et al. (2019) concluded that the bulk of the submillimeter
                                                                         continuum can be attributed to dust emission.
Figures 2-to-4 show the continuum maps derived at the (rest) fre-
quency ∼ 351 GHz (870 µm) in the central ∆α × ∆δ = 100 × 100
regions of the GATOS core sample galaxies. The maps were ob-             4.2. Decomposition of continuum emission: point sources
tained from the ALMA MSR datasets. A feature common to all                    and extended components
the images is the presence of disk-like morphologies where we
identify by eye two main components: 1) a bright unresolved              In this section we make a morphology-wise decomposition of
point source, and 2) a spatially-resolved extended component             the submillimeter (870µm) continuum images of the GATOS
characterized by lower surface brightness emission. A visual in-         sample galaxies, as a first step to gauge the geometry (ex-
spection of Figs 2-to-4 indicates that there is a large variance in      tent, orientation) and mass content of dusty disks (‘tori’) and
the contributions of point sources and extended components to            their connections. This type of decomposition, made possible
the total flux in the galaxies of our sample8 . The extended com-        thanks to the high spatial resolution and high-sensitivity capa-
ponents adopt different elongated morphologies, which appear             bilities of ALMA, is instrumental in minimizing the contribu-
to be oriented mostly perpendicular relative to the AGN wind             tion of sources unrelated to dust emission (see also discussion in
axes in the majority of our sources (see discussion in Sect. 4.5).       Pasetto et al. 2019). With this aim we fitted the continuum im-
     We expect that the contribution of thermal dust emission            ages of the MSR and HSR datasets using a combination of point-
at (rest-frame) frequencies ∼ 351 GHz, which falls on the                like and 2D elliptical Gaussian sources in order to quantify the
Rayleigh-Jeans portion of the submillimeter spectral energy dis-         contribution of each family of components. The precise knowl-
tribution, dominates in normal star-forming and starburst galax-         edge of the ALMA beams allows for an accurate estimate of the
ies. The submillimeter flux has been instrumental in deriving the        contribution of the unresolved components. In particular, the un-
total gas mass in different galaxy populations (e.g. Siebenmor-          certainties on the sizes and orientations of the ALMA beams,
gen & Krügel 2007; Draine et al. 2007; Galametz et al. 2011;             which are derived from Gaussian fits to the main lobes are typ-
Scoville et al. 2014, 2016). Continuum emission in this fre-             ically ' 000. 001 − 000. 002 and ' 1◦ − 3◦ , respectively. The fit is
quency range can be due the presence of dusty compact disks              performed in the plane of the sky to take advantage of the high-
(‘tori’) located around the central engines. This emission has           fidelity of the images obtained by ALMA. We also applied the
                                                                         same procedure to determine new fits to the data of NGC 1365
5
   https://archive.stsci.edu/                                            (Combes et al. 2019), and NGC 3227 (Alonso-Herrero et al.
6
   https://heasarc.gsfc.nasa.gov/docs/nustar/                            2019). In the case of NGC 1068 we used the torus parameters
 7
   https://heasarc.gsfc.nasa.gov                                         derived by García-Burillo et al. (2016) from the ALMA con-
 8
   A similar conclusion is drawn from an inspection of the 870 µm con-   tinuum images at 440 µm. We added these three sources to the
tinuum images obtained from the ALMA HSR dataset.                        GATOS core sample for the ensuing analysis.
Article number, page 6 of 41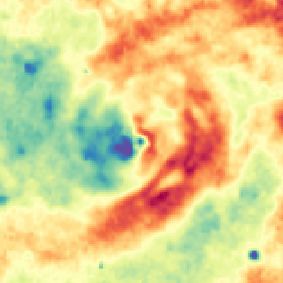
S. García-Burillo et al.: The Galaxy Activity, Torus and Outflow Survey (GATOS)

Fig. 2. Left panels: Continuum emission at the (rest) frequency range 350.6-351.1 GHz (Icont ) in the central ∆α × ∆δ = 100 × 100 regions of
NGC 4388, NGC 4941, NGC 5506, and NGC 5643, obtained from the ALMA MSR datasets. The AGN positions, identified by the blue star
markers, correspond to the location of the point sources determined by the two-component fit to the continuum emission described in Sect. 4. The
continuum maps are shown in color scale and (black) contour levels with a logarithmic spacing from –2.5σcont (dashed blue), 2.5σcont to 90% of
                      max
the peak intensity (Icont in Jy beam−1 -units) in steps of ∼0.18 dex on average. The (thick blue) contour corresponds to 1/2×Icont
                                                                                                                               max
                                                                                                                                   . The values of σcont
and the parameters of the two-component fit for each galaxy are listed in Tables 2 and 3. Middle panels: Same as left panels but after subtraction
of the fitted point source. The (red) ellipses identify the Gaussian source fitted to the extended emission centered around the position of the red star
markers. The lines highlight both the orientation (major axis) and the extent (opening angle) of the ionized winds identified in the literature for the
targets (see Appendix A), except for NGC 4941 and NGC 7213, where there is only an estimate of the orientation (major axis) of the wind. Lines
are color-coded to reflect whether the measured velocities of the ionized wind lobes are either redshifted or blueshifted. Dashed lines indicate that
the corresponding lobe is (mostly) obscured by the disk of the host. Right panels: Residuals obtained after subtraction of the sum of the point and
extended sources fitted to the data. The (grey) filled ellipses at the bottom left corners in all panels represent the beam sizes of the observations
listed in Table 2.

    We determined the best-fit solution for each galaxy using a              ical over-subtraction of the unresolved component. In a first step
three-step scheme designed, first, to minimize any potential con-            (step-1) we estimated the intensity of the unresolved component
tribution of synchrotron or free-free emission to the flux of the            (Ipoint ) using a pair of 1D-Gaussians accounting for the fluxes of
extended component while at the same time avoiding an unphys-                the unresolved and the extended components across two orthog-

                                                                                                                         Article number, page 7 of 41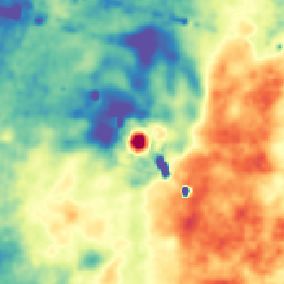
A&A proofs: manuscript no. paper-I-GATOS-torus-revised

Fig. 3. Same as Fig. 2, but for NGC 6300, NGC 6814, NGC 7213, and NGC 7314.

onal strips chosen to intersect the emission peak along PA = 0◦         separate the unresolved and extended emissions in ground-based
and 90◦ . We fixed the sizes of the point sources for each target       mid-IR images of Seyfert galaxies, also adopted in the analysis
by projecting the ALMA beams along the corresponding strips.            of AH21.
In a second step (step-2) we freely fitted both the position and
the intensity of the point source in 2D space using the average             Table 3 lists the main parameters obtained in the fitting pro-
obtained for Ipoint along both strips in step-1 as the initial value.   cedure described above. The coordinates derived from the MSR
In a third step we freely fitted a 2D elliptical Gaussian (of inten-    and HSR datasets for the point sources agree within 000. 01. We
sity IGauss ) to the residual obtained after subtraction of the point   hereafter assume that these positions likely correspond to the
source estimated in step-2. We evaluated the goodness of the fi-        AGN loci in our targets. Furthermore, the centroids derived for
nal fits by an inspection of the residuals, shown in Figs 2-to-4.       the extended components also coincide within 000. 05 with the
The two-component model is a good representation of the emis-           assumed AGN coordinates. This coincidence suggests that the
sion in all the galaxies except in NGC 7213, where the residuals        extended components have a strong physical link to the central
are seen to be exceedingly large (≥ 10σ). This scheme is simi-          engines. The equivalent full-sizes of the extended components,
lar to the Point Spread Function (PSF) scaling technique used to        defined as the sizes of the disks measured at a ∼ 3σ intensity
                                                                        level of the Gaussians used in the fits, range from ∼ 25 pc to
Article number, page 8 of 41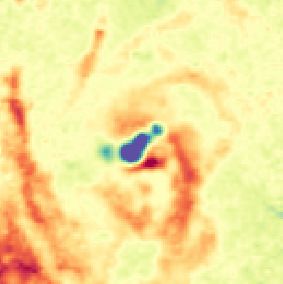
S. García-Burillo et al.: The Galaxy Activity, Torus and Outflow Survey (GATOS)

Fig. 4. Same as Fig. 2, but for NGC 7465, NGC 7582, NGC 1365, and NGC 3227.

∼ 130 pc with a median value of ∼ 42 pc (or an equivalent ra-          the largest sizes, both samples are characterized by an identical
dius of ∼ 21 pc). The latter is within the range of sizes estimated    median value of ∼ 42 pc.
for the dusty molecular tori that have been imaged by ALMA in
other Seyfert galaxies (García-Burillo et al. 2016; García-Burillo
et al. 2019; Gallimore et al. 2016; Imanishi et al. 2018, 2020;        4.3. Spectral index maps
Alonso-Herrero et al. 2018, 2019; Combes et al. 2019; Impel-
lizzeri et al. 2019; Audibert et al. 2019). Furthermore, these sizes   We describe in this section the use of spectral index maps to
are also similar to those derived for the compact gas disks im-        characterize the nature of submillimeter continuum emission in
aged in the 1–0 S(1) line of H2 in a sample of nearby Seyferts         our Seyfert galaxies.
(D ∼ 60 pc; Hicks et al. 2009).                                            Following a methodology similar to the one applied by
                                                                       García-Burillo et al. (2019) in their analysis of the continuum
    Figure 5 compares the distribution of deconvolved sizes (di-       emission of NGC 1068, we used the 230 GHz-continuum im-
ameters) for the dusty molecular tori (or polar components) de-        ages of NGC 7582, NGC 5643 and NGC 3227, published by
rived from the combined sample of NUGA and GATOS. Al-                  Alonso-Herrero et al. (2018, 2019, 2020) in combination with
though the GATOS sources seem to populate the tail showing             our 351 GHz continuum images, to derive the maps of the spec-
                                                                                                                Article number, page 9 of 41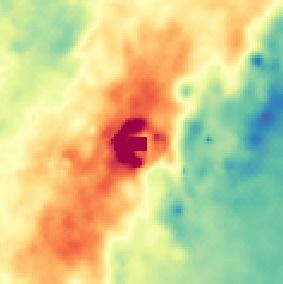
A&A proofs: manuscript no. paper-I-GATOS-torus-revised

 Name          α[a]
                2000          δ[a]
                               2000                 Ipoint [b]                    IGauss [c]          IGauss /Ipoint [d]       FWHMx [e]                      FWHMy [e]          PAGauss [e]      iGauss [e]
               h m s           ◦ 0 00                                                                                                    00                          00                 ◦             ◦
                                                     mJy                            mJy
                                                  (MSR, HSR)                    (MSR, HSR)            (MSR, HSR)              (MSR, HSR)                     (MSR, HSR)         (MSR, HSR)      (MSR, HSR)
 NGC6300    17:16:59.543   -62:49:14.04       (0.37±0.04, 0.22±0.05)    (10.52±0.17, 11.95±0.26)       (30, 55)±7          (0.65, 0.64)±0.02               (0.47, 0.46)±0.02      (85, 85)±2    (>44, >44)
 NGC5643    14:32:40.699   -44:10:27.93       (0.69±0.03, 0.67±0.04)     (3.95±0.08, 4.27±0.12)         (6, 10)±1          (0.32, 0.32)±0.02               (0.25, 0.23)±0.02        (4, 5)±2    (>39, >44)
 NGC7314    22:35:46.201   -26:03:01.58       (0.29±0.03, 0.29±0.03)     (1.43±0.06, 1.53±0.09)          (5 ,5)±1          (0.57, 0.59)±0.01               (0.29, 0.31)±0.01      (21, 30)±3    (>59, >58)
 NGC4388    12:25:46.781   +12:39:43.75       (1.86±0.04, 1.79±0.05)     (1.75±0.07, 1.92±0.11)        (1 ,1) ±0.1         (0.27, 0.26)±0.01               (0.25, 0.23)±0.01      (-43, -7)±5   (>22, >28)
 NGC4941    13:04:13.103   -05:33:05.73       (0.19±0.03, 0.16±0.03)     (1.13±0.10, 1.34±0.16)         (6, 9) ±1          (0.77, 0.73)±0.02               (0.29, 0.28)±0.02    (-27, -29)±5    (>68, >67)
 NGC7213    22:09:16.209   -47:10:00.12      (36.5±0.05, 36.10±0.06)    (39.59±0.10, 19.10±0.10)      (1, 0.5)±0.1         (0.15, 0.14)±0.01               (0.13, 0.09)±0.01      (71, 44)±8    (>30, >50)
 NGC7582    23:18:23.643   -42:22:13.54       (0.55±0.04, 0.52±0.05)     (3.32±0.16, 3.55±0.21)         (6, 7) ±1          (0.83, 0.74)±0.02               (0.43, 0.40)±0.01    (-18, -20) ±2   (>59, >57)
 NGC6814    19:42:40.587   -10:19:25.10       (0.42±0.02, 0.43±0.03)     (0.63±0.06, 0.49±0.07)       (1.5, 1)±0.1         (0.31, 0.35)±0.02               (0.21, 0.12)±0.02     (90, 61)±10    (>47, >70)
 NGC5506    14:13:14.878   -03:12:27.66       (5.07±0.03, 4.73±0.04)     (4.06±0.09, 3.96±0.11)        (1, 1)±0.1          (0.67, 0.52)±0.01               (0.38, 0.31) ±0.01     (87, 88)±2    (>55, >53)
 NGC7465    23:02:00.961   +15:57:53.21         (0.08±0.02, 53, >55)
 NGC1365    03:33:36.369   -36:08:25.50            0.15±0.04                      2.76±0.11                19±5                0.21±0.03                      0.14±0.03            50±10            >48
 NGC3227    10:23:30.577   +19:51:54.28            0.36±0.03                      2.17±0.11                 6±1                0.37±0.01                      0.24±0.01            166±2            >50

Notes. [a] Positions of the unresolved (point-like) components fitted to the continuum emission derived from the MSR and HSR datasets of the
GATOS core sample (listed first); we also include new fits to the data of NGC 1365 (Combes et al. 2019), and NGC 3227 (Alonso-Herrero
et al. 2019). [b] Intensity of the fitted point sources. [c] Spatially-integrated intensity of the elliptical Gaussians that fit the extended emission. [d]
Flux ratios between the extended components and the points sources. [e] Extent (major and minor FWHM: FWHMx,y ) and orientation (PAGauss )
of the Gaussians. We also list the lower limit to the inclinations of the extended components derived assuming axisymmetry and a negligible
thickness-to-radius (H/R) ratio for these features: iGauss =acos(FWHMy /FWHMx ).

Table 3. Parameters of the point and extended sources fitted to the continuum emission of the MSR and HSR datasets

                 Name           Size[a]                dust [b]
                                                log10 Mgas               CO [c]
                                                                  log10 Mgas        log10 NHAGN
                                                                                             2
                                                                                                [d]
                                                                                                       PAGauss [e]         PAout [ f ]        Ωout [ f ]        ∆[g]        Geometry[h]
                                  pc                 M                M               mol. cm−2              ◦                 ◦                  ◦              ◦
                                                                                                                                                                               —
                              (MSR, HSR)        (MSR, HSR)        (MSR, HSR)        (MSR, HSR)        (MSR, HSR)               –                  –        (MSR, HSR)           –
                 NGC6300         (64, 53)         (6.5, 6.6)       (6.8, 6.7)       (23.4, 23.4)        (85, 85)               18                95          (67, 67)         torus
                 NGC5643         (43, 41)         (6.3, 6.5)       (6.7, 6.7)       (23.6, 23.6)          (4, 5)               83               105          (79, 78)         torus
                 NGC7314         (60, 50)         (5.9, 5.8)       (5.8, 5.7)       (22.1, 22.1)        (21, 30)              -70                95          (89, 80)         torus
                 NGC4388         (32, 29)         (6.0, 6.0)       (5.5, 5.4)       (22.3, 22.4)        (-43, -7)              15               100          (58, 22)      mixed/ polar
                 NGC4941         (78, 74)         (5.9, 6.0)       (5.9, 5.7)       (21.9, 21.9)       (-27, -29)             -59                 –          (32, 30)      mixed / polar
                 NGC7213         (40, 34)         (7.5, 7.4)       (4.8, 4.5)      (
S. García-Burillo et al.: The Galaxy Activity, Torus and Outflow Survey (GATOS)
We assumed a dust temperature T dust ∼ T gas = 100 K and
a dust emissivity κ351 GHz = 0.0865 m2 kg−1 (Klaas et al. 2001)
to derive dust masses using the values of IGauss listed in Table 3
and a modified black-body function. In the absence of estimates
for each galaxy, we were constrained to adopt a common T dust
for all sources similar to the one used by García-Burillo et al.
(2014) and Viti et al. (2014) to fit the CO line excitation and
the continuum SED of the dusty molecular torus of NGC 1068.
Furthermore, we assumed a canonical (neutral) gas–to–dust ratio
∼ 100, which is typical of the solar metallicity environment of
the central regions of spiral galaxies (e.g; De Vis et al. 2019).
The molecular gas mass derived for the extended components
dust
are listed as Mgas in Tab. 4.
Moreover, we obtained an independent estimate of the
molecular gas mass associated with the extended components
by integrating the CO(3–2) line emission inside the areas de-
fined by the full-sizes of the best-fit Gaussian disks derived in
Sect. 4.2. In our estimate we adopted a 3–2/1–0 brightness tem-
perature ratio ∼ 2.9, which is similar to the overall ratio mea-
sured by García-Burillo et al. (2014) and Viti et al. (2014) in the
NGC 1068 torus. We purposely used NGC 1068 as template for
Fig. 5. Histograms showing the distribution of the deconvolved diame-
the sake of consistency with the assumptions made in the dust-
ters of the dusty molecular tori (or polar components) derived from the
combined sample of NUGA and GATOS (gray-filled histograms). We based estimate of Mgas . Second, we assumed a galactic CO–to–
adopt for GATOS the average sizes estimated from the MSR and HSR H2 conversion factor (XCO = 2 × 10²⁰ mol cm−2 (K km s−1 )−1 ).
datasets. The blue-filled histogram identifies the distribution of sizes of The CO-based molecular gas masses derived from Equation (3)
the tori derived for NUGA galaxies (Combes et al. 2019). of Bolatto et al. (2013), after including the mass of Helium, are
CO
listed as Mgas = 1.36 × M(H2 ) in Tab. 4. The molecular gas
masses derived for the extended components in GATOS sources
encompass a wide range ' 5 × 10⁴ − 1 × 10⁷ M , with a median
remain unresolved by ALMA. Apart from NGC 1068 and the
value of ∼ 6 × 10⁵ M .
three galaxies of Fig. 6, 230 GHz continuum images with a spa-
tial resolution ∼ 000. 1 − 000. 2 comparable to that of our 351 GHz Figure 7 (upper panel) shows also the gas masses of the
maps are not available for any of the remaining sources in our molecular tori in NUGA sources, derived using the same con-
sample. Therefore, meaningful spectral index maps cannot be version factors. The masses of NUGA tori are among the highest
obtained for the rest of the GATOS galaxies. in the combined sample: ' 2 × 10⁶ − 1 × 10⁷ M . Based on the
similar median values of the molecular tori size distributions of
Fig. 6 shows also a new version of the spectral index NUGA and GATOS sources derived in Sect. 4.2, the compara-
maps of the submillimeter continuum emission in NGC 7582, tively higher gas masses of NUGA tori point to correspondingly
NGC 5643, and NGC3227 obtained after subtraction of the point higher gas surface densities (see discussion in Sect. 8.2).
sources found in the fitting scheme described in Sect. 4.2 and Figure 7 (lower panel) compares the values obtained for
applied to the 351 GHz and 230 GHz continuum images. High dust
log Mgas and log Mgas CO
in our sample derived from the HSR
values of the spectral index ∼ 1.5 − 3 are now found more sys- dataset. Leaving aside NGC 7213 the two distributions are in rea-
tematically throughout the extended components in our sources, sonable agreement: their median values differ only by ∼ 0.23 dex
an indication that the continuum emission comes primarily from (∼ 0.16 dex if the MSR dataset is used instead), an indication that
dust in these regions. In particular, the distribution of α values in the bulk of the continuum emission of the extended components
the ‘corrected’ maps does not show any marked depression close stems from dust. In particular, after excluding NGC 7213, Mgas dust
to the AGN. On the other hand, the spectral indices derived from
and Mgas show Pearson correlation parameters ∼ +0.74 and two-
CO
the subtracted point sources are either flat (∼ 0.1 [NGC 7582];
∼ 0.3 [NGC 5643]) or steep (∼ −1.4 [NGC 3227]), a result that sided p values ∼ 6×10⁻³ for both datasets. This result is to some
seems to confirm that the unresolved components are likely as- extent expected since the extended components contain most of
sociated with free-free or a combination of dust and synchrotron the continuum emission in eight of the twelve sample galaxies.
emission. Although the flux ratios between the extended components and
the point sources show a wide range in our sample (IGauss /Ipoint ∼
0.5 − 55), their median value, ∼6, is high. The point source con-
4.4. Masses of the extended components tribution is relevant only in NGC 4388, NGC 5506, NGC 6814,
and NGC 7213, where IGauss /Ipoint ratios ≤ 1. For these sources
Continuum emission in the extended components is associated the underlying assumptions behind the subtraction scheme de-
with CO(3–2) emission in the majority of our sources, and in scribed in Sect 4.2 may compromise the H2 mass estimates for
some galaxies with dense molecular gas traced by HCO+ (4– the extended components on several counts. NGC 7213 actu-
3) emission, as shall be discussed in detail in Sects. 5.2 and ally appears as an extreme outlier in Fig. 7 (lower panel). In
dust CO
6. In this section we further test our hypothesis that the bulk NGC 7213, Mgas ∼ 500 − 900 × Mgas . A less dramatic mismatch
dust CO
of the continuum emission of the extended components can be is found in NGC 6814 where Mgas ∼ 8 × Mgas . The extended
attributed to dust by comparing the H2 mass derived from the component seems to include a significant contribution of either
351 GHz continuum and the CO(3–2) line emission, as described free-free or synchrotron emission of ionized gas in NGC 7213,
below. and possibly also in NGC 6814. Alternatively, the assumption
Article number, page 11 of 41You can also read