Bright galaxy sample in the Kilo-Degree Survey Data Release 4
←
→
Page content transcription
If your browser does not render page correctly, please read the page content below
Astronomy & Astrophysics manuscript no. KiDS-DR4-bright                                                                             ©ESO 2021
                                               January 18, 2021

                                                    Bright galaxy sample in the Kilo-Degree Survey Data Release 4
                                                                     Selection, photometric redshifts, and physical properties
                                                                               ?                   ??                  ???
                                                              M. Bilicki1 , A. Dvornik2, 3 , H. Hoekstra3 , A.H. Wright2 , N.E. Chisari4 , M. Vakili3 ,
                                               M. Asgari , B. Giblin5 , C. Heymans5, 2 , H. Hildebrandt2 , B.W. Holwerda6 , A. Hopkins7 , H. Johnston4 , A. Kannawadi8 ,
                                                        5

                                                                K. Kuijken3 , S.J. Nakoneczny9 , H.Y. Shan10, 11 , A. Sonnenfeld3 , and E. Valentijn12

                                                       1
                                                           Center for Theoretical Physics, Polish Academy of Sciences, al. Lotników 32/46, 02-668 Warsaw, Poland
                                                       2
                                                           Ruhr University Bochum, Faculty of Physics and Astronomy, Astronomical Institute (AIRUB), German Centre for Cosmological
                                                           Lensing, 44780 Bochum, Germany
arXiv:2101.06010v1 [astro-ph.GA] 15 Jan 2021

                                                       3
                                                           Leiden Observatory, Leiden University, P.O. Box 9513, NL-2300 RA Leiden, The Netherlands
                                                       4
                                                           Institute for Theoretical Physics, Utrecht University, Princetonplein 5, 3584 CC Utrecht, The Netherlands
                                                       5
                                                           Institute for Astronomy, University of Edinburgh, Blackford Hill, Edinburgh, EH9 3HJ, UK
                                                       6
                                                           Department of Physics and Astronomy, University of Louisville, 102 Natural Science Building, Louisville KY 40292, USA
                                                       7
                                                           Australian Astronomical Optics, Macquarie University, 105 Delhi Rd, North Ryde, NSW 2113, Australia
                                                       8
                                                           Department of Astrophysical Sciences, Princeton University, 4 Ivy Lane, Princeton, NJ 08544, USA
                                                       9
                                                           National Centre for Nuclear Research, Astrophysics Division, ul. Pasteura 7, 02-093 Warsaw, Poland
                                                      10
                                                           Shanghai Astronomical Observatory (SHAO), Nandan Road 80, Shanghai 200030, China
                                                      11
                                                           University of Chinese Academy of Sciences, Beijing 100049, China
                                                      12
                                                           Kapteyn Institute, University of Groningen, PO Box 800, NL 9700 AV Groningen, The Netherlands
                                                     January 18, 2021

                                                                                                                 ABSTRACT

                                                     We present a bright galaxy sample with accurate and precise photometric redshifts (photo-zs), selected using ugriZY JHKs photometry
                                                     from the Kilo-Degree Survey (KiDS) Data Release 4 (DR4). The highly pure and complete dataset is flux-limited at r < 20 mag,
                                                     covers ∼ 1000 deg2 , and contains about 1 million galaxies after artifact masking. We exploit the overlap with Galaxy And Mass
                                                     Assembly (GAMA) spectroscopy as calibration to determine photo-zs with the supervised machine learning neural network algorithm
                                                     implemented in the ANNz2 software. The photo-zs have mean error of |hδzi| ∼ 5×10⁻⁴ and low scatter (scaled mean absolute deviation
                                                     of ∼ 0.018(1 + z)), both practically independent of the r-band magnitude and photo-z at 0.05 < zphot < 0.5. Combined with the 9-band
                                                     photometry, these allow us to estimate robust absolute magnitudes and stellar masses for the full sample. As a demonstration of the
                                                     usefulness of these data we split the dataset into red and blue galaxies, use them as lenses and measure the weak gravitational lensing
                                                     signal around them for five stellar mass bins. We fit a halo model to these high-precision measurements to constrain the stellar-mass–
                                                     halo-mass relations for blue and red galaxies. We find that for high stellar mass (M? > 5 × 10¹¹ M ), the red galaxies occupy dark
                                                     matter halos that are much more massive than those occupied by blue galaxies with the same stellar mass. The data presented here
                                                     will be publicly released via the KiDS webpage.
                                                     Key words. Galaxies: distances and redshifts – Catalogs – Large-scale structure of Universe – Gravitational lensing: weak – Methods:
                                                     data analysis

                                               1. Introduction                                                                 The galaxy redshift is a key observable in such analyses, and
                                                                                                                          large spectroscopic surveys have therefore played an important
                                               Galaxies are not distributed randomly throughout the Universe:             role in establishing the current ΛCDM model. For large-scale
                                               they trace the underlying dark matter distribution, which itself           clustering studies it is advantageous to target specific subsets of
                                               forms a web-like structure under the influence of gravity in an            galaxies rather sparsely, because the survey can cover larger ar-
                                               expanding universe. For a given cosmological model, the growth             eas more efficiently. Consequently, most current results are based
                                               of structure can be simulated using cosmological numerical sim-            on redshift surveys that target specific galaxy types, such as lu-
                                               ulations, and the statistical properties of the resulting matter dis-      minous red galaxies (LRGs; Dawson et al. 2013; Blake et al.
                                               tribution as a function of scale and redshift can thus be robustly         2016). The downside of such strategies, however, is that detailed
                                               predicted. Given a prescription that relates their properties to the       information about the environment is typically lost.
                                               matter distribution, the observed spatial distribution of galaxies
                                                                                                                               In contrast, a highly complete spectroscopic survey can only
                                               can thus be used to infer cosmological parameter estimates (e.g.
                                                                                                                          cover relatively small areas, because fiber collisions or slit over-
                                               Percival et al. 2001; Cole et al. 2005; Alam et al. 2017; eBOSS
                                                                                                                          laps prevent or limit simultaneous spectroscopy of close galax-
                                               Collaboration et al. 2020).
                                                                                                                          ies; repeat visits are required to achieve a high completeness. For
                                                ?
                                                    e-mail: bilicki@cft.edu.pl                                            studies of galaxy formation and evolution this can nonetheless
                                               ??                                                                         be fruitful, as the Galaxy And Mass Assembly survey (GAMA,
                                                    e-mail: dvornik@astro.ruhr-uni-bochum.de
                                        ???
                                                    e-mail: hoekstra@strw.leidenuniv.nl                                   Driver et al. 2011) has demonstrated (e.g. Gunawardhana et al.
                                                                                                                                                                     Article number, page 1 of 19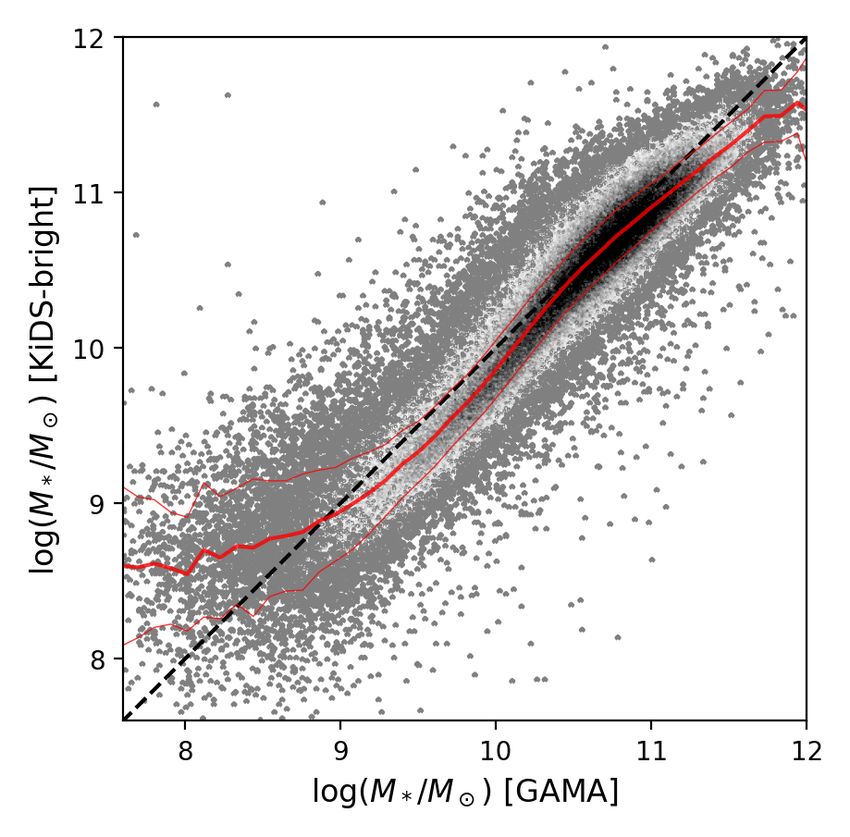
A&A proofs: manuscript no. KiDS-DR4-bright

2011; Robotham et al. 2011; Baldry et al. 2012). Although many       works (ANN) algorithm (ANNz2, Sadeh et al. 2016), trained
of these applications rely on spectroscopic redshifts, several       on galaxies with spectroscopic redshifts (spectro-zs) in common
questions can still be addressed with less precise (photometric)     between KiDS and GAMA. Such a good photo-z performance
redshift information over large areas.                               was possible thanks to the very high spectroscopic completeness
    To study the connection between galaxy properties and the        of GAMA in its three equatorial fields (G09, G12 & G15): at
dark matter distribution around galaxies, weak gravitational         the limit of r < 19.8, only ∼ 1.5% of the targets (pre-selected
lensing has become an important observational tool. The fore-        from SDSS) do not have a spectroscopic redshift measured there
ground galaxies, embedded in dark matter dominated halos, act        (Liske et al. 2015). As GAMA is essentially a complete subset
as lenses that distort space-time around them, leading to cor-       of the much deeper KiDS dataset, restricting the latter to the flux
relations in the shapes of more distant galaxies. This so-called     limit of the former allows us to take full advantage of the main
(weak) galaxy-galaxy lensing (GGL) is used to study the stellar-     supervised ML benefit: if a well-matched training set is avail-
mass–halo-mass relation (e.g. Leauthaud et al. 2012; Coupon          able, then photo-zs derived with this technique will be accurate
et al. 2015; van Uitert et al. 2016), to examine the galaxy          and precise.
bias (e.g. Hoekstra et al. 2002; Dvornik et al. 2018), or to test
modified gravity theories (e.g. Tian et al. 2009; Brouwer et al.          Here we extend the successful analysis of B18 to a larger
2017). Combined with measurements of the clustering of galax-        area and broader wavelength coverage using the imaging data
ies and the cosmic shear signal, so-called 3×2pt analyses provide    from the fourth public KiDS data release (DR4; Kuijken et al.
competitive constraints on cosmological parameters (e.g. Abbott      2019). We improve upon the earlier results and derive statis-
et al. 2018; Joudaki et al. 2018; van Uitert et al. 2018; Heymans    tically precise and accurate photo-zs for a flux-limited sample
et al. 2020). These applications rely on an overlapping sample       of bright galaxies without any color pre-selection. The imaging
of lenses with precise redshifts and a background sample with        data cover about 1000 deg2 in nine filters, combining KiDS op-
a large number of distant sources with reliable shape measure-       tical photometry with NIR data from the VISTA Kilo-degree In-
ments. The latter are improving thanks to large, deep, multi-band    frared Galaxy survey (VIKING, Edge et al. 2013). As shown
imaging surveys that cover ever larger areas of the sky, with the    in B18, the addition of the NIR data should improve the photo-z
aim of measuring cosmological parameters using weak gravita-         performance with respect to the earlier work. Following that pre-
tional lensing, such as the Kilo-Degree Survey (KiDS, de Jong        vious study, we take advantage of the overlapping spectroscopy
et al. 2013), the Dark Energy Survey (DES, The Dark Energy           from GAMA, which allows for a robust empirical calibration.
Survey Collaboration 2005) and the Hyper-Suprime Cam Sub-            This leads to better individual redshift estimates for bright, low
aru Strategic Program (Aihara et al. 2018).                          redshift galaxies, both in terms of lower bias and reduced scat-
    In this paper we focus on KiDS, which covers 1350 deg2 in        ter, compared to the default photo-z estimates that are provided
nine broadband filters at optical and near-infrared (NIR) wave-      as part of KiDS DR4. Those photo-zs were derived with the
lengths. Unfortunately, the spectroscopic samples that overlap       Bayesian Photometric Redshift approach (BPZ; Benítez 2000),
with the survey only yield ∼ 110 lenses per square degree in         with settings optimized for relatively faint (r > 20) and high-z
the case of the Baryon Oscillation Spectroscopic Survey (BOSS,       cosmic shear sources, which makes them sub-optimal for bright,
Dawson et al. 2013), and ∼ 40 deg−2 for the 2-degree Field Lens-     low-redshift galaxies (B18; Vakili et al. 2019).
ing Survey (2dFLenS, Blake et al. 2016). They jointly cover the
full final KiDS area of 1350 deg2 , and have been exploited to           Over the full KiDS DR4 footprint of ∼ 1000 deg2 we select a
test general relativity (Amon et al. 2018; Blake et al. 2020) and    flux-limited galaxy sample, closely matching the GAMA depth
to constrain cosmological parameters (Joudaki et al. 2018; Hey-      (r < 20), and derive photo-zs for all the objects with 9-band
mans et al. 2020; Tröster et al. 2020), but their low number den-    detections. We call this sample KiDS-Bright for short. The final
sity limits the range of applications.                               catalog includes about a million galaxies after artifact masking,
    In contrast, GAMA provides much denser sampling of up            that is ∼ 1000 objects per square degree. The inclusion of the
to 1000 lenses per deg2 (albeit at a lower mean redshift than        NIR photometry reduces the photo-z scatter to σδz/(1+z) ∼ 0.018,
BOSS or 2dFLenS), allowing for unique studies of the lensing         whilst still retaining a very small bias of |hδzi| < 10−3 .
signal as a function of environment (e.g. Sifón et al. 2015; Viola
et al. 2015; Brouwer et al. 2016; van Uitert et al. 2017; Linke          As a further extension of the previous results (B18), we de-
et al. 2020), but its overlap with KiDS is limited to ∼ 230 deg2 .   rive absolute magnitudes and stellar masses for the KiDS-Bright
Hence for studies of the small-scale lensing signal, or studies of   sample, using the LePhare (Arnouts et al. 1999; Ilbert et al.
galaxies other than LRGs, we cannot rely on spectroscopic-only       2006) spectral energy distribution fitting software. As an exam-
coverage over the full KiDS survey area. Fortunately, for many       ple of a scientific application of this dataset, we present a study
applications less precise photometric redshifts (photo-zs) suffice   of the stellar-to-halo-mass relation using GGL, where we split
(e.g. Brouwer et al. 2018), provided that the actual lens redshift   the sample into blue and red galaxies.
distribution is accurately known.
    In Bilicki et al. (2018, B18 hereafter) we used the third             This paper is organized as follows. In Sect. 2 we describe
KiDS data release (DR3, de Jong et al. 2017) covering 450            the data used: KiDS in Sect. 2.1, GAMA in Sect. 2.2 and the
deg2 and showed that by applying a limit of r . 20 to the            selection of the KiDS-Bright sample in Sect. 2.3. In Sect. 3 we
imaging data, it was possible to extract a galaxy sample with        present the photometric redshift estimation, quantify the photo-z
a surface number density of ∼ 1000 deg−2 at a mean red-              performance (Sect. 3.1) and provide a model for redshift errors
shift hzi = 0.23. Taking advantage of the overlap with GAMA          (Sect. 3.2). In Sect. 4 we discuss the stellar mass and absolute
spectroscopy, and using optical-only photometry (ugri) avail-        magnitude derivation, validate it with GAMA, and provide de-
able from KiDS DR3, we obtained photo-zs that had negligible         tails of the red and blue galaxy selection. We present the GGL
bias with hδzi ∼ 10−4 and a small scatter of σδz/(1+z) ∼ 0.022.      measurements using this sample in Sect. 5, compare them to the
These redshift statistics were achieved by deriving photo-zs us-     signal from GAMA in Sect. 5.1 and use them to constrain the
ing a supervised machine-learning (ML) artificial neural net-        stellar-to-halo mass relation in Sect. 5.2. We conclude in Sect. 6.
Article number, page 2 of 19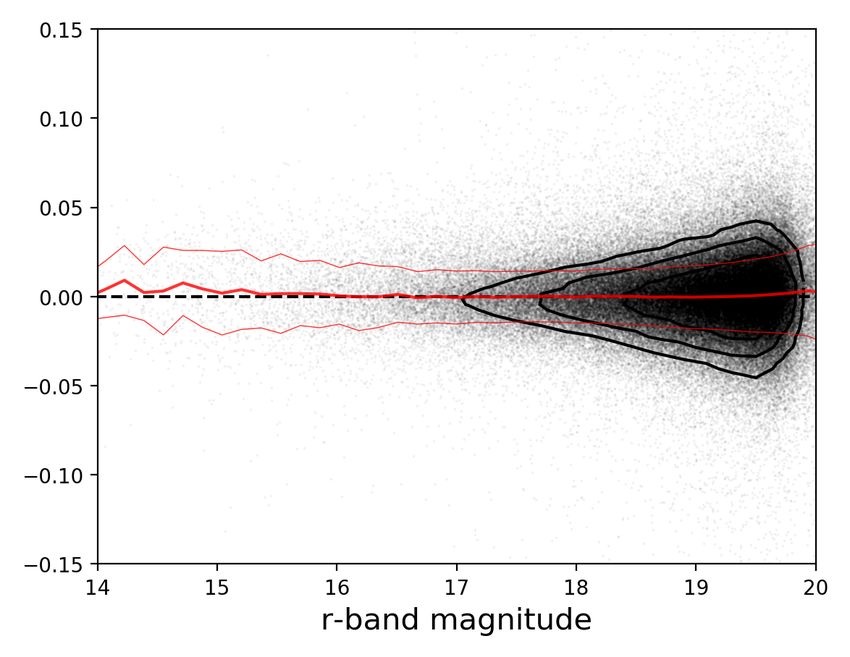
Bilicki, Dvornik, Hoekstra et al.: KiDS-Bright galaxy sample

    The paper is accompanied by the public release of the data           derived with SExtractor, ranging from 0 (extended) to 1 (point
presented here1 , including the photo-zs and estimates of physical       sources). The second separator is the discrete SG2DPHOT classi-
properties for the full KiDS-Bright galaxy sample over the ∼             fication bitmap based on the r-band detection image source mor-
1000 deg2 footprint of KiDS DR4.                                         phology (e.g. de Jong et al. 2015), which for instance is set to
                                                                         0 for galaxies and 1, 4 or 5 for stars. Lastly, also tttSG_FLAG
                                                                         is a discrete star-galaxy separator that is equal to 0 for high-
2. Data and sample selection                                             confidence stars and 1 otherwise3 .
2.1. KiDS imaging data                                                       The catalogs contain two flags that can be used to identify
                                                                         problematic sources (artifacts). The first one is IMAFLAGS_ISO,
To select our galaxy sample we use photometry in nine bands              a bitmap of mask flags indicating the types of masked areas
from a joint analysis of KiDS (ugri) and VIKING (ZY JHKs )               that intersect with the isophotes of each source, as identified
data that form the fourth public KiDS data release (DR4; Kuijken         by the Pulecenella software (de Jong et al. 2015). We require
et al. 2019)2 . This combined data set, which we will refer to as        this flag to be 0. The second flag is the KV multi-band bit-wise
‘KV’, covers an area of approximately 1000 deg2 , limited by             MASK, which combines Astro-WISE and theli flags for the KiDS
the KiDS 4-band observations obtained by January 24th, 2018              and VIKING bands4 . It indicates issues with source extraction
(VIKING had fully finished earlier). KiDS imaging was obtained           such as star halos, globular clusters, saturation, chip gaps, etc.
with the OmegaCAM camera (Kuijken 2011) at the VLT Survey                The recommended selection in DR4 is to remove sources with
Telescope (Capaccioli et al. 2012), while VIKING employed the            (MASK&28668) > 0. We do not apply this mask by default in the
VIRCAM (Dalton et al. 2006) on the Visible and Infrared Survey           final dataset, but instead provide a binary flag indicating whether
Telescope for Astronomy (VISTA, Emerson et al. 2006).                    an object meets this masking criterion or not.
     The imaging data were processed using dedicated pipelines:              In Section 5 we measure the lensing signal around our sam-
the Astro-WISE information system (McFarland et al. 2013) for            ple of bright galaxies using shape measurements that are based
the production of co-added images (‘coadds’) in the four opti-           on the r-band images. The galaxy shapes are measured using
cal bands, and a theli (Erben et al. 2005) r-band image reduc-           lensfit (Miller et al. 2013), which has been calibrated with im-
tion to provide a source catalog suitable for the core weak lens-        age simulations described in Kannawadi et al. (2019). Those are
ing science case. The VIKING magnitudes for KiDS DR4 were                complemented with photo-z estimates based on an implemen-
obtained from forced photometry on the theli-detected sources,           tation of the BPZ code (Benítez 2000). For further details on
using a re-reduction of the NIR imaging that started from the            the image reduction, photo-z calibration and shape measurement
VISTA “paw-prints” processed by the Cambridge Astronomical               analysis for these background sources we refer the interested
Survey Unit (CASU).                                                      reader to Kuijken et al. (2019); Giblin et al. (2020) and Hilde-
     Photometric redshift estimates rely on robust colors, for           brandt et al. (2020).
which we use the Gaussian Aperture and Photometry (GAaP,
Kuijken 2008) measurements, which in DR4 are provided for all
the bands. They are obtained via a homogenization procedure              2.2. GAMA spectroscopic data
in which calibrated and stacked images are first ‘Gaussianized’,
                                                                         The Galaxy And Mass Assembly survey (GAMA, Driver et al.
that is the point-spread-function (PSF) is homogenized across
                                                                         2011) is a unique spectroscopic redshift and multi-wavelength
each individual coadd. The photometry is then measured using a
                                                                         photometric campaign, which employed the AAOmega spec-
Gaussian-weighted aperture (based on the r-band ellipticity and
                                                                         trograph on the Anglo-Australian Telescope to measure galaxy
orientation) that compensates for seeing differences between the
                                                                         spectra in five fields of total ∼ 286 deg2 area. Four of these fields
different filters; see Kuijken et al. (2015) for more details. Our
                                                                         (equatorial G09, G12 and G15 of 60 deg2 each, and Southern
ML photo-z derivation requires that magnitudes are available in
                                                                         G23 of ∼ 51 deg2 ) fully overlap with KiDS, and we exploit this
all filters employed. Hence we require that the sources have data
                                                                         to optimize the bright galaxy selection and calibrate the photo-zs.
and detections in all the nine bands.
                                                                         Unique features of GAMA are the panchromatic imaging span-
     The GAaP magnitudes are useful for accurate color esti-
                                                                         ning almost all of the electromagnetic spectrum (Driver et al.
mates, but they miss part of the flux for extended sources.
                                                                         2016; Wright et al. 2016), and the detailed redshift sampling
Various other magnitude estimates are, however, provided for
                                                                         in its equatorial fields: it is 98.5% complete for SDSS-selected
the r-band data. Here we use the Kron-like automatic aperture
                                                                         galaxies with r < 19.8 mag, providing an almost volume-limited
MAG_AUTO and the isophotal magnitude MAG_ISO, as measured
                                                                         selection at z . 0.2 and includes a sizable number of galaxies up
by SExtractor (Bertin & Arnouts 1996). These are not cor-
                                                                         to z ∼ 0.5.
rected for Galactic extinction and zero-point variations between
different KiDS tiles (unlike the published GAaP magnitudes).                 In our work we use the ‘GAMA II’ galaxy dataset (Liske
To account for this we define rauto KiDS
                                          = MAG_AUTO + DMAG −            et al. 2015) from the equatorial fields, which includes, but is
EXTINCTION_R (and analogously for MAG_ISO), where DMAG are               not limited to, the first three public GAMA data releases. The
per-tile zero-point offset corrections, and the Galactic extinction      GAMA targets for spectroscopy were selected there from SDSS
at the object position is derived from the Schlegel et al. (1998)        DR7 imaging (Abazajian et al. 2009) requiring a Petrosian
maps with the Schlafly & Finkbeiner (2011) coefficients. Where           (1976) magnitude rPetro < 19.8. Only extended sources were
unambiguous, we will skip the ‘KiDS’ superscript.                        targeted, primarily based on the value of ∆sg = rpsf − rmodel
     In order to separate galaxies from stars, we use three              (Strauss et al. 2002), where the two latter magnitudes are re-
star/galaxy separation indicators provided in the KiDS DR4               spectively the SDSS PSF and model r-band measurements. To
multi-band dataset. The first one is the continuous CLASS_STAR           improve the point source removal further, the J − K NIR color
 1                                                                       3
   Data will be available upon publication. Please contact the authors      See Kuijken et al. (2015) sect. 3.2.1 for a description of this star-
for earlier access.                                                      galaxy separation.
 2                                                                       4
   See http://kids.strw.leidenuniv.nl/DR4/index.php for                     See    http://kids.strw.leidenuniv.nl/DR4/format.php#
data access.                                                             masks for details.

                                                                                                                   Article number, page 3 of 19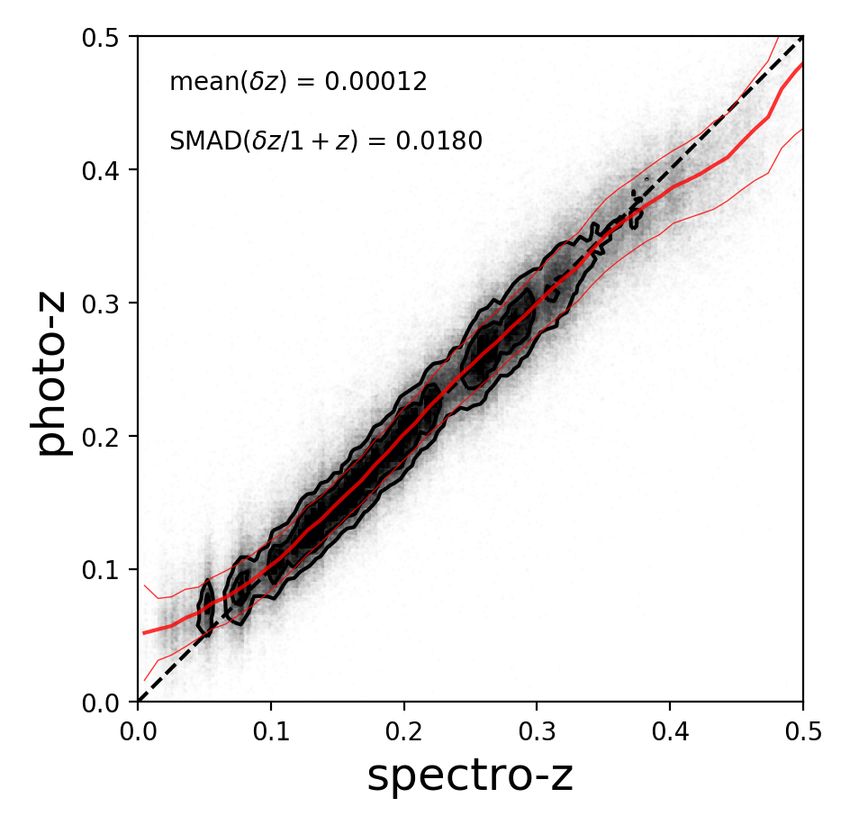
A&A proofs: manuscript no. KiDS-DR4-bright

from the UKIRT Infrared Deep Sky Survey (UKIDSS, Lawrence
et al. 2007) was also used (Baldry et al. 2010).                                                            21
     In the equatorial fields GAMA also includes sources fainter
than r = 19.8 and/or selected differently than the main flux lim-
                                                                                                            20

                                                                                  r-band Petrosian (GAMA)
ited sample (‘filler’ targets); see Baldry et al. (2010); Liske et al.
(2015); Baldry et al. (2018) for details. We used these in the
KiDS photo-z training together with the flux-limited sample, but                                            19
not to calibrate the bright-end selection. KiDS also overlaps with
the southern G23 field, but the targets there were selected at a
brighter limit (i < 19.2) than in the equatorial areas, and ob-                                             18
served at a lower completeness. We therefore do not use that
field for our sample selection and photo-z calibration.                                                     17
     We use the equatorial fields of GAMA TilingCatv46, which
cover roughly 180 deg2 fully within the KiDS DR4 footprint. To
ensure robust spectroscopy, we require a redshift quality NQ ≥ 3                                            16
and limit the redshifts to z > 0.002 to avoid residual con-
tamination by stars or local peculiar velocities. Cross-matching                                            15
the GAMA redshift with KV imaging data yields over 189 000                                                   15   16   17    18     19    20   21
sources with a mean redshift hzi = 0.23. When unambiguous,                                                             r-band auto (KiDS)
by ‘GAMA’ we will from now on mean this selection of GAMA
                                                                         Fig. 1. Comparison between the KiDS rauto and the Petrosian r-band
galaxies in the equatorial fields.                                       from SDSS for galaxies in common between the two data sets. The
     A small fraction (∼ 4500 in total) of GAMA galaxies do not          GAMA selection is based on the latter magnitude, whereas we use the
have counterparts in the KiDS multi-band catalog. About 1300             former to determine the flux limit of our galaxy sample. The relevant
of these are located at the edges of the GAMA fields, where KV           magnitude limits are indicated with the gray lines, and the black diago-
coverage did not reach. The rest are scattered around the equato-        nal is the identity line.
rial fields and include a considerable fraction of z < 0.1 galaxies,
of low surface brightness galaxies, and of GAMA filler targets.
These missing objects should not affect the analysis presented in        trade-off between completeness and purity of the dataset. To
this paper.                                                              select only extended sources (galaxies), we verified how the
     In Sect. 4 we use the stellar mass estimates of GAMA                three star/galaxy separation metrics available in KiDS DR4
galaxies for a comparison with our results from the KiDS-                (CLASS_STAR, SG2DPHOT and SG_FLAG) perform for the GAMA
Bright catalog. For this we employ the StellarMassesLamb-                sources. We found that the optimal approach is to jointly apply
darv20 dataset, which includes physical parameters based on              the following conditions: CLASS_STAR < 0.5 & SG2DPHOT = 0
stellar population fits to rest-frame u-Y SEDs, using Lambda             & SG_FLAG = 1. These remove less than 0.5% of the matched
Adaptive Multi-Band Deblending Algorithm in R (LAMBDAR,                  KiDS×GAMA rPetro < 19.8 galaxies, so this selection ensures a
Wright 2016) matched aperture photometry measurements of                 completeness of more than ∼ 99.5%.
SDSS and VIKING photometry (Wright et al. 2016) for all
z < 0.65 galaxies in the GAMA-II equatorial survey regions.                   As far as the magnitude limit of the KiDS-Bright galaxy se-
This sample contains over 192 000 galaxies, with a median                lection is concerned, we verified which of the r-band magnitude
log(M? /M ) ∼ 10.6 assuming H0 = 70 km s−1 Mpc−1 , and a                 types – AUTO or ISO – is the most appropriate for the selection.
range between the 1st and 99th percentile of (8.4; 11.2) in the          We find that ISO matches the SDSS Petrosian magnitude slightly
same units. Here and below by ‘log’ we mean the decimal log-             better: the median difference ∆iso ≡ riso KiDS    GAMA
                                                                                                                        − rPetro   ' −0.02
arithm, log10 . For further details on the GAMA stellar mass             as compared to ∆auto ' −0.06. However, the scatter in ∆auto is
derivation, see Taylor et al. (2011) and Wright et al. (2016).           smaller than in ∆iso : the former is more peaked (i.e. narrower in-
                                                                         terquartile and 10- to 90-percentile ranges around the median)
                                                                         than the latter. We therefore decided to use rauto < 20 for the
2.3. KiDS-Bright galaxy sample                                           bright sample selection. This ensures a completeness level of
                                                                         over 99% with respect to the GAMA r < 19.8 selection.
To ensure that the highly complete, flux-limited GAMA cata-
log is the appropriate photo-z training set for the KiDS-Bright               Figure 1 presents a comparison of the SDSS Petrosian and
sample, the selection of the latter should mimic that of the for-        KiDS AUTO r-band magnitudes for the galaxies in common with
mer as closely as possible. The differences between the KiDS             GAMA, including those beyond the completeness limit of the
and SDSS photometry, filter transmission curves, as well as the          latter. The vertical and horizontal gray lines show respectively
data processing of both surveys, prevent an exact matching. In           the GAMA flux limit and the cut we adopted for the selection of
particular, Petrosian magnitudes are not measured by the KiDS            the KiDS-Bright galaxy sample. The combination of rauto < 20
pipeline; even if they were, though, the different r-band PSF            and the star removal results in an incompleteness in the galaxy
(sub-arcsecond in KiDS vs. median ∼ 1.3” in SDSS,) and depth             selection of ∼ 1.2% with respect to GAMA.
(∼ 25 mag of KiDS vs. ∼ 22.7 in SDSS) would mean that the                     Quantifying the purity of the resulting KiDS-Bright sample
sources in common will on average have a much higher signal-             is more challenging, as this formally requires a complete flux-
to-noise in KiDS. Due to the photometric noise (Eddington bias,          limited sample of spectroscopically confirmed galaxies, quasars
etc.), even applying the same cut to the same magnitude type             and stars deeper than GAMA. As such a dataset is not available
(if possible) would not result in the same selection for the two         at present, we will assess the purity using indirect methods in-
surveys.                                                                 stead. Possible contaminants are artifacts, incorrectly classified
    Instead, we used the overlap with GAMA and designed                  stars, or quasars for which galaxy photo-zs may be inaccurate
an effective bright galaxy selection from KiDS, aiming at a              (especially if at high-z).
Article number, page 4 of 19
Bilicki, Dvornik, Hoekstra et al.: KiDS-Bright galaxy sample
A small fraction of the bright sources have nonphysical or To summarize, we estimate that the KiDS-Bright sample has
otherwise spurious photo-zs (derived as described in Sect. 3), a very high purity level close to 100%, as contamination from
i.e. zphot < 0 or zphot > 1; these constitute only ∼ 0.05% of the stars, high-redshift quasars or artifacts is at a small fraction
sample after applying the default mask. The stellar contamina- of a per cent. There is, however, an inevitable mismatch with
tion should be minimal, as we have combined 3 flags for galaxy GAMA flux-limited selection, with up to 3% of the galaxies
selection, which should yield a robust classification for objects in KiDS-Bright not fully represented by GAMA spectroscopy.
detected with a high signal-to-noise ratio. Indeed, a cross-match These could potentially have photo-zs based on ML extrapola-
with the SDSS DR14 spectroscopic star sample (Abolfathi et al. tion that are less reliable.
2018) yields only 170 matches out of some ∼ 50 000 SDSS stars
in the KiDS-North area; extrapolated to KiDS-South this would
imply a contamination of this type of at most 0.05%. Although 3. Photometric redshifts
SDSS stars do not constitute a uniform and flux limited sample at To obtain photo-z estimates that are optimized for our sample
this depth, this still supports our expectation that the star contam- of bright low-redshift galaxies, we take advantage of the large
ination should be negligible. We also do not expect quasars to be amount of spectroscopic calibration data. To do so, we use su-
significant and problematic contaminants: a similar cross-match, pervised ML in which a computer model (based on ANNs in our
but with SDSS DR14 spectroscopic quasars, results in about 650 case) learns to map the input space of ‘features’ (magnitudes) to
common sources, of which 90% have zspec < 0.5. Matching the the output (redshift) based on training examples, which in our
KiDS-Bright data with a much more complete, photometrically case are the KiDS galaxies with a GAMA spectro-z. The trained
selected sample of KiDS quasars derived by Nakoneczny et al. model is subsequently applied to the entire ‘inference’ dataset,
(2020), which covers the whole DR4 footprint, gives ∼ 1400 which in our case is the galaxy sample selected as described in
common objects, of which 90% have zQSO phot < 0.66 (the ‘QSO’ su- Sect. 2.3.
perscript referring to the quasar photo-z as derived in that work).
Similarly to B18, we used the ANNz2 software5 (Sadeh et al.
Both these tests suggest that the possible contamination with
2016) to derive the photo-zs for the KiDS-Bright galaxy sample.
high-z quasars also is a fraction of a per cent. The photo-zs of
This package implements a number of supervised ML models
such residual quasars are worse than for the general galaxy sam-
for regression and classification. Throughout this work, we em-
ple, but their very small number does not influence the overall
ployed ANNz2 in the ‘randomized regression’ mode, in which a
statistics and the quality of the dataset.
pre-set number (here: 100) of networks with randomized config-
Finally we examine the impact of KiDS-Bright objects that urations is generated for each training, and a weighted average
are fainter than the completeness limit of GAMA, i.e. they have is provided as the output. We trained ANNs using the GAMA-II
rPetro > 19.8 (see Fig. 1). Following the analysis above, these equatorial sources that overlap with KiDS DR4. We have verified
are most likely galaxies, and as such should not be considered that adding the Southern GAMA G23 data does not improve the
contaminants, but they are not well represented by the GAMA final photo-z statistics – G23 is shallower and less complete than
spectroscopic sample, or not represented at all. The photo-z esti- the equatorial data, and including it does not add any new infor-
mates of such galaxies could be affected by the fact that their cal- mation in the feature space that the networks could use to im-
ibration is based on the incomplete and non-uniform sampling of prove the photo-z performance. For similar reasons we have not
GAMA filler targets beyond the nominal flux limit of the survey. employed other wide-angle spectroscopic data, such as SDSS or
On the other hand, the KiDS-Bright objects beyond the GAMA 2dFLenS, to the training set. Those samples include flux-limited
limit, but with colors similar to those included in the flux-limited subsets shallower and less complete than GAMA, while at the
spectroscopic sample, should still attain reliable photo-zs. fainter end they encompass only color-selected galaxies, mostly
One way to estimate the number of such faint-end sources red ones, which if employed in photo-z training, would bias the
is to compare the catalogs for the GAMA equatorial fields. Af- estimates against blue sources.
ter all the selections, the KiDS-Bright sample comprises below The galaxies were used in various configurations for the
192 000 galaxies, whereas the GAMA sample, with rPetro < 19.8, photo-z training, validation and tests. To enable some level of
contains above 182 000 objects. The difference of approximately extrapolation by the ML model in the range of rPetro > 19.8 &
9000 objects provides an upper limit of ∼ 4.7% for galaxies rauto < 20 (see Fig. 1), we did not limit them to the GAMA com-
that are not fully represented in the GAMA catalog. The true pleteness cut. As the ANNs in our setup cannot handle missing
fraction is likely below this number, because only galaxies with data, we require photometry in all nine bands, also for the tests
mis-estimated photo-zs based on extrapolation beyond GAMA we discuss below. However, as the galaxies are much brighter
should be considered as potentially problematic. Their number than the magnitude limits of both KiDS and VIKING, we only
is difficult to estimate without a comparison against a complete lose ∼ 1500 objects out of a total of 189 000 spectroscopic galax-
flux-limited galaxy spectroscopic sample, deeper than GAMA ies.
and overlapping with KiDS. Such a dataset is presently un- In the testing phase, we randomly selected 33% of the galax-
available; we can, however, estimate how many of the KiDS- ies with redshifts from GAMA as a joint training and validation
Bright galaxies are similar to GAMA ‘filler’ targets. In the cross- set, while the rest was used for testing. In all cases, the actual
matched KiDS×GAMA sample there are about 4800 GAMA validation set (used internally by ANNz2 for network optimiza-
‘fillers’ with rPetro > 19.8 out of the ∼ 146k selected in the same tion) was randomly selected as half of the input training and
way as the KiDS-Bright (rauto < 20 plus the galaxy selections validation sample. For the final training of the photo-zs of our
and masking detailed above); this yields about 3.3%. The photo- bright galaxies, we used the entire cross-matched sample, again
z performance of such a ‘filler’ sample will be worse, but not with a random half/half split for actual training and validation
catastrophic: their hδzi ' 1.6 × 10⁻³ and σz ' 0.024(1 + z), at (optimization) in ANNz2. As shown in B18, these proportions
a mean redshift of hzi = 0.33. For those KiDS-Bright galaxies between training, validation and test sets can be varied within
which are not represented in GAMA at all, we cannot reliably
estimate the overall photo-z performance: deeper spectroscopic 5
Available for download from https://github.com/
samples overlapping with KiDS are not sufficiently complete. IftachSadeh/ANNZ. We used version #2.3.1.
Article number, page 5 of 19A&A proofs: manuscript no. KiDS-DR4-bright
Fig. 2. Comparison of the KiDS-Bright photometric redshifts with the overlapping GAMA spectroscopic data. Left: direct spectro-z – photo-z
comparison. The thick red line is the running median of the function zphot (zspec ) and the thin red lines illustrate the scatter (SMAD) around the
median. Black dashed is the identity line. Right: Comparison of redshift distributions of the GAMA spectroscopic training set (red bars), photo-zs
for the common KiDS×GAMA sources (blue dashed line) and the full KiDS-Bright photo-z sample (black line). The histograms are normalized
to unit area.
reasonable ranges without much influence on the results; we are we decided to employ only the PSF-corrected GAaP magnitudes
dealing with sufficiently large samples to ensure robust statistics. for redshift estimation.
To evaluate the performance we measure the ‘scatter’, de- As already mentioned in Sect. 2.1, each KiDS object is as-
fined as the scaled median absolute deviation (SMAD) of the signed a MASK flag, indicating issues with source extraction. The
quantity ∆z ≡ δz /(1 + ztrue ) with δz ≡ zphot − ztrue and SMAD(x) = default masking, used to create the KiDS-1000 weak lensing
1.4826 × median(|x − median(x)|). As ztrue we use the spectro- mosaic catalogs, is to remove the sources matching bit-wise the
zs from the test sample. In B18 we showed that adding NIR value 28668. We have checked the importance of this masking
VIKING magnitudes to the ugri-only setup available in KiDS for photo-z performance by performing two ANN trainings: one
DR3 reduced the scatter of the photo-zs at the GAMA depth including all the training sources with any mask flag, and another
by roughly 9%, from σz ' 0.022(1 + z) to 0.020(1 + z). The one where only the sources with the default masking were used.
VIKING measurements employed there were based on GAMA- For each of the cases, the performance was evaluated using the
LAMBDAR forced photometry (Wright et al. 2016) using SDSS same blind test set. We did not observe any difference between
apertures as input and without PSF corrections that are applied the photo-z statistics for the two training cases. Our interpreta-
in KV processing (Wright et al. 2019; Kuijken et al. 2019). We tion is that the ANNs are able to ‘learn’ the noise related to the
therefore expect that the improved color measurements in DR4 MASK flag. By ignoring it in the training phase, they are still able
should reduce the errors even further. Indeed, we find that the to robustly estimate photo-zs. At the same time, as far as the eval-
scatter of 9-band KiDS DR4 photo-zs for our bright galaxies is uation is concerned, there is a clear deterioration in the photo-z
further reduced with respect to the KiDS DR3 + LAMBDAR performance for the sources that should be masked out with re-
VIKING statistics, in total by ∼ 18% from the DR3 ugri-only spect to those that pass the default selection, for both training se-
derivation; see Table 1 below. We have also verified that omit- tups. Motivated by these findings, we ignored the MASK value for
ting any of the 9 bands worsens the performance. None of the the training set for the final sample. We however provide a flag
VIKING bands stands out, which is expected, because for the with our photo-z estimates that indicates which of the galaxies
redshifts covered by GAMA (z < 0.5), the NIR data do not trace meet the condition (MASK&28668) > 0 and should be preferably
clear features in the spectrum; rather they sample the Rayleigh- masked out for science applications.
Jeans tail, and thus each of the VIKING bands adds a similar
amount of information.
3.1. Photometric redshift performance
The photo-zs could be potentially improved if additional fea-
tures are included in the training. B18 studied this in detail for a We compare the KiDS-Bright photo-zs with the overlapping
similar bright sample of galaxies, and found that adding colors spectro-zs from GAMA in Fig. 2. The left panel shows that the
(magnitude differences) and galaxy angular sizes (semi-axes of photo-zs are overestimated at low-z and underestimated at high-
best-fit ellipses) did lead to better photo-z estimates, compared z, which is common for ML approaches. Nonetheless, the overall
to the magnitude-only case. For the 9-band data, however, there performance is excellent, with a low average bias and a small and
are 36 possible colors and feeding the ANNs with all of them, near constant scatter as a function of redshift.
together with the magnitudes, would be very inefficient without The redshift distributions presented in the right panel of
specific network optimization each time; some prior feature im- Fig. 2 indicate that for the matched KiDS×GAMA galaxies,
portance quantification to choose the most relevant subset would dN/dzphot (blue dashed line) closely follows the general shape
be needed. This is beyond the scope of this work and therefore of the true dN/dzspec (red bars), preserving even the ‘dip’ ob-
we limit the photo-z derivation to magnitudes only. Unlike B18, served in GAMA at z ∼ 0.25 (emerging by chance due to large-
we decided not to use any size information, because the available scale structures passing through the equatorial fields; e.g. Eard-
estimates are not PSF-corrected. Using the uncorrected sizes ley et al. 2015). As far as the redshift distribution of the full
could introduce a systematic variation of photo-z quality with photometric sample is concerned (black solid line), we observe
the PSF at a source position. As one of the applications of the some piling up of photo-zs at the very same range where the
KiDS-Bright sample is to use it for cosmological measurements, GAMA dip is present, but also at zphot ∼ 0.35. This might be the
Article number, page 6 of 19Bilicki, Dvornik, Hoekstra et al.: KiDS-Bright galaxy sample
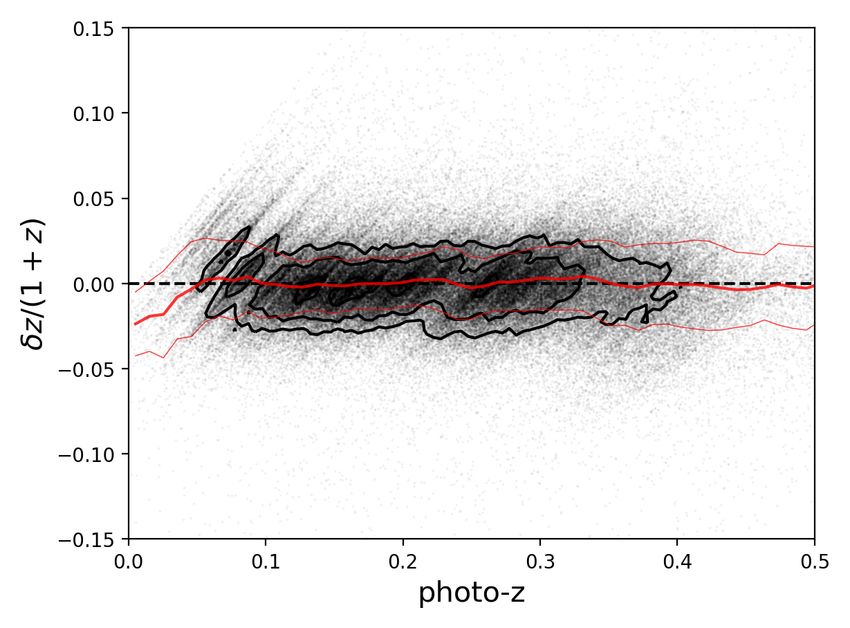
Fig. 3. Photometric redshift errors in the KiDS-Bright sample as a function of photo-z (left) and of the KiDS r-band AUTO magnitude (right),
calibrated on overlapping GAMA data. Each dot is a galaxy, with contours overplotted in the highest number density areas. The thick red line
is the running median and the thin red lines illustrate the scatter (SMAD) around the median. The stripes in the left panel originate from the
large-scale structures present in the GAMA fields.
result of the extrapolation by ANNz2 in the regime rauto ∼ 20, and spectroscopic redshifts in the Southern GAMA G23 field,
where sources can be fainter than the GAMA completeness limit in which such lack of z ∼ 0.25 sources is not observed. As
(Fig. 1), or for sources that are for some other reason under- mentioned earlier, the latter dataset was not used for the photo-
represented in GAMA (as discussed in Sect. 2.3). z training, because it is shallower and less complete than the
To illustrate the KiDS-Bright photo-z performance in more GAMA-equatorial data. A comparison of the redshift histograms
detail, we show the redshift errors δz/(1 + z) as a function of shows no spurious lack of photo-zs at z ∼ 0.25. Nonetheless,
photo-z and r-band magnitude in Fig. 3. The errors show little close inspection of the left-hand panel of Fig. 3 does suggest
dependence on the r-band magnitude or photometric redshift, some variation in photo-z performance in this range; a similar
except for the range zphot < 0.05. As at this redshift range the effect is observed also in a zspec vs. δz comparison. Such ‘wig-
number density of the photometric KiDS galaxies is very small, gles’ in the photo-z error as a function of redshift are still present
and it is additionally very well covered by wide-angle spectro- if the G23 data are added to the ANNz2 training. However, for
scopic samples such as SDSS Main (Strauss et al. 2002), 6dFGS the current and planned applications of the KiDS-Bright sam-
(Jones et al. 2009) and GAMA itself, this worse photo-z perfor- ple these issues are not significant. Nonetheless, this might need
mance is irrelevant for scientific applications of the KiDS-Bright revisiting for future analyses with the full-area KiDS DR5 data.
sample. We however recommend using only the zphot > 0.05 Table 1 provides basic photo-z statistics for our KiDS-Bright
sources; this cut affects less than 1% of the sample. At the high- sample. We list the total number of sources, their mean redshift,
redshift end of the dataset, zphot & 0.4, both the KiDS-Bright and as well as photo-z bias and scatter (evaluated on overlapping
GAMA calibration samples become very sparse (Fig. 2). How- GAMA spectroscopy). Comparison of the statistics for the full
ever, the photo-z quality remains comparable to the rest of the KiDS-Bright sample with that after masking demonstrates that
dataset (Fig. 3), so the galaxies with zphot . 0.5 should be safe masking improves the photo-z statistics somewhat; interestingly,
for scientific applications once the flux-limited character of the it also slightly enlarges the mean redshift. We also report results
sample is taken into account. when the sample is split by color based on the the r-band ab-
The fact that the photo-zs are practically unbiased as a func- solute magnitude and the rest-frame u − g color, derived with
tion of the photo-z, typical for ML-based derivations, leads to LePhare, as detailed in Sect. 4. With the adopted split, the red
an inevitable bias as a function of spectro-z at the extremes of galaxies are slightly less numerous than the blue ones, but their
the coverage, as already illustrated in Fig. 2. However, in most photo-z performance is noticeably better.
applications it is important to be able to select in photo-z and cal- For reference we also provide the results for the galaxies that
ibrate the true redshift distribution of a given sample a posteriori overlap with the LRG sample from Vakili et al. (2020), but using
(e.g. in photo-z bins). For this, knowledge of the photo-z error our ANNz2 redshift estimates. This particular subsample stands
distribution (discussed below in Sect. 3.2) plus the dN/dzphot are out with SMAD(∆z) ∼ 0.014, albeit with a slightly larger overall
usually sufficient to build a reliable model. bias of hδzi ∼ 10−3 (which is still over an order of magnitude
The relative paucity of zspec ∼ 0.25 galaxies in the GAMA- smaller than the scatter). These values are comparable to those
equatorial data, used here for the photo-z training, is caused by obtained in Vakili et al. (2020) using the dedicated red-sequence
large-scale structure in these fields. This could potentially af- model, which confirms the excellent quality of our photo-zs. The
fect our redshift estimates if it was spuriously propagated by blue galaxies, despite performing worse overall in terms of their
ANNz2. As we have already pointed out, this ‘dip’ is correctly photo-z statistics, still have very well constrained redshifts with
reproduced in the dN/dzphot of the matched GAMA×KiDS sam- SMAD(∆z) ' 0.02. For the blue and red galaxies we find similar
ple, but it is not present in the overall photo-z distribution of trends as the ones presented in Fig. 3 for the full sample, albeit
the full KiDS-Bright sample. This suggests that the training is with different levels of scatter.
not significantly affected. As an additional test, we compared The quality of photo-zs can vary as a function of various sur-
dN/dzspec and dN/dzphot of a cross-match between KiDS-Bright vey properties. In Appendix A we present a short summary of
Article number, page 7 of 19A&A proofs: manuscript no. KiDS-DR4-bright
Table 1. Statistics of photometric redshift performance for the KiDS-Bright sample and selected subsamples. The sample sizes refer to the full
photometric selection.
sample number of mean mean of mean of st.dev. of SMAD of
galaxies redshift δz = zph − zsp δz/(1 + zsp ) δz/(1 + zsp ) δz/(1 + zsp )
full KiDS-Brighta 1.24 × 10⁶ 0.226 1.2 × 10⁻⁴ 6.7 × 10⁻⁴ 0.0246 0.0180
after maskingb 1.00 × 10⁶ 0.229 4.6 × 10⁻⁴ 9.0 × 10⁻⁴ 0.0237 0.0178
red galaxiesc 3.91 × 10⁵ 0.243 −2.7 × 10⁻⁴ 2.0 × 10⁻⁴ 0.0194 0.0159
blue galaxiesc 4.25 × 10⁵ 0.212 1.5 × 10⁻³ 1.8 × 10⁻³ 0.0274 0.0200
luminous red galaxiesd 7.18 × 10⁴ 0.305 1.1 × 10⁻³ 1.1 × 10⁻³ 0.0161 0.0141
Notes.
(a)
Flux-limited galaxy sample (rAUTO < 20); see Sect. 2.3 for other details of the selection.
(b)
Using the KiDS MASK flag, removing the sources meeting the condition (MASK&28668) > 0 (bit-wise).
(c)
Selected using the r-band absolute magnitude and rest-frame u − g color based on LePhare output; see Sect. 4 for details.
(d)
Selected using the Bayesian model detailed in Vakili et al. (2020), encompassing jointly the ‘dense’ and ‘luminous’ samples. Numbers refer to
the LRGs overlapping with the KiDS-Bright sample and the photo-z statistics are based on the ANNz2 derivations.
the photo-z error variation for the KiDS-Bright sample versus a
number of both KiDS-internal (PSF, background, limiting mag-
nitudes) and external (star density, Galactic extinction) observa-
tional effects. We find that both the photo-z bias and scatter are
generally stable with respect to these quantities.
3.2. Analytical model of the redshift errors
For a number of applications, such as angular clustering, GGL,
or cross-correlations with other cosmological tracers, it is use-
ful to have an analytical model of the photo-z errors, which can
be used in the theoretical predictions (e.g. Balaguera-Antolínez
et al. 2018; Peacock & Bilicki 2018; Hang et al. 2021). The pho-
tometric redshift error distribution usually departs from a Gaus-
sian shape due to a considerable number of several-σ outliers
and generally broader ‘wings’ (e.g. Bilicki et al. 2014; Pasquet Fig. 4. Histogram of photometric redshift errors in the KiDS-Bright
sample (magenta bars) fitted with a generalized Lorentzian (Eqn. 1,
et al. 2019; Beck et al. 2021). This is why SMAD, or alterna- black line) with parameters a = 2.613 and s = 0.0149, compared to
tively percentiles (e.g. Wolf et al. 2017; Soo et al. 2018; Alarcon best-fit Gaussian (orange) with σ = 0.0180. The top-right inset eluci-
et al. 2020), are better suited to quantify the photo-z scatter than dates the differences in the wings as seen in log-scaling.
the standard deviation, which is sensitive to the outliers. Func-
tional forms to fit the empirical photo-z error distribution include
the ‘modified Lorentzian’ (Bilicki et al. 2014; Peacock & Bilicki do not have meaningful information on the errors on the ∆z his-
2018; Hang et al. 2021) or the Student’s t-distribution (Vakili togram.
et al. 2020). The former is given by (Bilicki et al. 2014)
!−a
∆z2 4. Stellar masses & rest-frame absolute magnitudes
N(∆z) ∝ 1 + , (1)
2as2
We estimate a number of rest-frame properties for each KiDS-
where we have assumed that the photo-zs are on average un- Bright galaxy in the same manner as was done for the full-
biased, which is a good approximation in our case as h∆zi
depth KV data within the DR3 footprint (KV450, Wright et al.
SMAD(∆z) (see Table 1). This can be easily generalized to the 2019). We do this by fitting model spectral energy distribu-
case of non-negligible bias by introducing an extra parameter tions (SEDs) to the 9-band GAaP fluxes of each galaxy using
(Hang et al. 2021). In Eqn. (1), the parameter s is related to the LePhare (Arnouts et al. 1999; Ilbert et al. 2006) template
the width of the distribution, while a encodes the extent of the fitting code. In these fits, we employ our ANNz2 photo-z es-
‘wings’. We note that both a and s can be parameterized as timates as input redshifts for each source, treating them as if
photo-z-dependent to build an analytical model of redshift error they were exact. In practice, this has little influence over the fi-
(Peacock & Bilicki 2018). delity of the stellar mass estimates: see Taylor et al. (2011). We
We use Eqn. (1) to fit the photo-z error distribution in the use a standard concordance cosmology (Ωm = 0.3, ΩΛ = 0.7,
KiDS-Bright sample and find the best-fit parameters to be a = H0 = 70 km s−1 Mpc−1 ), a Chabrier (2003) initial mass function,
2.613 and s = 0.0149. Qualitatively, this is indeed a very good the Calzetti et al. (1994) dust-extinction law, Bruzual & Char-
fit to the ∆z histogram, as illustrated in Fig. 4, clearly outper- lot (2003) stellar population synthesis models, and exponentially
forming the best-fit Gaussian with σ = 0.0180 (also assuming declining star formation histories. The input photometry to LeP-
average zero bias). The inset, with a log-scale to highlight the hare is extinction corrected using the Schlegel et al. (1998) maps
wings, shows that the Gaussian fails to account for the outliers. with the Schlafly & Finkbeiner (2011) coefficients, as described
We do not quantify the goodness of fit of the two models as we in Kuijken et al. (2019). For the optical VST bands we utilize the
Article number, page 8 of 19Bilicki, Dvornik, Hoekstra et al.: KiDS-Bright galaxy sample
assess the quality of these stellar mass estimates, we compared
them with the GAMA stellar mass catalog (Taylor et al. 2011;
Wright et al. 2016), introduced in Sect. 2.2. First of all, it is
worth noting that the overall distributions of the stellar masses
(normalized histograms of dN/d(log M? )) are very similar, and
in particular their maximum (mode) is at ∼ 10.75 in both cases.
Cross-matching the two samples gives about 145 000 galaxies
with stellar masses from both KiDS-Bright and GAMA. We
compare these directly in Fig. 5, where we also plot the run-
ning median relation together with the corresponding SMAD
(respectively thick and thin red lines). We see that the relation
is within ∼ 1σ from the identity line (dashed) over a wide
range in stellar mass, and departs from it significantly only at
the tails of the distribution. On average, the KiDS-Bright stellar
mass estimates are smaller than those of GAMA by ∆ log M? ≡
log M∗KiDS −log M∗GAMA = −0.09±0.18 dex (median and SMAD).
Such overall bias between the former and the latter is expected:
while our flux-scale correction is meant to compensate for the
flux missed by the GAaP measurements with respect to AUTO
magnitudes, an analogous correction in GAMA serves to ac-
count for flux that falls beyond the finite SDSS-based AUTO aper-
Fig. 5. Comparison of the derived stellar masses between the photo- ture used for the SEDs.
metric KiDS-Bright sample (this work) and the spectroscopic GAMA Nonetheless, the overall consistency is remarkable, given
dataset for galaxies common to both catalogs. The light gray to black that the stellar masses were determined using different data
scaling illustrates the bulk of the sample, while the outliers where the and methodology: GAMA employed spectroscopic redshifts to-
number density is smaller, are shown with individual large gray dots.
gether with LAMBDAR photometry from SDSS+VIKING u to
The thick red line is the running median, and thin red lines illustrate the
scatter (SMAD). Y bands, while we used photo-zs and GAaP KiDS+VIKING u
to Ks measurements. While the GAMA stellar masses cannot be
treated as the ‘ground truth’ due to inevitable systematics in the
filter profiles measured at the center of the field of view, avail- modeling, it is worthwhile exploring trends in the stellar mass
able from the ESO webpages6 . For the NIR VISTA data we use differences between the two data sets. We observe no significant
the averaged filter profile of all 16 filter segments per band (Edge trend of ∆ log M? with magnitude or with color. Not surprisingly,
et al. 2013). the use of photo-zs does affect the performance for galaxies es-
The LePhare code returns a number of quantities for each pecially at very low redshifts (zspec . 0.07).
source, detailed in Appendix C. The best-fit MASS_BEST is the In general, we observe a linear trend in ∆ log M? with δz/(1+
one that should be used as the estimate of galaxy’s stellar mass; z). If we account for this trend, the SMAD in ∆ log M? is ∼ 0.17
this quantity is available for almost all KiDS-Bright objects, dex, that is ∼ 9% lower than for the entire matched sample; this
except for a few hundred which have unreliable photo-zs (e.g. difference can be regarded as the effective increase in the scat-
zphot < 0). When using these stellar mass estimates, it is however ter between GAMA and KiDS-Bright stellar mass derivations
important to take into account the ‘flux scale correction’ related due to the photo-zs only. Overall, we find that the results are
to the fact that the GAaP magnitudes used by LePhare under- robust, with roughly constant scatter, if we select galaxies with
estimate fluxes of large galaxies. The correction that we use is zphot > 0.1, for which the SMAD in ∆ log M? reduces to ∼ 0.17
based on the difference between the AUTO and GAaP r-band dex. Therefore we restrict the GGL analysis presented in the next
magnitudes (see Eqn. C.1) and it is added to the logarithm of the section to this redshift range; the removed galaxies would not be
stellar mass estimate given by MASS_BEST (Eqn. C.2). of much importance for the lensing analysis in any case.
The code also outputs MASS_MED, which is the median of We use the absolute r-band magnitude and the rest-frame u −
the galaxy template stellar mass probability distribution func- g color derived with LePhare (employing the ANNz2 photo-zs
tion. This quantity can take a value of −99, which indicates as input redshifts) to select red and blue galaxies based on an
that a galaxy was best-fit by a non-galaxy template (although empirical cut through the green valley in the color-magnitude
the MASS_BEST value still reports the mass from the best-fitting diagram. We identify the ridge of the blue cloud to define the
galaxy template). In some cases this could highlight stellar con- slope and locate the minimum at the absolute magnitude of Mr =
tamination for sources that are best-fit by a stellar template and −19. This results in a line that delimits the red and blue sample:
additionally have a small flux radius, and could be even used for
star-galaxy separation (see the related discussion in Wright et al. u − g = 0.825 − 0.025 Mr . (2)
2019). This is, however, not a concern for our sample: out of
over 270 000 objects with MASS_MED = −99, only a few lie on
the stellar locus. This further confirms the very high purity level Based on this cut we define our red sample as those galaxies
of the KiDS-Bright catalog, as already concluded in Sect. 2.3. whose u − g color is at least 0.05 mag above the cut line and the
The median stellar mass of the KiDS-Bright sample is blue sample as those whose color is at least 0.05 mag below the
log(M? /M ) ∼ 10.5, with a range between the 1st and 99th line. The color-magnitude distribution and the cut through the
percentile of roughly 8.5 < log(M? /M ) < 11.4. In order to green valley are shown in Fig. 6. The photo-z statistics for the
red and blue galaxies defined this way have been presented in
6
https://www.eso.org/sci/facilities/paranal/ Sect. 3; below in Sect. 5 we use this split as well as the stellar
instruments/omegacam/inst.html masses in GGL measurements.
Article number, page 9 of 19You can also read