Traceability and transparency of cocoa supply chains in Côte d'Ivoire and Ghana
←
→
Page content transcription
If your browser does not render page correctly, please read the page content below
Traceability and transparency of cocoa supply chains in Côte d’Ivoire and Ghana   1

Traceability and transparency
of cocoa supply chains in
Côte d’Ivoire and Ghana
2                                              Traceability and transparency of cocoa supply chains in Côte d’Ivoire and Ghana

    Table of contents
           1. Cocoa supply chain description  .  .  .  .  .  .  .  .  .  .  .  .  .  .  .  .  .  .  .  .  .  .  .  .  .  . 5
              1.1 Côte d’Ivoire .  .  .  .  .  .  .  .  .  .  .  .  .  .  .  .  .  .  .  .  .  .  .  .  .  .  .  .  .  .  .  .  .  .  .  . 5
                  Production  .  .  .  .  .  .  .  .  .  .  .  .  .  .  .  .  .  .  .  .  .  .  .  .  .  .  .  .  .  .  .  .  .  .  .  . 5
                  National trade .  .  .  .  .  .  .  .  .  .  .  .  .  .  .  .  .  .  .  .  .  .  .  .  .  .  .  .  .  .  .  .  .  .  10
                  Processing and export .  .  .  .  .  .  .  .  .  .  .  .  .  .  .  .  .  .  .  .  .  .  .  .  .  .  .  .  . 11
              1.2 Ghana  .  .  .  .  .  .  .  .  .  .  .  .  .  .  .  .  .  .  .  .  .  .  .  .  .  .  .  .  .  .  .  .  .  .  .  .  .  .  14
                  Production  .  .  .  .  .  .  .  .  .  .  .  .  .  .  .  .  .  .  .  .  .  .  .  .  .  .  .  .  .  .  .  .  .  .  . 14
                  National trade .  .  .  .  .  .  .  .  .  .  .  .  .  .  .  .  .  .  .  .  .  .  .  .  .  .  .  .  .  .  .  .  .  .  16
                  Processing and export .  .  .  .  .  .  .  .  .  .  .  .  .  .  .  .  .  .  .  .  .  .  .  .  .  .  .  .  . 20
              1.3 Smuggling between Ghana, Côte d’Ivoire and Liberia .  .  .  .  .  .  .  .  .  .  .  .  .  .  21
              1.4 Consumer markets  .  .  .  .  .  .  .  .  .  .  .  .  .  .  .  .  .  .  .  .  .  .  .  .  .  .  .  .  .  .  . 22
                  Importers and chocolate manufacturers  .  .  .  .  .  .  .  .  .  .  .  .  .  .  .  .  .  .  .  .  22

           2. Traceability initiatives and trends  .  .  .  .  .  .  .  .  .  .  .  .  .  .  .  .  .  .  .  .  .  .  .  .  24
              2.1 Côte d’Ivoire’s Conseil Café Cacao (CCC) .  .  .  .  .  .  .  .  .  .  .  .  .  .  .  .  .  .  .  .  24
              2.2 Ghana's Cocobod  .  .  .  .  .  .  .  .  .  .  .  .  .  .  .  .  .  .  .  .  .  .  .  .  .  .  .  .  .  .  .  .  26
                  Overview of Ghana’s Cocoa Traceability System .  .  .  .  .  .  .  .  .  .  .  .  .  .  .  .  26
                  Current Cocoa Traceability System in Ghana .  .  .  .  .  .  .  .  .  .  .  .  .  .  .  .  .  .  26
                  Gaps in the current system .  .  .  .  .  .  .  .  .  .  .  .  .  .  .  .  .  .  .  .  .  .  .  .  .  .  .  32
                  Proposed reforms to cocoa traceability in Ghana  .  .  .  .  .  .  .  .  .  .  .  .  .  .  . 32
              2.3 Certifications’ traceability requirements .  .  .  .  .  .  .  .  .  .  .  .  .  .  .  .  .  .  .  . 33
              2.4 Private exporters and processors traceability systems .  .  .  .  .  .  .  .  .  .  .  .  .  35

           3. Traceability challenges: an opportunity to enhance transparency .  .  .  .  .  .  . 37
              3.1 Challenges faced by current traceability schemes .  .  .  .  .  .  .  .  .  .  .  .  .  .  . 37
              3.2 Transparency as a means to improve traceability .  .  .  .  .  .  .  .  .  .  .  .  .  .  .  .  39

           4. Sources of information to monitor sustainability risk  .  .  .  .  .  .  .  .  .  .  .  .  .  42

           5. Conclusion  .  .  .  .  .  .  .  .  .  .  .  .  .  .  .  .  .  .  .  .  .  .  .  .  .  .  .  .  .  .  .  .  .  .  .  .  .  44

          Disclaimer
          This report has been prepared by Nitidae for the EU REDD Facility, with the assistance of the European Union.
          The contents of this report are the sole responsibility of the authors and can under no circumstances be
          regarded as reflecting the position of the European Union.
          © EU REDD Facility, March 2021.

          Suggested citation: Nitidae and EFI, Traceability and transparency of cocoa supply chains in Côte d’Ivoire
          and Ghana, 2021.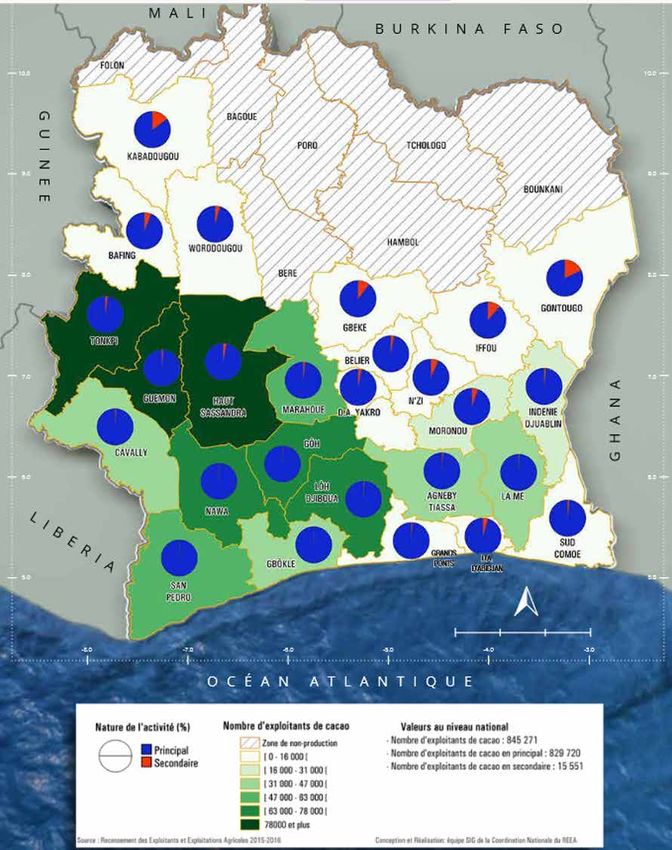
Traceability and transparency of cocoa supply chains in Côte d’Ivoire and Ghana                                                     3

Table of figures
Figure 1. Comparison of different mapping of cocoa production and
acreage from different sources .  .  .  .  .  .  .  .  .  .  .  .  .  .  .  .  .  .  .  .  .  .  .  .  .  .  .  .  .  . 5
Figure 2. Size cocoa trade by department in share of national production,
average of three seasons 2017/2018 – 2018/2019 – 2019-2020  .  .  .  .  .  .  .  .  .  .  . 6
Figure 3. Land cover of Côte d’Ivoire  .  .  .  .  .  .  .  .  .  .  .  .  .  .  .  .  .  .  .  .  .  .  .  .  .  . 7
Figure 4. Cocoa farms number by region in Côte d’Ivoire  .  .  .  .  .  .  .  .  .  .  .  .  .  .  .  .  . 7
Figure 5. Land productivity changes NDVI-USGS 2018 .  .  .  .  .  .  .  .  .  .  .  .  .  .  .  .  .  . 8
Figure 6. Geographical distribution of cocoa production in southern
Côte d’Ivoire during 2017 to 2020  .  .  .  .  .  .  .  .  .  .  .  .  .  .  .  .  .  .  .  .  .  .  .  .  .  .  .  . 8
Figure 7. Snapshot of cocoa acreage and classified forests layers combined
in IMAGE platform .  .  .  .  .  .  .  .  .  .  .  .  .  .  .  .  .  .  .  .  .  .  .  .  .  .  .  .  .  .  .  .  .  .  .  .  . 9
Figure 8. National cocoa supply chain with estimated shares in 2019/2020 .  .  .  .  .  11
Figure 9. Evolution of the market shares of the eight main cocoa
exporters/processors in Côte d’Ivoire  .  .  .  .  .  .  .  .  .  .  .  .  .  .  .  .  .  .  .  .  .  .  .  .  . 11
Figure 10. Certification and ‘transparency’ initiatives of the main cocoa
exporters of Côte d’Ivoire .  .  .  .  .  .  .  .  .  .  .  .  .  .  .  .  .  .  .  .  .  .  .  .  .  .  .  .  .  .  .  .  12
Figure 11. Farm mapping and certified volumes of the main cocoa
exporters in Côte d’Ivoire .  .  .  .  .  .  .  .  .  .  .  .  .  .  .  .  .  .  .  .  .  .  .  .  .  .  .  .  .  .  .  .  13
Figure 12. Extract from the Olam-CFI progress report 2019/2020 .  .  .  .  .  .  .  .  .  .  13
Figure 13. Cocoa map production by region and chart of the evolution of
cocoa production by region from 1960/1961 to 2018/2019 .  .  .  .  .  .  .  .  .  .  .  .  .  15
Figure 14. Land-use map with distinction between full sun cocoa and
agroforestry cocoa in Southern Ghana .  .  .  .  .  .  .  .  .  .  .  .  .  .  .  .  .  .  .  .  .  .  .  .  .  16
Figure 15. List of active LBCs during the 2016/2017 cocoa
season in Ghana  .  .  .  .  .  .  .  .  .  .  .  .  .  .  .  .  .  .  .  .  .  .  .  .  .  .  .  .  .  .  .  .  .  .  .  . 16
Figure 16. Snapshot of Cocoa Board Annual reports with traded
quantities by LBC .  .  .  .  .  .  .  .  .  .  .  .  .  .  .  .  .  .  .  .  .  .  .  .  .  .  .  .  .  .  .  .  .  .  .  .  17
Figure 17. List of the main LBC during the 2016/2017 cocoa season in Ghana  .  .  .  18
Figure 18. Share of national trade in cocoa by corporations .  .  .  .  .  .  .  .  .  .  .  .  . 19
Figure 19. Cocoa supply chain in Ghana, based on Cocobod and LBCs data .  .  .  .  .  20
Figure 20. Processing shares of local processors in Ghana during
2016/2017 season .  .  .  .  .  .  .  .  .  .  .  .  .  .  .  .  .  .  .  .  .  .  .  .  .  .  .  .  .  .  .  .  .  .  .  20
4                                        Traceability and transparency of cocoa supply chains in Côte d’Ivoire and Ghana

    Figure 21. Evolution of share of cocoa beans traded by Côte d’Ivoire and
    Ghana with price spread between the two countries .  .  .  .  .  .  .  .  .  .  .  .  .  .  .  .  .  .  21
    Figure 22. Comparison of cocoa beans export price between Ghana,
    Côte d’Ivoire and Liberia .  .  .  .  .  .  .  .  .  .  .  .  .  .  .  .  .  .  .  .  .  .  .  .  .  .  .  .  .  .  .  . 21
    Figure 23. Ghana cocoa beans and cocoa product imports by main importers .  .  .  . 22
    Figure 24. Estimation of quantity of beans traded and declared percentage
    of ‘sustainable’ cocoa for main cocoa trading companies and main chocolate
    manufacturers.  .  .  .  .  .  .  .  .  .  .  .  .  .  .  .  .  .  .  .  .  .  .  .  .  .  .  .  .  .  .  .  .  .  .  .  .  . 23
    Figure 25. Screenshot of SYDORE .  .  .  .  .  .  .  .  .  .  .  .  .  .  .  .  .  .  .  .  .  .  .  .  .  .  . 24
    Figure 26. Screenshot of CCC web platform to monitor quality, input
    distribution, export, processing and international sales  .  .  .  .  .  .  .  .  .  .  .  .  .  .  .  . 25
    Figure 27. Scheme of CCC’s current monitoring system .  .  .  .  .  .  .  .  .  .  .  .  .  .  . 25
    Figure 28. Sample Farmer’s Passbook issued by Cocobod  .  .  .  .  .  .  .  .  .  .  .  .  .  . 27
    Figure 29. Sample Daily Stock book kept by purchasing clerks at the clerk’s
    shed level .  .  .  .  .  .  .  .  .  .  .  .  .  .  .  .  .  .  .  .  .  .  .  .  .  .  .  .  .  .  .  .  .  .  .  .  .  .  .  . 27
    Figure 30. Bulking Sheet sample  .  .  .  .  .  .  .  .  .  .  .  .  .  .  .  .  .  .  .  .  .  .  .  .  .  .  . 28
    Figure 31. Waybill accompanying cocoa from the purchasing clerk shed
    level.  .  .  .  .  .  .  .  .  .  .  .  .  .  .  .  .  .  .  .  .  .  .  .  .  .  .  .  .  .  .  .  .  .  .  .  .  .  .  .  .  .  . 28
    Figure 32. Sample warehouse receipt .  .  .  .  .  .  .  .  .  .  .  .  .  .  .  .  .  .  .  .  .  .  .  .  . 29
    Figure 33. ‘Society’ (purchasing clerk shed) detailed report (tally sheet).  .  .  .  .  .  . 30
    Figure 34. Sample material transfer note  .  .  .  .  .  .  .  .  .  .  .  .  .  .  .  .  .  .  .  .  .  .  . 30
    Figure 35. Sample siding depot waybill .  .  .  .  .  .  .  .  .  .  .  .  .  .  .  .  .  .  .  .  .  .  .  . 31
    Figure 36. Cocoa supply chain monitoring system in Ghana  .  .  .  .  .  .  .  .  .  .  .  .  . 31
    Figure 37. Comparison of the traceability requirements of different
    certification standards  .  .  .  .  .  .  .  .  .  .  .  .  .  .  .  .  .  .  .  .  .  .  .  .  .  .  .  .  .  .  .  .  . 34
    Figure 38. List of software used by the main trading companies for traceability.  .  . 35
    Figure 39. Challenges to full traceability .  .  .  .  .  .  .  .  .  .  .  .  .  .  .  .  .  .  .  .  .  .  .  . 39
    Figure 40. Share of the national production bought by the top six international
    trading companies, directly procured, certified, and sold as certified quantities
    of cocoa beans in Ghana and Côte d’Ivoire .  .  .  .  .  .  .  .  .  .  .  .  .  .  .  .  .  .  .  .  .  .  . 39
    Figure 41. Available data identified during the study .  .  .  .  .  .  .  .  .  .  .  .  .  .  .  .  . 42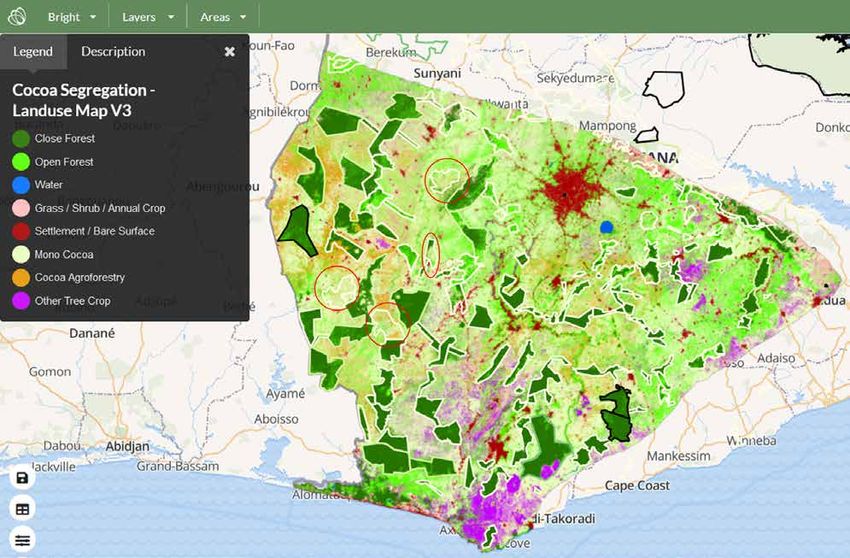
Traceability and transparency of cocoa supply chains in Côte d’Ivoire and Ghana                                                      5

1. Cocoa supply chain description
1.1 Côte d’Ivoire
Production

Cocoa is produced almost everywhere in the southern half of Côte d’Ivoire.
Unfortunately, accurate information on the geographical extension of production
by region or department is unavailable.

This study could only gather limited information on the number of farmers involved in
cocoa production by region from national agriculture surveys (RNA 2014 and 2016).
Further, remote sensing data and several maps from different sources, compared below,
provide an inaccurate image of cocoa acreage by region (BNETD 2016, Vivid Economics
2017, JRC).

Figure 1. Comparison of different mapping of cocoa production and acreage from different sources

  2003 – MINADER                                 2014 – FAO                                        BNETD-NITIDAE 2016
  Production                                     Zone (maroon line)                                (Area – in % of total area)

  2018 – CIAT                                    FAOSTAT 2018                                      FAOSTAT 2018
  (Area – maroon areas)                          (Area – in thousands ha)                          2020 – JRC (Area – yellow dots)
6                                      Traceability and transparency of cocoa supply chains in Côte d’Ivoire and Ghana

    When compared with the cocoa trading data by department provided by the
    Coffee-Cocoa Board (in French, Conseil du Café et du Cacao or CCC), all these
    maps seem to be relatively inaccurate.

    Figure 2. Size of cocoa trade by department in share of national production, average of three
    seasons 2017/2018 – 2018/2019 – 2019-2020. Source: Mapping of CCC data by IED-Nitidae¹

    Various reasons can explain the differences between several data sources and this
    more accurate mapping of production areas:
     • Differences in yields between older production areas in the east, and younger cocoa
       production areas in the west. In the west, more cocoa plantations are in their first cycle.
       The cocoa trees were planted more recently and including in forest areas in the west, taking
       advantage of post-forest fertility and lower pest pressure. They are also better maintained.
       Average yields in the east and the centre of the country are probably much lower than in the
       west. This can explain, in part, the difference between acreage and production data.
     • Shaded cocoa production in classified forests of the west is harder to detect by remote
       sensing. Nonetheless, three to four years after planting, most shade trees are dead (either
       burnt or slowly killed by farmers who cut their bark). Remote sensing should therefore now
       be able to identify most productive areas.
     • Concerns of Ivorian authorities and cocoa exporting companies about the increased
       awareness of other stakeholders (final buyers, retailers, consumers, NGOs, governments)
       of the higher deforestation risks of the west. In the east and the centre of the country, most
       forests were converted to cocoa, rubber and palm oil production many years ago.

    The recent land use/deforestation mapping carried out by the Ministry of Planning
    and Development, Vivid Economics and the UK Space Agency in 2017, and updated
    in November 2020, seems much more accurate, as shown below.

    ¹ IED-Nitidae, Rapport d'Evaluation du Potentiel Biomasse Energie en Côte d'Ivoire, 2021 (unpublished)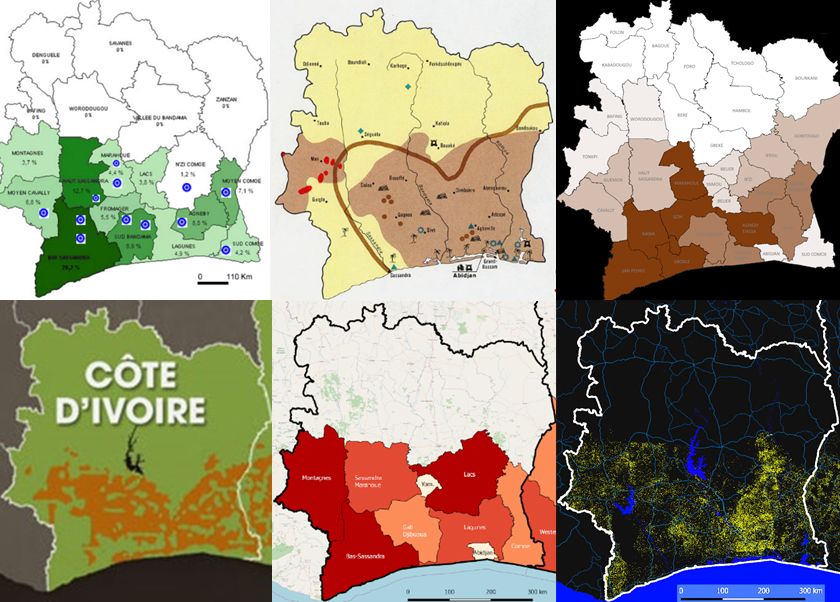
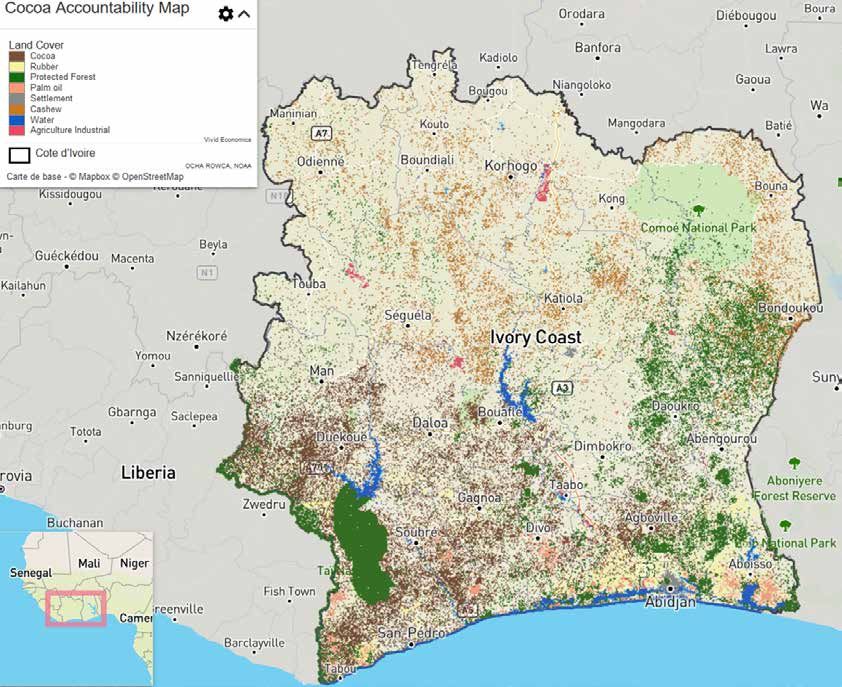
Traceability and transparency of cocoa supply chains in Côte d’Ivoire and Ghana                      7

Figure 3. Land cover of Côte d’Ivoire. Source: Mighty Earth with data from Image (Vivid Economics,
UK Space Agency & Ministry of Planning and Development)

A map from the National Farm Survey report (REEA 2016²) also shows the
concentration of cocoa production in the West. This is despite being based
on the number of cocoa farms only, and not on production or acreage data.

Figure 4. Cocoa farms number by region in Côte d’Ivoire. Source: REEA 2016 - FAO

² http://www.fao.org/3/ca3111fr/CA3111FR.pdf
8 Traceability and transparency of cocoa supply chains in Côte d’Ivoire and Ghana
The combination of these three maps confirms that nowadays, most cocoa production
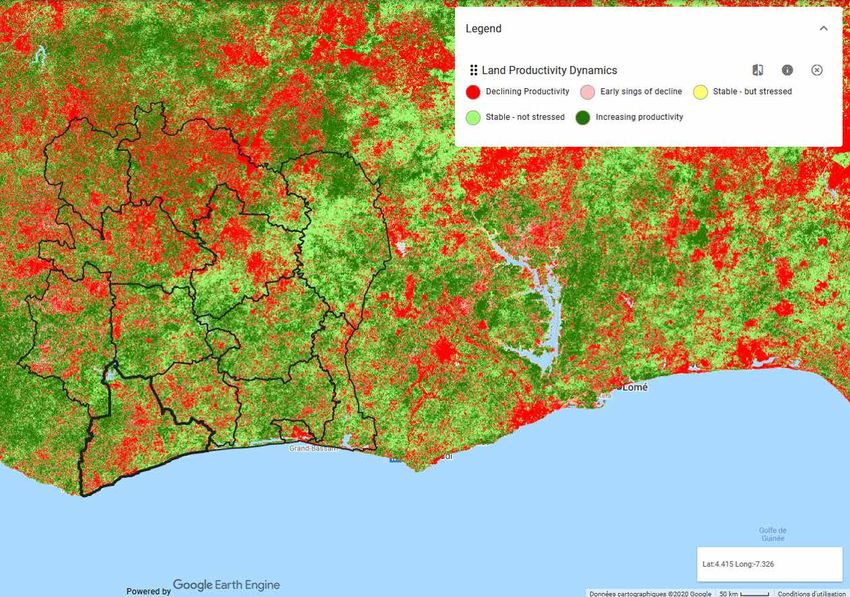
is concentrated in the west of Côte d’Ivoire. This finding is confirmed by the land
productivity dynamics map below, which shows that in southern Côte d’Ivoire, those
regions are the ones with the highest decline in productivity.
It can be concluded from the above that around 60% of Côte d’Ivoire’s cocoa
production - or 37% of global cocoa production - is concentrated in the western
regions of the country. Only 8% of the Ivorian output is sourced in the eastern regions.
Figure 5. Land productivity changes NDVI-USGS 2018. Source: www.earthmap.org
Geographical distribution of cocoa production in southern Côte d’Ivoire during 2017 to 2020
Figure 6. Geographical distribution of cocoa production in southern Côte d’Ivoire during 2017 to 2020.
Source: Nitidae based on CCC data
East (Indenie - Djuablin,
Others
Me, Sud Comoé, Moronou)
33 000
180 400 West (Guemon, Cavally,
2%
8% San-Pedro, Haut Sassandra, Nawa)
1 293 600
59%
Centre (Loh-Djiboua,
Goh, Gbokle, Marahoue, -
Grands Ponts, Agenby -
Tiassa)
688 600
31%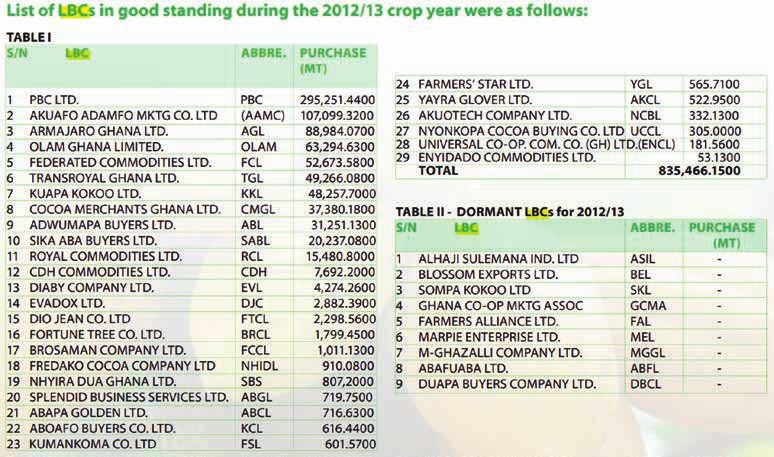
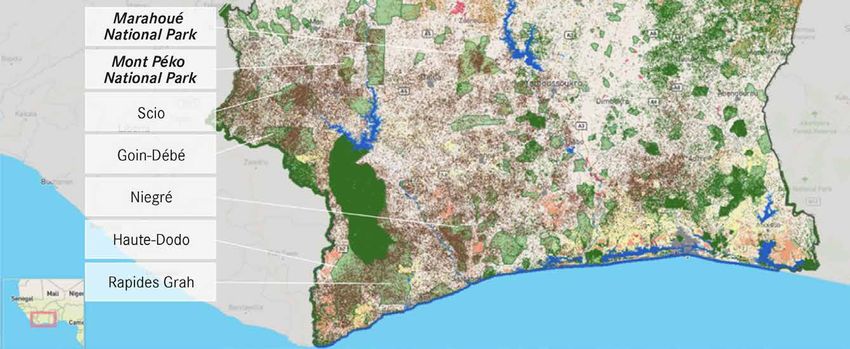
Traceability and transparency of cocoa supply chains in Côte d’Ivoire and Ghana                                9

Figure 6 indicates that a large share of the production in the west comes from classified
forests. In informal interviews, most stakeholders in the cocoa sector, including cocoa
exporters and processors, estimated that at least one third of Ivorian cocoa comes from
classified forests. This figure is likely to be slightly inflated. Considering that 25% to 30%
of cocoa is produced in these protected areas would be a more accurate estimate. The
concentration is particularly high in several classified forests that were (re)categorised
as ‘agroforests’ during the 2019 forest reform (see list below), but also in national parks
(see in bold and italic below).

Figure 7. Snapshot of cocoa acreage and classified forests layers combined in IMAGE platform. Source: Mighty
Earth with data from IMAGE (Vivid Economics, UK Space Agency & Ministry of Planning and Development)

In April 2019, the CCC initiated a national census of cocoa farmers, including
georeferencing of all cocoa farm plots. This census is conducted by a team of 800
enumerators and is expected to be completed by March 2021. At the time of writing
(December 2020), two point four million hectares had already been georeferenced. CCC
estimates these to represent around 60% of the total acreage. In October 2020, CCC’s
enumerators were georeferencing cocoa plots in classified forests.

The census also covers socioeconomic indicators. These include issues related to the
household and its ‘leader’ (including ID documentation), production factors (inputs,
storage capacity, cost of manpower) and presence of swollen shoot virus and other
pests affecting cocoa yields.

CCC’s medium-term objective is to build a complete identification system of cocoa
farmers, with a unique identification number for each farmer and full traceability from
plot to port. After the census, unregistered farmers will be required to register in a CCC
regional office to be able to sell their production. A CCC officer will geo-reference their
cocoa plots during the registration process. In the long term, the CCC intends to use this
traceability system to promote the complete digitalisation of payments in the cocoa sector.

CCC contracted a consulting firm to design the architecture of the traceability and
payment system. It is in the process of gathering information on the traceability systems
developed by the different exporting companies. However, they will propose a new system
to replace the multiple and independent traceability systems.
10                                       Traceability and transparency of cocoa supply chains in Côte d’Ivoire and Ghana

     National trade

     A handful of large farms (over 10 ha) sell directly to the local cooperative or to a
     wholesaler. Otherwise, most cocoa farmers sell their beans to small local traders
     called ‘pisteurs’ (literally, ‘trackers’) and to ‘cooperative sections’.

     Cooperative sections exist in most villages and even in informal hamlets in former
     forest areas called ‘campements’ or camps. Many cooperatives have sections close to,
     or inside protected area/classified forests as documented in a 2013 report co-authored
     by GIZ and the Ivorian Agriculture Ministry³.

     As a result of the traceability and certification programmes implemented by almost all
     the cocoa exporting companies during the last decade, cooperatives’ market share has
     grown. Based on our interviews, around 45% of cocoa beans is estimated to have been
     traded through cooperatives during the last two seasons.

     Generally, the cooperative’s headquarters is based in a middle-sized city or sub-
     prefecture. But the cooperative’s supply is spread among several villages, sometimes
     farther than 100 km from the headquarters, where the cooperative has ‘sections’ and
     where the cleaning, grouping and often the storage of the cocoa beans are organised
     before purchase and transportation.

     Most farmers sell their cocoa beans to both local traders and cooperatives. Cooperatives
     can compete with local traders thanks to the certification premium they can offer, at
     least for part of the farmers’ production. However, they are usually unable to collect their
     members’ entire production for various reasons: their shorter period of activity (they
     often start buying cocoa beans several weeks after the start of the trading season due to
     limited funding); higher operational costs in comparison to local traders who trade other
     commodities than cocoa; and their ability to pay certification premiums only for part of
     the cocoa beans delivered. Furthermore, local traders can often provide other services
     to farmers, such as credit, advantages in the sale or purchase of food crops, supply of
     inputs, more efficiently and consistently than cooperatives. This allows them to keep a
     good market share.

     As explained in a research article by Ruf and al. of 2020⁴, cooperatives have to purchase
     cocoa beans outside their sections (to small local traders or even large wholesalers)
     to respect the quality requirement of the exporter or processor to whom they sell
     certified beans. In parallel, some cooperatives’ sections sell their members’ production
     to wholesalers when the payment from the cooperative takes too long, or if those
     wholesalers can propose a higher certification premium.

     Finally, even if the national supply chain could be simplified by referring to a ‘cooperative
     supply chain’ and an ‘independent trader supply chain’, both are interdependent. All
     exporters interviewed recognised that even if they wanted to increase the share of
     cooperatives in their supply chain, they would maintain part of their supply from local
     wholesalers. This is because the latter are more efficient in terms of trading cost and
     delivery time, less risky in terms of financial embezzlement, and partly or even entirely
     self-funded. The most ambitious exporters and national processors indicated they could
     source up to 90% of their cocoa beans through cooperatives in the medium term, but
     none mentioned a 100% target.

     ³ Étude de la production de cacao en zone riveraine du Parc national de Taï, février 2013. Auteurs : Frédéric Varlet et Georges
        Kouame, publication du GIZ en collaboration avec le Ministère ivoirien de l’Agriculture et la Coopération allemande.
     ⁴ Ruf François, Uribe Leitz Enrique, Gboko Kouamé Casimir et al., « Des certifications inutiles ? Les relations asymétriques
        entre coopératives, labels et cacaoculteurs en Côte d’Ivoire », Revue internationale des études du développement, 2019/4
        (N° 240), p. 31-61. DOI : 10.3917/ried.240.0031. URL: https://www.cairn-int.info/revue-internationale-des-etudes-du-
        developpement-2019-4-page-31.htm
Traceability and transparency of cocoa supply chains in Côte d’Ivoire and Ghana 11
Figure 8. National cocoa supply chain with estimated shares in 2019/2020. Source: Nitidae
Smuggling
Production - 900 000 households from Liberia
2 150 000 metric tons (MT) PRODUCTION
50 000 MT
>10 000 Cooperatives’ sections >10 000 Local buying agents
1 000 000 MT (Pisteurs) 1 200 000 MT COLLECTION
2 900 Cooperatives (2017) 187 Local traders (Traitants) NATIONAL
725 000 MT 1 300 000 MT TRADE
24 exporting 1 union of coop Smuggling
11 Processors 45 Exporters
cooperatives 550 000 MT 50 000 MT 1 350 000 MT to Ghana EXPORT
175 000 MT 75 000 MT
Processing and export
Available data on processing and export shows that this activity is very concentrated,
even if the concentration decreased in comparison to the 2000s.
Figure 9. Evolution of the market shares of the eight main cocoa exporters/processors in Côte d’Ivoire⁵
2004 2006 2016 2017 2018 2019
/ 2005 / 2007 / 2017 / 2018 / 2019 / 2020
Market share of
the eighth-largest
cocoa exporters 73% 76% 59% 61% 63% 62%
/processors
Furthermore, the main clients (importers) of the Ivorian exporting companies are the
sister companies of the top six international trading companies (Barry Callebaut, Olam,
Cargill, ECOM, Touton and SUCDEN⁶).
The market share of Ivorian cocoa trade of these six companies is therefore probably
greater than what appears in the export statistics of Côte d’Ivoire. Among the top 16
exporters/processors, which represent 78% of the cocoa exports, most are involved
in or implementing a certification and traceability scheme (see Figure 10).
⁵ https://www.scirp.org/html/htmltables/3-2120190Templetes/3-2120190_table_5.htm and customs data processed by Nitidae.
⁶ https://www.africasourcing.net/our-clients/our-references/12 Traceability and transparency of cocoa supply chains in Côte d’Ivoire and Ghana
Figure 10. Certification and ‘transparency’ initiatives of the main cocoa exporters of Côte d’Ivoire. Source: Nitidae based on companies’
websites. RA= Rainforest Alliance; FLO= Fairtrade
Group Market Map of cooperative
Rank CTY Website Name in CI UTZ RA FLO Organic
name share for direct supply
1 CARGILL US www.cargill.com CARGIL WA (beans) 11.9% x x x https://www.cargill.com/
& CARGILL COCOA sustainability/cocoa/
SA (grinding) partner-cooperatives
2 Barry CH www.barry- BCN (beans) + 11.8% x x x https://www.barry-callebaut.
Callebaut callebaut.com SACO (Process) com/en/group/forever-
chocolate/sustainable-range/
transparency-and-traceability-
our-cocoa-supply-chain
3 Olam SG www.olamgroup OUTSPAN. + Olam 10.3% x x x https://ofis.olamdigitalcom/
.com Cocoa Processing + #/login
UNICAO Access restricted to clients
4 Société CI http://sacc SACC + SAF 7,6% x x x No website – no data
Agricole -ci.com CACAO +
de Café et CIPEXICI
de Cacao
5 Touton FR www.touton TOUTON NEGOCE 6,3% x x x https://touton.com/
.com CI (TNCI) touton-cocoa-sourcing-
map-cote-d-ivoire
6 Sucre & FR www.sucden SUCDEN CÔTE 5,8% x x x Access restricted to clients
Denrées .com D'IVOIRE
7 S3C CI S3C 5.4% x x x No website – no data
8 Cémoi FR www.cemoi.fr CEMOI TRADING 3.4% x x x x https://www.mightyearth.
S.A. org/cocoa-accountability
9 Africa CI www. ARMAJARO 2,9% x x No data on suppliers
Sourcing africasourcing.net NEGOCE
10 ECOM CH www. ZAMACOM S.A. 2,7% x x www.ecomsms.com
ecomtrading.com Access restricted to clients
11 ECOOKIM CI http://ecookim. Union des Sociétés 2,5% x x x x http://ecookim.com/
com Coopérative Kimbe notre-reseau/
12 EUROFIND CI Ivory Cocoa Product 2.0% x x No website – no data
13 Tan SG www.tanmondial TAN IVOIRE SARL 1,7% x No data
Mondial .com
14 Société de CI SONEMAT 1,7% No website – no data
négoce de
matières
premières
15 SCAT CI STE COOP AGRI 1,6% x No website – no data
DE TOUIH
16 CNEK CI https://www. COOPÉRATIVE 1,5% x x x No data
facebook.com/ NOUVEL ESPRIT
cnekci DE KETESSOTraceability and transparency of cocoa supply chains in Côte d’Ivoire and Ghana 13
Published data by exporters provides some indication of the size of the certified
procurement.
Figure 11. Farm mapping and certified volumes of the main cocoa exporters in Côte d’Ivoire.
Source: Nitidae based on company reports and websites
Quantity of cocoa Number of plots/ Quantity certified (all
Group
Rank exported/processed farms mapped in certification, in metric
name
in 2019/2020 CI 2019/2020 tons, if available)
1 CARGILL 245 835 122 000 105 000
2 Barry 243 135 87 160 110 000
Callebaut
3 Olam 212 012 76 373
5 Touton 129 254 34 552
6 Sucre & 119 774 17 297
Denrées
8 Cémoi 70 419 13 984
10 ECOM 56 170 30 000
Total 1 075 600 381 366
Figure 12. Extract from the Olam-CFI progress report 2019/202014 Traceability and transparency of cocoa supply chains in Côte d’Ivoire and Ghana
A significant challenge is the double reporting of the mapping, certification and
other sustainability actions and projects, by the trading/grinding companies and the
confectionery companies. Few companies provide financial information on sustainability
actions. The Olam-CFI progress report indicates that, these actions are mostly funded
by chocolate manufacturers.
Also, as traders do not share and compare their data, many farms/plots are mapped
several times by different exporting companies. UTZ/RA in Abidjan is the only
organisation to receive most of the mapping/ GPS points from all the companies. It
reported that over 20% of the farms registered in their platform are mapped by several
exporting companies.
These multiple counts hinder efforts to estimate the number of cocoa plots and farms
that have been mapped so far by the numerous sustainability and certification initiatives,
programmes or projects. However, it can be asserted that, at present, they amount to
less than 50% of all cocoa farms in Côte d’Ivoire and that most cocoa beans are not
traced ‘from the farm’. In addition, current company commitments under the Cocoa
Forest Initiative (CFI)⁷ not to source from national parks and protected areas are limited
to their direct supply.
1.2 Ghana
Production
Currently, finding up-to-date and accurate information on production data by jurisdiction
(cocoa region, cocoa district, etc.) in Ghana is challenging. Information collected is
predominantly paper-based and scattered at various points in the value chain. This is
in part because the data is currently collected at the local level and its collation into
a national database is a very slow process.
The Ghana Statistical Service (GSS) organised the first agricultural census in 33 years
in 2018.⁸ & ⁹ Although the GSS recently announced the first results,¹⁰ it did not publish
any detailed dataset. As for the Ghana Cocoa Board (Cocobod), although it possesses
some information for its forecasting and planning, it is usually kept confidential.
Following the liberalisation of cocoa trade in the 1990s, the system established by
the Cocobod to monitor the national cocoa beans supply chain has mainly aimed at
preserving the quality of Ghana’s cocoa. Based on these reforms, the system is still
largely paper-based. Data entry of collected forms does not provide detailed statistics
on production by locality or district. The only available figures are cocoa production by
region, which are published annually on the Cocobod’s website¹¹.
This data is mapped in Figure 13 below (based on the 10 administrative regions that
existed up to 2019, there are currently 16), which also shows the historical evolution
of cocoa trade by region.
⁷ On the sideline of the UN Climate Change Conference in November 2013 in Bonn, the Governments of Côte d’Ivoire and
Ghana and the world’s leading cocoa and chocolate companies signed agreements to end deforestation and promote
forest restoration and protection in the cocoa supply chain. They committed to harmonise their individual sustainability
programmes and to work together beyond competition. This partnership is called the Cocoa & Forests Initiative (CFI).
⁸ https://statsghana.gov.gh/gssmain/fileUpload/pressrelease/Press%20Release%20on%20Agric%20Census.pdf
⁹ http://www.fao.org/3/ca6708en/ca6708en.pdf
¹⁰ https://allafrica.com/stories/202010220253.html
¹¹ https://cocobod.gh/cocoa-purchasesTraceability and transparency of cocoa supply chains in Côte d’Ivoire and Ghana 15
Figure 13. Cocoa map production by region and chart of the evolution of cocoa production by region
from 1960/1961 to 2018/2019. Source: Cocobod
Cocoa trading by region in Ghana during the Evolution of cocoa trade by region in Ghana
season 2018/2019 (Source: COCOBOD, mapped (Source: Cocobod-in metric-tons)
by Nitidae – in metric tons – Total 812 000 MT)
1 200 000
1 000 000
Volta
800 000
Brong
Ahafo
Ashanti
600 000
Central
Brong Ahafo
Eastern
87 000
400 000
Volta Western
7 000
Ashanti
171 000 Eastern
200 000
94 000
Western
364 000 Central
89 000 0
1960/61
1962/63
1964/65
1966/67
1968/69
1970/71
1972/73
1974/75
1977/78
1979/80
1981/82
1983/84
1985/86
1987/88
1989/90
1991/92
1993/94
1995/96
1997/98
1999/00
2001/02
2003/04
2005/06
2007/08
2009/10
2011/12
2013/14
2015/16
2017/18
Apart from the ongoing national census, some data on farmers has been collected in
a survey led by IFPRI of 2845 farmers over 60 districts in 2011/2012¹². Datasets are
available on Harvard University’s website¹³.
They provide some information on some socioeconomic aspects of households,
age of cocoa plantations, diversification, etc. in each region. However, the datasets’
representativeness is limited as they cover a relatively small number of agricultural
households compared to the +2.5 million estimated during the recent census. Over the
last decade, cocoa companies have collected information on the farmers they source
cocoa from. Several efforts have been made to consolidate this data but have faced
challenges. First, companies are reluctant to share information due to data privacy laws
and the commercial nature of this information. Second, there have been concerns about
how this information was collected and the methods used.
Under the Forest 2020 project, work is underway to map cocoa production areas in Ghana.
The project’s platform features information on cocoa production areas but not on cocoa
production at the farm level or on farmers. The potential of improving the platform to offer
information on farmers and farms is in the pipeline. The Forest 2020 project is jointly
implemented by Ecometrica, the UK Space Agency and the Ghanaian Government.¹⁴
¹² https://gssp.ifpri.info/gaps/
¹³ https://dataverse.harvard.edu/dataset.xhtml?persistentId=doi:10.7910/DVN/26623
¹⁴ More information available at https://ecometrica.com/forests-2020/16 Traceability and transparency of cocoa supply chains in Côte d’Ivoire and Ghana
Raw data from the Forest 2020 project is unavailable, however, the project’s map
confirms that cocoa plantations have replaced several forest reserves (yellow line
polygons) (as indicated by red circles on the map in Figure 14).
Figure 14. Land-use map with distinction between full sun cocoa and agroforestry cocoa in Southern
Ghana. Source: Forest 2020 project, available on Mighty Earth website, amended by the authors
National trade
The national cocoa supply chain in Ghana follows a particular scheme. As Cocobod has
a monopoly on exports and supply of processing factories, all cocoa beans go through
Cocobod warehouses called “takeover points” located in Kaase (industrial area in Kumasi
suburbs), Takoradi or Tema. Cocoa collection and transport to takeover points are
managed by approximately 40 licensed buying companies (LBCs).
The list of active LBCs during the 2016/2017 season extracted from the 2017 Annual
report of the Cocobod is Figure 15.
Figure 15. List of active LBCs during the 2016/2017 cocoa season in Ghana. Source: Cocobod¹⁵
¹⁵ https://cocobod.gh/resources/annual-reportTraceability and transparency of cocoa supply chains in Côte d’Ivoire and Ghana 17
Recently, the market shares of these LBCs have changed as an increasing number of
international traders invest in LBCs (known within the sector as sister companies) to be able
to build a “direct procurement supply chain” in Ghana and provide surety for beans supply.
As visible below, in its annual report, Cocobod published the quantity of cocoa traded by
LBCs which shows a strong concentration within a few companies. Export statistics from
Ghana, confirmed that six companies represent around 75% of Cocobod’s sales.
Figure 16. Snapshot of Cocoa Board Annual reports with traded quantities by LBCs. Source: Cocobod Annual reports
List of licensed buying companies (LBCs) in good standing during the Performance of LBCs 2014/2015 season
2012/2013 crop year were as follows:
TABLE l
S/N LBC ABBRE. PURCHASE
(MT) LBC Tonnage LBC Tonnage
TABLE ll - DORMANT LBCs for 2012/2013
S/N LBC ABBRE. PURCHASE
(MT)
FIGURE l FIGURE l
Performance of LBCs - 2015/2016 season Performance of LBCs - 2016/2017 season
RCL KLC RCL SABL OTHERS
1.84% UNICOM
1.71% 1.45% 1.58% 1.35% 6.37%
NCBL SABL 1.15% Unicom
2.20% .0 1.64% PBC
27 OTHERS NCBL
AGL 3,98% 29.15%
13.43% 8.46%
OLAM
11.79%
PBC
30.88% AGL
14.01%
CMGL
6.92%
FCL
Olam 6.45%
TGL 10.66%
7.36% FCL
ABL 6.46% KKL
KKL CMGL ABL 5.30%
4.46% 6.37% TGL
5.74% 6.18% 3.09%
The main LBC, Produce Buying Company, is a public enterprise whose shares are mainly
held by the Social Security & National Insurance Trust and the Ministry of Finance of
Ghana. Other major LBCs are a mix of historical local trading companies and sister
companies of international traders. Farmer Cooperatives are beginning to appear in Ghana
following Cocobod’s recent directive to work through cooperatives to reach farmers, but
this is a very recent trend. These cooperatives could become LBCs. But at present, only
Kuapa Kooko, one of the major LBCs, is owned by a cooperative (see Figure 17).18 Traceability and transparency of cocoa supply chains in Côte d’Ivoire and Ghana
Figure 17. List of the main LBC during the 2016/2017 cocoa season in Ghana. Source: Cocobod.
Note: Cargill sister company was newly created, its market share increased during the last two seasons
Rank Company Name Acronym Website Ctry Kind Market Share
1 Product Buying PBC https://www.pbcgh.com GH Public 29%
Company
2 Armajaro AGL www.ecomtrading.com NL Sister Cie 14%
Ghana
3 Olam Ghana Olam https://www.olamgroup.com SG Sister Cie 11%
4 Nyonkopa NCBL www.barry-callebaut.com CH Sister Cie 8.5%
Commodities
Buyers
5 Federated FCL https://fedco.com.gh - GH Subsidiary 6.5%
Commodities https://globalhaulagegroup.com
6 Transroyal TGL https://transroyalghana.com/ - GH Subsidiary 6%
Ghana https://globalhaulagegroup.com
7 Cocoa Merchant CMGL https://cmlghana.com - GH Subsidiary 5%
Ghana https://globalhaulagegroup.com
8 Kuapa KKL https://www.kuapakokoo.com GH Coop 5%
Kokoo
9 Adwumapa ABL http://adwumapabuyers.com GH Private 3%
Buyers
10 Unicom Unicom www.ecomtrading.com NL Sister Cie 1.5%
Commodities
11 Royal RCL http://royalcommodities.com - GH Subsidiary 1.5%
Commodities https://globalhaulagegroup.com
12 Sika Aba SABL www.sikaababuyers.com GH Private 1.5%
Buyers
13 Cargill Kokoo Cargill www.cargill.com US Sister Cie 1%
SourcingTraceability and transparency of cocoa supply chains in Côte d’Ivoire and Ghana 19
One should note that since Global Haulage owns four subsidiary companies as an
LBC and Ecom owns two sister companies, the cocoa procurement market in Ghana
is extremely concentrated. This concentration is even more pronounced than in Côte
d’Ivoire and is also seen on the international market. Five companies concentrate 85%
of the total procurement.
Share of national trade in cocoa beans in
Ghana
Figure 18. Share of national trade in cocoa by by companies
corporations. Source: Nitidae research based on Cocobod data
Others
11%
Kuapa Kokoo PBC
5% 29%
Barry Callebaut
8%
Olam
11%
Global Haulage
20%
ECOM
16%
The main international traders who do not own an LBC have strong links with some
of them. Cargill recently procured a licence to operate an LBC. Before that, it mainly
worked with Global Haulage and Produce Buying Company. Touton, on the other hand,
recently partnered with Elihor Company (a new entrant and possibly a sister company)
and only purchases a small amount of beans from Produce Buying Company. Cocoanect
is mainly working with the Global Haulage group and Kooko Pa, which is linked to a
farmers’ union in the Ahafo Region of Ghana.
LBCs are represented by a network of purchasing clerks that operate at the local or
communal level (these purchasing clerks sheds are known as ‘society’ in the sector).
They purchase and collect beans and organise the transportation to their district
warehouses called “depot”. All the main LBCs have hundreds of purchasing clerks
in more than 50 districts in the country.20 Traceability and transparency of cocoa supply chains in Côte d’Ivoire and Ghana
Figure 19. Cocoa supply chain in Ghana, based on Cocobod and LBCs data. Source: Nitidae
Smuggling from
Production – 800 000 households Côte d’Ivoire PRODUCTION
725 000 metric tons (MT) 75 000 MT
A few
cooperatives +/- 10 000 purchasing clerks
720 000 MT COLLECTION
80 000 MT
3 LBC-Coop 40 Licensed Buying Companies NATIONAL
50 000 MT 750 000 MT
TRADE
Cocoa Marketing Company
Purchase: 800 000 MT
Beans export: 510 000 MT EXPORT
7 Processors
290 000 MT
Segregation of cocoa beans: all LBCs can ask for the segregation of the cocoa beans
they have bought when they sell them to the Cocoa Marketing Company paying an
additional cost to the LBC due to special handling by Cocobod of these beans. This
allows importers and processors to build traceability in their supply chain even though
all the beans transit through the Cocoa Marketing Company.
Processing and export
Seven companies process cocoa in Ghana. After purchasing the cocoa beans from the
Cocoa Marketing Company and processing them, they can freely export processed
products at their price.
In contrast, cocoa beans are almost exclusively exported by the Cocoa Marketing
Company. The only exception are the beans rejected at the processing level, which
can be exported by national processors but in very limited quantities.
Figure 20. ProcessingCocoa
sharesbeans
of localprocessed
processors in
byGhana
localduring 2016/2017
factories season. Source: Cocobod
- 2016/2017
PLOT CPC
6.12% 2.91%
OLAM BARRY CALLEBAUT
13.64% 22.53%
BD ASSOCIATES
6.81%
CARGILL
27.62%
NICHE
10.23%
COCOA TOUTON
10.13%Traceability and transparency of cocoa supply chains in Côte d’Ivoire and Ghana 21
1.3 Smuggling between Ghana, Côte d’Ivoire and Liberia
A comparison of farm-gate prices in Côte d’Ivoire and Ghana with the share of total
exports of cocoa beans in the two countries (taking into account processed cocoa) could
shed some light on potential cocoa smuggled each season (see Figure 21).
This analysis shows that apart from some years, like the season 2010/2011 marked by
the Ivorian political crisis, there is little correlation between cocoa prices and the shares
of cocoa traded by both countries, which could indicate that smuggling is limited. In the
2014/2015 season, Ghana’s market share was at its lowest, at 29%, which was when
the price difference in favour of Côte d’Ivoire was the highest. Ghana’s highest market
share (apart from the 2010/2011 season) was 37% in the 2011/2012 and 2012/2013
seasons, when Ghana priced much higher than Côte d’Ivoire.
Figure 21. Evolution of share of cocoa beans traded by Côte d’Ivoire and Ghana % with price spread between
the two countries
Evolution of share Source:
in USD/kg. Nitidae
of cocoa beans traded by Côte d'Ivoire and Ghana (%) with price
spread between Côte d'Ivoire and Ghana (in USD/kg - source: Nitidae)
0.50 100%
Export share of cocoa between CI and GH
90%
Price in Cl - Price in GH (USD/kg)
0.25
80%
70%
0.00
60%
50%
-0.25
40%
-0.50 30%
FG price RCI- FG price GH Côte d'Ivoire Ghana
With regards to smuggling between Côte d’Ivoire and Liberia, interviews with cocoa
traders confirmed that smuggling is happening in both directions. Cocoa beans exported
through Monrovia port are generally lower grades ones rejected by Ivorian traders in
the West of the country, while good quality Liberian cocoa is sold in Côte d’Ivoire. This
explains the lower prices of Liberian cocoa on the international market (see Figure 22).
Figure 22. ComparisonEvolution
of cocoaofbeans export
cocoa bean price
prices CIFbetween Ghana,
Netherland Côte
for Côte d’Ivoire
d'Ivoire, andLiberia. Source: Trademap
and
Ghana
Liberia (USD/MT - Source: Trademap)
3500
3000
2500
2000
1500
Jan-12
May-12
Sep-12
Jan-13
May-13
Sep-13
Jan-14
May-14
Sep-14
Jan-15
May-15
Sep-15
Jan-16
May-16
Sep-16
Jan-17
May-17
Sep-17
Jan-18
May-18
Sep-18
Jan-19
May-19
Sep-19
Jan-20
May-20
CI GH LIB22 Traceability and transparency of cocoa supply chains in Côte d’Ivoire and Ghana
1.4 Consumer markets
Importers and chocolate manufacturers
Data about cocoa importers is unavailable in Côte d’Ivoire as the customs statistics
service considers it confidential. Such data is not available in the European Union either
for the same reason. Ghanaian customs statistics include importers’ names, confirming
the concentration of the international trade of cocoa beans.
Six international trading companies control around 74% of the cocoa beans trade and
68% of the cocoa products trade in Ghana. International trade of Ghanaian cocoa seems
even more concentrated than Ivorian cocoa.
Figure 23. Ghana cocoa beans and cocoa product imports by main importers. Source: Nitidae based
on customs’ data
Metric Tons Beans Processed products Together
Touton 85 363 16% 35 638 14% 124 564 16%
CARGILL 58 775 11% 58 415 24% 123 032 16%
BC 61 516 12% 41 545 17% 107 216 14%
ECOM 63 450 12% 17 690 7% 82 909 10%
Olam 66 532 13% 13 061 5% 80 899 10%
SUCDEN 46 800 9% 1 960 1% 48 956 6%
Others 136 293 80 259 224 578
Total 518 729 248 568 792 154
Market share of 74% 68% 72%
the top six traders
A 2019 study of the International Institute for Sustainable Development (IISD)¹⁶ finds
that, through their sister companies, which does not always bear the name of the parent
company, those six main trading companies concentrate more than 80% of the global
bean trade and crushing.
All are members of the Cocoa & Forest Initiative and implement both their own and their
clients’ sustainability programmes. However, there is no available data on the share
of their ‘certified’ and/or ‘sustainable’ sourcing. Most communicate mainly on their
actions: number of farmers certified and/or monitored in terms of mapping and child
labour monitoring and remediation system; number of farmers trained; number of trees
distributed; and number, names and location of the headquarters of the cooperatives
they work with. Nonetheless, none provide accurate quantities of beans being traced,
certified or coming from their ‘indirect procurement supply chain’.
Indeed, most of the objectives/indicators they communicate about concern only their
‘direct procurement’, which is carried out through cooperatives in Côte d’Ivoire and
farmers’ associations in Ghana.
¹⁶ Global Market report – Cocoa, IISD, 2019, https://www.iisd.org/system/files/publications/ssi-global-market-report-cocoa.pdfTraceability and transparency of cocoa supply chains in Côte d’Ivoire and Ghana 23 Figure 24. Estimation of quantity of beans traded and declared percentage of ‘sustainable’ cocoa for main cocoa trading companies and main chocolate manufacturers. Source: Global Market report – Cocoa, IISD, 2019 Note: these numbers might reflect double counting of sustainable consumption volumes as traders listed might sell to listed manufactures. Manufacturers and traders tend not to disclose to whom/from whom they sell/source sustainable volumes of cocoa due to confindentiality reasons. Some companies, like Cargill, Barry Callebaut and Cémoi, provide figures about the share of certificated cocoa they trade, which is below 50% of their total volumes. All the trading companies offer different kinds of ‘sustainable products’ to their clients, without disclosing which share of their procurement is ‘sustainable’ or which certification/referential they use to classify cocoa as ‘sustainable’. None of those companies is poised to reach the targets presented in IISD’s Global Market report – Cocoa. Similarly, most chocolate manufacturers label their most famous brands as certified cocoa (mainly UTZ and RFA) but do not provide accurate figures about their entire supply chains.
24 Traceability and transparency of cocoa supply chains in Côte d’Ivoire and Ghana
2. Traceability initiatives and trends
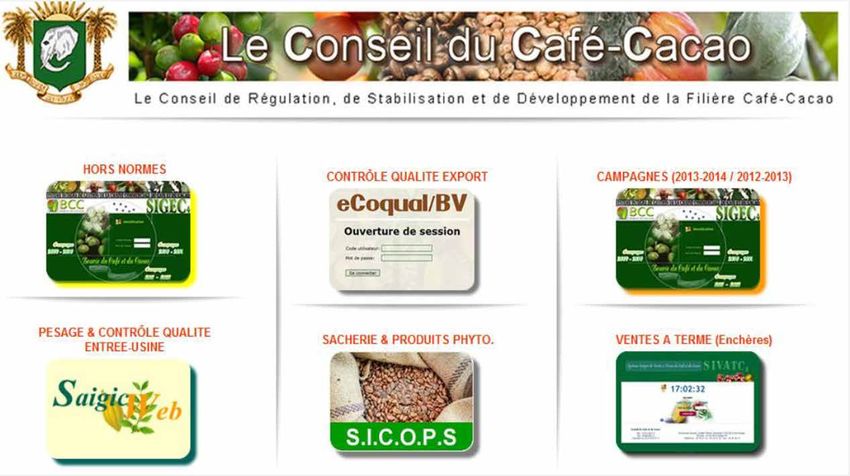
2.1 Côte d’Ivoire’s Conseil Café Cacao (CCC)
Cooperatives and local traders register bags and phytosanitary treatment in an
online system called SICOPS (Système d’Information et de Contrôle des Operations
de Distribution des Produits Phytosanitaires et de la Sacherie).
Cocoa sales at the farmer level are registered in three copies of a purchase receipt
provided by CCC to cooperatives and traders. These paper-based receipts are not
digitalised. However, CCC field agents carry out random controls to check that all
farmers have those receipts, and that cooperatives and traders keep them archived.
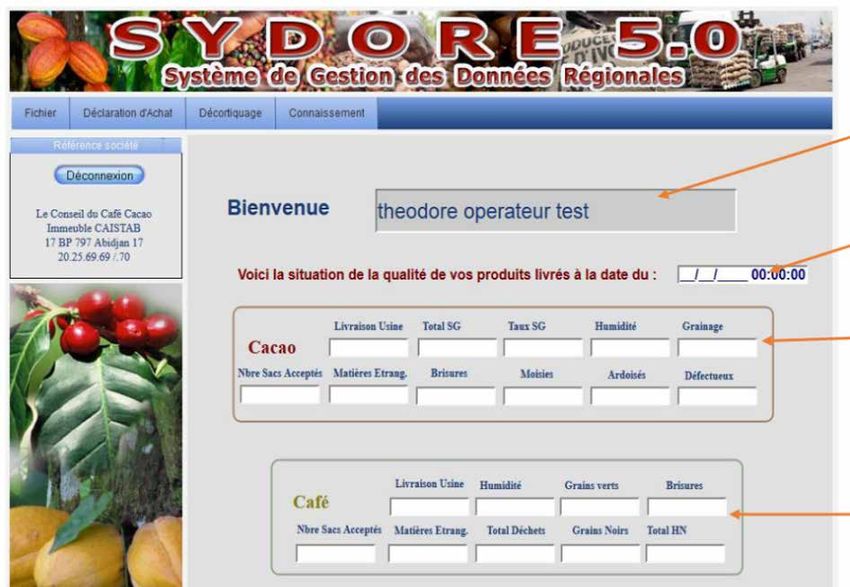
Since the 2015/2016 season, the CCC has set up an online system called SYDORE
(Système de Gestion des Données Régionales) to monitor national trading of cocoa and
coffee. All cooperatives and national traders (‘traitants’) must enter in the system the
quantity they purchased indicating from which subprefecture the beans are coming
from. Cooperatives and traders that have no computer or internet access can do the
data entry at the CCC regional office.
After entering the data, cooperatives and traders can print an official document
summarising the quantity of a load and its origin called a ‘connaissement’. All land
transport of cocoa beans must be accompanied by a connaissement.
Cooperatives’ sections transporting cocoa beans to the main warehouse of the
cooperative must also register in SYDORE. Local traders transporting their production
to the warehouse of a wholesaler must do the same. But the system does not include
the registration of farmers.
This system allows to track the cocoa beans from the first buyer (local trader or
cooperative). It is also to cover subsequent sales among cooperatives and traders.
Below is the main information that must be entered by an operator in the system to
be able to print a connaissement.
Figure 25. Screenshot of SYDORE. Source: SYDORE user guide on CCC websiteTraceability and transparency of cocoa supply chains in Côte d’Ivoire and Ghana 25
At port level, cocoa beans’ quality and weight are checked before transport to exporters/
processors warehouses. Weight is controlled by CCC officers while quality is controlled
by authorised quality control companies (Veritas, ACE, SGS, KMS, Phyto-Ci et CWT). The
data from these controls is entered in a system called SAIGC. After cleaning and bagging
for export, another quality control is done by control companies. This information, required
to authorise the export, is entered into another system called eCoqual. To justify weight
losses and quality differences, exporters must also register the results of their cleaning,
sorting and mixing in another dedicated system called SIGEC.
Finally, all the export sales are done following the selling orders of the CCC (decided by
CCC traders) in a platform called SIVATC where authorised importing companies must
also register.
SYDORE has a dedicated website, but all the other systems are accessible from the
same CCC webpage (see screenshot in Figure 26).
Figure 26. Screenshot of CCC web platform to monitor quality, input distribution, export, processing and
international sales. Source: CCC website
Figure 27. Scheme of CCC’s current monitoring system. Source: Nitidae
Port delivery:
-Check of « Connaissement » by CCC => SAIGC
Farm-gate sales: Wholesale trade:
-Weight control by CCC => SAIGC (digitalised)
-Purchase receipt (paper) -Data entry in SYDORE (Digitalised)
-Quality control by authorised company => SAIGC
-Control sheet (paper) -Printing of the « Connaissement »
-Data check by exporter/processor in SAIGC
Cocoa plot Village / Camp Chief town Port town
BUY COCOA
Wholesaler 1
Cocoa export Cocoa processing
Cocoa export
Sorting Truck unloading Truck unloading
COOP SECTION Mixing Sorting Sorting
Harvesting Drying Re-cleaning Mixing Crushing
Pod breaking Cleaning Truck loading COOP COCOA
Cleaning Packaging
Fermentation Bagging Re-bagging Export of paste,
Farm-gate sales Export of beans butter and powder
Inputs distribution: Before export:
-Data entry in SICOPS -Weight loss and rejection => SIGEC
-Quality control by authorised company => eCOqual
-Forward & Future sales: SIVATC
-Importers registration and guarantee payment: SIVATC26 Traceability and transparency of cocoa supply chains in Côte d’Ivoire and Ghana
2.2 Ghana's Cocobod
Overview of Ghana’s Cocoa Traceability System
Cocobod, formerly the Cocoa Marketing Board, used to be the sole actor in the cocoa
sector, giving the Government total control. Through the Cocoa Marketing Board, the
Government carried out its purchases and exports of cocoa in Ghana. The Cocoa
Marketing Board conducted its activities through its subsidiaries, the Produce Buying
Company and the Cocoa Marketing Company. In addition, the Quality Control Division,
another subsidiary, was also solely responsible for controlling the quality of cocoa. With
support from the World Bank, reforms were carried out in 1984 and 1985 to restructure
the Cocoa Marketing Board. Downsizing the number of employees from around 100 000
to 6 000 led to a drastic reduction in the number of quality-control officers who worked
at community level to ensure ‘Ghana Quality’.
The current system in Ghana to trace beans is focuses mainly on quality and only
reaches the company level. There is no legislative requirement to implement traceability
within the sector. The push for developing and implementing traceability systems has
come from private standards, public control and voluntary actions. Over the last 25
years or so, Cocobod has improved the control system enabling segregation of cocoa
by district. It has also built special systems tailored to the needs of a specific quality of
cocoa currently being produced in Ghana.
At the district level, cocoa could be traced back to the farmer level with a good level of
certainty. However, this is sometimes hindered by the inability of purchasing clerks to
keep aggregation/bulking records at the community level. As a result, a bag of cocoa
arriving at the district level is a mix of beans from several farms. This impedes the
tracking of cocoa coming from specific farms and even illegal sources (smuggled from
Côte d’Ivoire or grown in forest reserves).
Current Cocoa Traceability System in Ghana
The current system implemented by Cocobod through the Quality Control Division is
predominantly paper-based. There is physical evidence of chain of custody. However,
paper-based documentation could be lost through fire or flood, or tampered or destroyed
by any agent in case of controls.
Farm Level: Cocoa is prepared for sale at the farm level and sent to the purchasing
clerk¹⁷ at the community buying centre. The farmer is in control of the processes at
this point, with little or no help from extension officers. The only document kept is
the farmer’s passbook.
¹⁷ A purchasing clerk is a representative of a Licensed Buying Company who is stationed at the community level to purchase
cocoa on behalf of the company. The purchasing clerk is usually a farmer but with entrepreneurial skills and willing to earn
extra for his services.Traceability and transparency of cocoa supply chains in Côte d’Ivoire and Ghana 27 The farmer’s passbook (see Figure 28) contains information on the farmer and the farm, as well as cocoa sales records. The passbook is usually in the custody of the farmer although sometimes it is kept by the purchasing clerk for safe keeping and timely update. Even with these safe keeping measures, this documentation is usually unreliable since there is no proper verification system in place and usually few controls in the issuance of the booklet to farmers. For example, a farmer with illegal farm(s) could still possess a passbook and sell cocoa through the official channels without any detection by officials. Figure 28. Sample Farmer’s Passbook issued by Cocobod. Source: Nitidae Community Buying Point (purchasing clerk shed): Farmers travel to the purchasing clerk shed to sell their cocoa. Cocoa is weighed and bought at this point. If cocoa supplied by one farmer does not fill the entire bag (64 kilos), the purchasing clerk bulks cocoa from several farmers (recorded on a bulking sheet). The purchasing clerk records all cocoa bean purchases at their sheds (or ‘society’) on a daily schedule (see Figure 29). Figure 29. Sample Daily Stock book kept by purchasing clerks at the clerk’s shed level. Source: Nitidae
28                                 Traceability and transparency of cocoa supply chains in Côte d’Ivoire and Ghana

     Cocoa kept at the purchasing clerk’s shed is mixed and further processed to ensure
     uniformity and quality. After that, the farmer’s identity is lost. To be able to keep a
     semblance of farmer identity, the bulking sheet (Figure 30) will list the number of
     farmers whose cocoa has been bulked and bagged on a specific day and given a code.
     The last four digits on the drop mark refer to the farmer’s numbers. The marks are
     stamped on the sack before bagging.

     Figure 30. Bulking Sheet sample. Source: Nitidae

     Cocoa leaving every purchasing clerk shed is accompanied with a completed waybill
     duly signed by the purchasing clerk. Normally, the ‘society’ issues a waybill to the
     purchasing clerk (Figure 31) that is kept in his custody. The bulking sheet duly
     prepared by the purchasing clerk is also attached.

     Figure 31. Waybill accompanying cocoa from the purchasing clerk shed level. Source: Nitidae
Traceability and transparency of cocoa supply chains in Côte d’Ivoire and Ghana 29 District depot: A depot usually receives cocoa from multiple communities or purchasing clerk sheds (‘societies’). For each cocoa bag received at the depot, a receipt (Figure 32) is issued to the purchasing clerk, acknowledging receipt of the consignment. The receipt of the bags is usually done by a depot manager assisted by a bookkeeper and a few casual hands. Figure 32. Sample warehouse receipt. Source: Nitidae The district depot staff arranges weekly transport to carry cocoa from the purchasing clerk sheds to the district depot. This movement is called primary evacuation and is documented by a primary evacuation waybill. The purchasing clerk attaches to this waybill the daily schedule of the ‘society’ or purchasing clerk shed, which details farmer- by-farmer purchases. This schedule is filed at the district office. Bulked cocoa beans arriving at the district depot are graded and sealed by a staff member of the Quality Control Division of Cocobod based on several quality tests. A Certificate of Inspection is issued by the Cocobod Quality Control Company (QCC) to test the cocoa beans before they are handed to the custody of the Cocoa Marketing Company. A copy is retained and filed at the district depot. A mark is stamped on the sack with information on its source and results of the quality test. A random second testing of graded cocoa can be performed by a QCC supervising officer at any time to confirm the grade of sealed sacks before the cocoa leaves the district warehouse to the takeover point. Up to this step in the supply chain, LBCs can segregate certified and conventional beans. Cocoa from the district depots goes through one of the three takeover points (Kaase, Takoradi or Tema) before arriving at the port. Traceable beans can only be sent to Takoradi and Tema takeover points. Each consignment must be accompanied by four copies of a secondary evacuation waybill. For traceable cocoa beans, the secondary evacuation waybill is marked ‘traceable cocoa’. In addition, traceable cocoa is accompanied by a ‘society’ (purchasing clerk shed) traceable detail report, also referred to as a tally sheet. At the takeover point, all cocoa arrivals are check-sampled by QCC port staff (moisture, bean count, cut test, bag weight, bag quality). Cocoa of acceptable quality is issued with a QCC purity certificate.
You can also read