Multi-trace-element sea surface temperature coral reconstruction for the southern Mozambique Channel reveals teleconnections with the tropical ...
←
→
Page content transcription
If your browser does not render page correctly, please read the page content below
Biogeosciences, 16, 695–712, 2019
https://doi.org/10.5194/bg-16-695-2019
© Author(s) 2019. This work is distributed under
the Creative Commons Attribution 4.0 License.

Multi-trace-element sea surface temperature coral reconstruction
for the southern Mozambique Channel reveals teleconnections with
the tropical Atlantic
Jens Zinke1,2,3,4,5 , Juan P. D’Olivo6,7 , Christoph J. Gey2 , Malcolm T. McCulloch6,7 , J. Henrich Bruggemann8,10 ,
Janice M. Lough4,6 , and Mireille M. M. Guillaume9,10
1 School of Geology, Geography and the Environment, University of Leicester, Leicester, LE17RH, UK
2 Institutefor Geosciences, Freie Universität Berlin, 12249 Berlin, Germany
3 Molecular and Life Sciences, Curtin University, Perth, WA, Australia
4 Australian Institute of Marine Science, Townsville, QLD 4810, Australia
5 School of Geography, Archaeology and Environmental Studies, University of the Witwatersrand, Johannesburg, South Africa
6 The ARC Centre of Excellence for Coral Reefs Studies, Townsville, QLD 4810, Australia
7 Oceans Graduate School and UWA Oceans Institute, The University of Western Australia, Crawley, WA6009, Australia
8 UMR ENTROPIE Université de La Réunion-CNRS-IRD, Saint-Denis, France
9 UMR BOrEA Muséum National d’Histoire Naturelle-SU-UCN-UA-CNRS-IRD, EcoFunc, Aviv, Paris, France
10 Laboratoire d’Excellence CORAIL, Université de La Réunion, Saint-Denis, France

Correspondence: Jens Zinke (jz262@leicester.ac.uk)

Received: 9 October 2018 – Discussion started: 16 October 2018
Revised: 15 January 2019 – Accepted: 20 January 2019 – Published: 4 February 2019

Abstract. Here we report seasonally resolved sea surface          relations with local climate variability in the Mozambique
temperatures for the southern Mozambique Channel in the           Channel and teleconnections to regions in the Indian Ocean
SW Indian Ocean based on multi-trace-element tempera-             and southeastern Pacific where surface wind variability ap-
ture proxy records preserved in two Porites sp. coral cores.      peared to dominate the underlying pattern of SST variability.
Particularly, we assess the suitability of both separate and      The strongest correlation was found between our Europa SST
combined Sr/Ca and Li/Mg proxies for improved multi-              reconstruction and instrumental SST records from the north-
element SST reconstructions. Overall, geochemical records         ern tropical Atlantic. Only a weak correlation was found with
from Europa Island Porites sp. highlight the potential of         ENSO, with recent warm anomalies in the geochemical prox-
Sr/Ca and Li/Mg ratios as high-resolution climate proxies         ies coinciding with strong El Niño or La Niña. We iden-
but also show significant differences in their response at this   tified the Pacific–North American (PNA) atmospheric pat-
Indian Ocean subtropical reef site. Our reconstruction from       tern, which develops in the Pacific in response to ENSO, and
1970 to 2013 using the Sr/Ca SST proxy reveals a warming          the tropical North Atlantic SST as the most likely causes of
trend of 0.58 ± 0.1 ◦ C in close agreement with instrumen-        the observed teleconnections with the Mozambique Channel
tal data (0.47 ± 0.07 ◦ C) over the last 42 years (1970–2013).    SST at Europa.
In contrast, the Li/Mg showed unrealistically large warm-
ing trends, most probably caused by uncertainties around
different uptake mechanisms of the trace elements Li and
Mg and uncertainties in their temperature calibration. In our     1   Introduction
study, Sr/Ca is superior to Li/Mg to quantify absolute SST
and relative changes in SST. However, spatial correlations        Ocean–atmosphere dynamics in the tropics are key drivers
between the combined detrended Sr/Ca and Li/Mg proxies            of large-scale climate phenomena, such as the El Niño–
compared to instrumental SST at Europa revealed robust cor-       Southern Oscillation (ENSO) (Angell, 1990; Trenberth et

Published by Copernicus Publications on behalf of the European Geosciences Union.
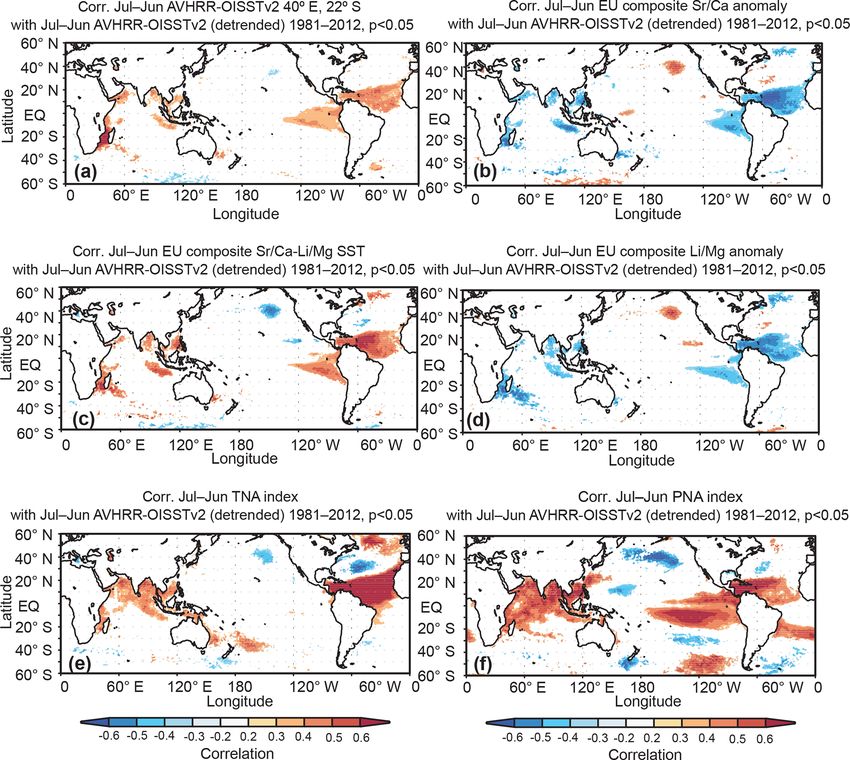
696                                       J. Zinke et al.: Multi-trace-element sea surface temperature coral reconstruction

al., 1998; Xie et al., 2010; Timmermann et al., 2018). Trop-       (Pfeiffer et al., 2009, 2017; DeLong et al., 2012; Zinke et
ical climate variability therefore has a strong impact on          al., 2016). Recently, the use of additional SST-sensitive prox-
regional and global climate teleconnections. These ocean–          ies (multielement paleothermometry) has been tested and the
atmosphere dynamics are temporally variable and sensitive          Li/Mg ratios emerged as a promising tool to reconstruct SST
to small perturbations in sea surface temperature (SST) as-        (Hathorne et al., 2013; Montagna et al., 2014; Fowell et al.,
sociated with natural and anthropogenic climate change. The        2016; D’Olivo et al., 2018). The innovation of the Li/Mg
oceans respond to the combined effects of natural variability      temperature proxy lies in the normalization of Li to Mg,
and greenhouse-driven anthropogenic warming acting at sea-         which is thought to eliminate the influence of Raleigh frac-
sonal, interannual, and multi-decadal scales. The complexity       tionation processes influencing most trace element incorpo-
of the climate system at temporal and spatial scales therefore     rations into the coral skeleton (Cohen et al., 2002; Gaetani
calls for a comprehensive assessment of SST pattern change         and Cohen, 2006; Gaetani et al., 2011). Li/Mg was shown
in historical times (Xie et al., 2010). To investigate chang-      (e.g., Montagna et al., 2014) to be applicable to a large range
ing tropical climate and model potential future scenarios, the     of coral species inhabiting a large temperature range. How-
modern climatology faces the challenge of improving data           ever, to date no long-term (e.g., multi-decadal) SST recon-
coverage, especially extending the limited time length of in-      struction has been developed based on Li/Mg ratios to test
strumental measurements. The earliest records of SST, mea-         its suitability, particularly in tropical corals, in comparison
sured by commercial ship traffic mainly along trading routes,      to the established Sr/Ca time series.
started in the mid-19th century (Freeman et al., 2017). Only          The aim of this study was to reconstruct sea surface tem-
with the arrival of satellite technology in the 1980s have the     peratures based on coral Sr/Ca, Li/Mg, and their combina-
oceans been covered in more detail. The limited number of          tion to validate and extend the SST information for the south-
observations and drop in data quality prior to the 1980s cause     ern Mozambique Channel in the southwestern Indian Ocean.
considerable uncertainties in our understanding of important       We examined instrumental climate and coral proxy data from
climate interactions (Thompson et al., 2008; Pfeiffer et al.,      Europa Island. The high latitude of this atoll and the lack of
2017). These limitations make the use of paleoclimate re-          human impact make this location ideal to investigate past cli-
constructions, particularly from remote locations, a vital tool    mate variability based on cores from massive Porites corals
to learn about past climate conditions.                            (Fig. 1). The Mozambique Channel in the southwestern In-
   Coral reconstructions extending back decades to several         dian Ocean is a particular sparsely sampled region, despite
centuries provide invaluable data to assess past tropical cli-     its importance as a major pathway of warm surface flow of
mate variability (Hennekam et al., 2018; Pfeiffer et al., 2017).   the global ocean conveyer (De Ruijter et al., 2002; Schouten
One of the most robust and widely used geochemical prox-           et al., 2002; Woodruff et al., 2011; Beal et al., 2011). Fur-
ies to reconstruct SST in tropical areas is the Sr/Ca ra-          thermore, Europa Island is located just upstream of the re-
tio from massive corals like Porites (Corrège, 2006; Pfeif-        gion that feeds the Agulhas Current, one of the most pow-
fer et al., 2009; DeLong et al., 2012). The Sr/Ca ratios in        erful western boundary currents on the planet. As such, this
CaCO3 precipitated during skeletal formation are negatively        region is a possible source of both local and global climate
correlated with temperatures; i.e., as temperatures increase,      interactions and drivers of especially longer-term changes in
less Sr is incorporated into the aragonite lattice relative to     patterns of SST variability, which are investigated here.
Ca (Alibert and McCulloch, 1997; Corrège, 2006; DeLong
et al., 2007). While the Sr/Ca proxy is a remarkably use-
ful tool for paleoclimate reconstructions, there are a number      2     Materials and methods
of limitations that need to be considered in the application
of this proxy for quantitative reconstructions. Among these,       2.1    Study area
there is a significant difference in the Sr/Ca temperature de-
pendency of biogenic and experimentally precipitated inor-         Europa Island (hereafter Europa), a 28 km2 atoll that is part
ganic aragonite (Smith et al., 1979). Abiogenic aragonite has      of the five Éparses islands of the French Terres Australes
a significantly stronger Sr/Ca dependence on temperature           et Antarctiques Françaises, lies in the central Mozambique
with a slope of −0.039 to −0.044 mmol mol−1 ◦ C−1 than             Channel between southern Mozambique and southern Mada-
the coral skeletal Sr/Ca with slopes ranging between −0.040        gascar (22◦ 210 S, 40◦ 210 E; Fig. 1). Europa, with Hall Table-
and −0.084 mmol mol−1 ◦ C−1 (Smith et al., 1979; Cohen et          mount and Bassas da India Atoll, is part of an archipelago
al., 2002; Gaetani and Cohen, 2006; Gaetani et al., 2011).         that was hypothesized to have been formed by the Quath-
This disparity has been considered the influence of strong         lamba hot spot, which presently lies beneath Lesotho (Hart-
“vital effects” during the coral biomineralization process (de     nady, 1985). Europa is a carbonate platform attaining a max-
Villiers et al., 1995) or bio-smoothing effects (Gagan et al.,     imum elevation of 6 m with a fossil coral terrace that was
2012). Nevertheless, several recent studies have confirmed         dated to the last interglacial period with an age of approx-
the suitability of the Sr/Ca paleorecorder when carefully          imately 94 kyr (Battistini et al., 1976); it therefore formed
sampled along the optimal growth axis and ideally replicated       concomitantly to other carbonate platforms in the Mozam-

Biogeosciences, 16, 695–712, 2019                                                        www.biogeosciences.net/16/695/2019/
J. Zinke et al.: Multi-trace-element sea surface temperature coral reconstruction                                                    697

Figure 1. Coral collection sites for cores EU2 and EU3 along the northern–northeastern reef slope of Europa and its positioning within the
southern Mozambique Channel (southwest Indian Ocean).

bique Channel (Battistini et al., 1976; Guillaume et al.,              2.2   Instrumental temperature data
2013). The 22 km coastline is surrounded by a fringing coral
reef with a forereef slope that dips steeply into deeper wa-           To review and evaluate the coral geochemical proxies, var-
ter. A geomorphological relict of the former atoll drained by          ious sources of instrumental data were assessed. High-
the following marine regression forms a narrow shallow la-             resolution SST data (0.25◦ × 0.25◦ ) covering 1981 to 2013
goon that occupies more than half of the island and opens              were obtained from the Advanced Very High Resolution Re-
to the sea through the northern reef flat. A mangrove for-             constructed Optimum Interpolation Sea Surface Temperature
mation ranging from shrub to forest stands grows in the salt           version 2 (AVHRR-OISSTv2; Banzon et al., 2014, 2016;
waters of the back and windward edge of the lagoon (Lambs              Reynolds et al., 2007). The AVHRR-OISSTv2 dataset is
et al., 2016). Europa is characterized by a high-energy en-            composed of daily satellite data and in situ data, adjusted
vironment under the influence of south to southeasterly trade          for biases (Banzon et al., 2014). The SST data were ex-
winds (strongest in austral winter) and occasionally impacted          tended back to 1970 using the Extended Reconstructed Sea
by tropical cyclones in austral summer (Barruol et al., 2016).         Surface Temperature (ERSSTv4; Liu et al., 2015) dataset,
A train of anticyclonic ocean eddies traveling through the             which is based on the International Comprehensive Ocean–
Mozambique Channel transports tropical water southward,                Atmosphere Data Set (ICOADS; Woodruff et al., 2011). The
eventually feeding the Agulhas Current (Beal et al., 2011).            ESRSSTv4 record is composed of satellite data from the
   Europa is a no-take area; the pristine state of its fring-          AVHRR data extended with temperature records from ships
ing coral reefs was attested by scarce macroalgae, high fish           and buoys processed at monthly resolution and interpolated
biomass, and high coral coverage that locally exceeded 80 %            to a spatial resolution of 2.0◦ . In addition, in situ SST data
due to superimposed platy Acropora stands (Guillaume and               were available from April 2009 to October 2010 measured
Bruggemann, 2011). While almost undisturbed from local                 by a tide–temperature–conductivity XR-420 6.30 RBR Ltd
anthropogenic disturbance, remote islands are impacted by              gauge deployed by the CNRS-INSU close to the Porites coral
global change. For instance, in 1998 (El Niño) a severe coral          coring site studied here (Testut et al., 2016). Finally, in situ
bleaching event was inferred at Europa from high coral mor-            air temperature records were provided by the Météo-France
tality accompanied by a recruit cohort of small-sized Acro-            station at Europa between 1970 and 2013 (no. 98403003;
pora colonies observed 4 years later (Quod and Garnier,                22.32◦ S, 40.33◦ E; elevation 6 m).
2004). In 2011 (La Niña), a moderate bleaching event af-
fecting mostly Pocillopora corals, massive and branching               2.3   Coral core sampling, analysis, and age model
Porites, was witnessed (Guillaume and Bruggemann, 2011).
                                                                       Coral cores were extracted with a pneumatic drill in sections
                                                                       of ∼ 30 cm from two living massive Porites colonies on the

www.biogeosciences.net/16/695/2019/                                                               Biogeosciences, 16, 695–712, 2019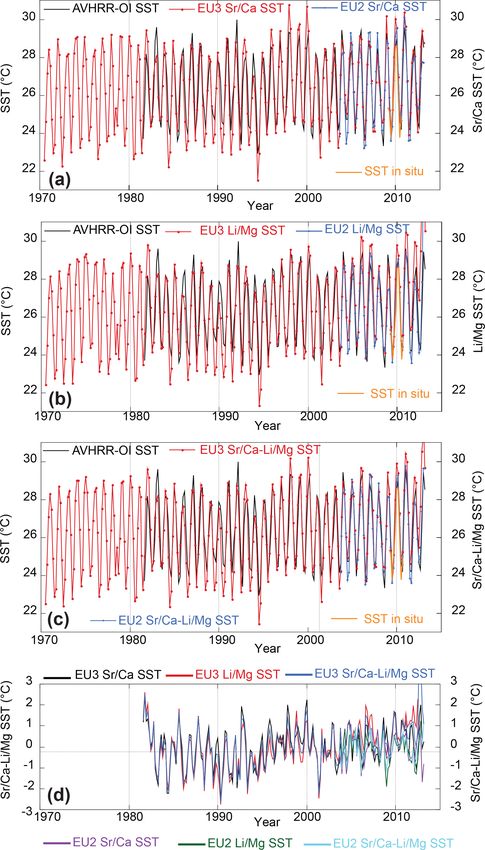
698                                       J. Zinke et al.: Multi-trace-element sea surface temperature coral reconstruction

Table 1. Coral core GPS locations from Europa, water depth, core name, core length, mean extension rate between 1968 and 2012 (±
standard deviation in brackets), and collection dates.

                                                                                   Length    Mean extension     Collection
          Location         Latitude (S)   Longitude (E)   Depth (m)     Core no.    (cm)      rate (cm yr−1 )   dates
          North reef        22◦ 19.839       40◦ 21.758     12.80        EU-2        105         1.07 ± 0.19    2 May 2013
          Northeast reef    22◦ 20.119       40◦ 23.333     12.00        EU-3        136         1.20 ± 0.27    3 May 2013

northeastern reef slope of Europa in early May 2013 during            Porites sp. standard prepared by the Geological Survey of
the ORCIE scientific expedition. The cores were obtained              Japan (Okai et al., 2002) with Sr/Ca = 8.85 mmol mol−1 (2σ
at a depth of 12 to 13 m at the base of the colony with the           RSD = ±0.41 %), Mg/Ca = 4.20 mmol mol−1 (2σ RSD =
core top at 8.5–9.5 m of depth. Morphological identification          ±0.90 %), and Li/Mg = 1.47 mmol mol−1 (2σ RSD =
based on skeletal features observed under an optical micro-           ±1.04 %) (N = 17). The Li/Ca data were estimated by
scope assigned core EU2 to P. solida and core EU3 to P. may-          dividing the Li/Mg by the Mg/Ca data. Long-term re-
eri. The longest core EU3 measured 136 cm (Table 1) and               producibility was determined using the UWA in-house
was sampled from 2013 back to 1970. The shorter core EU2              Davies Reef coral standard solution with Mg/Ca = ±6.24 %,
was sampled from 2013 back to 2003. Cores were sliced to              Sr/Ca = ±0.45 %, and Li/Mg = ±1.39 % (2σ RSD; N =
7 mm thick slabs and cleaned following established protocols          139) (D’Olivo et al., 2018).
(Nagtegaal et al., 2012). The slabs were then X-rayed to re-             The first step after generating the trace element records
veal the annual density banding and analyzed by densitome-            was to assign an age model. The 2 mm sampling resolution
try along single transects at the Australian Institute of Marine      provided six to nine samples per year for any given year and
Science (Figs. S1 and S2 in the Supplement). Annual rates of          provided robust bimonthly resolved geochemical records.
linear extension were calculated from (1) X-ray-based den-            Based on the instrumental SST data from AVHRR-OISSTv2
sity measurements with CoralXDS software (Helmle et al.,              and the in situ measurements, the coldest bimonthly period
2011) and (2) the bimonthly Sr/Ca records by measuring the            (on average July–August) and the warmest bimonthly period
distance between Sr/Ca maxima in both records.                        (on average February–March) for any given year was estab-
   The basis for the optimal extraction of geochemical sig-           lished for our location. The age model was assigned by si-
nals from massive Porites is the precise selection of the sam-        multaneously checking the correlation of Sr/Ca and Li/Mg
pling path, according to the architecture of the coral skele-         with the AVHRR-OISSTv2, ensuring the maximum correla-
ton. The X-rays show the corallite fan structures with the            tion possible was obtained for one proxy without compro-
chosen sampling path along the central growth axis of the             mising the other proxy. The highest Sr/Ca and Li/Mg an-
corallum highlighted (Figs. S1 and S2). Carbonate powder              nual values in the raw data were tied to the annual minimum
samples of approximately 50 mg at 2 mm continuous inter-              and the lowest Sr/Ca and Li/Mg to the annual maximum
vals were obtained along this sampling path with a 0.9 mm             in the SST records using the open-source time series anal-
diameter dental drill. Processing of the samples for geo-             ysis toolkit “Analyseries”. Bimonthly (six samples per year)
chemical analysis is based on methods described by Zinke              records were generated by linear interpolation in Analyseries
et al. (2015) and D’Olivo et al. (2018). First, the powder            to facilitate comparisons between the different datasets.
samples were homogenized in a small agate mortar and ∼                   Calibrations between trace elements and the SST products,
10 mg portions were weighed into thoroughly cleaned 5 mL              and the relationships between different trace elements, were
tubes. Subsequently, the samples were dissolved in 0.5 mL             obtained using robust regressions, which accounts for het-
of 0.5 N HNO3 and diluted to a calcium concentration of               eroscedasticity errors and the presence of outliers in the data.
100 ppm by taking an aliquot of 38 mL from the primary                This method uses iteratively reweighted least squares with a
dissolution and adding 3 mL of 2 % HNO3 to use for the                bisquare weighting function. In addition to absolute SST val-
analysis of Li and Mg. A second aliquot for the analy-                ues, SST anomalies (deviations from bimonthly SST season-
sis of Sr, Ca, and Mg was prepared at 10 ppm by using a               ality in any given year) were calculated relative to the refer-
300 mL aliquot of the first dilution and adding 2.7 mL of             ence period of 2003 to 2012, which includes the overlap be-
2 % HNO3 spiked with trace concentrations of scandium,                tween the two cores. Longer time series anomalies were cal-
praseodymium, and yttrium used as internal standards. The             culated relative to the 1981 to 2010 period. Bimonthly tem-
analyses for trace element (TE) concentrations were made              perature residuals were calculated for absolute SST and SST
on a Thermo Scientific XSERIES 2 quadrupole ICP-MS (in-               anomaly reconstructions to highlight periods during which
ductively coupled plasma mass spectrometer) at the Uni-               Sr/Ca SST and Li/Mg SST differ from instrumental SST.
versity of Western Australia (UWA). The Sr/Ca, Mg/Ca,                 To evaluate how different trace element ratios tracked the in-
and Li/Mg data reported here are normalized to the JCp-1              strumental temperatures, uncertainties in bimonthly absolute

Biogeosciences, 16, 695–712, 2019                                                           www.biogeosciences.net/16/695/2019/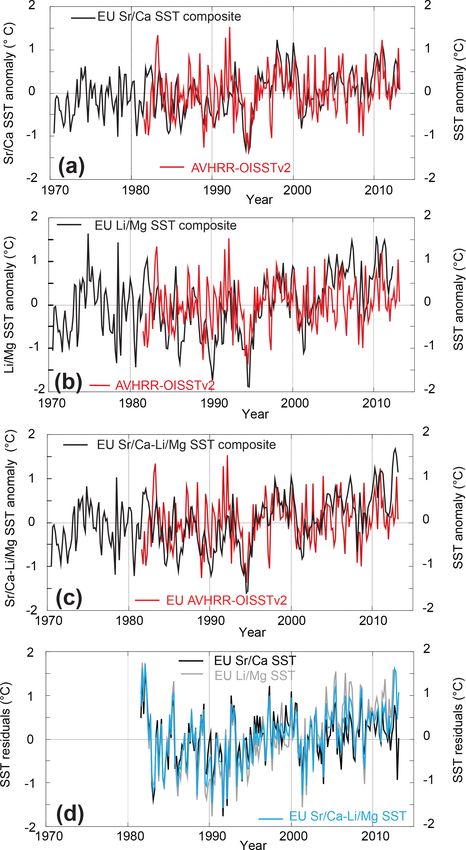
J. Zinke et al.: Multi-trace-element sea surface temperature coral reconstruction                                             699

SST and SST anomalies for individual and composite cores
were calculated based on the root mean square error (RMSE)
defined as
          r
            1                     2
RMSE =        6 Tcalc,n − Tmeas,n ,
            N
where Tcalc,n is the nth term from the coral-derived tem-
perature, Tmeas,n is the nth measurement in the instrumental
record, and N is the total number of observations.

3     Results

3.1    Coral growth parameters and SST

Linear extension rates based on the distance between an-
nual density bands and the distance between Sr/Ca max-
ima in both cores displayed interannual and multi-decadal
variability (Fig. 2a; for anomalies see Fig. S3). Linear ex-
tension rates in both cores were above 7 mm yr−1 in any
given year. Linear extension for EU3 was within 0.2 cm be-
tween the two methods except during 1972 to 1973 and
1983 to 1985. The exceptionally low extension rates during
these intervals obtained in core EU3 by the density method
(CoralXDS) were most probably related to uncertainties in
assessing the chronology due to poorly defined density con-
trasts (Fig. S2; Table S2). Therefore, for those years, the clear
seasonal pattern in Sr/Ca provided a better chronology con-
trol than X-ray densitometry. Extension rates measured with
the density method in EU2 and EU3 between 1968 and 2012
showed similar values, with a mean of 1.07 ± 0.19 cm yr−1
for EU2 and 1.2 ± 0.27 cm yr−1 for EU3 (Table 1). How-
ever, the sclerochronology based on the density measured
with X-rays had large uncertainties due to poorly defined an-
nual density cycles in EU2 in the older part of the record
(Fig. S1). EU2 and EU3 mean extension rates measured be-
tween Sr/Ca maxima between 2003 and 2012 were also sim-             Figure 2. Mean annual coral growth parameters of cores EU3
ilar with 1.23±0.14 cm yr−1 for EU2 and 1.28±0.13 cm yr−1           and EU2 compared to coral composite Sr/Ca SST reconstruction,
for EU3 (Fig. 2a). Interannual extension rates in EU2 and           AVHRR-OISSTv2 (Banzon et al., 2016), and ERSSTv4 (Liu et
EU3 showed no significant correlation.                              al., 2015). Mean annual (a) EU2 and EU3 linear extension rate
   Skeletal density in core EU3 displayed lower variability         (CoralXDS and Sr/Ca derived), (b) EU2 and EU3 skeletal density
(±0.1 g cm−3 ) than core EU2 (±0.2 g cm−3 ) with no corre-          (CoralXDS), (c) EU2 and EU3 calcification rate (CoralXDS and
lation between cores and no significant trend (Fig. 2b). In-        Sr/Ca derived), and (d) SST time series (ERSSTv4, AVHRR-OI
terestingly, core EU2 displayed higher density than EU3 in          SSTv2, EU Sr/Ca SST composite).
El Niño years 1977–78, 1982–83, 2002–03, and 2010 (Ta-
ble S2). EU3 and EU2 density variations were in antiphase
with extension rates for most of the record. Variability and        known El Niño events (e.g., 1941–42 and 1998) or lo-
trends in calcification in both cores were mainly explained         cal cold–warm events recorded by instrumental and proxy
by changes in extension rates (Fig. 2c; Table S2).                  records (e.g., 1994, 2002).
   We find no correlation between SST reconstructions or in-
strumental SST with either extension or calcification rates         3.2   Bimonthly Sr/Ca, Li/Mg, Mg/Ca, and Li/Ca
nor skeletal density in both cores (Fig. 2d). The period                  ratios
of fastest extension and highest calcification in EU3 corre-
sponded to 1947 to 1961 (Table S2). No significant changes          The bimonthly time series of all trace element ratios mea-
in extension or calcification rates were associated with            sured in cores EU2 and EU3 are illustrated in Fig. 3. Com-

www.biogeosciences.net/16/695/2019/                                                          Biogeosciences, 16, 695–712, 2019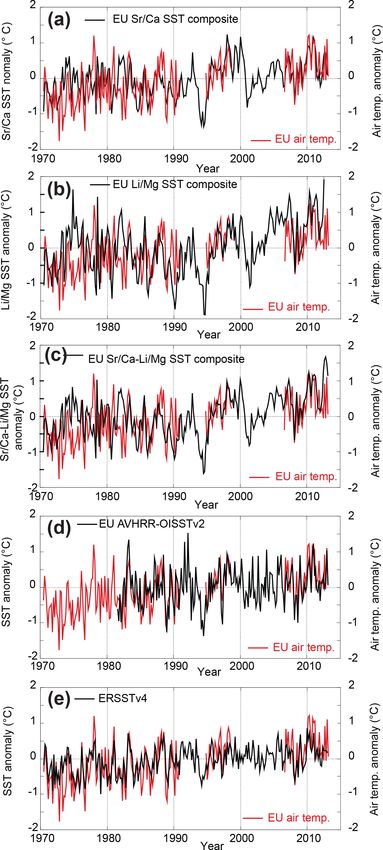
700                                        J. Zinke et al.: Multi-trace-element sea surface temperature coral reconstruction

                                                                       The seasonal range in Li/Mg ratios in core EU3
                                                                    varied between 1.18 and 1.52 mmol mol−1 (1.18 and
                                                                    1.65 mmol mol−1 between 1970 and 2012), while in core
                                                                    EU2 it ranges between 1.35 and 1.6 mmol mol−1 . EU2
                                                                    Li/Mg showed an offset to higher absolute Li/Mg ratios be-
                                                                    tween 2003 and 2012 relative to EU3 (Figs. 3b, 4a). Li/Mg
                                                                    ratios for EU2 and EU3 were highly correlated (r 2 = 0.69,
                                                                    p < 0.001, N = 54), although lower than Sr/Ca ratios. The
                                                                    time series of EU3 Li/Mg between 1970 and 2012 showed
                                                                    a nonlinear decrease starting in the middle to late 1990s.
                                                                    For the period of overlap between 2003 and 2012, both core
                                                                    Li/Mg ratios showed no trend.
                                                                       Mg/Ca ratios in core EU3 showed larger seasonal vari-
                                                                    ations than core EU2 (Fig. 3c). EU2 Mg/Ca ratios ranged
                                                                    between 4.24 and 4.61 mmol mol−1 between 2003 and 2012,
                                                                    while EU3 ranged between 4.40 and 5.36 mmol mol−1 (4.03
                                                                    and 5.36 mmol mol−1 between 1970 and 2012; Figs. 3c, 4b).
                                                                    EU2 showed lower mean Mg/Ca ratios (∼ 0.4 mmol mol−1 )
                                                                    than EU3 between 2003 and 2012 (Fig. 3b). Mg/Ca ratios in
                                                                    EU2 and EU3 were significantly correlated, yet lower than
                                                                    Sr/Ca or Li/Mg (r 2 = 0.34, p < 0.001, N = 54). Overall,
                                                                    EU3 Mg/Ca showed an increase since 1970 with a marked
                                                                    switch post-2005. EU2 Mg/Ca had no trend.
                                                                       Li/Ca ratios in core EU2 ranged between 6.03 and
                                                                    7.20 µmol mol−1 , while in EU3 they ranged between 6.04
                                                                    and 6.87 µmol mol−1 (5.97 to 6.87 µmol mol−1 between
                                                                    1970 and 2012; Figs. 3d, 4c). Li/Ca ratios in EU2 and
                                                                    EU3 were significantly correlated (r 2 = 0.33, p < 0.001,
                                                                    N = 54), but lower than Sr/Ca or Li/Mg. Li/Ca was posi-
                                                                    tively correlated with Sr/Ca and Li/Mg and negatively with
                                                                    Mg/Ca in both cores for most of the record (Fig. 4c, e, f; Ta-
                                                                    ble S1). EU2 Li/Ca largely mirrored variations in Sr/Ca and
Figure 3. Bimonthly interpolated time series of trace element ra-   Li/Mg, while in EU3 Li/Ca showed lower correlations (Ta-
tios in cores EU2 and EU3. (a) Sr/Ca, (b) Li/Mg, (c) Mg/Ca, and     ble S1). EU3 interannual variability in Li/Ca deviated from
(d) Li/Ca.                                                          the patterns observed in the Sr/Ca, Li/Mg, and Mg/Ca data
                                                                    in 1970–71, 1976–1978, 1989–90, and between 2001 and
                                                                    2004 (Fig. 3d). In those years lower EU3 Li/Ca ratios were
parisons between the different trace element ratios for the         associated with lower Mg/Ca and higher Sr/Ca and Li/Mg
full length of individual records (EU2: 2003 and 2012; EU3:         ratios, opposite to the expected relationships (Fig. 3d).
1970–2012) are shown in Fig. 4, as well as Fig. S4 and Ta-
ble S1 in the Supplement.                                           3.3   Calibration of TE/Ca and SST reconstruction
   For the period of overlap the bimonthly time series of
the Sr/Ca ratios for core EU3 ranged between 8.78 and               Absolute temperature reconstructions were obtained from
9.03 mmol mol−1 (8.77 and 9.09 mmol mol−1 between 1970              the regression of the bimonthly Sr/Ca and Li/Mg ratios with
and 2012) and in EU2 between 8.90 and 9.18 mmol mol−1               the AVHRR-OISSTv2 and ERSSTv4 data (Fig. 5; Table 2;
(Figs. 3a, 4a). The mean Sr/Ca ratios for the EU2 core were         for ERSSTv4 see Fig. S5 and for Mg/Ca and Li/Ca vs. SST
∼ 0.1 mmol mol−1 higher compared to EU3, while seasonal             see Fig. S6). Both of the coral datasets showed highly sig-
amplitudes and trends since 2003 were similar between cores         nificant (p < 0.001) correlation coefficients with the tem-
(Fig. 3a). Sr/Ca ratios for EU2 and EU3 were highly corre-          perature products over the period of overlap (2003 to 2012)
lated (r 2 = 0.85, p < 0.001, N = 54). Both cores showed a                 2
                                                                    with rEU3                2                  2
                                                                              Sr/Ca = 0.92, rEU2 Sr/Ca = 0.93, rEU3 Li/Mg = 0.78,
long-term decrease (warming trend) in Sr/Ca between 2003                  2
                                                                    and rEU2 Li/Mg = 0.93 (Table 2). Correlation coefficients of
and 2012. The time series of EU3 Sr/Ca between 1970 and             EU3 Sr/Ca and Li/Mg for the longer periods 1981 to 2012
2012 showed a nonlinear decrease starting in the middle to          and 1970 to 2012 with AVHRR-OISSTv2 and ERSSTv4,
late 1990s with the lowest ratios between 1998 and 2000 and         respectively, were also high (Table 2; Fig. S5). The regres-
between 2009 and 2011.                                              sion slope of TE ratios with the two SST products varied be-

Biogeosciences, 16, 695–712, 2019                                                        www.biogeosciences.net/16/695/2019/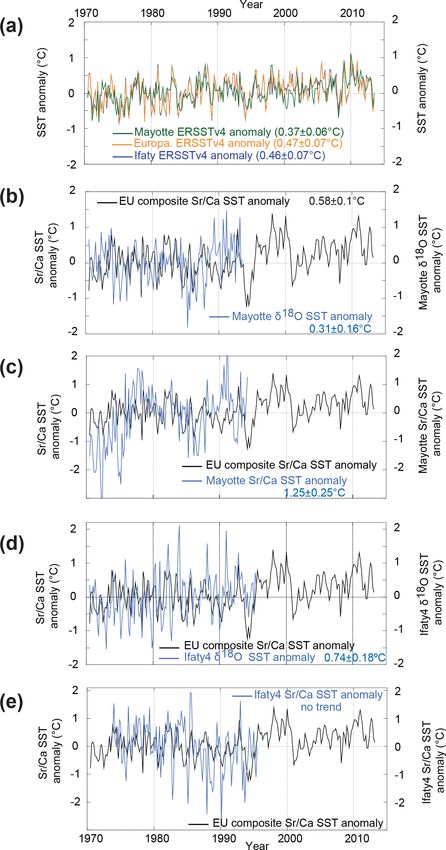
J. Zinke et al.: Multi-trace-element sea surface temperature coral reconstruction                                                                                                              701

Figure 4. Scatterplot of bimonthly trace element ratios in cores EU2 (black dots) and EU3 (blue dots) over the full length of the records.
(a–c) Sr/Ca ratios vs. Li/Mg, Mg/Ca, and Li/Ca, (d–e) Li/Mg vs. Mg/Ca and Li/Ca, and (f) Li/Ca vs. Mg/Ca. The 95 % prediction
intervals of the regressions are indicated by red dashed (EU3) and green solid lines (EU2) with linear fits for each core indicated by a red
line. Regression equations are provided in Table S1.

Table 2. Robust linear regression equations (weighted least squares) for core EU2 and EU3 Sr/Ca and Li/Mg ratios with AVHRR-OISSTv2
and ERSSTv4.

                                                                           Conf.                         Conf.
      Core      Proxy        SST product                     Slope       interval      Intercept       interval         r2     r 2 adj.         SE      RMSE         DoF       Period
      EU2       Sr/Ca        AVHRR-OISSTv2                −0.045           0.003         10.241          0.083       0.93         0.94      0.021          0.02         53     2003–2012
                             ERSSTv4                      −0.051           0.004         10.395          0.100       0.93         0.93      0.023         0.021         53     2003–2012
                Li/Mg        AVHRR-OISSTv2                −0.045           0.003          2.672          0.088       0.93         0.93      0.023         0.021         53     2003–2012
                             ERSSTv4                      −0.051           0.004          2.815          0.115       0.91         0.91      0.030         0.024         53     2003–2012
      EU3       Sr/Ca        AVHRR-OISSTv2                −0.040           0.003          9.974          0.083       0.92         0.92      0.020         0.019        53      2003–2012
                             ERSSTv4                      −0.046           0.004         10.117          0.093       0.92         0.92      0.020         0.019        53      2003–2012
                Li/Mg        AVHRR-OISSTv2                −0.052           0.007          2.739          0.200       0.78         0.78      0.119         0.047        53      2003–2012
                             ERSSTv4                      −0.060           0.009          2.927          0.226       0.78         0.78      0.119         0.047        53      2003–2012
                Sr/Ca        AVHRR-OISSTv2                −0.042           0.002         10.049          0.064       0.86         0.86      0.138         0.027       184      1981–2012
                             ERSSTv4                      −0.048           0.002         10.191          0.058       0.88         0.88      0.179         0.027       252      1970–2012
                Li/Mg        AVHRR-OISSTv2                −0.057           0.004          2.898          0.117       0.77         0.77      0.452         0.049       184      1981–2012
                             ERSSTv4                      −0.064           0.004          3.076          0.108       0.78         0.78      0.612         0.049       252      1970–2012
    Conf. interval indicates the 95 % confidence interval of the regression slopes and intercepts; r 2 adj.: r 2 adjusted; SE: standard error; RMSE: root mean square error; DoF: degrees of
    freedom (N − 2).

www.biogeosciences.net/16/695/2019/                                                                                                           Biogeosciences, 16, 695–712, 2019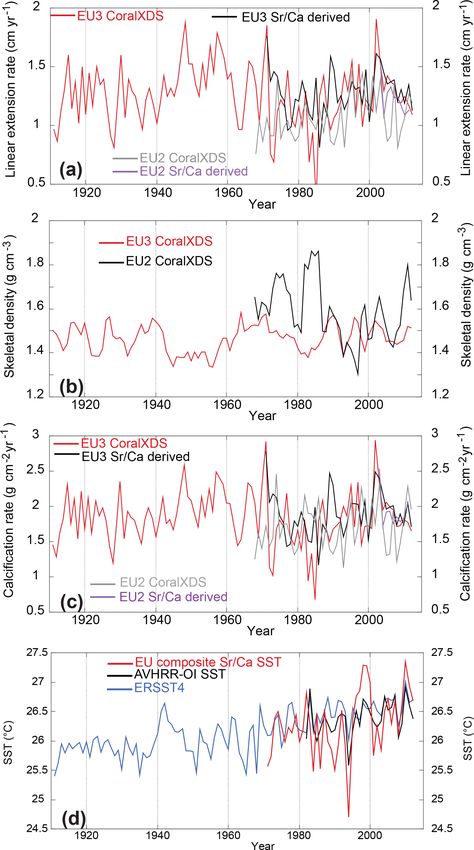
702                                          J. Zinke et al.: Multi-trace-element sea surface temperature coral reconstruction

Figure 5. Linear regressions of trace element ratios with AVHRR-
OISSTv2 (Banzon et al., 2016) for core EU3 1981–2012 (a, c) and
EU2 2003–2012 (b, d). The trace element records were calibrated
using the respective weighted least squares regression equations of
the bimonthly correlations obtained for each of the core records
from the two sites. The 95 % confidence intervals of the regressions
are indicated. Regression equations are provided in Table 2.

tween −0.040 and −0.051 mmol mol−1 ◦ C−1 for Sr/Ca and
between −0.045 and −0.064 mmol mol−1 ◦ C−1 for Li/Mg
(Table 2). Overall, the regression slopes were marginally
lower for regressions with AVHRR-OISSTv2 compared to
ERSSTv4. Weighted least squares regressions with 1.5 years
of in situ SST data between 2009 and 2010 revealed similar
regression slopes for Sr/Ca and Li/Mg but with a narrower
range (−0.042 to −0.047 mmol mol−1 ◦ C−1 for Sr/Ca and
−0.045 to −0.052 mmol mol−1 ◦ C−1 for Li/Mg) and lower                 Figure 6. Absolute SST reconstructions for cores EU3 (red) and
                            2                 2                        EU2 (blue) with SST residuals based on the calibration period
correlation coefficients (rEU3 Sr/Ca = 0.70, rEU2 Sr/Ca = 0.76,        1981 to 2012 for (a) Sr/Ca SST, (b) Li/Mg SST, and (c) their
 2                         2
rEU3 Li/Mg = 0.73, and rEU2 Li/Mg = 0.81). All correlations            combination in comparison to AVHRR-OISSTv2 (Banzon et al.,
were statistically significant with p < 0.050.                         2016; black) and in situ SST (orange; 2009–2010). (d) Residuals
   The maximal seasonal range over the period 1970 to 2012             for Sr/Ca SST, Li/Mg SST, and their combination for cores EU2
of the reconstructed bimonthly Sr/Ca SST and Li/Mg SST                 and EU3 with respect to the AVHRR-OISSTv2 data (Banzon et al.,
varied between 22 and 30 ◦ C in both cores with a mean sea-            2016).
sonal amplitude of 4.33 ± 0.67 ◦ C (Fig. 5; for ERSSTv4 see
Fig. S7) in close agreement with in situ SST (4.82 ± 0.05 ◦ C
for 2009 to 2010) and regional AVHRR-OISSTv2 (4.67 ±                   truncated seasonality between 1989 and 1995 (warmer win-
0.7 ◦ C for 1981 to 2013) and ERSSTv4 (4.52 ± 0.44 ◦ C for             ters) with on average higher mean SST than coral-derived
1970 to 2012).                                                         SST (Fig. 6; Sr/Ca, Li/Mg, and their combination). Summer
   Residuals (calculated as the difference between coral-              SST (Sr/Ca, Li/Mg, and their combination) was in general
derived SST and AVHRR-OISSTv2 for individual record                    in better agreement throughout the individual records. Sr/Ca
length) are presented in Fig. 6 and RMSEs in Table 3 (for              performed best as an SST proxy, followed by the combined
ERSSTv4 see Fig. S7). The coral Sr/Ca and Li/Mg SST                    Sr/Ca and Li/Mg SST (Fig. 6; Table 3).
reconstructions had the lowest residuals between 1993 and                 Sr/Ca, Li/Mg, and SST bimonthly anomalies were calcu-
2012 with AVHRR-OISSTv2, with slightly larger residuals                lated relative to the 2003 to 2012 (core overlap) and 1981
prior to 1993 (core EU3). AVHRR-OISSTv2 displayed a                    to 2010 (coral composite) reference periods. Coral-derived

Biogeosciences, 16, 695–712, 2019                                                            www.biogeosciences.net/16/695/2019/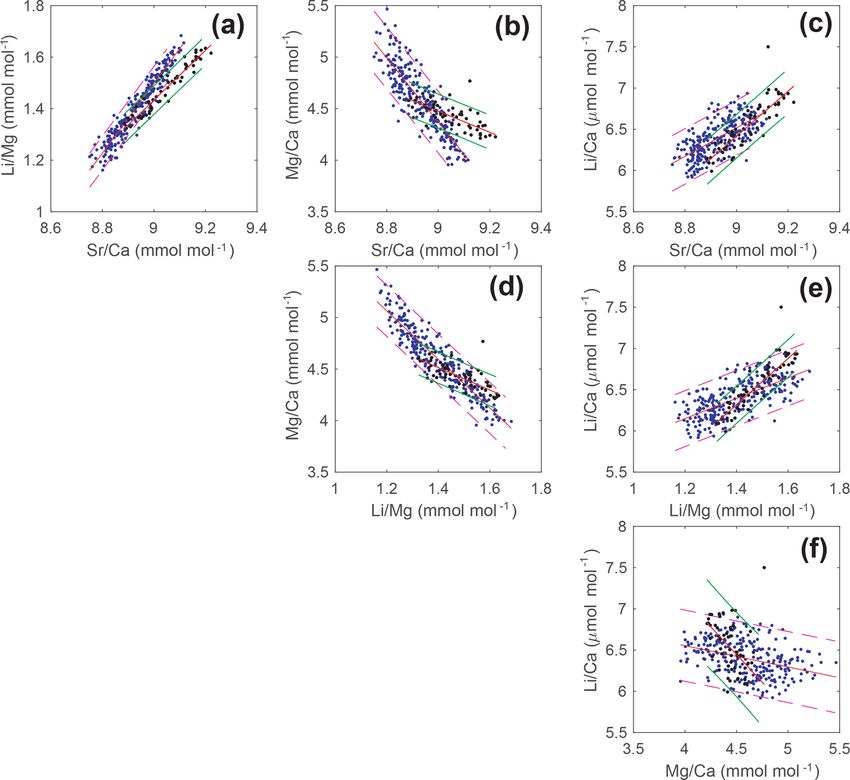
J. Zinke et al.: Multi-trace-element sea surface temperature coral reconstruction                                               703

Table 3. Root mean square error (RMSE) for trace element ratios against AVHRR-OISSTv2 for individual trace element ratios and Sr/Ca–
Li/Mg combination. Period used for the calculation of RMSE indicated in the last column.

                                                            Individual proxy RMSE
                            Core ID    Sr/Ca   Li/Mg     Mg/Ca     Li/Ca    Sr/Ca–Li/Mg      Period
                            EU2        0.38      0.36     1.13      0.58         0.32        2003–2012
                            EU3        0.41      0.90     1.79      1.65         0.60        2003–2012
                            EU3        0.55      0.74     1.33      1.41         0.62        1981–2012
                            Avg. all   0.45      0.67     1.42      1.21         0.51        1981–2012

SST anomalies were calculated using the literature aver-
age proxy–SST relationships of −0.061 mmol mol−1 ◦ C−1
for Sr/Ca (Corrège, 2006) and −0.060 mmol mol−1 ◦ C−1 for
Li/Mg (for Porites growing within 25 and 30 ◦ C; Hathorne
et al., 2013; D’Olivo et al., 2018). Composite coral-derived
SST anomalies were then calculated as the arithmetic mean
obtained from the two cores. Residuals were calculated as
the difference between coral-derived SST anomalies and
AVHRR-OISSTv2 anomalies (for ERSSTv4 see Fig. S8).
   Figure 7 illustrates the anomalies (1981–2010) for the
composite proxy SST from the two cores (individual cores
shown in Fig. S9) compared to the SST anomalies from
AVHRR-OISSTv2 (for ERSSTv4 see Fig. S8). EU2 and
EU3 Sr/Ca and Li/Mg anomalies agreed well between
records (rSr/Ca = 0.46, p < 0.001, N = 57; rLi/Mg = 0.56,
p < 0.001, N = 57; Fig. S9). The amplitudes of the EU
Sr/Ca SST composite anomalies closely tracked AVHRR-
OISSTv2 anomalies with slightly higher residuals prior
to 1993 (Fig. 7a). EU Li/Mg SST composite anomalies
displayed similar variability as AVHRR-OISSTv2, yet the
agreement was slightly lower than for Sr/Ca SST anoma-
lies with a shift to lower mean Li/Mg SST (rSr/Ca = 0.37,
p < 0.001, N = 189; rLi/Mg = 0.33, p < 0.001, N = 189;
Fig. 7b). The detrended bimonthly records agreed well be-
tween composite Sr/Ca SST and Li/Mg SST anomalies
(r = 0.73, p < 0.001, N = 252) and with AVHRR-OISSTv2
anomalies (rSr/Ca = 0.41, p < 0.001, N = 189; rLi/Mg =
0.31, p < 0.001, N = 189). As with absolute SST, Sr/Ca
SST and Li/Mg SST composite anomalies showed larger
residuals pre-1993 and in general colder anomalies than in
AVHRR-OISSTv2 (Fig. 7c; for ERSSTv4 see Fig. S8). The
lowest residuals were found for Sr/Ca SST and Sr/Ca–
Li/Mg combined SST anomalies (Fig. 7d). RMSEs between
2003 and 2012 are lowest for Sr/Ca SST (0.49 ± 0.35 ◦ C),
followed by Sr/Ca–Li/Mg (0.76 ± 0.39 ◦ C) and Li/Mg SST
(1.03 ± 0.50 ◦ C), while RMSEs between 1970 and 2012 are            Figure 7. SST anomaly reconstructions with SST residuals for
slightly higher (Table 3).                                          (a) EU composite Sr/Ca, (b) EU composite Li/Mg, and (c) their
                                                                    combination for cores EU2 and EU3. (d) Residuals for SST anoma-
   The anomalies for the EU Sr/Ca SST, Li/Mg SST, and
                                                                    lies of Sr/Ca SST, Li/Mg SST, and their combination for cores EU2
Sr/Ca–Li/Mg SST composite time series closely tracked               and EU3 with respect to the AVHRR-OISSTv2 data (Banzon et al.,
the anomalies in the in situ air temperature data (Fig. 8a–         2016). Anomalies were calculated relative to the 1981 to 2010 av-
c). Sr/Ca SST and Sr/Ca–Li/Mg SST performed slightly                erage bimonthly seasonal cycle.
better than Li/Mg SST (rSr/Ca = 0.46, p < 0.001, N = 189;
rSr/Ca−−Li/Mg = 0.43, p < 0.001, N = 189; rLi/Mg = 0.37,

www.biogeosciences.net/16/695/2019/                                                           Biogeosciences, 16, 695–712, 2019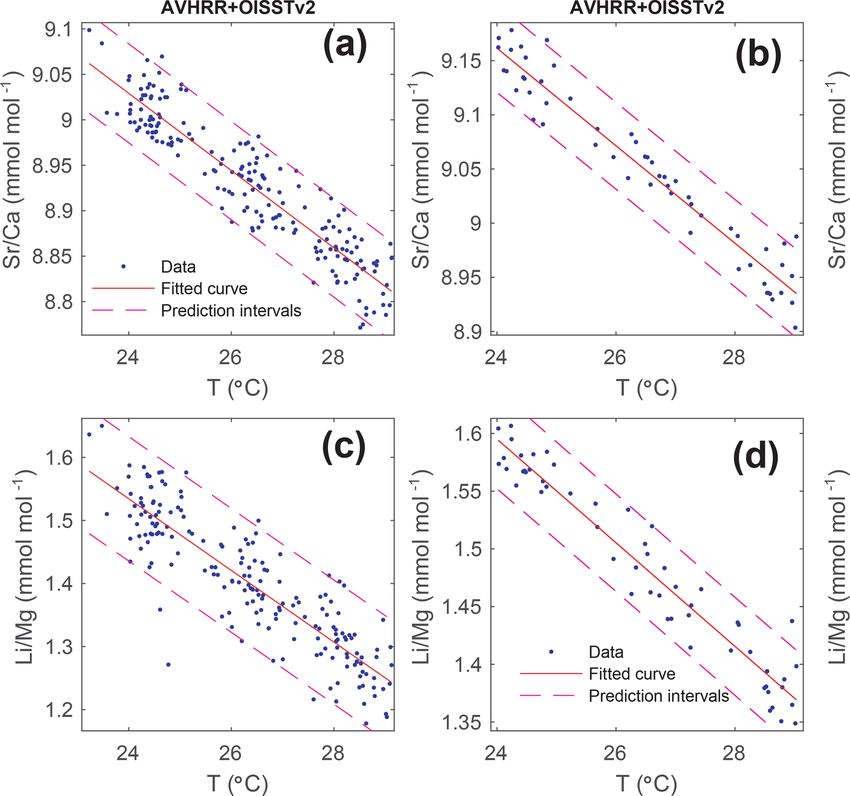
704 J. Zinke et al.: Multi-trace-element sea surface temperature coral reconstruction
p < 0.001, N = 189). Air temperatures showed marginally
colder temperature anomalies between 1970 and 1978 com-
pared to the Sr/Ca, Li/Mg, or Sr/Ca–Li/Mg composite SST
anomalies. AVHRR-OISSTv2 was also in close agreement
with air temperature anomalies (Fig. 8d). ERSSTv4 anoma-
lies mirrored air temperatures with overall slightly colder
mean SST anomalies than in air temperatures, especially be-
tween 1970 and 1990 (Fig. 8e).
3.4 Regional and large-scale climate relationships
To assess regional correlations, we compared the EU Sr/Ca
SST composite with published coral proxy records from the
Mozambique Channel and their corresponding instrumental
data based on ERSSTv4 (Figs. 9, S9). The proxy records in-
cluded Porites coral oxygen isotope and Sr/Ca from Mayotte
(Comoros Archipelago; 13◦ S, 45◦ E; Zinke et al., 2008) in
a lagoonal setting and from Ifaty Reef in a lagoon passage
(southwest Madagascar; 23◦ S, 43◦ E; Zinke et al., 2004).
Bimonthly anomalies for ERSSTv4, Sr/Ca SST, and δ 18 O
SST were calculated relative to the reference period 1973 to
1993. The ERSSTv4 records from the three sites, spanning
10◦ of latitude in the Mozambique Channel between 13 and
23◦ S, documented a statistically significant (> 95 %) warm-
ing trend since 1970 (Fig. 9). ERSSTv4 for 2◦ × 2◦ spatial
grids near Europa and Ifaty Reef shared 98 % of variability,
while Mayotte shared 38 % of variability with the former two
sites. The coral-proxy-based SST anomalies also showed sta-
tistically significant (> 95 %) warming trends, although gen-
erally higher than in ERSSTv4, with the exception of Ifaty
that showed no trend in Sr/Ca SST anomalies (Fig. 9).
The interannual variability in the EU Sr/Ca SST com-
posite anomalies and in the Mayotte and Ifaty proxy–SST
anomalies fluctuated by ∼ ±1 ◦ C with the exception of a
few warm and cold spikes in Mayotte and Ifaty time series
that were not recorded at Europa (Figs. 9b–e, S10). The EU
Sr/Ca SST composite anomalies agreed best with interan-
nual variability in Ifaty Sr/Ca SST (r = 0.42, p < 0.001,
N = 21) and δ 18 O SST (r = 0.19, p < 0.050, N = 21), al-
though with a cold bias in Ifaty Sr/Ca between 1985 and
1995 (Figs. 9d, e, S10). The EU Sr/Ca SST composite
anomalies and Mayotte proxy SST anomalies showed no
significant correlations, although the trend estimates were
within uncertainty bounds for Mayotte δ 18 O SST (Figs. 9b
and c, S10). Mayotte Sr/Ca SST time series showed anoma-
Figure 8. Comparison of coral composite Sr/Ca SST, Li/Mg SST, lous cold spikes between 1970 and 1978, which were not
and Sr/Ca–Li/Mg SST anomaly reconstructions with air tempera- recorded in regional ERSSTv4 (Fig. S10b and c).
ture from Europa Météo-France weather station data. (a) Sr/Ca SST
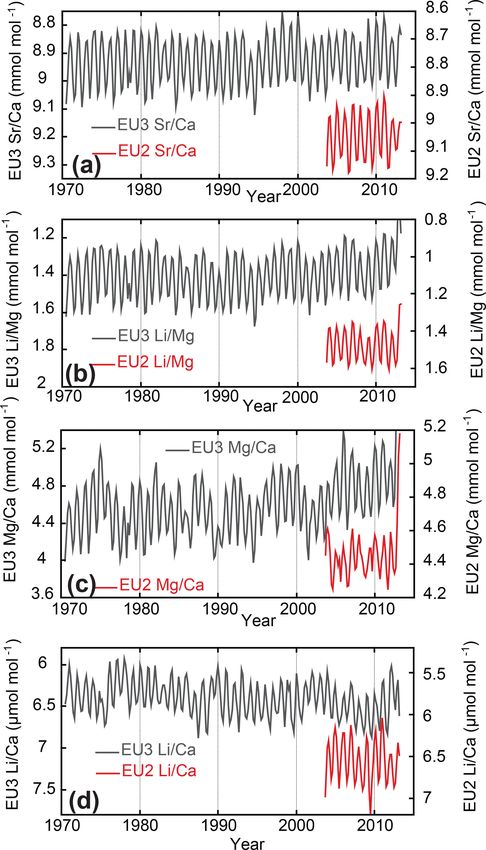
Spatial correlations between the EU composite SST
composite, (b) Li/Mg SST composite, (c) Sr/Ca–Li/Mg SST com-
posite, (d) Europa gridded AVHRR-OISSTv2 (Banzon et al., 2016),
anomalies and the AVHRR-OISSTv2 mean annual averages
and (e) Europa gridded ERSSTv4. Anomalies were calculated rela- (July to June) between 1981 and 2012 (Fig. 10) for each grid
tive to the 1981 to 2010 average bimonthly seasonal cycle for proxy point were calculated to investigate large-scale teleconnec-
reconstructions, instrumental SST, and air temperatures. tions. Similar spatial correlations were calculated with the
AVHRR-OISSTv2 data near Europa at 22◦ S, 40◦ E (0.25◦ ×
0.25◦ resolution) with the rest of the grid points (Fig. 10).
The correlations of the detrended data were computed using
Biogeosciences, 16, 695–712, 2019 www.biogeosciences.net/16/695/2019/J. Zinke et al.: Multi-trace-element sea surface temperature coral reconstruction 705
posite and the local AVHRR-OISSTv2 with global grids in
AVHRR-OISSTv2 (Fig. 10a and b). Coherent positive cor-
relation patterns emerge in the Mozambique Channel, the
northern and southeastern Indian Ocean, the southeastern
tropical Pacific, and northern tropical Atlantic. The Sr/Ca
and Li/Mg ratios showed the expected negative relationship
of both proxies with regional AVHRR-OISSTv2 mirroring
the SST patterns (Fig. 10c and d). Of particular interest was
the strong relationship with the northern tropical Atlantic (0–
20◦ N, 80–30◦ W).
The regressions of detrended coral composite Sr/Ca and
Sr/Ca–Li/Mg combined SST reconstructions with northern
tropical Atlantic AVHRR-OISSTv2 revealed the strongest
positive relationships for annual means between July and
June (Table 4). Correlations between detrended coral com-
posite Li/Mg SST reconstructions with northern tropical At-
lantic AVHRR-OISSTv2 were slightly lower. Northern trop-
ical Atlantic AVHRR-OISSTv2 (1981–1970) and ERSSTv4
(1970–2017) showed positive correlations with the At-
lantic Multi-decadal Oscillation (AMO) index (r = 0.70 to
0.72, p < 0.001; Table 4). Our detrended coral compos-
ite Sr/Ca and Sr/Ca–Li/Mg combined SST reconstructions
also showed statistically significant positive correlations with
the AMO index based on ERSSTv4 (Table 4). However,
AVHRR-OISSTv2 and ERSSTv4 for Europa indicated low
or nonsignificant correlations with the AMO, respectively,
despite the strong correlations with the northern tropical At-
lantic (Table 3). Furthermore, the tropical North Atlantic
(TNA; Enfield et al., 1999) and north tropical Atlantic indices
(NTA; Penland and Matrosova, 1998) indicated statistically
significant positive correlations with the coral-based SST and
instrumental SST data at Europa (Fig. 10e; Table 4).
The regressions of detrended seasonal averages in
AVHRR-OISSTv2 for Europa with the Niño3.4 index of
ENSO variability showed weak yet statistically significant
correlations in the season from February to April (r = 0.47;
p < 0.010; Table 4). The correlations between ERSSTv4 and
Niño3.4 were weaker (r = 0.34, p < 0.050; Table 4). The
detrended coral composite Sr/Ca, Li/Mg, and their com-
Figure 9. Regional comparison of Mozambique Channel ERSSTv4
anomalies for Mayotte (green), Europa (orange), and Ifaty, Mada- bined SST reconstructions showed no significant correla-
gascar (blue) (a), with linear warming trends in brackets. EU Sr/Ca tions with the Niño3.4 index. However, the Pacific–North
SST composite anomaly compared with (b) Mayotte δ 18 O SST American (PNA) pattern (Wallace and Gutzler, 1981), which
anomaly (blue), (c) Mayotte Sr/Ca SST anomaly (blue), (d) Ifaty is an atmospheric response to ENSO, showed statistically
δ 18 O SST anomaly (blue), and (e) Ifaty Sr/Ca SST anomaly (blue). significant correlations with AVHRR-OISSTv2 (r = 0.67,
Anomalies were calculated for the 1973 to 1993 reference period. p < 0.001) for Europa and the coral-derived SST anoma-
Linear warming trends indicated in (b)–(e) for proxy–SST for in- lies between 1981 and 2012 (r = 0.42, p = 0.014; Table 4).
dividual record length with EU composite Sr/Ca SST anomaly The spatial correlation pattern of the PNA index with global
only indicated once in panel (b). Proxy data taken from Zinke et AVHRR-OISSTv2 revealed a similar pattern as observed for
al. (2004, 2008).
the coral-based SST (Fig. 10).
the KNMI climate explorer (https://climexp.knmi.nl/, last ac-
cess: 20 December 2018; Trouet and van Oldenborgh, 2013)
with a cutoff p value < 0.05. Similar correlation patterns
were observed for the EU2–EU3 Sr/Ca–Li/Mg SST com-
www.biogeosciences.net/16/695/2019/ Biogeosciences, 16, 695–712, 2019706 J. Zinke et al.: Multi-trace-element sea surface temperature coral reconstruction
Figure 10. Spatial correlations of proxy-based coral composite SST reconstructions with local and global AVHRR-OISSTv2 for mean annual
data (Banzon et al., 2016). (a) Local AVHRR-OISSTv2 with global AVHRR-OISSTv2, (b) local AVHRR-OISSTv2 with EU composite
Sr/Ca–Li/Mg SST, (c) local AVHRR-OISSTv2 with EU composite Sr/Ca ratios, and (d) local AVHRR-OISSTv2 with EU composite
Li/Mg ratios. Panels (e) and (d) show spatial correlations of the TNA and PNA indices with global AVHRR-OISSTv2. Only correlations
with p < 0.05 were colored.
Table 4. Linear correlation of detrended, mean annual instrumental and coral composite proxy-based SST for Europa (EU) with northern
tropical Atlantic SST, the AMO index based on ERSSTv4, the tropical North Atlantic (TNA; Enfield et al., 1999) and north tropical Atlantic
index (Penland and Matrosova, 1998), and the seasonal Niño3.4 index between 1970 and 2012 (Kaplan et al., 1998).
Northern tropical
Atlantic SST AMO index TNA–NTA Niño3.4
1981–2013 EU-AVHRR-OISSTv2 0.59∗∗∗ 0.37∗∗ 0.55∗∗∗ /0.53∗∗∗ 0.47∗∗ (FMA)
1970–2013 EU-ERSSRv4 0.37∗∗ 0.18 0.34∗∗ /0.36∗∗ 0.34∗∗ (JFMA)
EU composite Sr/Ca SST anomalies 0.61∗∗∗ 0.46∗∗∗ 0.53∗∗∗ /0.45∗∗ –
EU composite Li/Mg SST anomalies 0.55∗∗∗ 0.54∗∗∗ 0.40∗∗ /0.32∗ –
EU composite Sr/Ca–Li/Mg SST anomalies 0.60∗∗∗ 0.52∗∗∗ 0.47∗∗∗ /0.39∗∗ –
∗ 90 %, ∗∗ 95 %, ∗∗∗ 99 % significance; DoF = 40 (N − 2).
Biogeosciences, 16, 695–712, 2019 www.biogeosciences.net/16/695/2019/J. Zinke et al.: Multi-trace-element sea surface temperature coral reconstruction 707
4 Discussion mates for SST near Europa; however, observations near the
coast can be susceptible to biases (e.g., mixing of land tem-
4.1 Reliability of Sr/Ca and Li/Mg as SST proxies perature with SST; Smit et al., 2013; Brevin et al., 2017). The
comparison between AVHRR-OISSTv2 and local air tem-
Both of the Europa coral core Sr/Ca and Li/Mg bimonthly perature anomalies revealed an excellent agreement for the
time series (EU3 and EU2) showed highly significant corre- years covered by the weather station and serves as a qual-
lations with the local and regional instrumental SST products ity check for the AVHRR-OISSTv2 data for our site. Nev-
(AVHRR-OISSTv2 and ERSSTv4). For the period of over- ertheless, the absolute temperature reconstruction from the
lap between 2003 and 2012 both proxies performed equally coral Sr/Ca and Li/Mg ratios showed a good agreement with
well in core EU2, while core EU3 Li/Mg slightly underper- the different instrumental temperature datasets, especially for
formed Sr/Ca. The regression slopes with SST were within core EU2. Thus, both Sr/Ca and Li/Mg provide highly reli-
the range of published calibrations for Porites corals (e.g., able SST proxies and in combination have the potential to
Hathorne et al., 2013; Montagna et al., 2014; D’Olivo et al., improve SST reconstructions.
2018). The bimonthly Sr/Ca, Li/Mg, and combined Sr/Ca– The statistically significant warming trend of 0.58±0.1 ◦ C
Li/Mg absolute SST reconstructions showed small devia- (p < 0.001) between 1970 and 2012 in the coral Sr/Ca SST
tions (mean RMSEs between 0.45 and 0.67 ◦ C; Table 3) from composite was in close agreement with instrumental SST
the instrumental temperatures with lower winter and slightly data (0.47±0.07 ◦ C in ERSSTv4; 0.40±0.18 ◦ C in AVHRR-
higher summer SST. For all proxies the agreement with in- OISSTv2 since 1981). The Li/Mg SST composite trend of
strumental data was highest for the period of overlap be- 1.06 ± 0.15 ◦ C (p < 0.001) is, however, too large and incon-
tween cores (2003 and 2012). In general, AVHRR-OISSTv2 sistent with both the Sr/Ca and instrumental records. The
seasonal SST amplitudes and SST anomalies showed higher differences in warming trends in Li/Mg SST and Sr/Ca SST
correlations with the coral-based SST reconstructions than probably highlight the differences in incorporation between
with ERSSTv4. The lower temperatures in the proxy–SST these elements (Montagna et al., 2014; Marchitto et al.,
compared with the satellite data of AVHRR-OISSTv2, which 2018), which could be exacerbated during periods of thermal
measures SST at the skin of the sea surface (top few mil- stress. The Li/Mg SST anomalies were especially low during
limeters), could be related to the living depth of the corals some years, which resulted in a larger RMSE 0.67 ± 0.65 ◦ C
(8.5 to 9.5 m). This was particularly apparent in several (Table 3) compared to Sr/Ca SST and AVHRR-OISSTv2,
cold spikes with 2 SD (−0.72 ◦ C) below the 1981 to 2012 ERSSTv4, and local air temperatures. A potential limitation
mean SST in our coral-based SST anomaly reconstructions, for the use of Li/Mg as an SST proxy is the small number
which were also observed in the instrumental data (1971, of studies to date reporting Li/Mg SST relationships (re-
1972, 1976, 1978, 1980, 1984, 1986, 1994, 2001, 2008). gression slopes) in tropical Porites and Siderastrea corals
The most extreme cold excursions during austral summer (Hathorne et al., 2013; Montagna et al., 2014; Fowell et al.,
occurred in 1986, 1994, 2001, and 2008, which were also 2016; D’Olivo and McCulloch, 2017; D’Olivo et al., 2018;
prominent in the AVHRR-OISSTv2. The year 1994 stands Marchitto et al., 2018). For example, applying the mean slope
out as the coldest anomaly between 1970 and 2012 in coral- of −0.049 mmol mol−1 ◦ C−1 for marine calcifiers reported
based SST (−1.34 ◦ C), AVHRR-OISSTv2 (−1.37 ◦ C), and in Montagna et al. (2014) to our Li/Mg data would lead to
ERSSTv4 (−1.16 ◦ C). However, the January–February 1989 significant overestimations of SST anomalies and hence even
and March–June 1997 cold spikes exceeding 1 ◦ C observed larger cold biases. Applying the −0.097 mmol mol−1 ◦ C−1
in AVHRR-OISSTv2 were not as extreme in our coral-based for Caribbean Siderastrea siderea forereef corals would un-
SST anomalies (−0.58 ◦ C in 1989; −0.1 ◦ C in 1997). A pos- derestimate SST anomalies (Fowell et al., 2016). The mean
sible explanation for these cold spikes is the upwelling of Sr/Ca SST relationship of -0.060 mmol mol−1 ◦ C−1 is, on
colder deeper water onto the northeast coast reef promoted the other hand, far better constrained by a much larger num-
by the steep slopes and topography of the forereef (gentle ber of studies (e.g., Corrège, 2006; DeLong et al., 2012;
sloping plain to a depth of 25 m). Upwelling-related cold Pfeiffer et al., 2017). In particular, EU3 Li/Mg was most
spikes have been recorded in temperature loggers across the likely affected by uncertainties in the incorporation of Mg
Mozambique Channel at 18 m of depth, potentially related and Li into the skeleton, while EU2 Li/Mg showed no irregu-
to periods of active Mozambique Channel eddies interacting larities. Interestingly, on a seasonal scale, Li/Ca and Mg/Ca
with the steep topography (Schouten et al., 2002; Van den in EU3 showed the expected negative correlation; however,
Berg et al., 2007; Swart et al., 2010). Differences between on interannual to decadal scales these ratios were positively
the proxy records and the instrumental records at interan- correlated. This perhaps reflects an “extreme” example of
nual scales could also reflect limitation in the instrumental growth effects on Li and Mg unrelated to temperature (e.g.,
records. The ERSSTv4 data used extending back to 1970 are the effect of cation entrapment and heterogeneous distribu-
based on very sparse observations in the ICOADS database tion in the centers of calcification; Montagna et al., 2014;
for the southern Mozambique Channel. The resolution of the Marchitto et al., 2018). In most cases calculating Li/Mg can-
satellite data starting in 1981 should provide the best esti- cels out this effect by leaving SST as the main controlling pa-
www.biogeosciences.net/16/695/2019/ Biogeosciences, 16, 695–712, 2019708 J. Zinke et al.: Multi-trace-element sea surface temperature coral reconstruction rameter; however, in core EU3 this appears not to be as effec- EU3 had an effective tissue thickness of 9.5 months and was tive, leading to slightly lower correlation of Li/Mg with SST identified as P. mayeri. This confirms the effectiveness of the compared to Sr/Ca with SST. Careful inspection of the sam- multiproxy method proposed by D’Olivo et al. (2018) when pling path along the major growth axes revealed that a poten- applied within its limits. tial cause for discrepancies in Li/Ca and Mg/Ca affecting Li/Mg might be suboptimal sampling along parallel growth 4.2 Regional and large-scale climate teleconnections axes as also apparent in Fowell et al. (2016). The overlap pe- riod of 2003 to 2012 was sampled continuously in both cores The spatial correlations between Europa coral composite without a switch in growth axis, showing an excellent agree- data and global SST data indicated a strong response to lo- ment between cores including Li/Ca (r = 0.57, p < 0.001, cal variability in the Mozambique Channel at the latitude be- N = 54) and Mg/Ca (r = 0.58, p < 0.001, N = 54). Prior tween 15 and 30◦ S. The pattern of spatial correlation also to 2003, core EU3 was sampled along three different growth suggested teleconnections with the northern–eastern Indian axes (1970–1982, 1983–1996, and 1996–2012) orientated Ocean, the southeastern Pacific, and the tropical Atlantic. at angles along the core length. Although all axes showed ENSO influence in the instrumental data was weak and ab- optimal growth orientations, the Li/Ca ratios in EU3 devi- sent in our proxy records. Only the warmest years (summer ated from the trends shown in Mg/Ca, Sr/Ca, and Li/Mg. maxima) of the Europa composite time series corresponded The importance of optimal sampling along continuous main with strong El Niño (1998, 2010) and La Niña (1999, 2000, growth axes for optimal trace element ratios and stable iso- 2011) events, as attested, for example, by the high coral mor- tope determinations has been shown in several recent studies tality reported from 1998 (Quod and Garnier, 2004) and the (e.g., DeLong et al., 2012; Zinke et al., 2016), which also moderate coral bleaching observed in 2011 (Guillaume and appears to be the case for the Li/Mg proxy. This sensitiv- Bruggemann, 2011). Local air temperatures and AVHRR- ity of the Li and Mg proxies in core EU3, identified as P. OISSTv2 anomalies indicated other warm years (> 0.5 ◦ C) mayeri, could also reflect a species effect due to slight differ- corresponding to El Niño years (1983, 1988, 1991–92), La ences in their calcification strategies. For example, D’Olivo Niña years (1989, 1996), and ENSO neutral years (1981, et al. (2018) showed a deviation for Porites solida from other 2007, 2012–13). The majority of these lower-magnitude massive Porites species in the relationships between Sr/Ca warm events were also recorded in the coral proxy time se- and Li/Mg with temperature. However, this requires further ries. Overall, these results suggest a weak or variable impact investigations as this is the first long-term (multi-decadal) re- of ENSO around Europa. construction based on massive Porites. Despite these uncer- Perhaps the most interesting and to some extent unex- tainties Li/Mg was overall the second-best-performing proxy pected relationship of our study region was found with the in this study with the detrended Li/Mg data showing an ex- northern tropical Atlantic (5 to 20◦ N, 30 to 80◦ W), a region cellent agreement with the instrumental SST and Sr/Ca data. that corresponds with the main development region for hur- Furthermore, the interannual and decadal SST variations as ricanes in the tropical Atlantic (Knutson et al., 2010). This well as spatial correlation patterns in Li/Mg appeared not to region also has strong relationships with the AMO, which is have been affected and can be interpreted with high confi- the leading mode of multi-decadal variability in the north- dence as indicated by our field correlations. Overall, the re- ern Atlantic and thought to be driven by Atlantic Meridional sults from this study indicated that Sr/Ca is still superior to Ocean Circulation (AMOC) variability (e.g., Schlesinger and Li/Mg and was the most reliable SST proxy when applied Ramankutty, 1994; Kerr, 2000; Knight et al., 2005). Our to a longer time series. However, the excellent agreement be- coral-based SST reconstructions and satellite data revealed tween Sr/Ca and Li/Mg and their combination in core EU2 a strong relationship with both the tropical North Atlantic demonstrated that both SST proxies and their combination (TNA; Enfield et al., 1999) and north tropical Atlantic indices can provide, with greater confidence, more reliable SST re- (NTA; Penland and Matrosova, 1998) as well as the AMO constructions with lower RMSEs (D’Olivo et al., 2018). since at least 1970 (Table 4). However, the ERSSTv4 for In addition, we tested the multiproxy paleothermometer Europa showed nonsignificant correlations with the AMO, based on Sr/Ca and Li/Mg data proposed by D’Olivo et while the relationship with the northern tropical Atlantic SST al. (2018) in both corals. Using the proposed equations on was robust. The exact mechanism for this teleconnection be- cores EU2 and EU3, their respective RMSE values were tween the Mozambique Channel and the tropical Atlantic re- 1.1 and 0.2 ◦ C higher than the values obtained from a di- mains elusive. We speculate that atmospheric processes in rect calibration against the SST products. While the multi- response to AMO, tropical Atlantic, or Indo-Pacific variabil- proxy method produced excellent results for core EU3, the ity might be controlling this relationship since all correlated higher RMSE for EU2 could be explained by the limitations regions lie within or near the trade wind convergence zone of the multiproxy method as solutions appear to deteriorate (the Intertropical Convergence Zone) where atmospheric cir- for Porites solida and corals with small effective tissue thick- culation associated with deep convection controls underly- ness (∼< 4 months). In this case EU2 had an effective tissue ing SST (Schott et al., 2009; Xie et al., 2010; Marshall et thickness of 3.9 months and was identified as P. solida, while al., 2014; Green et al., 2017; Koseki and Bhatt, 2018). Wind- Biogeosciences, 16, 695–712, 2019 www.biogeosciences.net/16/695/2019/
You can also read