Elevated dimethylarginine, ATP, cytokines, metabolic remodeling involving tryptophan metabolism and potential microglial inflammation characterize ...
←
→
Page content transcription
If your browser does not render page correctly, please read the page content below
www.nature.com/scientificreports
OPEN Elevated dimethylarginine, ATP,
cytokines, metabolic remodeling
involving tryptophan metabolism
and potential microglial
inflammation characterize primary
open angle glaucoma
Sujith Kumar Pulukool1, Sai Krishna Srimadh Bhagavatham1, Vishnu Kannan1,6,
Piruthivi Sukumar2, Rajesh Babu Dandamudi3,7, Shamika Ghaisas4, Haripriya Kunchala4,
Darshan Saieesh1, Ashwin Ashok Naik1, Ashish Pargaonkar5, Anuj Sharma4* &
Venketesh Sivaramakrishnan 1*
Glaucoma of which primary open angle glaucoma (POAG) constitutes 75%, is the second leading
cause of blindness. Elevated intra ocular pressure and Nitric oxide synthase (NOS) dysfunction are
hallmarks of POAG. We analyzed clinical data, cytokine profile, ATP level, metabolomics and GEO
datasets to identify features unique to POAG. N9 microglial cells are used to gain mechanistic insights.
Our POAG cohort showed elevated ATP in aqueous humor and cytokines in plasma. Metabolomic
analysis showed changes in 21 metabolites including Dimethylarginine (DMAG) and activation of
tryptophan metabolism in POAG. Analysis of GEO data sets and previously published proteomic data
sets bins genes into signaling and metabolic pathways. Pathways from reanalyzed metabolomic
data from literature significantly overlapped with those from our POAG data. DMAG modulated
purinergic signaling, ATP secretion and cytokine expression were inhibited by N-Ethylmaleimide, NO
donors, BAPTA and purinergic receptor inhibitors. ATP induced elevated intracellular calcium level
and cytokines expression were inhibited by BAPTA. Metabolomics of cell culture supernatant from
ATP treated sets showed metabolic deregulation and activation of tryptophan metabolism. DMAG
and ATP induced IDO1/2 and TDO2 were inhibited by N-Ethylmaleimide, sodium nitroprusside and
BAPTA. Our data obtained from clinical samples and cell culture studies reveal a strong association
of elevated DMAG, ATP, cytokines and activation of tryptophan metabolism with POAG. DMAG
mediated ATP signaling, inflammation and metabolic remodeling in microglia might have implications
in management of POAG.
Glaucoma is the second leading cause of blindness and is predicted to affect 111 million by 2040 worlwide1. About
12 million Indians are estimated to have glaucoma2. Primary open angle glaucoma (POAG) comprise about 75%
of glaucoma3. The symptoms include increased Intra Ocular Pressure (IOP), reduction in Retinal Nerve Fiber
Layer (RNFL) thickness and loss of peripheral vision4. The IOP also leads to cupping of the optic nerve head,
1
Disease Biology Lab, SSSIHL‑Agilent Center for Excellence in Multiomics and Cell Sciences, Dept. of
Biosciences, Sri Sathya Sai Institute of Higher Learning, Prasanthi Nilayam, Anantapur, Andhra Pradesh 515 134,
India. 2Leeds Institute of Cardiovascular and Metabolic Medicine, School of Medicine, University of Leeds, Leeds,
UK. 3SSSIHL‑Agilent Center for Excellence in Multiomics and Cell Sciences, Dept. of Chemistry, Sri Sathya
Sai Institute of Higher Learning, Prasanthi Nilayam, Anantapur, Andhra Pradesh 515 134, India. 4Department
of Ophthalmology, Sri Sathya Sai Institute of Higher Medical Sciences, Prasanthi Gram, Anantapur, Andhra
Pradesh 515 134, India. 5Application Division, Agilent Technologies Ltd., Bengaluru, India. 6Present address:
Dept. of Botany/Biotechnology, CMS College, Kottayam 686 001, India. 7Present address: Phenomenex India,
Hyderabad, Telangana 500 084, India. *email: anujsharma85@gmail.com; s.venketesh@gmail.com
Scientific Reports | (2021) 11:9766 | https://doi.org/10.1038/s41598-021-89137-z 1
Vol.:(0123456789)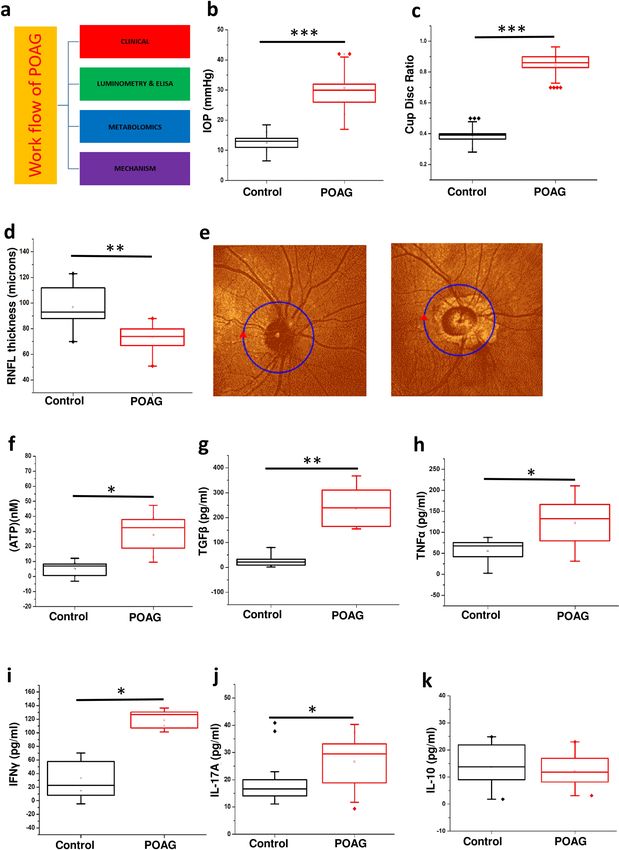
www.nature.com/scientificreports/
Figure 1. Showing clinical parameters, elevated levels of ATP in aqueous humor and cytokine levels in plasma ◂
in POAG patients. (a) Work flow. (b) The IOP profile in POAG group compared to control. (c) The cup disc
ratio (CDR) in POAG group compared to control. (d) Retinal nerve fiber layer thickness (RNFL) thickness in
POAG patients compared to control eye. (e) Representative figure of OCT image showing the RNFL thickness
in POAG patients compared to control eye. (f) Changes in the levels of ATP in aqueous humor of control and
POAG patients. Cytokine profiling of (g) TGFβ (h) TNFα (i) IFNɣ (j) IL-17A and (k) IL-10 in blood plasma of
control and POAG patients. In all the cases p values were calculated using Mann–Whitney U test. * for P < 0.05,
** for P < 0.01, and *** for P < 0.001. For n numbers and the results provided as mean ± s.d, refer to text. (a) was
created using Microsoft office Professional Plus 2016 (version-2016).
which is associated with visual defects, axonal stress and eventual death of retinal ganglion c ells5. The elevated
IOP stems from trabecular meshwork (TM) dysfunction due to increased resistance to aqueous humor fl ow6. The
standard treatment for glaucoma is the reduction of IOP by either medication or surgery, despite which the visual
function continue to deteriorate in a vast majority of patients7,8. Hence, it is imperative that the mechanisms
leading to axonal injury and retinal ganglion cell death be discerned so as to identify biomarkers associated with
progression and favorable prognosis as well as potential therapeutic targets for better management of glaucoma.
Nitric oxide synthase (NOS) is shown to modulate aqueous humor flow9. NOS is expressed in multiple ocular
tissues including trabecular meshwork, Schlemm’s canal, iris m uscles10. NOS inhibition was found to increase
IOP and NO donors were found to reduce I OP9. Previous studies have shown an association of Dimethylarginine
(DMAG) with different types of glaucoma including POAG11. DMAG is an inhibitor of NOS12. Inhibition of
NOS, upregulates exocytosis by nitrosylating N-Ethylmaleimide sensitive f actor13. Inhibition of NOS also induce
inflammatory response in m icroglia14. Elevated IOP also leads to elevated levels of secreted A TP15 which is an
inflammatory molecule.
Retina is a part of Central Nervous System (CNS), with three distinct glia cells, which include the Muller Cells,
astrocytes and microglia16. Muller cells and astroglia support metabolism of retinal neurons while microglia play
a role in retinal homeostasis and are implicated in health and d isease17. A chronic pro-inflammatory response
orchestrated by microglia represent early events leading to reactive microgliosis, is associated with retinal damage
and progression of glaucoma in both humans and animal models18,19. Consistent with inflammation in glaucoma,
the expression of many Th1 cytokines are elevated in POAG20. Microglia in glaucoma are shown to express toll
like receptors, P2X7 receptors and matrix metalloproteinases. Extracellular ATP is also shown to induce metabolic
rewiring in many cell t ypes21. Microglia, during activation, changes to an M1 phenotype and exhibit immuno-
metabolism by upregulating glycolysis and nucleotide m etabolism22. In vitro microglial cell culture has been a
beneficial tool to study inflammatory response and mechanistic aspects associated with d isease23. The BV2 and
N9 are the widely used microglial systems from rat and mice respectively23. Though the BV2 cells are similar to
primary microglia the magnitude of inflammatory response was less pronounced23. The N9 cells combines many
phenotypic characteristics of primary microglia like cytokine gene expression, phagocytosis, express purinergic
receptors subtypes which are sensitive to A TP23. Hence N9 cells are ideal in vitro systems to study purinergic
signaling and its mechanistic implications for glaucoma. Despite many studies, a concerted effort to carry out
an integrated analysis of clinical data and cell culture models to address the mechanism involved in the disease
has not been worked out.
Various studies have focused on the risk factors associated with POAG in different population which includes
genetic, metabolic, and environmental factors24. Studies have shown association of various SNPs (single nucleo-
tide polymorphisms) with P OAG25. GWAS analysis of POAG shows association of genes that influence cup-disc
ratio, disc area, cup area, IOP and central corneal t hickness26. Transcriptomic analysis has been carried out on
trabecular meshwork removed during surgery or retina from postmortem donors as well as animal s tudies27.
TM from POAG patients shows changes in the expression levels of genes belonging to inflammation, signaling,
antioxidant system, extracellular matrix, cell–matrix interaction, cell cycle, cytokines and cytokine receptors
etc28. Proteomic analysis of aqueous humor, trabecular meshwork and tear shows changes in the levels of pro-
teins involved in cytokines and growth factors, cholesterol and lipid metabolism, inflammatory and immune
response, antioxidant, proteolysis, cell interaction etc., in P OAG29–33. Metabolomics of plasma and aqueous
humor has been carried out which shows changes in metabolites belonging to carbohydrate, steroid, fatty acid,
phosphatidylcholine, nicotinamide and polyamine metabolism e tc34–37. All these point towards association of
mitochondrial dysfunction and accumulation of energetic pathway related metabolites with g laucoma34. Com-
pared to genomics, transcriptomics and proteomics, metabolomics helps to analyze metabolites which are the
end product and hence represent the phenotype.
In the current study, we have measured the clinical parameters, aqueous humor ATP, plasma cytokines along
with metabolomic analysis of aqueous humor from POAG patients. Our patient cohort displays characteristic
feature of POAG, elevated ATP and cytokines, metabolic remodeling involving immunometabolism and acti-
vation of tryptophan metabolism with POAG. Further, using the murine N9 microglial cell culture model, we
aimed to demonstrate that the role of DMAG and purinergic signaling in the disease. Our data demonstrate,
DMAG mediated modulation of purinergic signaling, expression of cytokines as well as metabolic remodeling
and activation of tryptophan metabolism with potential implications for the disease.
Results
Elevated IOP and cup‑disc ratio (CDR) as well as reduced RFNL thickness in POAG. The overall
approach is summarized in (Fig. 1a). The patients (POAG and Cataract controls) were diagnosed and recruited
for the study using standard procedures as outlined in methods. The results are provided as mean ± s.d. (Stand-
Scientific Reports | (2021) 11:9766 | https://doi.org/10.1038/s41598-021-89137-z 2
Vol:.(1234567890)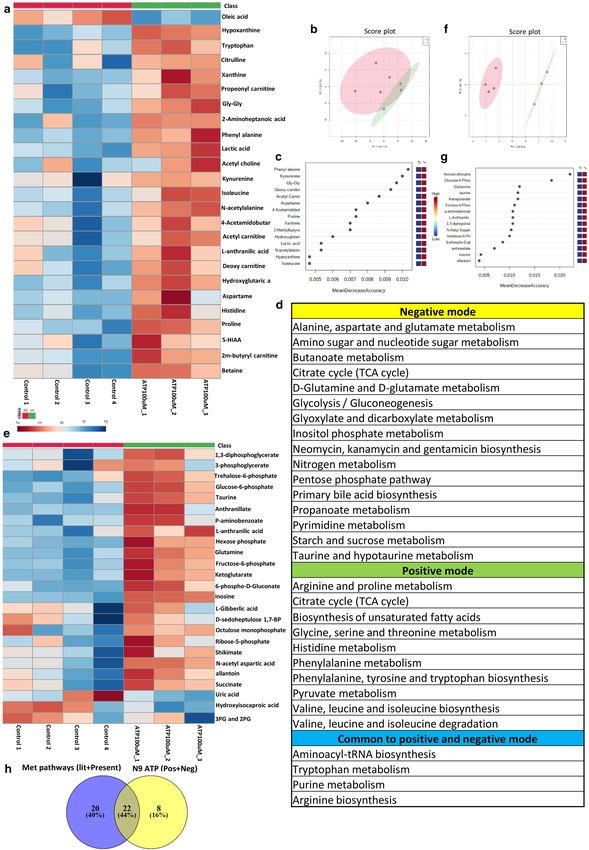
www.nature.com/scientificreports/

Scientific Reports |   (2021) 11:9766 |   https://doi.org/10.1038/s41598-021-89137-z        3

                                                                                       Vol.:(0123456789)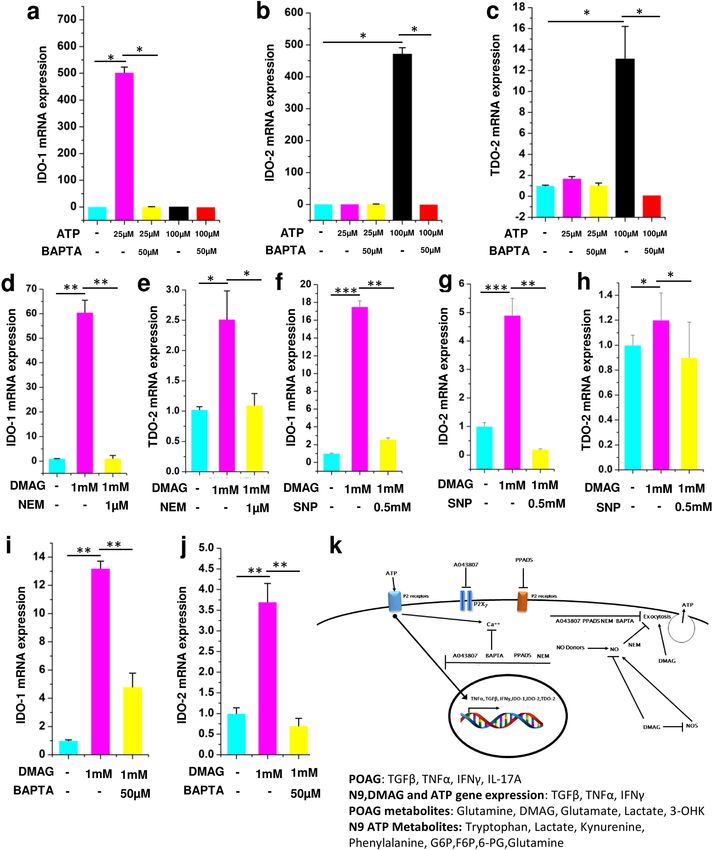
www.nature.com/scientificreports/
ard deviation). OCT, slit lamp and tonometry was used to determine the RNFL thickness (Control-97.64 ± 13.84,
n = 15; POAG-75.769 ± 10.353, n = 15), cup-disc ratio (CDR) (Control-0.3791 ± 0.05, n = 20; POAG-0.821 ± 0.071,
n = 20) and IOP (Control-13.16 ± 3.26, n = 25; POAG-28.55 ± 8.217, n = 25) respectively on both the eyes as given
in methods. As expected the IOP (p = 0.00023) and cup to disc ratio (p = 0.00012) was significantly elevated while
the RNFL thickness (p = 0.0027) was significantly lower in POAG patients compared to control eye (Fig. 1b–d).
The values for IOP, CDR and RNFL thickness was within the normal range for control eye. A strong positive
Pearson’s correlation of 0.8493 (control n = 25 and POAG n = 20) was observed between IOP and cup/disc ratio
while a strong negative correlation of − 0.522 (control n = 15 and POAG n = 15) was observed between IOP and
RNFL thickness. The clinical data shows marked loss of peripheral vision in POAG (Fig. 1e). All the POAG
patients are in an advanced stage of glaucoma with optic nerve cupping and CDR more than 0.8. The observa-
tions in our patient cohort from Indian population are in lieu with those that are previously reported for POAG.
Elevated level of ATP in aqueous humor and plasma cytokines in POAG. Elevated levels of IOP
which causes mechanical stress is associated with elevated levels of ATP38. The results are provided as mean ± s.d.
within brackets. Consistent with expectations, our results showed elevated levels of ATP (p = 0.03) in aqueous
humor of POAG patients (n = 6, 27.691 ± 10.619) compared to control (n = 6, 5.143 ± 3.755). Significant strong
positive Pearson’s correlation of 0.7478 was observed between IOP and ATP levels (Fig. 1f). Since elevated extra-
cellular ATP is associated with inflammation, we measured the cytokine levels in patient plasma.
The total number of 6 controls and 6 POAG plasma samples were used for cytokine analysis and the
results are provided as mean ± s.d. within brackets. ELISA of cytokines TGFβ (control-10.513 ± 8.221; POAG-
262.62 ± 84.147), TNFα (control-33.378 ± 30.414; POAG-124.59 ± 50.716), IFNγ (control-34.38 ± 20.992; POAG-
118.0667 ± 11.25), IL-17A (control-20.27 ± 10.321; POAG-26.67 ± 9.0932) and IL-10 was carried out as given in
methods. A significant increase in level of TGFβ (p = 0.0021), TNFα (p = 0.0343), IFNγ (p = 0.0222) and IL-17A
(p = 0.013) was observed in POAG compared to control (Fig. 1g–j). However, no change was observed in the
IL-10 levels (Fig. 1k). The cytokine levels display an inflammatory bias, which is consistent with previous studies
that report the association of inflammation with POAG39,40.
Targeted metabolomic analysis of aqueous humor reveals specific changes in metabolic path-
ways in POAG. Targeted metabolomic analysis of aqueous humor from POAG (n = 6) and cataract controls
(n = 6) were carried out as described in methods using Multiple Reaction Monitoring (MRM). Relative levels
of 164 metabolites were determined across clinical samples of which 111 metabolites were detected. Non-par-
ametric analysis of significance with an FDR correction of 0.25 showed 21 metabolites which are significantly
different between POAG and cataract controls (Supplementary Fig. S1). The heat map of the top 25 metabolites
is provided (Fig. 2a). The metabolites include amino acids, nucleotides, Dimethylarginine, glutamate, 3-Hydrox-
ykynurenine, lactate etc. These metabolites were subsequently binned into 22 pathways (Fig. 2b). The meta-
bolic pathways include multiple amino acids metabolism (glutamine, glutamate, arginine, histidine, tryptophan
metabolism etc.), purine and pyrimidine metabolism, Biotin and butanoate metabolism, sphingolipid metabo-
lism, pyruvate metabolism as well as nicotinate and nicotinamide metabolism (Fig. 2b). These pathways have
implications for elevated IOP due to resistance to aqueous humor flow, inflammation, excitotoxicity etc. Unbi-
ased PLS-DA clustered the samples into two different groups which was represented by a score plot (Fig. 2c).
PCA analysis also differentiated the samples into two group and the groups were also represented by a score
plot (Supplementary Fig. S1). However, PLS-DA analysis resulted in better separation of the samples into two
groups and cross validation was done resulting in good model parameters ( R2 = 0.91214, Q2 = 0.65856). Further-
more, in Random Forest analysis adenine, methyl glutaric acid, lysine, N-acetyl alanine and aspartame, the top 5
metabolites distinguished POAG from controls (Fig. 2d). Biomarker analysis showed adenine, N-acetyl alanine,
hypoxanthine, lysine, nicotinamide, Phe-Glu, 2-aminobutyraldehyde and Lactate as the metabolites with high
reliability as a biomarker with Area Under Curve (AUC) values above 0.9. The results are provided in the Sup-
plementary Figure S1.
Analysis of GEO database and proteomic and metabolomics data from literature bins genes
into different pathways. To delineate if the observations of elevated cytokines and metabolic deregulation
are reflected across population, transcriptomic data from publically available GEO database as well as proteomic
and metabolomic data from literature was analyzed. The gene expression data sets for POAG (GSE27276 and
GSE4316) was collected from GEO database. For GSE4316, the genes that have a significant p value of ≤ 0.05 and
a twofold change in expression levels was set as the criteria for analysis. For GSE 27276, adjusted p value of ≤ 0.05
was used. Genes so obtained were subject to ClueGO analysis with Reactome, KEGG and W ikiPathways41–43.
The genes were binned into various metabolic pathways like steroid, cholesterol, fatty acid and lipid biosyn-
thesis, glycosaminoglycan, nicotinamide, butanoate, glutathione, hyaluronan and amino acid metabolic path-
ways, inflammatory pathway etc. (Supplementary Table S1). The enriched pathways related to inflammation and
other inflammatory disease pathways encompassed TNFα, IFNγ, TGFβ signaling modules etc. (Supplementary
Table S1). The pathway analysis also showed oxidative stress as a component in POAG. The data is provided in
Supplementary Table S1. The pathway enrichment analysis is provided in Supplementary Fig. S2.
ata30,31,44,45 using EnrichR with KEGG database binned genes into pentose phosphate
Analysis of proteomic d
pathway, glycolysis/gluconeogenesis, phenyl alanine, cholesterol metabolism, HIF1 signaling pathways etc. The
metabolomic data46–48 were analyzed using MetaboAnalyst. The pathways that were enriched include alanine,
aspartate and glutamate metabolism, aminosugar and nucleotide metabolism, glycolysis/gluconeogenesis, trypto-
phan metabolism, phenyl alanine metabolism etc. The results of significantly deregulated pathways are provided
in the supplementary Table S1.
Scientific Reports | (2021) 11:9766 | https://doi.org/10.1038/s41598-021-89137-z 4
Vol:.(1234567890)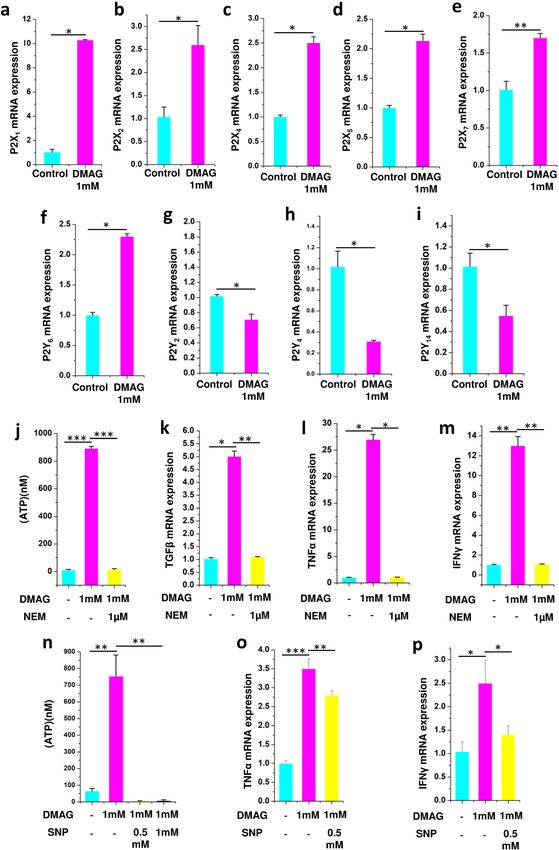
www.nature.com/scientificreports/
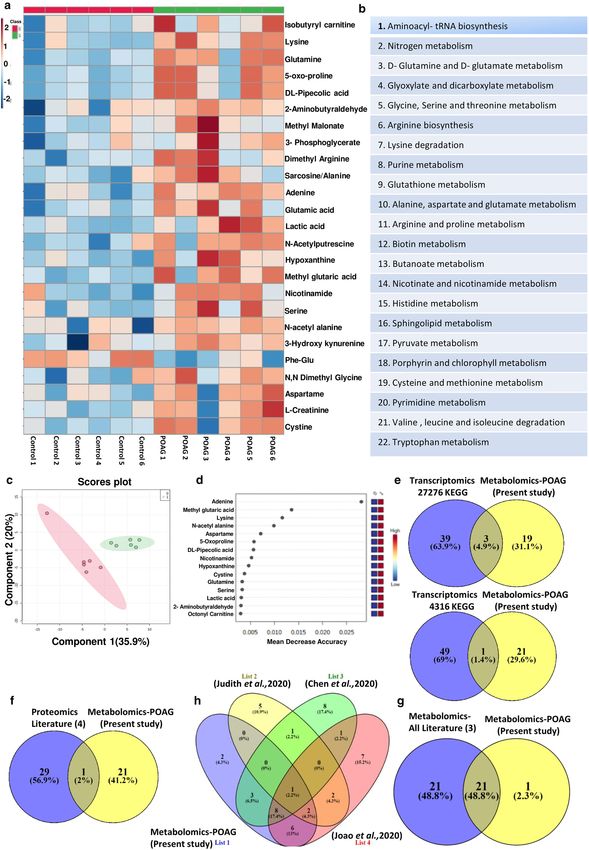
Figure 2. Showing results of targeted metabolomics analysis of aqueous humor in POAG compared to controls. (a) Heat
map of metabolomic analysis of control and POAG patient cohort. (b) List of pathways to which significant differential
metabolites belong to POAG are binned at an FDR of 0.25. (c) Unbiased PLS-DA clustered the samples into two different
group is represented by a score plot (d) showing Random Forest analysis distinguishing POAG from controls (e) showing
overlap of metabolic pathways with transcriptomic data set (GSE27276 and GSE4316) using KEGG (f) Comparative analysis
of proteomic data (Literature) with metabolomic data (present study) showing one conserved pathway. (g) showing overlap
of 21 pathways between metabolomics data (present study) and metabolomics (Literature) (h) Flower model Venn diagram
showing overlapping pathways among metabolomics data from present study and those from Literature. (a,c,d) was generated
using MetaboAnalyst 5.0 (Version-5.0; URL link: https://www.metaboanalyst.ca/). (e–h) was created using V
ENNY2.1
(Version-2.1; URL link: https://bioinfogp.cnb.csic.es/tools/venny/).
Scientific Reports | (2021) 11:9766 | https://doi.org/10.1038/s41598-021-89137-z 5
Vol.:(0123456789)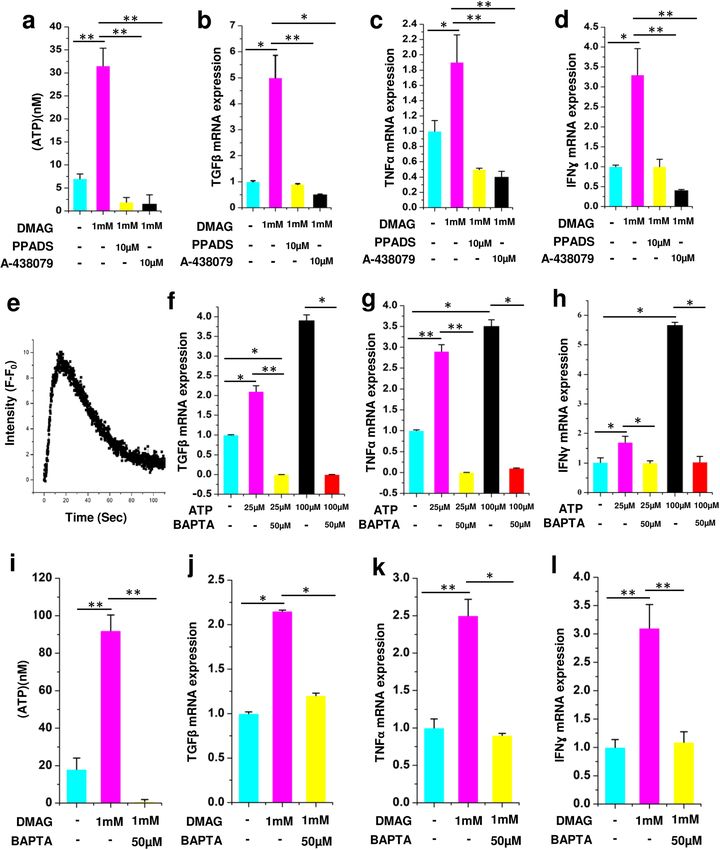
www.nature.com/scientificreports/
Comparison of our data with GEO transcriptomic data sets, proteomic and metabolomic data
reaffirms pathways specific to POAG. To understand if the elevated cytokine levels and metabolic
pathways which are deregulated in our patient cohort, are of general relevance in glaucoma, we compared the
metabolic data and elevated cytokines with transcriptomic data from GEO database. Interestingly, the data sets
showed an overlap of metabolic pathways with transcriptomic data set (GSE27276 and GSE4316) analyzed.
Though only 4 pathways overlapped from KEGG analysis (Fig. 2e), when pathways obtained using Reactome
and WikiPathways were included, an overlap of 7 pathways were obtained (Supplementary Table S2). The over-
lapping metabolic pathways include lipids, various amino acids, glutathione etc. (Supplementary Table S2). The
transcriptomic data from GEO Data set analysis also showed the cytokine signaling pathways comprising TGFβ,
TNFα, and IFNγ, which were elevated in the plasma of our patient cohort (Supplementary Table S2). A com-
parative analysis of proteomic data with our metabolomic data showed only one conserved pathway in Venn
diagram (Fig. 2f). However, comparison of pathways obtained from our metabolomic data with those obtained
by reanalyzing the three published metabolomic data showed an overlap of about 21 pathways out of 22 obtained
in our study as represented in Venn diagram (Fig. 2g). Overlapping pathways among metabolomics data from
present study and those from literature is represented as Flower model Venn diagram (Fig. 2h). The list of over-
lapping pathways from proteomics and metabolomics are provided in Supplementary Table S2. In addition, the
overlapping pathways of transcriptomics with proteomics as well as pathways obtained from reanalysis of pub-
lished metabolomic data have been compared using Venn diagram and displayed considerable overlap (Supple-
mentary Figure S3). Overall these results suggest association of immunometabolism, activation of tryptophan
metabolism and inflammatory cytokines with POAG.
Inhibition of NOS with DMAG invoked purinergic signaling and expression of cytokines in N9
microglia. Previous studies have shown inhibition of NOS induced an inflammatory response and upregu-
lation of exocytosis13. Since microglia are implicated in glaucoma49, to understand the mechanistic aspects of
the disease, N9 microglial cells were used. N9 microglial cells are good models as they express P2 receptors and
Toll like receptors, exhibit phagocytosis and chemotaxis which are similar to primary m icroglia23,50. A role for
Caveolin-1 in protecting RGC from acute ocular hypertension by modulating microglia into M2 phenotype
was demonstrated using N9 cells with potential implications for g laucoma51. The experiments were performed
in two biological replicates and three technical replicates. The results are provided as mean ± SEM (Standard
error of mean) within brackets. DMAG, an inhibitor of NOS modulated the expression of P2X receptors (P2X1
(p = 0.0356), P2X2 (p = 0.0487), P2X4 (p = 0.0365), P2X5 (p = 0.0413) and P
2X7 (p = 0.0442) (Fig. 3a–e) and P2Y
receptors (P2Y6 (p = 0.0431), P2Y2 (p = 0.0449), P2Y4 (p = 0.0499) and P2Y14 (p = 0.0453) receptors, which are
activated by extracellular nucleotides in N9 microglia (Fig. 3f–i). N9 microglial cells treated with DMAG also
showed elevated levels of extracellular ATP (p = 0.00016) in the cell culture supernatant (Fig. 3j). Further, DMAG
also induced an inflammatory response by upregulating the expression of cytokines like TGFβ (p = 0.0365),
TNFα (p = 0.0361) and IFNγ (p = 0.0038) (Fig. 3k–m). The DMAG induced secretion of ATP (p = 0.00018),
(Fig. 3j) and the expression of cytokines) could be attenuated by NEM (TGFβ, p = 0.00534; TNFα, p = 0.0427;
IFNγ, p = 0.0028) an inhibitor of exocytosis indicating a role for secreted ATP in the process (Fig. 3k–m). Since
DMAG is an inhibitor of NOS, we probed if ATP secretion could be inhibited by nitric oxide donor like sodium
nitroprusside (SNP). Sodium nitroprusside inhibited DMAG induced ATP secretion (p = 0.00338, 0.0049)
(Fig. 3n) reiterating a potential role for NO in modulating exocytosis. DMAG induced expression of cytokines
(TNFα, p = 0.00035; IFNγ, p = 0.043) also could be inhibited by sodium nitroprusside (TNFα, p = 0.0024; IFNγ,
p = 0.049) (Fig. 3o,p). These results show a role for DMAG in secretion of ATP by vesicular exocytosis and
upregulation of cytokines modulated by NO.
Molecular effects of DMAG and ATP on N9 microglial cells is mediated through P2 receptors
and calcium. To reiterate the role of P2 receptors and P
2X7 in particular, in DMAG induced ATP secretion
and expression of cytokines, we used broad spectrum inhibitors of P2 receptor (PPADS) and a specific inhibitor
of P2X7 receptor (A-43879). All the qPCR experiments were performed in two biological replicates and three
technical replicates. The results are provided as mean ± SEM (Standard error of mean) within brackets. DMAG
induced ATP secretion (p = 0.0035) and upregulation of cytokines (TGFβ, p = 0.043; TNFα, p = 0.048; IFNγ,
p = 0.049) were inhibited by PPADS and P2X7 specific inhibitor (ATP, p = 0.0028, 0.0046; TGFβ, p = 0.0068,
0.033; TNFα, p = 0.0053, 0.0082; IFNγ, p = 0.0061,0.0089) (Fig. 4a–d) which shows an involvement of the P2
receptors. To reiterate the role of ATP mediated purinergic signaling in microglial inflammation, N9 cells were
challenged with 100 µM ATP. ATP induced elevated intracellular calcium (Fig. 4e). Further, gene expression
analysis was carried out in N9 cells treated with either 25 or 100 uM ATP using Quantitative PCR. The results
show a significant change in the gene expression levels of cytokines like TGFβ (p = 0.05, 0.049), TNFα (p = 0.0072,
0.049) and IFNɣ (p = 0.041, 0.044,) (Fig. 4f–h), which could be inhibited by BAPTA, (TGFβ, p = 0.0068, 0.05;
TNFα, p = 0.0083, 0.033; IFNɣ, p = 0.037, 0.05) a chelator of calcium (Fig. 4f–h). We next probed if DMAG
induced secretion of ATP and expression of cytokines are also dependent on intracellular calcium. Consistent
with our ATP data, the DMAG induced secretion of ATP (p = 0.0036) and upregulation of cytokines (TGFβ,
p = 0.042; TNFα, p = 0.0063; IFNγ, p = 0.0072,) was attenuated by BAPTA (TGFβ, p = 0.039; TNFα, p = 0.045;
IFNγ, p = 0.0058) (Fig. 4i–l), showing that elevated level of intracellular calcium is imperative for DMAG medi-
ated effects. These study show a role for DMAG induced secretion of ATP which invoke P2 receptors potentially
resulting in elevated intracellular calcium and cytokine expression.
ATP induces changes in immuno‑metabolism and activate tryptophan metabolism in N9
microglia. Microglial inflammation is associated with metabolic remodeling22,52. To reiterate that metabolic
Scientific Reports | (2021) 11:9766 | https://doi.org/10.1038/s41598-021-89137-z 6
Vol:.(1234567890)www.nature.com/scientificreports/
Figure 3. Showing expression of P2 receptors in N9 microglial cells and DMAG induced ATP secretion and expression of cytokines
as well as effect of NEM and sodium nitroprusside (SNP) showing (a–i) N9 cells treated with DMAG inducing the expression of P2X
receptors and P2Y receptors (a) P2X1 (b) P2X2 (c) P2X4 (d) P2X5 (e) P2X7 (f) P2Y6 (g) P2Y2 (h) P2Y4 (i) P2Y14. Showing N9 cells
treated with DMAG (1 mM) with or without pre-incubation with NEM (1 μM) (j) Secretion of ATP and inhibited by NEM. Showing
upregulation of cytokines and inhibition by NEM (k) TGFβ (l) TNFα (m) IFNɣ. Showing N9 cells treated with DMAG (1 mM) with
or without pre-incubation with SNP (0.5 mM and 1 mM) (n) secretion of ATP and its inhibition by SNP. Showing upregulation of
cytokines and inhibition by SNP (o) TNFα (p) IFNy. The significance was calculated using Student T-test. * for P < 0.05, ** for P < 0.01,
and *** for P < 0.001. For n numbers and the results provided as mean ± SEM, refer to text.
Scientific Reports | (2021) 11:9766 | https://doi.org/10.1038/s41598-021-89137-z 7
Vol.:(0123456789)www.nature.com/scientificreports/
Figure 4. Showing DMAG induced ATP secretion and expression of cytokines as well as their modulation by
P2 receptor inhibitors and calcium chelator, ATP induced calcium response, cytokine expression, modulation
by calcium chelator, (a–d) DMAG treated N9 cells with or without pre-incubation with PPADS (10 μM) or
A-438079 (10 μM) showing (a) treated with DMAG inducing the secretion of ATP which is inhibited by PPADS
or A-438079. (b) TGFβ (c) TNFα (d) IFNɣ. Showing ATP (100 μM) treated N9 cells (e) Elevated intracellular
calcium time in seconds along X-Axis and Intensity (F − F0) which is base line fluorescence subtracted from
observed fluorescence along Y axis. Expression of cytokines by N9 microglial cells treated with ATP (25 μM
or 100 μM) in the presence or absence of BAPTA (50 μM) showing (f) TGFβ (g) TNFα (h) IFNγ. DMAG
(1 mM) treated N9 cells with or without pre-incubation with BAPTA (50 μM), showing (i) secretion of ATP and
inhibition by BAPTA. (j) TGFβ (k) TNFα (l) IFNɣ. The significance was calculated using Student T- test. *for
P < 0.05, ** for P < 0.01, and *** for P < 0.001. For n numbers and the results provided as mean ± SEM, refer to text.
Scientific Reports | (2021) 11:9766 | https://doi.org/10.1038/s41598-021-89137-z 8
Vol:.(1234567890)www.nature.com/scientificreports/
Figure 5. Showing results of targeted metabolomics analysis of cell culture supernatant of N9 cells treated with ATP100μM in
positive and negative mode. Metabolomic analysis of ATP (100 μM) treated N9 cells analyzed in the positive mode showing.
(a) Showing heat map of significant differential metabolites between control sets and ATP (100 µM) treated sets in positive
mode. (b) Unbiased PCA clustering of control (red color) and ATP (100 µM) treated (green color) sets in positive mode as
represented by a score plot. (c) Random Forest analysis. (d) List of pathways to which differential metabolites belong to are
obtained at an FDR of 0.25 in both positive and negative mode and common to both positive and negative. (e) Showing heat
map of significant differential metabolites between control sets and ATP (100 µM) treated sets in negative mode. (f) Unbiased
PCA clustering of control (red color) and ATP (100 µM) treated (green color) sets in negative mode as represented by a score
plot. (g) Random Forest analysis. (h) Overlapping metabolic pathways between POAG and N9 cell culture supernatant. (a–c)
and (e–g) was generated using MetaboAnalyst 5.0 (Version-5.0; URL link: https://www.metaboanalyst.ca/). (h) was created
using VENNY 2.1(Version-2.1; URL link- https://bioinfogp.cnb.csic.es/tools/venny/).
Scientific Reports | (2021) 11:9766 | https://doi.org/10.1038/s41598-021-89137-z 9
Vol.:(0123456789)www.nature.com/scientificreports/
remodeling could be associated with ATP induced inflammation, targeted metabolomic analysis was carried
out on N9 microglial cell culture supernatant. N9 microglial cells were treated with 100 µM ATP for 12 h and
examined for the differential secreted metabolites in conditioned media using targeted approach in the posi-
tive and negative mode as described in methods. Targeted analysis was carried out in the positive mode for 164
metabolites as described in methods of which 111 were identified. Eighty-eight metabolites with a Coefficient
of Variation (CV) less than 20% after normalization with internal standard were used for further analysis. The
heat map of the top 25 metabolites is provided in Fig. 5a. The metabolites include kynurenine, lactic acid etc.
Together, in an unbiased PCA analysis, these metabolites stratified the conditioned media from ATP treated cells
into a separate cluster compared to conditioned media from untreated cells (Supplementary Fig. S4). Unbiased
PCA clustered the samples into two different group as represented by a score plot (Fig. 5b). In addition, a non-
parametric test revealed 22 secreted differential metabolites to be significantly (P < 0.05, FDR = 0.25) different
between the treated and untreated groups (Supplementary Fig. S4). A Random Forest analysis identified phenyl
alanine and kynurenine as the metabolites which distinguished ATP treated sets from control (Fig. 5c). The
metabolites are further binned into 14 metabolic pathways (Fig. 5d), which include tryptophan metabolism,
purine metabolism, pyruvate metabolism etc.
Similarly, targeted analysis was carried out in the negative mode for 91 metabolites as described in methods
of which 58 metabolites were identified. Forty-four metabolites with a CV less than 20% after normalization with
internal standard were used for further analysis. The heat map of the 18 metabolites is provided in Fig. 5e. The
metabolites include glucose-6-phosphate, fructose-6-phosphate, 6-phospho gluconate, succinate, inosine etc.
Unbiased clustering of the data using PCA showed two clusters each of ATP (experimental) and controls (Sup-
plementary Figure S5). Unbiased PCA clustered the samples into two different group as represented by a score
plot (Fig. 5f). In addition, a non-parametric test revealed 20 secreted metabolites to be significantly (P < 0.05,
FDR = 0.25) different between the treated and untreated groups (Supplementary Figure S5). The metabolites
are further binned into 20 metabolic pathways (Fig. 5d). The metabolic pathways include alanine, aspartate and
glutamate metabolism, TCA cycle, glycolysis/gluconeogenesis etc. A Random Forest analysis identified hexose
phosphate, glucose-6-phosphate and glutamine as the metabolites which distinguished ATP treated sets from
control (Fig. 5g). Furthermore, we combined the pathways obtained from positive and negative mode analysis
of microglia supernatant and compared it with the combined metabolomic pathways obtained from our study as
well as those from literature for POAG. A total of 22 pathways overlapped between microglia cell culture super-
natant data and pooled pathways of POAG (Fig. 5h). Similarly, overlapping pathways were also observed with
transcriptomic and proteomic data of POAG (Supplementary Figure S3). The results indicate the importance of
extracellular ATP and hence ATP signaling per se in microglial inflammation and metabolic remodeling, which
might have potential implications for glaucoma.
Our metabolomic analysis shows that metabolites belonging to tryptophan metabolism were elevated in
aqueous humor and ATP treated N9 microglial cell culture supernatant (Figs. 2b and 5d). Since microglia are
cells which are primarily implicated in tryptophan metabolism20, the expression levels of genes IDO-1, IDO-2
and TDO-2 were analyzed. Consistent with in vivo and in vitro metabolomic data, treatment of N9 microglial
cells treated with ATP showed elevated levels of IDO1 (25 µM ATP, p = 0.041), IDO2 (100 µM ATP, p = 0.044)
and TDO2 (25 and 100 µM ATP, p = 0.032 (Fig. 6a–c) which could be inhibited by BAPTA (IDO-1, p = 0.05;
IDO-2, p = 0.032; TDO-2, p = 0.033). Moreover, N9 microglia treated with DMAG upregulated the genes IDO-
1(p = 0.0062, 0.00085, 0.0051), IDO-2 (p = 0.00067, 0.0068) and TDO-2 (p = 0.033, 0.045) belonging to the
tryptophan metabolism (Fig. 6d–j) which could be inhibited by NEM (IDO-1, p = 0.0079; TDO-2, p = 0.048),
SNP (IDO-1, p = 0.0052; IDO-2, p = 0.0069; TDO-2, p = 0.032), BAPTA (IDO-1, p = 0.0084; IDO-2, p = 0.0041)
(Fig. 6d–j). The flux through IDO-1/IDO-2 or TDO-2 is imperative for increased levels of downstream metabo-
lites like Kynurenine, 3-Hydroxykynurenine etc. The results of increased expression of IDO1/2 and TDO-2 is
consistent with the activation of tryptophan metabolism and reiterate a role for DMAG induced secreted ATP
and ATP signaling in the process.
The results show a potential role for DMAG invoked P2 receptor mediated microglial inflammation leading
to metabolic remodeling involving immunometabolism and neurotoxic metabolites of tryptophan metabolism
with potential implications for POAG. The overall mechanism of DMAG mediated effects in N9 microglia with
potential implications for Glaucoma is summarized in (Fig. 6k).
Discussion
In the present study, POAG patients exhibit increased IOP and cup disc ratio and decreased RNFL thickness
which are characteristic of the disease. Elevated level of ATP is associated with our POAG patient cohort as
reported previously38. Elevated levels of ATP is also reported in the vitreous h umor53,54. Activation of P
2X7 by
ATP is shown to elevate intracellular calcium and induce rat retinal ganglion cell death55. ATP is secreted through
the Pannexin c hannel53. However, a significantly higher staining of V-NUT (vesicular nucleotide transporter) also
supports vesicular exocytosis of A TP56. ATP also plays a role in aqueous humor draining and inflammation57.
ATP is shown to activate P2X7 receptors, the expression of which is significantly higher in Glaucoma58. Microglia
in retina is shown to express P2 r eceptors59. Hence high IOP might modulate inflammation in microglial cells
through ATP signaling.
Our study shows elevated levels of TGFβ, TNFα, IFNγ, and IL-17A with POAG. The results comply with
previous reports of elevated TNFα and TGFβ in P OAG39,40. Studies have shown that glaucoma exhibit a Th1
response20. Gene expression analysis from GEO data sets shows changes in cytokine signaling which includes
pathways activated by TGFβ, TNFα and IFNγ. Previous studies has implicated a role for TGFβ in fibrosis
pathway60. In addition, TGFβ also induces ATP secretion in cancer c ells61. A role for TNFα and IFNγ in inflam-
mation and neuronal cell death has been implicated in neurodegenerative diseases62. Anti-TNFα antibody is
Scientific Reports | (2021) 11:9766 | https://doi.org/10.1038/s41598-021-89137-z 10
Vol:.(1234567890)www.nature.com/scientificreports/
Figure 6. ATP and DMAG induced tryptophan pathway gene expression and their modulation by BAPTA,
NEM and SNP respectively. Showing ATP (25 μM or 100 μM) treated N9 cells or those pre-incubated with
BAPTA (50 μM) before treating with ATP showing (a) IDO-1 (b) IDO-2 (c) TDO-2. DMAG (1 mM) treated
N9 cells with or without pre-incubation with NEM (1 μM) (d) IDO-1 (e) TDO-2. DMAG (1 mM) treated N9
cells with or without pre-incubation with SNP (0.5 mM) (f) IDO-1 (g) IDO-2 (h) TDO-2. DMAG (1 mM)
treated N9 cells with or without pre-incubation with BAPTA (50 μM) (i) IDO-1 (j) IDO-2. (k) Showing overall
mechanism. The significance was calculated using Student T-test. *for P < 0.05, ** for P < 0.01, and *** for
P < 0.001. For n numbers and the results provided as mean ± SEM, refer to text. Figure 6 k was created using
Microsoft office Professional Plus 2016 (version-2016).
Scientific Reports | (2021) 11:9766 | https://doi.org/10.1038/s41598-021-89137-z 11
Vol.:(0123456789)www.nature.com/scientificreports/
used as a standard of care treatment in these d iseases63. Hence extracellular ATP and cytokines might elicit an
inflammatory response with implications for POAG.
Metabolomic analysis of aqueous humor in our patient cohort shows deregulation of various pathways with
potential implications for glaucoma. Comparison with previous transcriptomic, proteomic and metabolomic data
shows these deregulated pathways are highly conserved across population35. Reanalysis of –omic data from GEO
data sets and literature shows considerable overlap of pathways with our POAG patient cohort. These pathways
are indicative of immunometabolism changes which is indicative of inflammation. Significantly elevated levels
of ATP, glutamate and 3-Hydroxykynurenine are observed in the aqueous humor of POAG (Figs. 1f, 2c and
Supplementary Fig. S1). These metabolites induce exictotoxicity and cause neuronal and retinal ganglion cell
death64,65. Previous studies have also reported elevated levels of ATP and glutamate in g laucoma38,66. Inhibition
of NMDA receptor or P 2X7 receptors resulted in neuronal protection in mice model of n eurodegeneration67.
Our metabolomic analysis shows deregulated glutathione metabolism which concur with our transcriptomic
analysis and previous reports of compromised antioxidant system in POAG68. Changes in arginine concentrations
is proposed to be attributed to alterations in nitric oxide pathway in glaucoma46,69. Increased levels of metabo-
lites like 3-phosphoglycerate, lactate as well as changes in nucleotide, glutamine and glutamate metabolism are
attributed to immunometabolism70. Methyl glutarate is synthesized during inborn errors of metabolism with
impaired mitochondrial f unction71. Methyl glutarate is also produced as a side reaction from branch chain amino
acid metabolism which is deregulated in POAG71. Increased glucose metabolism as well as osmotic and oxidative
stress is correlated with increased death of retinal ganglion cells in rat model of g laucoma72. The deregulation of
biotin metabolism in our study is previously reported in cataract47.
Studies have conceived a role for NOS in aqueous humor formation and d rainage73. Low activity of NOS is
correlated with high resistance to aqueous humor flow resulting in high IOP while NO donors reduce IOP74. In
this light, the high DMAG levels which is a natural inhibitor of NOS is suggestive of reduced NOS activity with
consequences for aqueous humor draining and high IOP. Transgenic mice overexpressing eNOS in vascular
endothelia and Schlemm’s canal has reduced IOP and increased AH outflow compared to wild type c ontrols75.
Administration of the NO donors lead to a rapid reduction of IOP in normotensive rabbit m odel73. The impor-
tance of NOS function in glaucoma is also reiterated by association of Single Nucleotide Polymorphisms in eNOS
which reduce its function with POAG76. Transcriptomic analysis of GEO data sets also shows changes in NOS
signaling and cGMP-PKG signaling pathway. NOS inhibition is shown to invoke inflammation and upregulate
exocytosis13. Since microglia are the immune cells in CNS and retina, we probed the role of DMAG and Puriner-
gic signaling in microglial inflammation using N9 microglial in vitro cell culture system.
To gain further insights into mechanism of inflammation N9 microglial cells were used. Microglia are immune
cells of the brain and retina which are implicated in g laucoma77. Studies have shown a role for ATP in microglial
inflammation78. Our results show that DMAG an inhibitor of NOS upregulated ATP secretion, which could
be attenuated by NEM an inhibitor of exocytosis or sodium nitroprusside, a nitric oxide donor. Nitric oxide
produced by NOS modifies NSF and inhibit exocytosis and inhibition of NOS upregulate e xocytosis13. DMAG
induced ATP secretion was also inhibited by broad spectrum inhibitor of P2 receptors and a specific inhibitor of
P2X7. Previous studies have shown that the Cathepsin C substrate GPN (glycyl-L-phenylalanine-b-napthylamide)
a lysosmotrophic agent induced ATP secretion and elevated intracellular calcium, which could be inhibited by
NEM and inhibitors by P2 receptor79. The higher staining of V-NUT in glaucomatous tissue might support ATP
secretion by exocytosis56. Consistent with NO donor mediated inhibition of ATP secretion, previous studies
have shown that NO modifies NEM sensitive factor and inhibit exocytosis13. DMAG treatment also modulated
the expression of P2X and P2Y receptors in microglia. Further, DMAG treatment also led to elevated expression
of cytokines like TGFβ, TNFα, and IFNγ which could be inhibited by NEM, broad spectrum inhibitors of P2
receptors and a specific inhibitor of P
2X7 showing a role for secreted ATP and purinergic signaling in the process.
ATP induced elevated intracellular calcium and expression of cytokines in N9 microglial cells. Consistent with
a role for calcium in ATP signaling, ATP invoked expression of cytokines which could be inhibited by BAPTA.
Similarly, DMAG induced ATP secretion and expression of cytokines also could be inhibited by BAPTA. Studies
have shown that microglia when challenged with ATP, glutamate and lactate, which are elevated in our POAG,
secreted inflammatory c ytokines80–82.
Microglial inflammation lead to metabolic r emodeling22,52. Extracellular ATP is an inflammatory mole-
cule which induce metabolic r emodeling82. Consistent with this cell culture supernatant from ATP treated N9
microglia displayed deregulation of metabolic pathways like glycolysis, pentose phosphate pathway, nucleotide
metabolism, tryptophan and glutamine and glutamate metabolism etc. M1 phenotype resulting from activa-
tion of microglia by LPS or IFNγ is associated with aerobic glycolysis and reduce oxidative phosphorylation83.
Consistent with this proteomic and metabolomic data from POAG that were reanalyzed showed upregulation
of immunometabolism. The change towards glycolysis is found to be essential for cytokine s ecretion22. Lactate
was shown to induce secretion of cytokines in microglia22. Similarly, higher ratio of phenylalanine to tyrosine in
ATP treated N9 cells is an indication of i nflammation84. Random Forest analysis shows phenylalanine as one of
the metabolites that distinguish ATP treated sets from control. Data from previous studies on proteomics85 and
metabolomics46 was reanalyzed and showed elevated phenylalanine in POAG patients. The Hydroxyglutaric acid
in microglia cell culture supernatant also indicates a potential activation of NMDA r eceptor86. The metabolic
profile of ATP activated microglia also considerably overlap with the metabolic profile of POAG in the present
study as well as with the data reanalyzed from metabolic studies published e arlier46–48. Taken together, our cell
culture system captures the tenets of immunometabolism associated with POAG and implicate a potential role
for microglia in the process.
Microglia are the cells which are involved in the production of neurotoxic metabolites belonging to the
tryptophan-kynurenine pathway during inflammation with implications for neurodegenerative d iseases22,87.
Consistent with this, our metabolomics data shows elevated levels of kynurenine, anthranilic acid, tryptophan
Scientific Reports | (2021) 11:9766 | https://doi.org/10.1038/s41598-021-89137-z 12
Vol:.(1234567890)www.nature.com/scientificreports/
etc. Random Forest analysis also shows kynurenine as a metabolite that distinguish ATP treated sets from controls
in the positive mode. Elevated levels of 3-Hydroxykynurenine and indole-3-acetate is observed in our POAG
metabolomics data set as well as previously published plasma metabolomics data from POAG r espectively46.
To further corroborate the metabolomic data obtained from N9 microglia treated with ATP, gene expression
analysis of enzymes belonging to tryptophan metabolism was carried out. Both ATP and DMAG treatment of
N9 microglial cells led to upregulation of genes belonging to tryptophan metabolism, which was inhibited by
BAPTA and NEM respectively. In addition, IFNγ which is upregulated in POAG and ATP treated N9 microglia
is a known inducer of IDO1/2 in many cell types88. TNFα is shown to potentiate IFNγ induced IDO1/222. Studies
have shown that in many ophthalmic diseases like diabetic retinopathy and age related macular degeneration, the
metabolites belonging to tryptophan metabolism were e levated83. Metabolites belonging to kynurenine pathway
induce neuronal cell death through NMDA r eceptor89. Taken together, our in vitro studies with N9 cells suggest
a role for DMAG mediated modulation of purinergic signaling in the upregulation of inflammatory cytokines,
metabolic remodeling and genes belonging to tryptophan metabolism as a potential pathogenic mechanism in
POAG.
Thus, our results show an association of elevated DMAG, ATP, cytokines, metabolic remodeling involving
immuno- metabolism, elevated levels of glutamate and neurotoxic metabolites belonging to tryptophan metabo-
lism and a potential role for microglial inflammation with POAG. Our findings not only add to the knowledge
of pathophysiology of POAG but also provide specific clues towards developing novel therapeutic targets for
the management of POAG.
Conclusions
Our patient cohort displays elevated IOP, CDR and reduced RNFL thickness which are characteristic of POAG.
ATP levels were elevated in the aqueous humor, while cytokines were found to be elevated in patient plasma.
Metabolomic analysis of aqueous humor shows deregulation of nucleotide metabolism, tryptophan metabolism
and elevated levels of DMAG and glutamate. DMAG induced secretion of ATP, invoked purinergic signaling
and upregulated cytokines in N9 microglia in vitro which could be inhibited by NEM, NO donors, BAPTA and
P2 receptor inhibitors. ATP invoked elevated intracellular calcium and upregulation of cytokine expression
which could be attenuated by BAPTA. ATP treatment of N9 microglia induced metabolic remodeling involving
immunometabolism and neurotoxic metabolites belonging to tryptophan metabolism in cell culture supernatant.
DMAG or ATP treatment of N9 microglia induced expression of genes belonging to tryptophan metabolism
could be attenuated by NEM and BAPTA. To our knowledge this might be the first comprehensive analysis of the
association of elevated DMAG, ATP, cytokine, metabolic remodeling and activation of tryptophan metabolism
with POAG. Mechanistically, our work for the first time shows a potential role for DMAG invoked purinergic
signaling induced expression of cytokines and metabolic remodeling involving neurotoxic metabolites from
tryptophan metabolism in microglia with potential implications for the disease process.
Methods
The present study was conducted in Ophthalmology department at Sri Sathya Sai Institute of Higher Medical
Sciences (SSSIHMS), Puttaparthi, India, on prospective patients comprising of 5 healthy controls, 6 cataracts
and 6 POAG patients. In addition, retrospective data was collected from the hospital database which comprise
of 19 controls and 14 POAG patients during the period 2014–2019. The retrospective data was used only for the
comparing clinical parameters like IOP, Cup Disc Ratio and RNFL thickness. For all the studies, “Institutional
Review Board (IRB)/Ethics Committee approval was obtained” and informed consent from healthy controls
and patients were obtained. The informed consent was obtained to publish the OCT images in an online open
access publication. The study was approved by the Sri Sathya Sai Institute of Higher Learning “Institutional Eth-
ics Committee (Registration No: ECR/616/Inst/AP/2014/RR-17). The research work adhered to the tenets of
the Declaration of Helsinki. Controls were age and gender matched. The following criteria were used to select
patient specimens in the study.
Inclusion criteria. Patients with POAG are determined clinically. Patients with POAG were diagnosed with
slit lamp findings. The anterior segment of eye and an elevated IOP of > 21 mm of Hg at minimum 2 separate
readings, with typical optic disc findings of glaucoma (focal notching of disc, deepening of cup, thinning of
neuro-retinal rim, laminar dot sign, overpass cupping, saucerization of cup, asymmetrical cupping in 2 eyes of
more than 0.2).
Patients who do not have clinical evidence of glaucoma and who underwent elective cataract surgery were
included in the control group. In addition, patients who come for yearly check up to ophthalmology department
are taken as healthy controls.
Exclusion criteria. Patients with increased IOP > 21 mmHg in the eye to be operated or if the patient was
diagnosed to have exfoliation syndrome or exfoliation glaucoma or Angle Closure Glaucoma (PACG). Patients
with any history of surgery or trauma in the eye were excluded. Patients with active inflammatory eye disease
or disease with systemic inflammation, residual recurrent or active ocular surface disease were also excluded.
Study procedure. A detailed general and systemic history of the patient was obtained. Clinical Parameters
which were assessed included best–corrected visual acuity by projection chart (TOPCON Corporation, Tokyo,
Japan Auto Chart Projector model—ACP7E) mounted on TOPCON refraction console. Visual acuity (VA) was
determined in Snellens denomination for both distance and near sight. Anterior segment features were evalu-
ated by Slit lamp examination using a Slit lamp (BQ900 HAGG-STREIT International, Bern, Switzerland) and
Scientific Reports | (2021) 11:9766 | https://doi.org/10.1038/s41598-021-89137-z 13
Vol.:(0123456789)www.nature.com/scientificreports/
IOP was measured using Goldmann Applanation tonometer (AT 900). Gonioscopy was performed in all the
patients using 4 mirror goniolens (G4 VOLK Inc OH, US, LENS) and graded on the basis of Shaffer’s grading
system. Fundus (optic disc and macula) was examined with 20D and 78D lenses, and periphery was examined
with scleral depressor. The patients underwent retinal nerve fiber-layer (RNFL) thickness estimation using OCT
(Optical Coherence Tomography) (Spectral OCT SLO, OPKO Health Inc. Hialeah, FL, US). All the patients
including POAG underwent a planned cataract surgery. A fasting blood sample was taken from the patient just
prior to the surgery. 5 ml each of serum and plasma was collected as a part of standard of care treatment. Dur-
ing surgery, after cleaning and draping the eye, a parenthesis was performed with a 26 G needle on tuberculin
syringe. Approximately 0.5–0.75 ml of aqueous humor was removed and flash frozen and stored in − 80 °C until
further analysis.
Slit lamp examination. Intra ocular pressure was measured using a Applanation Tonometry which is con-
sidered to be one of the most preferred methods using a Goldmann Applanation Tonometre (GAT) used on Slit
lamps. IOP was measured using GAT after staining the cornea with a fluorescein stain. Specifically, the cornea
was anesthetized with a topical preparation and the tear film was stained with sodium fluorescein. For correla-
tion analysis of IOP with C/D ratio and RNFL thickness, both prospective and retrospective data were used.
Optical coherence tomography (OCT). OCT (Spectral/SLO; OPKO, USA) with RFNL of control and
POAG was carried out to aid in diagnosis and average thickness was recorded. OCT was used as a diagnostic
tool that provides high-resolution, cross- sectional imaging of ocular tissues in vivo. It has been of a great value
in measuring retinal and macula thickness and is also used to study and monitor various eye diseases.
ATP measurements. ATP concentration of the samples (aqueous humor and cell culture supernatant)
were determined by the luciferin-luciferase reaction (Thermo Fisher Scientific Cat. No. 822066). In brief, 90 µl of
standard reaction solution and 10 µl of double distilled water was taken and the background luminescence was
measured. The reaction was started by adding 10 µl of diluted ATP standard solution and 90 µl of standard reac-
tion solution. Low concentration of ATP standard solutions was prepared by diluting the 5 mM ATP stock solu-
tion in double distilled water. ATP concentrations ranging from 1 nM to 1 µM were prepared. The luminescence
was measured using a Luminometer (Berthold). The background luminescence was subtracted and a standard
curve was generated for a series of standard ATP concentration. Substituting ATP-containing samples for the
ATP standard solutions, the amount of ATP in the experimental samples (10 µl) were calculated from the stand-
ard curve using manufacturers instruction. For correlation of IOP with ATP, only prospective data was used.
Enzyme linked immunosorbent assay (ELISA). Blood samples were drawn from healthy controls
and patients after obtaining informed consent. Plasma samples from healthy control and POAG were frozen at
− 80 °C until assay was done. Commercial ELISA kits (Thermo Fisher Scientific) of TGFβ (Cat. No. CHC 1683),
TNFα (Cat. No. CHC 1753), IFNy (Cat. No. CHC 1233) and IL-10 (Cat No. 1323) were used in the study as per
manufacturer’s instructions. Commercial ELISA kit (Pepro Tech Cat. No. 900-M84) was used for estimating
IL-17A. Dilutions of antibodies were carried out as per manufacturers instruction unless otherwise specified.
Briefly, 96 well micro-titer plates (Nunc MaxiSorp Flat bottom, Cat No. 442404) were coated with capture anti-
body and incubated overnight at 4 °C. Following this, the plate was first washed with wash buffer and blocked
with assay buffer for 1 h at room temperature. Standards and sample dilutions were prepared using the assay
buffer and pipetted into designated wells. Detection antibody was added immediately into the standards and
sample wells and incubated for 2 h at room temperature with continual shaking (700 rpm). After thorough wash-
ing, streptavidin-HRP was added and incubated for 30 min at room temperature with continual shaking. Finally,
TMB (3,3′,5,5′-Tetramethylbenzidine) substrate provided by the manufacturer in the respective kits was added
into each well and incubated for 30 min at room temperature with continual shaking. Absorbance at 450 nm
(reference absorbance 650 nm) was obtained within 30 min of adding the stop solution and the results were
calculated using a log–log or 4-parameter curve fit.
Gene Expression Omnibus (GEO) datasets and data preprocessing. Two genome wide expression
datasets of accession GSE27276 and GSE4316 were obtained from Gene Expression Omnibus (GEO) repository
of NCBI. The dataset GSE27276 was an expression profiling by array which compared genome wide expression
in the trabecular meshwork tissues of 15 POAG patients with that of 13 controls using Sentrix Human-6 Expres-
sion BeadChip platform. The dataset GSE4316 was an expression profiling by array which compared genome
wide expression in the trabecular meshwork tissues of 2 POAG patients with that of 3 controls using Affymetrix
Human Genome U133 Plus 2.0 Array platform.
The GEO2R tool was used to perform differential expression analyses and statistical tests. The GEO2R tool
uses GEOquery R package to parse GEO data into R data structures and the limma (Linear Models for Microar-
ray Analysis) R package to carry out statistical tests for identifying differentially expressed genes. Significant
differentially expressed genes were filtered based on adjusted P. Value ≤ 0.05 which is adjusted based on the
Benjamini and Hochberg false discovery rate method. For dataset GSE27276, significant differentially expressed
genes were filtered using P. Value ≤ 0.05 and having at least twofold change expression, since filtering using the
adjusted P. Value gave very few entries which would not fit into the criteria to perform downstream pathway
enrichment analyses.
Scientific Reports | (2021) 11:9766 | https://doi.org/10.1038/s41598-021-89137-z 14
Vol:.(1234567890)You can also read