Tracing Hardware Monitors in the GR712RC Multicore Platform: Challenges and Lessons Learnt from a Space Case Study - Schloss ...
←
→
Page content transcription
If your browser does not render page correctly, please read the page content below
Tracing Hardware Monitors in the GR712RC
Multicore Platform: Challenges and Lessons
Learnt from a Space Case Study
Xavier Palomo                                          Mikel Fernandez
Barcelona Supercomputing Center, Spain                 Barcelona Supercomputing Center, Spain
xavier.palomo@bsc.es                                   mikel.fernandez@bsc.es

Sylvain Girbal                                         Enrico Mezzetti
Thales Research, Palaiseau, France                     Barcelona Supercomputing Center, Spain
sylvain.girbal@thalesgroup.com                         enrico.mezzetti@bsc.es

Jaume Abella                                           Francisco J. Cazorla
Barcelona Supercomputing Center, Spain                 Barcelona Supercomputing Center, Spain
jaume.abella@bsc.es                                    francisco.cazorla@bsc.es

Laurent Rioux
Thales Research, Palaiseau, France
laurent.rioux@thalesgroup.com

      Abstract
The demand for increased computing performance is driving industry in critical-embedded systems
(CES) domains, e.g. space, towards the use of multicores processors. Multicores, however, pose
several challenges that must be addressed before their safe adoption in critical embedded domains.
One of the prominent challenges is software timing analysis, a fundamental step in the verification
and validation process. Monitoring and profiling solutions, traditionally used for debugging and
optimization, are increasingly exploited for software timing in multicores. In particular, hardware
event monitors related to requests to shared hardware resources are building block to assess and
restraining multicore interference. Modern timing analysis techniques build on event monitors to
track and control the contention tasks can generate each other in a multicore platform. In this
paper we look into the hardware profiling problem from an industrial perspective and address
both methodological and practical problems when monitoring a multicore application. We assess
pros and cons of several profiling and tracing solutions, showing that several aspects need to be
taken into account while considering the appropriate mechanism to collect and extract the profiling
information from a multicore COTS platform. We address the profiling problem on a representative
COTS platform for the aerospace domain to find that the availability of directly-accessible hardware
counters is not a given, and it may be necessary to the develop specific tools that capture the
needs of both the user’s and the timing analysis technique requirements. We report challenges in
developing an event monitor tracing tool that works for bare-metal and RTEMS configurations and
show the accuracy of the developed tool-set in profiling a real aerospace application. We also show
how the profiling tools can be exploited, together with handcrafted benchmarks, to characterize the
application behavior in terms of multicore timing interference.

2012 ACM Subject Classification Computer systems organization → Multicore architectures

Keywords and phrases Multicore Contention, Timing interference, Hardware Event Counters, PMC

Digital Object Identifier 10.4230/LIPIcs.ECRTS.2020.15

Funding This work has been partially supported by a collaboration agreement between Thales
Research and the Barcelona Supercomputing Center, and the European Research Council (ERC)
under the EU’s Horizon 2020 research and innovation programme (grant agreement No. 772773).
MINECO partially supported Jaume Abella under Ramon y Cajal postdoctoral fellowship (RYC-
2013-14717).
           © Xavier Palomo, Mikel Fernandez, Sylvain Girbal, Enrico Mezzetti, Jaume Abella, Francisco J.
           Cazorla, and Laurent Rioux;
           licensed under Creative Commons License CC-BY
32nd Euromicro Conference on Real-Time Systems (ECRTS 2020).
Editor: Marcus Völp; Article No. 15; pp. 15:1–15:25
                  Leibniz International Proceedings in Informatics
                  Schloss Dagstuhl – Leibniz-Zentrum für Informatik, Dagstuhl Publishing, Germany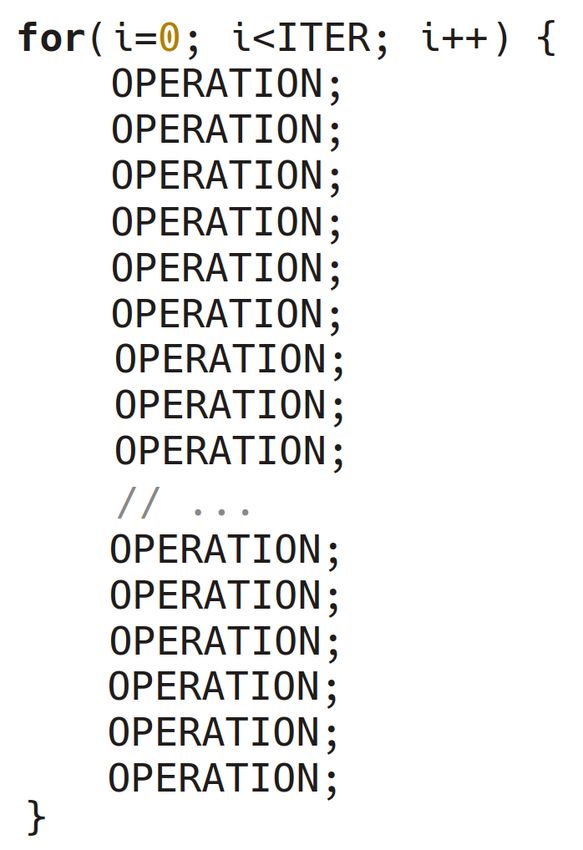
15:2   Tracing Hardware Monitors in the GR712RC Multicore Platform

        1     Introduction

       In the critical embedded systems (CES) industry domain, applications are usually charac-
       terized by stringent real-time constraints, making time predictability a major concern with
       regards to the regulation / certification standards [28, 29, 40, 16]. In this view, the ability to
       monitor the behavior of the software functionalities is fundamental to promptly intercept both
       functional and timing misbehaviors, and provide controlled degraded service in case of failures.
       The shift from single-core COTS (component off-the-shelf) to multicore COTS is appealing
       for the industry, as it fits with the exponential growth in terms of performance requirements
       while providing an excellent compromise in terms of size, weight and power (SWaP) [4].
       Indeed, this transition is already happening and multicore-based platforms are slowly but
       inescapably becoming the de-facto computing solution for supporting such functionalities, and
       aerospace is not an exception [15, 49]. On the downside, however, multicore COTS hardware
       shared resources complicate software timing analysis and validation, a mandatory step in
       critical embedded systems development. Industry is facing a trade-off between performance
       and predictability [31, 35]. Classical analysis and modeling tools [50, 39, 26] relying only on
       timing analysis are not currently able to provide an efficient solution for the computation of
       the Worst Case Execution Time (WCET) for multi-core systems [51, 42]. The main challenges
       posed by multicore COTS analysis arise from the side effects of parallel execution. Multicore
       architectures provide more performance by allowing the concurrent execution of several
       threads. However, these threads are competing to use the shared hardware resources of the
       processor architecture, causing potential conflicts between concurrent accesses to the same
       hardware component. At hardware level, these conflicting accesses are arbitrated, introducing
       inter-thread jitters defined as multicore timing interference [24]. The maximum impact of
       timing interference on the execution time of real-time applications has been quantified to
       be quite large in several studies [6, 36], with an order of magnitude of 20x compared to a
       single-core execution for several 8-core architectures. The problem of multicore interference
       has been explicitly addressed by safety-critical industry standards, which already defined
       ad-hoc verification requirements for the adoption of multi-core processors, forcing us to clearly
       identify all interference channels [17], to either ensure robust partitioning (guaranteeing both
       space and time isolation between applications), or to upper bound the timing interference.
           Modern contention-aware solutions for multicore timing analysis, exemplified by [37, 23],
       track and control hardware event counters. The overall timing analysis framework usually
       builds on the (contention-free) time in isolation of the task under analysis, τa , referred
       to as Caisol and a bound to the delay that τa can suffer ∆cont  a   , to derive the worst-case
       execution time in multicore Camuc . The term ∆cont  a    is typically computed by exploiting
       the number of requests each task τx performs to each shared hardware resource and the
       worst-case contention delay each request can suffer (Lmax ). Both pieces of information are
       empirically derived via event monitors. Each technique proposes a different trade-off in
       terms of performance and time predictability by enforcing, for example, usage quotas. Most
       approaches require the ability to monitor accesses to the shared hardware resources. It follows
       that monitoring the hardware behavior such as accesses to the hardware components has
       therefore become instrumental to multicore timing analysis, far beyond their initial intended
       usage for debugging and regular timing monitoring purposes [34].
           The identification of the most adequate tracing solution depends on several factors
       including the multicore timing analysis approach used, verification requirements from safety
       standards, induced costs, as well as the features provided by existing event counters and
       tracing solution. We provide three illustrative examples. First, mainstream processors
X. Palomo et al. 15:3
from the consumer electronic market provide powerful statistic units, also referred to as
performance monitoring units or PMUs. However, this is not always the case for processors
commonly used in the embedded domain due to cost-reduction reasons. To make things
more complex for the end user, powerful (and expensive) tracing solutions 1 carry specialized
(debug) cables and hardware modules, which are not trivial to use by software developers.
Second, for some particular hardware events, PMUs may not provide a specific counter. For
instance, authors in [11] highlight the lack of dedicated counters for loads and stores misses
in the last level (L2) cache in a LEON4-based multicore processor. As these counters are
considered necessary for timing characterization, authors resort to derive upper bounds to
their values by conservatively combining information from other event counters. Arguably,
tracing analysis can help identifying loads and stores causing dirty misses, helping to tight
contention bounds. As a third example, PMUs are rarely able to capture on-chip controller
(e.g. DMA) access counts. This is reported in [21] where access counts to the different on-chip
memories (pflash, dflash, and lmu) in an Infineon AURIX TC27x are indirectly derived
by parsing the address accessed by each load/store operation. Overall, how to obtain the
necessary event counter information in an embedded processor, is a real industrial concern,
and a fundamental enabler for the adoption of multicore processors for industrial products.
As part of a collaborative effort between a technology provider research center and an
aerospace industry, we have been exploring the problem of extracting event monitoring
information for the analysis of an aerospace application touching both methodological and
practical aspects. In this paper we report on our experience along several aspects:
First, we analyze the trade-offs of different tracing solutions with emphasis on adapting
to the specific requirements of the end user. We present this trade-off as a taxonomy in this
work with the goal that it helps researchers and practitioners in the future in the selection of
a tracing solution that better fits their needs.
Second, we enter into more practical aspects and address the challenge of profiling access
counts to the different shared resources in the GR712RC multicore processor [46], deployed
in space systems, whose implementation provides no event monitoring. We show how we
successfully exploited the debug support unit to obtain the necessary information on which to
build a multicore timing analysis solution. We discuss the main limitations of our approach
and show their impact on timing analysis accuracy. We show that our approach successfully
identifies the number of instruction and data cache misses, their type (load or store, line fills),
and their target (on-chip SRAM, off-chip SRAM, SDRAM, I/Os), providing information
akin to performance monitoring counters. We also provide evidence that our approach can
be deployed equally to bare-metal (BM) (i.e. no operating system) and RTOS-based systems
by showing that we obtain consistent results on BM and RTEMS, as a reference RTOS in
the space domain.
Finally, we assess the applicability our profiling solution on a real space application for
characterization and timing analysis of representative software functions of the space domain.
The rest of this paper is organized as follows. Section 2 presents our analysis and
taxonomy of tracing solutions. Section 3 describes our tracing solution for the GR712RC
which is subsequently evaluated in Section 4. The last two sections of this work present the
related works and the main take away messages in Section 5 and Section 6, respectively.
1
These solutions are usually referred to as development and debug solutions.
ECRTS 202015:4 Tracing Hardware Monitors in the GR712RC Multicore Platform
2 Profiling support for timing analysis
Multicore embedded platforms currently assessed for CES increasingly inherit a score of
performance-improving features from the high-performance domain that usually exhibit
a low degree of time predictability for being tightly modeled by static timing analysis
approaches [51, 42]. More pragmatic approaches based on (or augmented with) on-target
measurements are increasingly considered by embedded stakeholders for characterizing the
timing behavior of critical applications. While static timing analysis derives mathematically
provable bounds from an abstract model of the hardware and structural representation of
the target application, measurement-based approaches and their hybrid variants aim at
collecting empirical evidence from the execution on the real target, under the claim that
there is no more accurate model than the hardware itself [52]. From an industrial perspective,
measurement-based approaches are appealing given their similarities with the consolidated
practice of functional verification. It is in fact at the verification and validation phases that
the timing dimension is typically addressed and early figures from the design phases are
assessed against actual observations.
In practice, however, the effectiveness of each approach depends on the characteristics of
the system under analysis, with static analyses more equipped to deal with simpler, more
predictable scenarios. As the increase in complexity of multicore hardware and advanced
software functionalities is jeopardizing the applicability and effectiveness of conventional tim-
ing analysis approaches [51, 42, 1], it is becoming evident that novel forms of timing analysis
are required that capture the peculiarities of multicore execution [34]. In particular, relevant
aspects in multicore execution, such as utilization of shared resources and entailed contention
delay need to be explicitly captured to meet emerging certification and qualification require-
ments (e.g., interference channels characterization [17] and freedom from interference [29]).
Measurements appear to be the most practical way to meet this requirements and being
able to gather timing evidence from actual execution is a fundamental prerequisite for any
approach based on measurements [14, 13, 34, 30].
Monitoring and profiling solutions are becoming fundamental aspects in the timing
verification. While several profiling and monitoring solutions exist, they have been designed
and deployed for software/hardware debugging and (average) performance optimization
purposes, and are not particularly tailored to timing analysis. In the following we cover some
of the key trade-offs when considering different tracing solutions, with particular focus on
the specific end user requirements.
2.1 Selecting the Profiling Solution for Timing Analysis
For timing analysis, profiling solutions usually build on the extraction of relevant information
whilst the analyzed program executes. Here, the relevant information consists in all hardware
events with bearing on the timing behavior. Modern COTS hardware platforms provide a
more or less complex Performance Monitoring Unit (PMU) that allows accessing a set of
hardware event counters via a set of Performance Monitoring Counters (PMC), which can be
configured to track specific hardware events. Typical hardware events will be incremented
either every time they occur (e.g., a cache miss) or track the number of cycles they affect
(e.g., stall cycles). It is worth noting that monitoring support has been typically designed
and implemented to support the low-level debugging of hardware components or high-level
performance optimization, with completely different objectives than timing analysis.
While several profiling solutions exist, there is no consolidated solution for supporting
multicore timing analysis as there is no unique set of timing analysis requirements. An
industrial user should select the profiling solution (and look for the profiling support) thatX. Palomo et al. 15:5
Figure 1 Measurement process breakdown.
better matches the particular qualification and certification requirements. In the following,
we discuss relevant aspects that should guide the selection of the profiling approach.
2.1.1 Steps in the measurement process
The smaller unit of timing measurements is an observation item (oItem) that usually consists
in the value of (a set of) event counters at a specific point in time. Based on our experience,
we provide in Figure 1 a high-level view of a reference measurement framework. It comprises
three main steps:
(1) Generation of observation items. This steps generates a snapshot of a given set of
event counters (usually consisting in a time stamp and a set of events) and stores it in a
dedicated location in the memory space. Approaches can be classified according to the
mechanism used for triggering the generation of oItems, which is normally implemented
by marking specific points in the program, also termed instrumentation points: we
distinguish between software and hardware instrumentation. Further, the location used
to store oItems can vary from a shared memory area to a dedicated on-chip device. The
specific oItem generation approach is greatly affecting the measurement framework in
terms of intrusiveness and required hardware support [20, 2].
(2) Collection of observation items. The next module or step is responsible for gathering
the stream of collected oItems in order to enable the successive processing and analysis
step. Exporting the observations out of the on-chip storing location is a delicate aspect
in the process from the intrusiveness standpoint. It can be done either through in-band
or out-of-band solutions [34]. The former category identifies those approaches where
oItems are collected using the same hardware interconnect used by the application
and standard debugger support. The latter solutions, instead, exploit dedicated trace
collection mechanisms. One critical aspect in the collection step is that the amount of
oItems to be collected can become pretty large, depending on the scope of the analysis: in
this case, in-band solutions may become too resource-consuming to the point of resulting
unusable. On the other hand, however, out-of-band approaches are only possible when
the necessary hardware support is available [20, 33].
(3) Processing of observation items. When it comes to processing the set of oItems,
we need to distinguish between on-line and off-line approaches. On-line approaches [13]
are capable of processing the profiling information as soon as it is collected out from the
target hardware, while the off-line alternatives can only process the collected data in a
single block. The relevant difference between the two approaches is again relative to the
scope and size of the analysis: off-line approaches require storing larger amounts of data
ECRTS 202015:6 Tracing Hardware Monitors in the GR712RC Multicore Platform
but limit the interference in collecting the oItem (as it only happens at the end of the
experiment). On-line approaches limit the amount of data to be stored but may increase
the interference if a dedicated out-of-band tracing solution is not available.
2.1.2 Characterization of a Profiling Approach
In the following we identify and discuss some of the relevant aspects to be considered in the
selection of a profiling solution.
Intrusiveness of instrumentation. From the analysis process standpoint, it is fundamental
that observations are collected over a system without introducing considerable distortion
in the system behavior itself. The probe effect is a well-known potential pitfall of any
experimental process. While in principle less intrusive approaches are to be preferred, the
actual probing configuration may depend on the hardware and tool support for a specific
target. Intrusiveness is largely affected by the instrumentation approach, which can be
either software or hardware. Software instrumentation [43] guarantees easy integration with
any target and development tool-chain with almost effortless application to any analysis
scenario. The main requirement with software instrumentation is that the instrumentation
code needs to be extremely lightweight in order not to overly affect the system behavior [10].
Software instrumentation frameworks offer the easiest approach for obtaining low-level,
lightweight access to memory-mapped hardware monitoring counters. The interface to the
memory mapped registers should guarantee minimum overhead and reuse across different
configurations [22]. While standardized profiling API support is available for mainstream
and high-performance targets [32, 7], no mature standard exists for embedded targets.
Hardware instrumentation, while it requires specific debug support [20, 2] through advanced
Debug Support Units (DSUs), it enable zero-intrusiveness oItem collection [13]. DSUs are
increasingly present in target platforms in the embedded domain. On the downside, despite
some standardization efforts [20, 2], the instrumentation framework needs to be adapted to
the specific target and debug device.
Intrusiveness of data collection. Also the approach for storing the collected oItems, and
the data collection mechanism itself, are relevant when determining the intrusiveness of the
profiling approach. In-band profiling, which is typically exploited by software instrumentation
frameworks and relies on local memories to store oItems, offers a straightforward solution
guaranteeing easy integration. However, they are prone to generating non-negligible interfer-
ence on the platform behavior, especially with fine-grained instrumentation. Out-of-band
solutions, instead, are the mandatory approach when performance counters are not memory
mapped or are made inaccessible to the user. These solutions are typically exploited by
advanced debugging devices and tools to provide non-intrusive profiling solutions. Further,
out-of-band solutions allow for larger amount of data to be collected without incurring the
risk of affecting the system under analysis. Hardware solutions, however, are typically specific
to a (family of) targets and, thus, support only limited reuse.
Scope of the Timinig Analysis. The effectiveness of a profiling solution also depends on
the scope of the analysis itself. Different dimensions need to be considered: instrumentation
granularity, type of collected information, execution model.
With respect to the instrumentation profile, conventional measurement-based analysis
typically build on end to end measurements taken at task/partition level. Finer-grained
analyses are considered for example by hybrid analysis approaches [30, 43] to be able toX. Palomo et al. 15:7
correlate measurements over small code blocks with the structural information of the program
under analysis. The scope of the analysis affects the frequency at which oItems are produced,
which in turn can increase the intrusiveness of the profiling mechanism. For multicores, the
profiling solution may need to profile the execution of multiple cores at the same time, which
can exacerbate intrusiveness issues and complicate oItem generation and collection. The
alternative solution consists in building on oItems extracted from execution in isolation and
analytically defining conservative assumptions (e.g., on overlapping of contender requests) to
enforce worst-case interference scenarios [8, 27, 12].
Regarding the type and amount of information to collect at each instrumentation point,
conventional measurement-based timing analysis approaches typically require to associate a
unique point in the program to a timestamp. More advanced approaches, as those advocated
for multicore systems [34], may require to collect extensive information from the performance
monitoring unit. Again, this may affect both the intrusiveness of the approach and the
measurement process as not all events can be tracked at the same time, owing to the limited
number of performance counters available.
Profiling is typically done at the level of single event counts, which means that oItems
store information on how many events (or cycles related to an event) happened in the
observation period. In fact, and especially in multicore, some events are not necessarily
independent and simple event counts may not carry sufficient information. For example, the
latency of a bus access can be affected by recent events, e.g. previous accesses to the bus
performed in a short interval. In these cases, event counts are not sufficient for a precise
profiling because counters provide a measure of the event in the observation period, but
fail to provide any information about how the event distributes over time. In these cases,
full traces are required, with notable effects on the amount of data to be collected and
processed. Large amounts of data are not easily handled with in-band solutions and can
be also challenging the processing capabilities of in-line processing approaches [13]. In fact,
in-band approaches that cannot guarantee low intrusiveness simultaneously collecting events
and timing information can penalize the accuracy of the latter as they factor in the cost of
profiling.
Hardware support. The hardware support for run-time monitoring available in a specific
target is instrumental for the selection of the profiling approach. Since debug support is not
the primary driver of the platform selection process, the selection of the profiling solution is
sometimes not a choice. Available solutions can range from fully integrated on-chip solutions
to more complex off-chip solutions based on external devices.
Fully integrated on-chip solutions represent the baseline approach to support hardware
profiling. A specialized debugger, normally developed by the same hardware manufacturer,
is executed in the host platform which is in turn connected to the target through a generic
communication port (e.g., JTAG, GPIO, Eth). This probably represents the cheapest and
less demanding approach for profiling. This scenario can support hardware instrumentation
but can only implement in-band tracing: the oItems are stored in the on-chip memory,
typically in a circular buffer, while a daemon running in the host is responsible for moving
the oItems to the host memory space for off-line processing. On-line processing, although in
principle supported, is discouraged by the reduced bandwidth guaranteed by the in-band
solutions. Specialized external hardware can also be deployed to extract the oItems [33].
On the other side of the spectrum, specialized external hardware support is available
that delivers tracing capabilities with the combination of an external debugging device,
which is connected to the target via a generic or target-specific probe and high-bandwidth
ECRTS 202015:8 Tracing Hardware Monitors in the GR712RC Multicore Platform
protocols (e.g., AURORA). The host machine is then connected to the debugging device
to configure the profiling process and select the oItems. While relatively more expensive,
specialized hardware debug support allows to take advantage of out-of-band tracing support.
Commercially available debugging devices (e.g., Lauterbach) normally allow some type of
reuse across a family of targets by changing only the terminal probe. Specialized out-of-band
capabilities and debug hardware support represent the best configuration for zero-intrusiveness
profiling solution [13]. From the timing perspective, it is also worth mentioning that specific
hardware support is also determining the resolution for timing measurements as available
implementations may support different frequencies in the clock used to get the timestamp,
which is not always the same as the one exhibited by cycle clock frequency. Throughout
all the experiments performed, the GR712RC board was operating with its default clock
frequency of 80MHz.
Safety-Related Requirements. Profiling solutions may also hit safety certification aspects.
Within software instrumentation approaches, the instrumentation code (usually a light-weight
macro) needs to be carefully considered from the software certification standpoint. The
instrumentation code may need to remain in the final software configuration as the analysis
results are valid for the instrumented program, but some certification requirements may
be against leaving deactivated or not strictly functional code in the target program. The
approach to follow depends on the specific industrial domain and certification standard [10].
Other industrial Requirements. The selection of the hardware profiling approach can be
steered by more practical concerns. These includes purely technical aspects such as integration
with a specific host OS or the software development tools and processes. The principal
criterion from the industrial standpoint is the cost/benefit ratio: the profiling framework
is assessed with respect to the cost of the solution itself and the induced cost (training,
use, etc.). It stands to reason that the optimal solution depends on the actual profiling
requirements and on the available support on the target platform. Further, in a longer
perspective, portability of the profiling solution is also a major industrial concern: having
to rethink and redeploy consolidated, profiling tools and practices because of a shift in the
family of processors or RTOS is simply unaffordable.
3 Profiling a Space Application on the GR712RC
In this section, we present the target hardware platform and the requirements coming from
the multicore timing analysis approach we use, and then introduce our profiling solution to
cover them building on the support in the underlying board.
3.1 Target platform
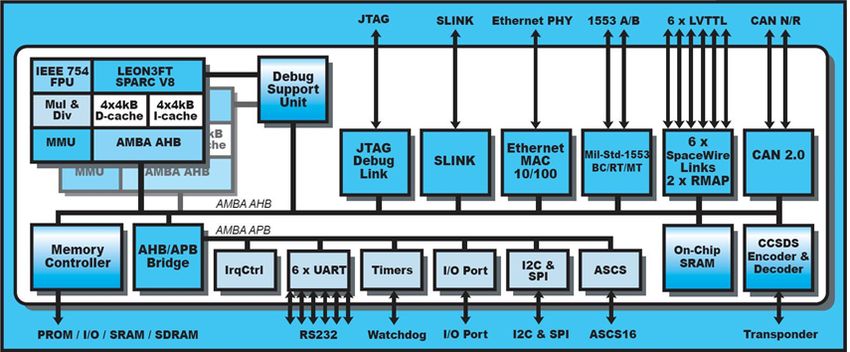
The GR712RC board by Cobham Gaisler is a common choice for space missions [9] and it
is the target of our space case study. The GR712RC is a radiation-hard-by-design board
intended for aerospace applications. It integrates a dual-core LEON3 processor (see Figure 2),
which is connected to the rest of the on-chip devices via a high-bandwidth AMBA AHB Bus.
Other components such as the UART are first connected to a low-bandwidth AMBA APB
Bus that is a master to the AMB AHB Bus.
Each core has its private instruction and data caches, with the rest of the processor
resources, such as memories and peripherals, shared between both cores. For our study, we
are particularly interested in capturing accesses to the on-chip SRAM, the off-chip SRAMX. Palomo et al. 15:9
Figure 2 Block Diagram of the GR712RC [46].
and SDRAM, and the UART, as they are the resources used by the case study application.
We target at deriving contention bounds by tracking read/write operations to these resources.
Unlike other similar systems-on-chips (SoC), the GR712RC lacks a PMU, which is in
charge of collecting processor usage statistics, e.g. related to the memory accesses performed
and instruction types executed by the core. The decision of not adding a PMU is a design
choice of the hardware manufacturer and can be related to area or cost constraints. The
GR712RC comes equipped with a DSU that can be accessed connecting the GR712RC board
to a host using a JTag cable. We used GRMON [47], a debug tool provided by Cobham
Gaisler, to connect a host computer to the DSU and issue debug commands to it, such as to
extract data from the ITB and the BTB. The processor must be stopped before the traces
can be extracted. We use breakpoints and step-by-step execution to stop the processor and
issue debug commands, including trace extraction.
3.2 Profiling Requirements
We aim at using our profiling solution in the context of multi-core processors, with the goal
of characterizing application sensitiveness to inter-core contention. We also target deriving
bounds to the worst contention each request type can suffer accessing each shared resource.
As presented in the introduction, the contention a task τa suffers accessing shared resources
cont
∆a , can be computed by exploiting the maximum number of requests each task τa performs
to each shared resource r, Nar , hardware resource and the worst-case contention delay each
request type can suffer, Lmax cont
r,y . That is, ∆a = f (Nar , Lmax
r,y ).
max
Regarding the latter, Lr,y , in the GR712RC it covers the contention accesses suffer
accessing the AHB bus. In the worst scenario, a request is sent from one core at the same
time another request is sent from the other core, with the latter getting priority on the
bus. In this scenario, Lmax
r,y matches the duration of the latter request. Hence, the piece
of information we need from the tracing solution is the number of accesses to the shared
resources, breaking them down between reads and writes, while the contention requests
generate each other are derived empirically.
The following features of the target board and the contention modelling approach are
relevant for the proposed tracing solution.
1. For the GR712RC, the number of requests a task performs to the different memories
in isolation matches the number it does with any co-runner task, assuming tasks are
ECRTS 202015:10 Tracing Hardware Monitors in the GR712RC Multicore Platform
independent. While the latency it takes each request, of course, is affected by the
integration with other tasks, the total number of requests is not.
2. The multicore timing model factors in the interleaving among requests. This is so because,
as explained above, the model assumes the worst interleaving between the task under
analysis and the contender task.
The first feature allows us to perform the profiling of access counts when each application
runs in isolation, removing the need of performing multicore executions. The latter makes
that when we collect the number of accesses, the time when they happen is irrelevant, so
when our solution captures end-to-end access counts it can affect the timing between requests.
3.3 Proposed profiling solution
The profiling approach we propose in this work builds on end-to-end observations and relies
on a limited set of monitoring counters. More importantly, we do not need to associate
events and timing, as the contention impact on timing is analytically modeled exploiting
event information. This allows us to collect timing information and event counts separately.
Our profiling solution provides on-line support for the trace collection and off-line support for
the processing of the trace, see Figure 3. The on-line support consists in a GRMON script
that loads an image and collects the BTB and the ITB (Dumper). The off-line part provides
a (Merger) function to filter the output file produced by the Dumper, containing combined
data from both the ITB and the BTB. The Merger removes repeated and redundant entries,
processes the raw data, and isolates two separated data structures, one for the ITB and
another for the BTB. In order to identify some of the events, it also performs a merging
process of both traces, to identify the instructions generating each request to the bus. The
second step of the post-processing script derives the access counts of each kind (Collector).
3.3.1 Implementation
We work-around the lack of a PMU by using some of the debug features included by the
Debug Support Unit (DSU). The DSU is connected to the main AHB Bus which, in turn,
connects cores, debug I/O, and on-chip/off-chip memories. It is also connected to the cores
directly to issue commands and receive information from the cores by-passing the shared
AHB. It provides regular debugging capabilities such as breakpointing, step-by-step execution,
and memory inspection. The DSU provides two key features for our study.
The DSU snoops the AHB and captures the activity on the bus (btrace) initiated by
the cores when accessing the different resources. This is provided as a trace with events
recorded when they occur.
The DSU also captures a stream of executed instructions in each core. The stream is
built from the chronological sequence of instructions architecturally executed. For each
instruction in the stream, the DSU records information like the instruction itself and its
PC (more details below).
In the bus trace we can identify the source (core) of all the activity by checking the
AHB MASTER field, which uniquely identifies the origin of the request. Also, each of the
different memories are mapped to different ranges of the address space. By tracking the
addresses generated by each event we know the memory it targets. Using the same approach
we identify accesses to peripherals such as the UART. With these two pieces of information
we are able to identify unambiguously the source and the target of each entry in the trace.X. Palomo et al. 15:11
Figure 3 Trace collection process with created modules shown in grey.
This information is stored into two separated circular buffers called (AHB) Bus Trace
Buffer (BTB) and Instruction Trace Buffer (ITB). The BTB is filled by snooping the AHB,
while the ITB is filled by directly receiving the instruction execution stream from the cores.
The buffers are filled fast, but they cannot be dumped as fast because the DSU is connected
to the debug port via the shared AHB bus. The buffers are 256 entries long each, and their
content must be dumped before becoming full or data may be overwritten and lost.
Each BTB entry includes the following fields: timestamp with the cycle the request was
observed in the bus, program counter (PC) of the instruction causing the bus transaction,
target memory address, data, access being a read or a write, and AMBA protocol options,
including AHB HTRANS, AHB HBURST, AHB HSIZE, AHB HMASTER, AHB MASTLOCK and AHB
HRESP among others [46]. More information about these fields can be found in the AMBA
AHB specification [3].
Each ITB entry includes the following fields: timestamp, PC, instruction word (iword),
result (or data for memory instructions), as well as bits signaling trap (indicating that the
processor is in debug mode, resulting in tracing the instruction twice and as a result these
entries are filtered out), processor error mode, and single or multicycle instructions [46].
3.3.2 Dumper
The data fields in the trace buffers cannot be collected in real time, and the buffers need to
be dumped regularly to prevent them from overrunning. That is achieved by the Dumper by
breakpointing the region of interest and using a step-by-step execution. The Dumper is
a TCL script that issues GRMON commands. It is executed when the GRMON debugger
is launched, connecting the host to the board. It first loads the executable binary to the
board, sets the entry point and the stack pointer to fixed addresses when running in BM, and
sets a breakpoint at the beginning of the region of interest, which is the region to be traced.
This region can be either a whole task or just a part of it. The processor is booted and the
binary executed normally until the breakpoint is reached. The control is then returned to
the Dumper, which resumes the program using a step-by-step execution.
Every 16 steps, the DSU breaks its execution and the contents of the BTB and the
ITB are dumped to the host through the UART. The selected step (16) is deemed to be
conservative (small) enough due to the size of the buffers (256 entries each). That causes
dumping several entries from the trace buffers to be sent more than once, but they are filtered
at a later stage by the Merger. An even smaller step would imply slowing more the process
needlessly.
The tracing dumping process is executed until the program counter that determines the
end of the region of interest is encountered. At this point, the Dumper stops executing the
ECRTS 202015:12 Tracing Hardware Monitors in the GR712RC Multicore Platform
Table 1 Collected Events.
Event ID Event
Icount Total number of instructions executed
LDc Total number of load instructions executed
STc Total number of store instructions executed
LDm Total number of data cache load misses
LDh Total number of data cache load hits
Ihits Total number of instructions cache hits
Imiss Total number of instructions cache misses
Ifill Total number of instructions snooped as a result of an instruction miss
Bus Total number of bus accesses
LD_SDRAM Total number of loads from the SDRAM memory
LD_offSRAM Total number of loads from the off-chip SRAM memory
LD_onSRAM Total number of loads from the on-chip SRAM memory
LD_IO Total number of loads/reads from the I/O peripherals
ST_SDRAM Total number of stores to the SDRAM memory
ST_offSRAM Total number of stores to the off-chip SRAM memory
ST_onSRAM Total number of stores to the on-chip SRAM memory
ST_IO Total number of stores/writes to the I/O peripherals
program and the dumped file is saved. The outcome of this dumping process results in a
plain text file, comprised of a series of pairs of 256 ITB elements followed by 256 elements
from the BTB.
3.3.3 Merger
Once the region of interest is completely traced and the output file has been saved, it is
Post-processed in the host.
As a first step of the Merger, the btrace and the itrace are filtered into two separate
data structures using Pandas, which is an open source data analysis tool built on top of
Python. At this point, the Merger also removes redundant entries introduced as a result of
the conservative tracing dumping rate. Then, we post-process the opcode from the iword
field in order to determine the instruction type.
As a second and last step, the Merger links up the entries of the data structure built
up from the btrace, which correspond to data load misses in cache to the load instruction
that causes that bus activity. To do so, we filter those events in the bus data structure
whose opcode is that of a load, their AHB HTRANS field value is non-sequential and their AHB
HBURST field value is single. Then, we match them with the entries of the instruction data
structure which correspond to a load instruction traced (executed) one cycle after being
traced (snooped) in the bus. The “tracing relationship” for the difference in cycles for a load
miss was empirically observed across several experiments, always matching this pattern. We
relate both data structures to identify instruction misses in a similar manner.
3.3.4 Collector
Finally, once the data structures are filtered and properly processed, the Collector derives
the counts of the events for each kind of access. As a result of this step, we derive the events
listed in Table 1 as follows.
The number of instructions executed by checking the number of entries in the instruction
data structure. Instruction cache misses are identified by matching the address field in both
traces, and checking that in the bus data structure the access is in read mode (instruction
cache miss) and the value of the AHB HTRANS field is non-sequential. Conversely, the
instruction fetches resulting in a cache line fill are identified in the bus data structure asX. Palomo et al. 15:13
those with a sequential value for the AHB HTRANS field, and an incremental value for AHB
HBURST. These usually occur as a set of 7 instructions fetched after an instruction miss,
which is consistent with the size of an instruction cache line. The reasoning, is that an
executed instruction which is also traced in the btrace implies that the instruction was
not found in the instruction cache and therefore had to be fetched.
We derive the instruction cache hit count by counting the amount of instructions executed
that do not cause bus activity. To do so, we subtract from the instruction count the sum
of instruction misses and instruction line fills.
The total number of load and store instructions executed is derived from the data
structured by the Merger, which has previously decoded the instruction type. Data cache
load misses are identified as detailed in 3.3.3.
Data cache load hits are derived by subtracting these misses to the total amount of loads.
The total number of bus accesses from the bus data structure, as well as their target
memory, is derived by checking their address field in the case of load instructions, since
each target is mapped to a different address range. The target memory of the store
instructions can be extracted from the instruction data structure, concretely from its
result field, which contains the target address.
Overall, the proposed tracing solution enables deriving instruction and access counts
accurately as needed by the contention model.
4 Experimental Evaluation of the Profiling Solution
The experimental evaluation has a three-fold objective. We aim at providing evidence on the
accuracy of the implemented profile library (Section 4.1). We also deploy the same library to
derive a timing characterization of the impact of contention on accessing the shared memory
devices in the GR712RC (Section 4.2). Finally, we use that timing characterization for
deriving a preliminary model potentially incurred by a space case study (Section 4.3).
4.1 Validation of the profiling solution
We build on the concept of specific code snippets to assess the accuracy of the proposed
profiling solution, which covers two dimensions.
Comparing the expected access count values with the ones obtained with our profiling
solution in a bare metal setup. This allows assessing the accuracy of the solution in a
pristine scenario.
Comparing the results obtained with the profiling solution when we run the exact same
code snippet under bare metal and RTEMS. This allows assessing any portability issues
of the solution for different RTOS on the GR712RC.
To satisfy these goals, code snippets are designed so that a hardware expert with under-
standing of the GR712RC architecture can provide high-accurate estimates of the expected
access counts. Also, they are small enough for the expert to be able to reasonably handle them.
A preliminary exploration on the use of specialized code snippets for characterizing multicore
timing interference has been reported in [41]. The basic structure of each code snippet is a
main loop with a large body comprising one or two types of instructions only, usually load
and/or store. On the one hand, this reduces the overhead of the loop control instructions; on
the other hand, by playing with the range of addresses accessed by the load/store operations,
we force accesses to be sent to the on-chip SRAM, the off-chip SRAM/SDRAM or the UART.
ECRTS 202015:14 Tracing Hardware Monitors in the GR712RC Multicore Platform
Table 2 List of code snippets.
Name Description
cs_ic_hit Causes instruction cache hits
cs_ic_miss Causes inst. cache misses and line refills
cs_dc_hit Causes data cache load hits
cs_on_SRAM_rd Causes on-chip SRAM read accesses
cs_on_SRAM_wr Causes on-chip SRAM write accesses
cs_off_SRAM_rd Causes off-chip SRAM read accesses
cs_off_SRAM_wr Causes off-chip SRAM write accesses
cs_off_SDRAM_rd Causes off-chip SDRAM read accesses
cs_off_SDRAM_wr Causes off-chip SDRAM write accesses
Figure 4 pseudo-code cs_UART_rd Causes UART read accesses
of the code snippets. cs_UART_wr Causes UART write accesses
The range of accessed addresses can also be changed to force those accesses to cause capacity
misses in cache. The high density of desired operations in these code snippets, in combination
with visual inspection of the object code, enables the hardware expert to predict with high
accuracy the expected behavior with regard to the most relevant events.
We assess the accuracy of the proposed solution by applying it to the code snippets
listed in Table 2. Experiments are executed in a single-core scenario and as specified in
Section 3. We compare the values we collect to those expected. In the following subsections
we present the validation for some code snippets, due to space limitations we do not describe
the validation of cs_ic_miss and cs_ic_hit. Also note that in each validation experiment we
show only relevant events.
4.1.1 Bare Metal Snippets
cs_dc_hit. This code snippet triggers loads that systematically hit the L1 data cache.
Prior to profiling the code snippet, the loop function is executed in order to warm up the
caches and avoid as many cold misses as possible. These cold misses go to the off-chip SRAM
memory. A total of 128 load instructions are executed in each iteration of the loop that
iterates 1000 times. Table 3 shows that the reported values by our library have high accuracy
in terms of instruction count (ICount), load and store counts (LDc and STc), load hits and
misses (LDh and LDm), instruction cache hits (Ihits), and accesses to the off-chip SDRAM
(SDRAM) and the on-chip SRAM (oSRAM). In the worst case the deviation is 0.03% for
instruction counts. Such tiny deviations are regularly observed in many COTS, even in single
core and non-speculative ones. Another possible reason could also be tied to the rotating
trace buffer. Some requests slightly before and after the region of interest may be included in
the trace dump. The 23 accesses to the off-chip SRAM reported in Table 3 are due to cache
line re-fills, which are also considered and captured by the post-processing script. For the
instruction hits (Ihits) count, we expect all instructions (Icount) to hit in the L1 instruction
cache. Further experiments showed that, as we increase the loop iteration count, the relative
deviation decreases, hinting at a constant instruction count overhead. Also, the obtained
counts are deterministic across several runs.
cs_X_rd. Table 4 shows the derived and expected access counts with the snippets
designed to systematically miss with load operations from the L1 cache and target only one
of the different memories: cs_on_SRAM_rd, cs_off_SRAM_rd and cs_off_SDRAM_rd.X. Palomo et al. 15:15
Table 3 Validation of the profile solution with cs_dc_hit.
Load Hit
Event Exp. Obs. Dev (%)
Icount 131000 131040 0.03
LDc 128000 128004 0.00
STc 0 1 -
LDm 0 1 -
LDh 128000 128003 0.00
Ihits 131040 131036 0.00
LD SDRAM 0 0 0.00
LD offSRAM 0 23 -
LD onSRAM 0 0 0.00
ST offSRAM 0 1 -
Table 4 Expected & Observed event counts, and relative Deviation (%) for cs_X_rd.
OnSRAM OffSRAM SDRAM
Event Exp. Obs. Dev Exp. Obs. Dev Exp. Obs. Dev (%)
Icount 131000 131073 0.06 131000 131024 0.02 131000 131024 0.02
LDc 128000 128006 0.00 128000 128001 0.00 128000 128001 0.00
STc 0 1 - 0 0 - 0 0 -
LDm 128000 128003 0.00 128000 128000 0.00 128000 128000 0.00
LDh 0 3 - 0 1 - 0 1 -
Ihits 131073 131061 -0.01 131024 131021 0.00 131024 131021 0.00
LD SDRAM 0 0 0.00 0 0 0.00 128000 128000 0.00
LD offSRAM 0 43 - 128000 128007 0.01 0 0 0.00
LD onSRAM 128000 128000 0.00 0 0 0.00 0 0 0.00
ST offSRAM 0 1 - 0 0 0.00 0 0 0.00
In order to avoid any potential residual data in the cache from previous executions, the loop
functions are also run before starting the profiling phase. Similarly to cs_dc_hit, the loop
function consists of 1000 iterations over a loop which performs 128 load operations to every
given memory, with a stride between them so that every load instruction causes a miss in
the L1 data cache.
Results for all three memories confirm a very high accuracy for the relevant events, with
the worst case deviation (0.06%) being again associated to instruction counts. The 43 loads
from the off-chip SRAM in cs_loadmiss_onsram, include instruction misses and instruction
cache line refills that are triggered as a consequence of an instruction cache miss.
cs_X_wr: We proceed likewise with the code snippets that perform write operations
to the different memory devices in the board (cs_on_SRAM_wr, cs_off_SRAM_wr, and
cs_off_SDRAM_wr). Once again, these code snippets consist of 1000 loop iterations
triggering 128 store operations to addresses of every particular memory. Given the write-
through no-allocate policy, we do not need to pre-heat the caches, as each store results in a
bus access and no content is loaded into the L1 cache. Accuracy results, not shown for space
constraints, are consistent with those observed for read operation.
Different cs_UART_X: For the UART snippets, which read/write from/to an I/O
device, we first configure the registers of the UART, and then perform reads or writes in a
loop composed of 128 accesses to the memory-mapped address for data in the UART registers.
Results confirm the accuracy of our tool to trace and collect events, with a maximum
deviation of 0.11% in the case of the instruction count.
4.1.2 RTEMS Real-Time Operating System
One of the requirements for our profiling solution is the ability to support different real-time
operating systems, with minimum effort, as some case studies run bare metal while others
run on consolidated RTOS. To show adherence to this requirement, we evaluate our profiling
method with the Real-Time Executive for Multiprocessor Systems (RTEMS) v5.
ECRTS 202015:16 Tracing Hardware Monitors in the GR712RC Multicore Platform
Changes in the profiler. The adaptation of our solution to RTEMS required no change
to its scripts, with the steps of tracing and post-processing matching those for bare metal.
At the RTEMS level, the only configuration required is to either use a uniprocessor scheduler
or disabling the other potentially contending cores when profiling an application and using a
multicore scheduler. Both allow tracing in isolation as required by our profiler.
Changes in the Code Snippets. Our goal when developing the snippets for RTEMS
was ensuring that we had the same binary running in BM and in RTEMS. This objective is
achieved by compiling the snippet into a .o object file with the sparc-elf-gcc cross-compiler,
then linking it either into a BM image or an RTEMS image by using the sparc-elf or the
sparc-rtems tool-chain linker. In order to enable the use of the same object file for BM and
RTEMS the code snippet is built without any library or system call dependencies.
Evaluation. For the evaluation we proceed analogously as for bare metal, comparing the
expected and observed counts. The region of interest is the loop function of the code snippets,
i.e. after RTEMS has already been initialized. As a result, we do not expect variance in the
results due to the interference by the RTOS. Table 5 reports expected and observed results
for the snippets reading from the different memories under RTEMS. Results are very similar
with a slight difference in the number of instructions executed by the processor (0.1%) and
the load count (0.02%). This differences, which can be caused by the RTOS, are deemed
as negligible. We also conducted the same experiments for the other code snippets, whose
results are not shown for space constraints, resulting in the same conclusions: 0.12% Icount
at most and no deviation in STc for all the cs_*_wr snippets. The results show a very small
deviation between expected and observed values, even in the presence of an RTOS.
Also, as we have the same code running in BM and in RTEMS and we trace the same
region of interest, we can perform a direct comparison between the results under BM and
RTEMS, e.g. Table 4 and Table 5. The fact that the tool-chain can be applied to RTEMS
without any modification neither in the collector code nor in the dumper and merger scripts,
shows that this process is easily extensible to embrace RTOS.
Table 5 Validation with memory read snippets in RTEMS.
OnSRAM OffSRAM SDRAM
Event Exp. Obs. Dev Exp. Obs. Dev Exp. Obs. Dev (%)
Icount 131000 131136 0.10 131000 131136 0.10 131000 131136 0.10
LDc 128000 128022 0.02 128000 128022 0.02 128000 128022 0.02
STc 0 0 - 0 0 - 0 0 -
LDm 128000 128002 0.00 128000 128002 0.00 128000 128022 0.02
LDh 0 20 - 0 20 - 0 1 -
Ihits 131136 131129 -0.01 131136 131129 -0.01 131136 131129 -0.01
LD SDRAM 0 0 0.00 0 0 0.00 128000 128000 0.00
LD offSRAM 0 44 - 128000 128045 0.04 0 44 -
LD onSRAM 128000 128000 0.00 0 0 0.00 0 0 0.00
4.2 Evaluation Results: Contention Slowdown Matrix
As we introduced in Section 3, contention models typically build on access counts, which
we can derive with the support of our profiling tool as shown in Section 4.1, and worst-case
contention latencies to each target shared resource. In fact, we need for every pair of requests
type/target resource the contention they generate each other. This information is stored in
the slowdown matrix. Each cell in the slowdown matrix is generated by running stressing
benchmarks [12] that put maximum load on the resource. It follows that the reliability of
the slowdown matrix builds on that of the stressing benchmark used in the experiments. To
cover the latter, evidence is required that stressing benchmarks intensively stress their target
resource.X. Palomo et al. 15:17
Table 6 Stressing benchmark validation.
Expected Relation Acc. Validated
LDc ≈ Icount; 97% yes
RD LDc = LDm = LD_onSRAM = Bus 100% yes
Ihits = Icount 100% yes
On-c. SRAM LD_offSRAM = LD_offSDRAM = LD_IO = 0 100% yes
STc ≈ Icount; 95% yes
WR STc = ST_onSRAM = Bus 100% yes
Ihits = Icount 100% yes
ST_offSRAM = ST_offSDRAM = ST_IO = 0 100% yes
LDc ≈ Icount; 97% yes
RD LDc = LDm = LD_offSRAM = Bus 100% yes
Ihits = Icount 100% yes
Off-c. SRAM LD_onSRAM = LD_offSDRAM = LD_IO = 0 100% yes
STc ≈ Icount; 95% yes
WR STc = ST_offSRAM = Bus 100% yes
Ihits = Icount 100% yes
ST_onSRAM = ST_offSDRAM = ST_IO = 0 100% yes
LDc ≈ Icount; 97% yes
RD LDc = LDm = LD_offSDRAM = Bus 100% yes
Ihits = Icount 100% yes
Off-c. SDRAM LD_offSRAM = LD_onSRAM = LD_IO = 0 100% yes
STc ≈ Icount; 95% yes
WR STc = ST_offSDRAM = Bus 100% yes
Ihits = Icount 100% yes
ST_offSRAM = ST_onSRAM = ST_IO = 0 100% yes
LDc ≈ Icount; 97% yes
RD LDc = LDm = LD_IO = Bus 100% yes
Ihits = Icount 100% yes
UART LD_offSRAM = LD_offSDRAM = LD_onSRAM = 0 100% yes
STc ≈ Icount; 97% yes
WR STc = ST_IO = Bus 100% yes
Ihits = Icount 100% yes
ST_offSRAM = ST_offSDRAM = ST_onSRAM = 0 100% yes
In our setup, we leverage our profiling solution to effectively achieve this goal. While
the goal for snippets was to check that the expected absolute event count values matched
the observed ones, for stressing benchmarks the goal is to ensure a given relation between
event counts. For instance, a read stressing benchmark on the on-chip SRAM should have
(1) as many instructions as load operations; (2) as many dcache hits, dcache misses, and
on-chip SRAM accesses as load operations. The former condition captures the fact that,
except for few control instructions in the main loop of the stressing benchmark, the rest of
the instructions should match the target type. Few additional instructions can also be added
to avoid systematic behaviors [19]. The latter condition, instead, states that read operations
must miss in the data cache and access the on-chip SRAM.
In Table 6 we present the microbenchmarks (uBs) developed as well as the expected
relation among event counters, and the assessment done from the observed event counts
obtained with our tracing solution. We observe that the stressing benchmarks can be deemed
as satisfactorily achieving their goal of stressing its target resource. This provides evidence
on the results obtained in the Slowdown Matrix, see Table 7, with stressing benchmarks.
The first column of the table reports the number of clock cycles taken to execute each type
of instruction running in isolation. The following columns indicate the number of cycles
taken by the same instruction when the other core is executing another particular instruction
intensively.
4.3 Case Study
We evaluate our profiling approach on a real space application realizing a subset of the
telemetry and telecommand functionalities. The telemetry and telecommand (TM/TC)
subsystem is a spacecraft component that (i) allows a remote collection of measurements
ECRTS 2020You can also read