STUDY REPORT Prefabrication and standardisation potential in buildings - SR 312 (2014) - Branz
←
→
Page content transcription
If your browser does not render page correctly, please read the page content below
STUDY REPORT
                SR 312 (2014)

        Prefabrication and
          standardisation
     potential in buildings
                  Ian Page
              David Norman

The work reported here was funded by BRANZ from the
               Building Research Levy.

                  © BRANZ 2014
                 ISSN: 1179-6197
Preface
This is a report on the current use of standardisation and prefabrication (S&P) in New Zealand
buildings, the potential for additional use, barriers and drivers of uptake. It builds on earlier
work at BRANZ on environmental and cost issues of prefabrication in the housing sector. This
work extends the research to non-residential buildings, issues raised by the fabricators, and
consideration of hard-to-quantify factors such as quality.

Acknowledgments
This work was wholly funded by the Building Research Levy.

Note
This report is intended for designers, contractors, manufacturers and prefabricators to promote
the advantages of S&P.

                                                i
Prefabrication and standardisation potential in buildings

BRANZ Study Report SR 312

Ian Page, David Norman

Abstract
The extent of existing use of prefabrication in New Zealand buildings is discussed.
Prefabrication and standardisation (S&P) are both generally thought to have benefits in
building construction, but quantifying these benefits has proved difficult. The initial cost when
using S&P will not necessarily decline from traditional methods of construction.          Instead,
benefits such as quicker construction, savings in the use of standardised panels and modules,
and better product quality are seen as the main potential benefits. A method for combining
these hard to quantify savings with costs is discussed. The potential for further use of
prefabrication and standardisation is analysed by building type and component. This finds that
the amount of prefabrication could be increased to more than $5 billion per year, while $2.7
billion of standardisation could occur. These two figures are not additive, as they overlap, but
this indicates that the overall S&P potential is somewhere between $5 billion and $7.7 billion.

                                                ii
Contents                                                                                                                                                        Page

1.      EXECUTIVE SUMMARY .....................................................................................................................1
2.      INTRODUCTION ................................................................................................................................. 3
        2.1        Defining prefabrication and standardisation ............................................................................. 4

3.      PREFABRICATION IN NEW ZEALAND: MEASURING UPTAKE ..............................................5
4.      PREFABRICATION OBSTACLES AND DECISION-MAKING...................................................6
        4.1        Literature review: Obstacles and international uptake .........................................................6
        4.2        Interviews: Prefabricators ...................................................................................................................10
        4.3        Interviews: Builders................................................................................................................................. 12
        4.4        Current activity among panel prefabricators............................................................................13

5.      POTENTIAL TO GROW S&P IN NEW ZEALAND........................................................................15
        5.1        Potential for increasing prefabrication........................................................................................15
        5.2        Potential for standardisation .............................................................................................................18

6.      ENCOURAGING PREFABRICATION ........................................................................................... 20
        6.1        Who benefits most from prefabrication? ................................................................................... 20

                   6.1.1 The home buyer ............................................................................................................................ 22
                   6.1.2 The building company / sub-contractor ......................................................................... 23

          6.1.2.1 Today’s world ....................................................................................................................................... 25

          6.1.2.2 The future world ................................................................................................................................ 25

          6.1.2.3 Other benefits and risks to builders from increased prefabrication .................. 26

                   6.1.3 The existing prefabricator.......................................................................................................27
                   6.1.4 The existing (non-prefabricating) manufacturer .......................................................27

        6.2        Why is prefabrication not more popular in New Zealand today? .................................... 27
        6.3        How are benefits promoted today? ................................................................................................ 28

                   6.3.1 Two examples ................................................................................................................................ 28

        6.4        The value case and the individual decision-maker: Costs and intangibles ............ 29

                   6.4.1 Including intangibles in the decision process ........................................................... 30

        6.5        A strategy for boosting prefabrication and standardisation industry-wide.............31

                   6.5.1 Who could make the first move? ........................................................................................ 32

APPENDIX A REFERENCES...................................................................................................................... 34

                                                                                  iii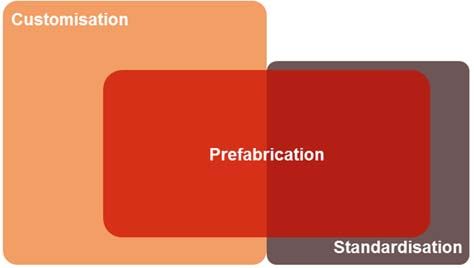
APPENDIX B MISCELLANEOUS ............................................................................................................. 35

Figures                                                                                                                         Page

Figure 1 The relationship between customisation, prefabrication and standardisation ............ 4
Figure 2 Trends in uptake of prefabrication.............................................................................. 5
Figure 3 Typical time lines for procurement ........................................................................... 13
Figure 4 Prefabrication potential by percentage, 2013 consent values.................................. 16
Figure 5 Standardisation potential by percentage, 2013 consent values ............................... 19
Figure 6 Benefits, costs and risks of an increase in quality prefabrication ............................. 21
Figure 7 Hypothetical example of the impacts of increasing prefabrication ........................... 24
Figure 8 Example of weighted evaluation – large emphasis on cost. .................................... 30
Figure 9 Example of weighted evaluation – less emphasis on cost, more on quality. ........... 31
Figure 10 Current prefabrication estimate details .................................................................. 35
Figure 11 Factors to include when comparing prefabrication with traditional construction. ... 36

                                                                   iv
1. EXECUTIVE SUMMARY
This report estimates the current uptake of prefabrication in residential and non-
residential building in New Zealand, sets out some obstacles to improving uptake of
standardisation and prefabrication (S&P), estimates the potential for increased S&P, and
highlights some ways to encourage S&P through pointing out the benefits they offer.
Standardisation is the repeated production of standard sizes and/or layouts of
components or complete structures. Examples include modular bathrooms, standard
kitchen cabinet sizes, standard prison
cell or classroom designs, standard
window sizes or wall panel sizes and
finishes. This repeated production of
identical components or structures may
occur on-site (in which case it is simply
standardisation), or it may occur off-site
(in which case it is also prefabrication).
Prefabrication is the off-site production of standardised or customised components or
complete structures. Examples may include pre-cutting and pre-nailing of wall framing
and roof trusses, or off-site construction of wall panels, or bathrooms, whether they are
standardised or customised. Prefabrication may be for bespoke (customised)
components and structures (in which case it is simply off-site production) or standardised
components and structures (in which case it is also standardisation).
We estimate that around $2.95 billion of prefabrication currently occurs in New
Zealand each year, most of which is in the area of wall and roof framing. A limited
amount of standardisation occurs. Yet, based on the components of buildings that can
be prefabricated relatively easily, we estimate that up to $5 billion of prefabrication
can be done each year, an increase of $2 billion. Standardisation has the potential
to reach $2.75 billion a year. There is an overlap between S&P, meaning the potential
for S&P is likely to lie between $5 billion and $7.7 billion a year.
Benefits occur right across the value chain. The home buyer benefits through a
reduced build time, increased time and cost certainty, and through improved value for
money and fewer defects. The builder, large or small, benefits through fewer weather
disruptions, and when demand for building services is high, is able to complete more
projects per year. More S&P also reduces the number of contracts the builder will have
to manage, defect call-backs, and on-site accidents. The manufacturer increases the
opportunities to add more value and increase profits on-site.
But there are barriers to the uptake of S&P, identified in our discussions and with the
industry and through an international literature review. Many of these are linked to
misconceptions about S&P, often based on negative connotations of how this was
done 30 years ago. Further, different players in the value chain, whether designers,
builders, or home purchasers often don’t see the value to them of increased S&P. A
1move to greater S&P would also require on-site workers to improve skills in order to
handle and assemble panels correctly. Some builders believe more S&P would mean
less work for them although in many cases it would simply mean many of the “outdoor”
construction jobs may move into weathertight prefabrication facilities.
Despite these perceived challenges posed to uptake of S&P, there are several
manufacturers producing panels, modules and complete buildings off-site. With
workloads in Christchurch and Auckland forecast to increase significantly, builders are
considering further prefabrication associated with housing and several initiatives have
been announced recently. The role of S&P is expected to rise and the challenge will be
to maintain and further extend the use of S&P after the boom in the two centres subsides.
In the non-residential sector, standardisation occurs in industrial, hotel and school
classrooms and more is possible, which also favours more prefabrication assuming
sufficient workloads are available. While many non-residential buildings are one-offs
with limited opportunities to use standard panels and modules, opportunities for health,
corrections and retirement facilities do exist. Uptake is often driven by the constraints
put on the contractor, including time, site, and lack of skills
Boosting uptake of S&P will require a holistic approach that incorporates a focus on:
Awareness: Perhaps the biggest challenge to be overcome, more needs to be
done to help all players in the value chain appreciate the benefits S&P offers them.
Procurement and process: All the literature, and local experience, says that early
involvement of the designer, fabricator and contractor in any particular project
enables the benefits of S&P to be better realised. Other stakeholders such as
lenders, insurers, planning and building control authorities also need more
involvement.
Benchmarking: The real-world benefits of time, quality, health and safety, and
sustainability improvements through greater use of S&P need to be highlighted and
the findings disseminated as they are often hidden and not fully appreciated by the
industry.
Training: An understanding of the techniques and precision involved in
prefabrication is essential both off-site and on-site. There is a need to train staff
on the longer-term benefits of prefabrication and to reduce staff turnover by
promoting a holistic approach to innovation.
.
.
22. INTRODUCTION
This study builds on work previously done by BRANZ on potential prefabrication benefits
in New Zealand buildings (Burgess, et al., 2013). That report looked at a typical small
house and the environmental and cost impacts of four types of prefabrication:
Components
Panels
Modules
Complete houses.
Its emphasis was on demonstrating potential cost savings and reduction in waste and
carbon emissions through more use of prefabrication.
This report identifies the various types of building work typically done in New Zealand
and each building type is assessed for its current prefabrication uptake, and potential
standardisation and prefabrication (S&P) potential.
We look at four questions with regard to S&P in the New Zealand building industry:
What is the current uptake of prefabrication in New Zealand?
What are the obstacles to uptake, and who makes the decision between S&P and
traditional construction?
What potential exists for S&P in New Zealand?
What is the value case for S&P and how can intangible factors be included in the
decision process?
First, we present a model measuring the uptake of prefabrication.
Next, we discuss who makes the decision to adopt S&P, including the results of a number
of interviews we have undertaken. These case studies of who makes prefabrication
decisions are presented.
Through a literature review, we identify the obstacles to adoption of S&P cited
internationally, before estimating the potential S&P market size if these obstacles can be
overcome in New Zealand.
Finally, the research considers the benefits beyond cost savings, such as quality, safety
and time certainty. How can these hard-to-quantify benefits be combined with cost
saving when deciding between S&P and traditional construction? A technique called
weighted evaluation, which can be used at project or firm level, is discussed, and a
strategy for boosting uptake of S&P is set out.
32.1 Defining prefabrication and standardisation
To differentiate between standardisation and prefabrication, it is helpful to introduce a
third term – customisation.
Figure 1 shows the relationship between the three terms.
Figure 1 The relationship between customisation, prefabrication and standardisation
Standardisation is the repeated production of standard sizes and/or layouts of
components or complete structures. Examples include modular bathrooms, standard
kitchen cabinet sizes, standard prison cell or classroom designs, standard window sizes
or wall panel sizes and finishes. This repeated production of identical components or
structures may occur on-site (in which case it is simply standardisation), or it may occur
off-site (in which case it is also prefabrication).
However, in New Zealand, most buildings are bespoke (customised), whether they be
residential or non-residential. Work by BRANZ suggests that even when houses based
on standard house plans built by the major building franchises are chosen for a new-
build, there tends to be significant customisation. Customisation, then, is the opposite
of standardisation, and has typically been the norm in New Zealand, even when it comes
to window sizes, bathroom layouts and other components that one may expect could be
produced in standard sizes or layouts. Customisation may occur either on-site (in which
case it is simply a customise build) or off-site (in which case it is also prefabrication).
Prefabrication is the off-site production of standardised or customised components or
complete structures. Examples may include pre-cutting and pre-nailing of wall framing
and roof trusses, or off-site construction of wall panels, or bathrooms, whether they are
standardised or customised.
These definitions help explain that the estimates of the potential for prefabrication and
standardisation presented in this report are not additive. Some standardisation may be
done off-site (prefabrication), but other standardisation (such as the same floorplan being
used for side-by-side townhouses) may be achieved on-site.
43. PREFABRICATION IN NEW ZEALAND: MEASURING UPTAKE
BRANZ is monitoring the uptake of prefabrication through the regular materials survey.
Questions are included in the survey on use of prefabrication by building component.
Trends are shown in Figure 2.
Figure 2 Trends in uptake of prefabrication
The analysis is based on assessing buildings by component. The component share of
total cost for each building type is derived from breakdowns provided in Rawlinsons New
Zealand Construction Handbook 2012. The BRANZ materials surveys disclose the
share of prefabrication for each component, including pre-cutting and nailing, and
prefabricated wall and roof claddings. Building consents data are used to scale up the
value of work so that the value of prefabrication in new housing, housing alterations and
additions, and non-residential buildings can be added to together to give an estimate for
the vertical construction industry.
The boundaries of prefabrication as defined here are somewhat arbitrary. The aim is
develop a measure than can be used to follow progress in uptake of pre-fabrication,
rather than derive a total dollar value for all prefabrication.
Figure 2 suggests that uptake is increasing gradually, but further survey results are
needed to confirm this trend. Note, earlier measures of uptake reported in Burgess
(2013) had lower percentages because some components, namely windows and joinery,
were omitted, but these have been included in Figure An estimated $3 billion worth of
2. prefabrication was implemented
The details of the analysis are in the appendix, in the 2013 calendar year.
including a component and building type breakdown in Figure 10. By this estimate,
around $2.95 billion worth of prefabrication, mostly in the form of wall framing, roof
trusses, windows and joinery, was implemented in the 2013 calendar year, or 25% of
the value of all consented building projects in that year. This indicates the market is
already relatively substantial, but limited to a small number of components.
54. PREFABRICATION OBSTACLES AND DECISION-MAKING
This chapter considers the misconceptions and obstacles related to S&P that are
highlighted internationally, some of which overlap with what we learned in New Zealand.
We then discuss who makes the decision to adopt prefabrication at this time in New
Zealand. Discussions were held with prefabricators and builders on their understanding
of how prefabrication is chosen for individual projects at present in New Zealand.
4.1 Literature review: Obstacles and international uptake
There are a large number of research reports on use of S&P in buildings. This review
examines selected studies from the United States (US) and the United Kingdom (UK)
with the aim of identifying what factors beyond costs are considered in the choice
between S&P and traditional construction, and what are the barriers and opportunities.
The UK Construction Industry Research and Information Association carried out a major
case study survey of construction clients on the use of S&P and their understanding of
advantages and disadvantages. The results reported by Gibb (2001) identified
misconceptions, applications, and lessons from use of S&P:
Misconception One: “Houses are like cars”. i.e. that a factory production process
is applicable to housing. Their response, in brief, is that this is only partly true.
Houses are fixed and erected spatially apart which means the industry needs to
be mobile with a “virtual” factory at each site to which machines, people and
materials are transported. In contrast, production line manufacturing has
dedicated worksites, unchanging supply lines and specialised workers and it is the
end product that moves during assembly. This
A number of misconceptions
can be done for components and panels but is
as to the value of S&P exist
more difficult for modules and complete houses.
on both sides of the argument.
Misconception Two: Maximum S&P is always
best, but this implies stable demand and limiting choice, which is unlikely to occur
for an extended period.
Misconception Three: Standardisation means “boring”. There are examples of
where standardisation has produced uninteresting buildings. Conversely the
author note that Georgian residential design is attractive, (as are villas in New
Zealand). Also, components may be standardised but not the building in a
“customised” design.
Misconception Four: Pre-fabrication is always cheaper. Often economies of
scale were not realised so pre-fabrication will not necessarily be cheaper, but other
benefits such as quality control and time certainty can be more easily realised.
Lessons and applications: Clients want choice and some customisation, they
accept that one-off products are likely to cost more, and they are interested in the
end product, not the construction process, so prefabrication is not necessarily an
advantage or disadvantage in their mind. On-going performance is as important
as initial appearance.
6Aldridge et al (2001) undertook a project at Loughborough University, UK, on the
evaluation of the benefits of S&P. Benefits were identified in four main categories:
General benefits such as reduced total costs, reduced overall project time, greater
certainty of cost and time, better quality, fewer accidents, reduced waste.
Benefits specific to the standardised process (whether for mass-customisation
or mass-standardisation) include reduced design costs, simplified construction
processes and work schedules, clarity of roles, fewer contracts, and ability to
reproduce projects.
Benefits specific to use of standardised components include manufacturer
input into the design process, standardisation aids prefabrication, reduced delivery
times, secure supply chain, consistent quality of components, reduced need for
assurance checks.
Benefits specific to prefabrication include reduced on-site time and storage
space, quicker on-site weatherproofing, removal of difficult processes from site to
workshop, fewer on-site interfaces, fewer on-site defect repairs, fewer persons on-
site. Many of the benefits of
The report noted that many of these benefits are difficult to S&P are difficult to
quantify in dollar terms.
measure, and decisions to use S&P are often based on
anecdotal evidence rather than rigorous data. The authors advocate tools and
techniques for assessing the benefits, either quantitatively or qualitatively. These include
benchmarking and KPIs, health and safety measurement tools, human resource
measures (e.g. turnover, job satisfaction, career development), risk assessment, quality
management, lean construction, value management, cost-benefit analysis, and supply
chain management.
Blismas et al (2006) examined new building projects where comparisons were done
between traditional and prefabrication methods of construction. The research aimed to
find what factors were considered in the comparisons. Both cost and difficult-to-measure
factors were included. The proposition was that current evaluation methods for
prefabrication are cost and not value-based and therefore do not account for all the
benefits of prefabrication. Six projects, mainly commercial buildings, were analysed and
the inclusion, or not, of 16 factors were tabulated.
The research found only one project considered a range of factors, namely seven out of
the 16 possible factors identified by the researchers. For all six projects the average
number of factors considered was 3.5 for traditional construction and 4.5 for
prefabrication construction. There were inconsistencies within some projects with some
factors such as design costs considered for prefabrication but not for traditional
construction.
Pan et al (2008) examined prefabrication in the UK house building industry. They found
the structure of the industry is fragmented, with many small scale builders (only 200 firms
built more than 50 homes per year) and a mix of builder types. These ranged from firms
providing the complete package (land, design, supply arrangements, all labour) to
developers with no construction capability and 100% sub-contracting. There was little
7sharing of knowledge on prefabrication and standardisation technologies. The
main focus of management was on profit levels and control of finances rather than the
construction process. A survey of the major house builders used a five point scale
(never, rarely, sometimes, mostly, always) for use of prefabrication by component. For
most components, the average use was between “never” and “rarely”. Highest use was
for internal drywalls, upper floor precast beams and precast piles at an average of
“sometimes”.
It is apparent the overall quantity of prefabrication is low in UK housing. The best
opportunities were seen in kitchens and bathrooms, external walls, timber framed
structures and roofs. Complete modular buildings were not seen as having much
potential. Traditional procurement (fixed price from plans) still dominates in UK house
building, making incorporation of prefabrication into the early design stages difficult to
achieve.
The report found the drivers for prefabrication, where it is used, are quality,
construction time, time certainty, reduced health and safety incidences, bypassing
skill shortages, and cost certainty. The barriers The drivers for prefabrication are
seen by most respondents were high initial cost, quality, construction time, reduced
uncertainty about the economies of scale, the health and safety incidences,
joining of components, and possible planning and bypassing skill shortages, and cost
building regulation challenges. and time certainty, rather than
lowest cost in a simplistic sense.
Tam et al (2007), looked at the potential for
prefabrication by component, for four types of building work in Hong Kong. A total of 23
building components were considered and respondents were asked to assess each
component for four levels of prefabrication, namely conventional (i.e. no prefab), semi-
prefabrication, comprehensive prefabrication and volumetric prefabrication. Effective
levels of prefabrication were identified for structural steel frames, external
cladding, concrete wall and floor panels, washroom, and internal walls, i.e. the full
range of prefabrication was found to be applicable.
In the US, a report commissioned by the National Institute of Standards and Technology
(SmartMarket Report 2011) examined current usage of S&P, benefits and barriers, and
expected future uptake. Between 74% and 90% of architects, engineers and contractors
used some prefabrication at the time of the survey (2011). Among users, the volume of
prefabrication is quite low with only a third of users reporting a high level of
prefabrication (defined as some prefabrication on at least 50% of their projects).
The main reason given for not using prefabrication was that the architect did not
specify it, and the latter blamed owner resistance to prefab. Current and expected
future use of prefabrication had the best potential in health, education, factories/
warehousing, low-rise offices and hotels. A net 24% of respondents said prefabrication
improved safety. Material use was reduced by about 4% and site waste by about 6%
8using prefabrication. Project cost savings of about 6% were reported, compared to
traditional construction methods.1
The Canada Mortgage and Housing Corporation (2006) commissioned a report in 2006
on factory-built housing. It found 7% of housing in Canada was factory-built (defined as
complete house, modules, panels, pre-cut/engineered components, and log.) It appears
that trusses and frames are included in pre-cut/ engineered components and the
numbers of these are low at about only 1.5% of all new housing. Modular homes are
higher at 3% and complete homes about 2%. Panels (mainly one side opened) are low
at about 1%. The reason for the low use of prefabrication appears to be tract builders
(in new developments) are uninterested. There is general lack of interest in moving
beyond stick building for the large majority of builders. Prefabrication is mainly used in
remote locations or where construction duration is a critical consideration for a particular
project. However the local manufacturers export significant quantities of panels to the
USA.
Page (2012) estimated the value of time savings associated with quicker construction in
housing using prefabrication. The main results was a saving of about $1,500 per week
for larger builders.
In summary, the literature indicates that:
In the UK, prefabrication decisions are ad-hoc and techniques are suggested to
measure the benefits of S&P in order to have better evidence for comparisons.
They include use of KPIs, safety records, life-cycle costs, job turn-over data, and
quality measures. More detailed items have been suggested but very few of them
have been used in actual comparisons for specific projects.
The UK house building industry has a similar distribution of firm size to that in NZ
(a few large firms and most construction done by smaller firms) although numbers
are larger. Use of prefabrication is low with start-up costs and economies of
scale seen as the main barriers. Potential is seen in kitchens and modular
bathrooms.
In Hong Kong, greater use of prefabrication in commercial buildings was expected
in steel frames, cladding, floor slabs, partition walls and bathrooms.
The use of prefabrication is low in the US, with only about 30% of contractors using
some prefabrication on the majority of their projects. Cost savings of about 6%
are identified for these projects, compared to traditional construction, with much
of those savings passed on through lower project budgets.
Canadian use of frames and trusses is surprising low and modular construction in
housing is more common, but overall use of prefabrication in housing is low.
This research illustrates low uptake in buildings due to the complexities that make
prefabrication and standardisation uptake difficult to promote, including uncertainty about
1
Note that these are for non-residential buildings and it is likely housing, which is more homogeneous,
will potentially have larger savings in costs.
9the advantages of prefabrication among designers and builders, and reluctance to
change by builders.
4.2 Interviews: Prefabricators
The first prefabricator we consulted is a manufacturer of concrete products for
commercial buildings. In their experience, the designer is the main decision maker with
regard to concrete, steel or timber structural systems, and the builder or main
contractor decides on prefabrication or in-situ assembly. We did not interview
designers as part of the project, so could not confirm this view independently.
Prefabrication is influenced by required completion time,
According to
site conditions and the finish required. For some projects, prefabricators, the builder
financing is the critical item after design. Arranging or main contractor typically
finance is typically a drawn-out process and as funds have decides on prefabrication
already been spent on investigation, sales and design, or in-situ assembly.
there is a rush to start and complete on-site construction.
Often this means prefabrication is the only option to meet deadlines.
A reduction in site skills, e.g. block layers, is also a factor in the choice of concrete
prefabrication. Repetition and standardisation favours the use of prefabrication. For
example, the use of common window and edge details on concrete wall panels
enables economies in production. Further gains are possible in standardising panel
thicknesses to say 150 mm, 175 mm and 200mm instead of wide variety of precast
concrete intervals that are typically used today.
The second prefabricator we spoke to works with structural steel. Almost all steel has
some machining and/or welding on steel lengths prior to installation on-site, so to some
extent all steel is prefabricated. However, more intensive steel prefabrication is
common. For example, steel portal frames and floor/ roof trusses are common and are
partial or completely prefabricated.
The extent of prefabrication (for all materials) is limited due to transportation issues. With
steel, this is addressed by the use of steel splices on-site, and site welding is
minimised as far as possible due to cost. Coordination between the designer, contractor
and the steel prefabricator is vital. It is quite common for the pre-fabricator to “drive” the
project. He discusses with the contractor how the main frame is to be erected and the
fabricators advises the designer where the splices need to be. The Heavy Engineering
Research Association (HERA) has a fabricator assurance scheme that endorses certain
steel fabricators because they recognise the vital role that fabricators have in delivery of
Prefabrication in New an efficient structural system.
Zealand is largely The exchange of electronic files of building layouts and
limited to wall frames design details for any particular project is common in the
and roof trusses.
industry i.e. Computer Aided Design (CAD) systems. But this
does not operate as efficiently as it could. It appears steel, frame and truss fabricators
have to re-produce to some extent the CAD files from the designers because they are
inadequate for detailing the junctions. In addition, there are legal issues for the
10fabricators in that they are contractually expected to have satisfied themselves that the
overall design dimensions received from the designers are correct. Sometimes, this
involves a complete re-build of the electronic file in CAD. This problem can be overcome
with design-build type partnerships, because legal responsibility is shared between
parties which ensure cooperation at the design stage. However, most projects still follow
the traditional design and then tender route. Other solutions include the Building
Information Modelling (BIM) systems being used by all parties and/or a better sharing of
risk between the designer and the prefabricator.
In the timber industry, prefabrication ranges from wall frames to completed transportable
buildings, including:
Wall frames typically up to 6 m long and full stud height, including lintels.
Roof trusses of a variety of shapes and sizes
Floor panels and semi-closed wall panels
Completed wall panels including claddings, linings and services
Volumetric modules, typically of bathrooms
Small standardised rooms e.g. students accommodation, hotel accommodation
Complete houses and bedsit units, education rooms, and some other building
types.
The large majority of timber prefabrication work in New Zealand is on wall frames
and roof trusses. The third prefabricator consulted is a timber frame and truss
prefabricator. He, and most timber pre-fabricators have sophisticated software that
analyses load paths and simplifies the sizing of members (trusses chords, lintels, plates
and studs) using NZS3604 requirements. The software is not totally “glitch” free and in
about 10% of cases manual calculations and adjustments to the software output are
required. This software also runs the timber cutting process, and nailing of plates to
studs is mainly automated.
The interviewee accepted frame prefabricators appear to have potential to add more
value by progressing to open or closed panels (i.e.
A number of obstacles to
frames with one or both faces surfaced with cladding and increasing prefabrication in
or linings). He was open to the production of exterior New Zealand were identified.
panels, especially those with sheet material (i.e.
plywood, fibre cement, steel sheet). However, the interviewee saw the potential for more
value added as limited. The reasons include:
Resistance to panels from some builders because of reduced work for them.
The weight of panels, meaning they may require cranes to put them in place,
whereas most frames can be handled by two persons.
Difficulty in getting panel junctions correctly aligned. For example, exterior
wall panels need to meet another panel at right angles, to avoid in-plane junctions.
Getting the junction detail weather-tight, and aesthetically attractive, is usually
more difficult than if cladding is installed in-situ. This difficulty can be mitigated by
a level working platform or use of a levelling compound.
11 The fixing of cladding is not easily automated in the prefabrication process
unless sheet materials are used. Brick veneer, the most common cladding, is not
feasible for prefabrication. Based on current market shares only about 40% of
new housing could use panels with lighter claddings (timber / fibre cement / PVC
weatherboard, and plywood / steel and fibre cement sheet).
Risk of damage to interior wall panels with plasterboard linings and services
installed as they have to be positioned by crane before the roof trusses are placed,
meaning there is risk of weather and handling damage.
The conclusion from discussions with prefabricators is that semi-closed (one-sided)
panels are feasible and attractive from the prefabricator’s view-point, and that the main
barrier is getting builders to request them. This could be achieved by improving
awareness of the benefits of S&P to builders, as we discuss later.
4.3 Interviews: Builders
Structured interviews were held with three builders of houses to assess their views on
prefabrication, and in particular moving beyond prefabricated frames and trusses.
The first was a small scale builder (four houses per year) with one apprentice. Most of
his houses are bespoke and in the medium to high cost range. He would consider
additional prefabrication but it would need to be cost-effective for him to change i.e. items
delivered as required for a realistic price. Exterior wall panels would be considered e.g.
weatherboard and the joints would need to be box and scriber finish. In addition, part-
completed roofs could remove the need for safety netting thereby saving time and
cost.
A second builder (six houses per year) with two other persons is a contractor to a large
group builder. Materials and sub-contractors are supplied by the group builder so he has
little choice in the construction process. They already have problems in erecting larger
windows and he can foresee problems in handling cladding panels. He suggests in
two storey construction the panel detail for full height walls could be “tricky” as two single
storey panels may need to be joined together. In particular, getting weatherboard
spacing right may be a challenge.
The NZ Panelised joint venture announced in March 2014 plans to manufacture timber
framed panelised walls, floors and roofs. The two parties are Spanbild and Mike Greer
Homes, the latter of which currently builds over 500 houses per year, based in
Christchurch. Initially the Christchurch and Auckland markets will be supplied. The
planned capacity is up to 1,000 houses and buildings per year from a new factory in
Rolleston using German fabrication equipment. The venture plans to use the panels in
their own buildings and will sell off excess panels to other builders. Exterior wall panels
are to have windows, linings light weight claddings (or thin sheet material for on-site brick
cladding), stopping and paint finish. Conduits are provided for cabling. Interior
plasterboard wall panels are also to be produced with conduits and paint finish. Full wall
length panels will be possible though panel sizes will be standardised to some extent
and the window range also reduced to about 12 sizes. Some degree of customisation
12will be possible within the standard range of panels. Advantages are foreseen in time
savings (typically 5 week savings for a house), reduced need for skilled labour, and
purchase of materials and fittings directly in bulk from manufacturers.
4.4 Current activity among panel prefabricators
There are already some panel systems in use in New Zealand, including reconstituted
wood panel systems (e.g. Metra), in which wall panels include openings cut out at the
factory.
Prefabricators such as Stanley in Matamata make custom panels, as well as modules
(student accommodation, washroom pods, etc.) and classrooms. They emphasise the
need for sufficient time to plan the complete construction process for use of
prefabrication. As an example, consider the commercial building in Figure 3 where
reduced on-site construction time is critical because of disruption to existing activities on
the site. The example assumes the overall procurement duration is the same between
traditional and prefabrication approaches.
Figure 3 Typical time lines for procurement
Small commercial building (one‐off design)
Weeks
Design & On‐site
Prefab panels Consent Lead time Construction Total
Traditional 4 4 1 12 21
Prefabrication 13 4 1 3 21
Because prefabrication allows for such a reduction in on-site construction, the time
allowed for design and prefabrication is far higher, at up to 13 weeks in our example.
One reason why the time to prefabricate may be substantially less than 13 weeks is that
making the panels could overlap with some of the other processes.
Objections from the builders, discussed above, can be overcome, but will require careful
planning and attention to detail.
In practice, prefabrication is often chosen because of shortened time frames, so the
period available for design is less than indicated in the example, but it is vital to allow
sufficient time for design and planning so that on-site time is reduced as far as
possible.
eHome Global produces timber framed panels at its plant in Kumeu including fully clad
and lined exterior panels, and interior panels. Erection of stand-alone single storey
housing on a slab is typically done in 1 or 2 days including a prefabricated roof. HNZC
have contracted with eHomes for 85 houses and house extensions to be delivered over
the next two years in Auckland. They also expect their panels to be used in low rise
apartments, up to 4 storeys high, in the private sector.
The Home Advantage Group (Hobsonville Land Co, Auckland Council, Building and
Construction Productivity Partnership, MBIE and Beacon Pathway) in February 2014
13asked for proposals for an off-site housing construction pilot project.2 The project is to be
based in Christchurch and an at-scale pilot of 300 to 500 homes is planned to prove the
business model. The aim is to provide affordable and sustainable housing. It is possible
above code sustainable features will be included within the houses and some financial
assistance may be provided to owners, though these details are yet to be announced. It
is possible that some of the output from the NZ Panelised venture will be used in the
pilot.
There are also other panel systems such as Autoclaved Aerated Concrete (AAC),
Structural Insulated Panel (SIP), and Cross Laminated Timber (CLT) panels, and the
solid wood systems (Lockwood, Touchwood and Fraemohs) which have been used for
many years and involve a large amount of off-site manufacturing.
2
The Home Advantage Group is one work-stream led by Pure Advantage.
145. POTENTIAL TO GROW S&P IN NEW ZEALAND
The previous chapter highlighted a number of opportunities and challenges to growing
the use of S&P in New Zealand, with emphasis on housing. This chapter estimates the
size of the S&P pie in New Zealand for all building types, if all components that could be
prefabricated are put together off-site, or where standardisation is increased. This leads
into the next chapter, which discusses how S&P could be encouraged in New Zealand.
5.1 Potential for increasing prefabrication
There are two stages in looking at the potential for prefabrication. First, the potential for
prefabrication of each component in a building is assessed by building type. Second,
this potential is multiplied by the dollar value of annual consents to estimate the dollar
value of the prefabrication opportunity.
The proportion of the cost of each building type that each component represents can be
obtained from Rawlinsons (2012). This enables the calculation of the total potential
percentage of a building that can be prefabricated. For example, the frame of a hotel
building is 5.2% of the total value of the building and most can be prefabricated. The
same analysis is done for each element of the building, and a judgement is made as to
whether prefabrication is likely to be cost effective and practically feasible. Those
components that are feasible are added together giving the percentage of the total cost
for that type of building that can potentially be prefabricated.
Consents are almost an exact record of what The potential for prefabrication is the
is built (a small number of consents do not proportion of the build value of each
proceed), so they are used to scale up to get building type that can be prefabricated,
the potential size of the prefabrication multiplied by the total value of each
building type put in place in a given year.
market.3
Figure 4 shows the prefabrication potential for all of the building types used by Statistics
New Zealand. Rawlinsons data was used to find the percentage of the total value for
each building component that makes up each building type. Each building component
was then assessed to determine whether it could be prefabricated, could be partly
prefabricated, or could not be prefabricated. The percentages for the elements that could
be prefabricated were added together to show the potential for prefabrication of each
building type (by percentage of total building cost). For example, 45% of the total cost
of stand-alone houses are judged to be suitable for prefabrication.
We used 2013 calendar year consents data to estimate the potential total value of
building components that could be prefabricated in a year (appreciating that the mix of
different building types produced in any year can vary significantly, especially for non-
residential building types).
3
See the appendix in the back for the detailed analysis of prefabrication potential by building component.
15Figure 4 indicates that two types of building have potential for high percentage of
prefabrication content. The first are utilitarian buildings without much finish, e.g.
warehouses, factories and prisons. The second type are fairly high-spec buildings which
have some repetition in their spaces e.g., apartments, education buildings, supermarkets
hospitals, and fast-food restaurant chains.
Figure 4 Prefabrication potential by percentage, 2013 consent values
Potential for prefabrication
Potential Prefab
Statistics NZ types and coding Prefab % $M
101 House - not attached to other 49% $2,773
103 Apartment block - attached vertically (10 or more units) 75% $243
770 Office and administration 63% $234
551 Warehouse 73% $177
352 School facility 73% $170
102 Unit/Flat/Townhouse/Studio - attached & unattached horizontally 51% $157
601 Factory 70% $152
204 Prison dormitory 71% $118
103 Apartment block - attached vertically (0-9 Units) 60% $103
751 Retail outlet - shop, hairdresser, travel agent, real estate 46% $86
569 Other storage buildings 73% $84
301 Hospital 74% $83
753 Supermarket 72% $69
519 Other entertainment, recreational and cultural building 64% $65
719 Other farm building 40% $56
354 University 73% $49
154 Garage 55% $34
701 Milking shed 40% $30
353 Tertiary facility - polyt, college of education 73% $25
302 Rest home - convalescence 34% $24
605 Workshop - eg. Electrical or vehicle repairs 51% $23
507 Cinema, theater 64% $21
619 Other factory and industrial building 68% $18
219 Other long term accommodation 43% $17
169 Other outbuildings of residential building 39% $17
602 Industrial 68% $16
451 Religious buildings 48% $13
407 Creche 49% $13
752 Restaurant, bar, tavern and cafeteria 46% $12
402 Airport terminal, rail station 50% $11
501 Museum, art gallery 54% $11
862 Sewage and drainage system (treatment plant) 59% $11
251 Hotel 74% $11
16Potential for prefabrication (Continued)
Building type Prefab % $M
304 Medical centre, consulting room, surgery 30% $10
754 Service station 50% $10
504 Sports facility, eg. Stadium 54% $8.9
319 Other health building 36% $8.8
554 Parking building 66% $8.5
552 Cool store 62% $7.3
201 Hostel (school, uni hostel, nurses, etc.) 43% $7.2
502 Library 54% $6.4
408 Police station, court house 52% $6.2
704 Tunnel/glasshouse 40% $6.1
269 Other short term accommodation 49% $5.8
705 Covered yards 40% $3.9
706 Implement shed 40% $3.9
252 Motel 46% $3.8
409 Fire station, ambulance station 48% $3.3
152 Carport - boatshed, car deck 65% $3.3
351 Kindergarten, playcentre 49% $3.3
505 Clubroom 40% $3.3
151 Sleepout 39% $2.9
506 Gymnasium, fitness centre 52% $2.9
405 Public toilets 40% $2.8
759 Funeral parlour, crematorium 53% $1.8
369 Other educational building 45% $1.5
606 Research laboratory 36% $1.4
104 Granny Flat - unattached 50% $1.4
253 Motor camp facility 35% $1.4
757 Vet surgery 30% $1.3
556 Wool store 73% $1.3
555 Hangar 30% $1.2
603 Sawmill 39% $1.1
355 Training building 45% $1.1
206 Workers quarters 34% $1.1
604 Freezing works and abattoir and other structures, eg. Covere 35% $0.9
758 Studio - artist and photographer 34% $0.7
Total $5,059
Total excluding houses, apartments and units $1,784
In total, more than $5 billion worth of prefabrication could have been undertaken in 2013
if all components that are relatively easily prefabricated were. Yet our earlier analysis,
in Figure 10, suggests that at present, only around Based on the current mix of
$2.95 billion of prefabrication was undertaken in building projects, a further $2.1
2013. In other words, we could conservatively billion of prefabrication per year is
estimate, based on the current mix of residential possible, spread across residential
and non-residential building, an additional $2.1 and non-residential projects.
17billion in prefabrication is possible today. This $2.1 billion is spread across residential
($760 million) and non-residential ($1.34 billion) construction.
5.2 Potential for standardisation
The same analysis was carried out for potential value of standardisation as was done
above for prefabrication. The results are in Figure 3. The individual percentages are
lower for each building type, compared to prefabrication. Also the dollar values are
lower, as expected, because while standard components can generally all be pre-
fabricated, prefabricated components are not necessarily standardised within each
category. Even so, the ranking of building types is similar in Figure 4 and Figure 5.
The larger percentages of standardisation potential in the table are for apartments,
schools, service stations and flats, and already we see some use of standard
components in these building types. In apartments, the standardisation potential is within
a building and it is not suggested that the buildings need to look the same, but use of
standard components such as common kitchen and bathroom modules is feasible.
Note that these values (of up to $2.7 billion) form a sub-set of the estimate of potential
for prefabrication set out in Figure 4.
18Figure 5 Standardisation potential by percentage, 2013 consent values
Potential for standardisation Potential standardisation
Statistics NZ types and coding % $M
101 House - not attached to other 23% $1,318
103 Apartment block - attached vertically (10 or more units) 73% $235
770 Office and administration 56% $208
102 Unit/Flat/Townhouse/Studio - attached & unattached horizontally 56% $174
352 School facility 64% $148
551 Warehouse 47% $114
601 Factory 42% $91
103 Apartment block - attached vertically (0-9 Units) 53% $90
204 Prison dormitory 48% $79
753 Supermarket 45% $43
701 Milking shed 47% $35
154 Garage 55% $34
719 Other farm building 15% $20
569 Other storage buildings 15% $17
353 Tertiary facility - polyt, college of education 46% $16
301 Hospital 14% $15
302 Rest home - convalescence 20% $14
754 Service station 60% $11
354 University 14% $10
602 Industrial 40% $9.4
169 Other outbuildings of residential building 21% $9.0
251 Hotel 47% $6.7
219 Other long term accommodation 16% $6.4
407 Creche 23% $6.2
408 Police station, court house 49% $5.9
451 Religious buildings 18% $5.1
705 Covered yards 47% $4.6
706 Implement shed 47% $4.6
151 Sleepout 53% $4.0
752 Restaurant, bar, tavern and cafeteria 13% $3.5
201 Hostel (school, uni hostel, nurses, etc.) 16% $2.7
704 Tunnel/glasshouse 15% $2.2
104 Granny Flat - unattached 70% $2.0
552 Cool store 16% $1.9
505 Clubroom 22% $1.8
554 Parking building 13% $1.7
152 Carport - boatshed, car deck 33% $1.7
252 Motel 18% $1.5
Total $2,754
Total excluding houses, apartments and units $937
196. ENCOURAGING PREFABRICATION
Barriers to uptake of prefabrication have been mentioned in the literature review. These
include high initial cost, uncertainty about continuing supply and whether the market is
large enough to support prefabrication, the joining of components on-site, risk of damage
to interior walls and linings, and planning and building regulations. Some literature
further cites owner and designer resistance to prefabrication.
Perhaps the greatest challenge, however, is a lack of expertise and knowledge of the
merits of prefabrication among those who provide advice to people wanting to build, as
highlighted in the earlier literature review. Quantity surveyors are often the main cost
advisor and their expertise is mainly in costing building elements using historic data.
They do not always understand the quality and time advantages of prefabrication.
Further, all prefabricators stress the need for early involvement of the various players to
get the best out of prefabrication, i.e. client, designers, fabricators and constructors.
6.1 Who benefits most from prefabrication?
Perhaps the key question to encouraging uptake is to better understand who benefits
most from the prefabrication process. Our earlier analysis has suggested that
prefabrication is not always cheaper in a simplistic sense (lowest cost upfront). However,
benefits do include quality, construction time, and time certainty, reduced health and
safety incidences, bypassing skill shortages, and cost certainty. By examining who
within the value (and supply) chain is most likely to benefit from these advantages, we
can better understand who is most likely to drive S&P and/or where education and
awareness may need to be targeted to improve uptake.
We consider the various players in the prefabrication supply and value chain, starting
with the home buyer, and working back to the manufacturer or prefabricator. Specifically,
we consider in a qualitative sense, the pros and cons of prefabrication for each of the
following:
The home building buyer (rather than a buyer of a spec-built home)
The large-scale building company that runs several projects at one time
The small-scale building company or sub-contractor that undertakes work directly
on site, probably one job at a time
The existing prefabricator
The existing manufacturer that may consider a move into prefabrication.
We note that attendance by designers at the recent PrefabNZ conference indicates that
interest in S&P among designers is relatively strong. Designers may have a role in
encouraging uptake by outlining the benefits of S&P to their clients. More S&P will
enable them to be better assured of quality and on occasion offer wider design options.
For those designers who also project manage construction, it may also allow more
project completions per year. Nevertheless, the overall monetary benefits to designers
are expected to be relatively small compared to the benefits to others in the value chain.
20Figure 6 presents a summary of the potential benefits and costs for each player in the
supply chain, including a view based on discussions with the industry as to the relative
scale of the benefits and costs, using a five point scale.
Figure 6 Benefits, costs and risks of an increase in quality prefabrication
21The discussion that follows specifically addresses the following question:
What are the benefits and costs to each of players in the supply chain should there
be a significant increase in high standard prefabrication in the residential building
sector?
Two points to note from this specific question are that:
The discussion that follows assumes a successful prefabrication industry that
produces a quality product, as is the case in European prefabrication. The
assumption underlying the discussion is that the prefabrication being considered
is not of the lowest possible cost with a commensurate decline in quality. Instead,
the assumption is that the prefabrication envisaged will successfully apply best
practice processes and quality management to produce quality prefabricated
housing components within a manufacturing environment.
Our discussion uses the residential sector as a practical example, but there is no
reason why “home buyer” could not be replaced with “prefabricated construction
services buyer”. As this report highlights, there is potential for prefabrication in
schools, prisons, hospitals, and even bridge- and road-building.
6.1.1 The home buyer
This discussion assumes a house incorporating more prefabrication is being built
specifically for a home buyer, whether it is a one-off design or an off-the-plan build (with
or without changes to that plan).
The home buyer, like the purchaser of any service, wants a quality product delivered on
time and within budget. An increase in prefabrication would support these objectives by:
Reducing the time taken to build a house: One of the key benefits of
prefabrication is that more work is done undercover in a factory environment, so
less work is done on-site, where weather Benefits of prefabrication for
interrupts work, and where there are often delays the home building buyer are
between different trades or materials arriving on mostly related to time savings
site to complete the next stage of work. and quality improvements.
This benefit has tangible and intangible value to the house buyer. If they are
currently renting or paying a mortgage on another home, it has the tangible benefit
of reducing the time they spend paying for two properties. Intangible benefits
include seeing the dream of building their own house realised more quickly.
Improving time certainty: While many building companies offer guarantees of
some sort, they are usually subject to weather, and almost never include a penalty
clause for failure to complete on time. Once again, by more work being done off-
site where weather is not a factor, and where all the relevant trades work together
under one roof, there is far more likelihood that the build will be finished on time.
Again, this increased certainty of completion date has direct tangible and intangible
benefits for the home buyer through potential cost savings and the reduced
uncertainty associated with a more drawn-out build process.
22You can also read