Assessing the post-release effects of capture, handling and placement of satellite telemetry devices on narwhal (Monodon monoceros) movement ...
←
→
Page content transcription
If your browser does not render page correctly, please read the page content below
Volume 9 • 2021                  10.1093/conphys/coaa128

                                                                                                                              Research Article

Assessing the post-release effects of capture,
handling and placement of satellite telemetry
devices on narwhal (Monodon monoceros)

                                                                                                                                                             Downloaded from https://academic.oup.com/conphys/article/9/1/coaa128/6067277 by guest on 26 May 2021
movement behaviour
Courtney R. Shuert1, *, Marianne Marcoux2 , Nigel E. Hussey1 , Cortney A. Watt2,3 and Marie Auger-Méthé4,5

1 Department of Integrative Biology, University of Windsor, Windsor, ON N9B 3P4, Canada
2 Arctic Aquatic Research Division, Fisheries and Oceans Canada, Winnipeg, MB R3T 2N6, Canada
3 Department of Biological Sciences, University of Manitoba, Winnipeg, MB R3T 2N2, Canada
4 Department of Statistics, University of British Columbia, Vancouver, BC V6T 1Z4, Canada
5 Institute for the Oceans & Fisheries, University of British Columbia, Vancouver, BC V6T 1Z4, Canada

*Corresponding author: Department of Integrative Biology, University of Windsor, Windsor, ON N9B 3P4, Canada. Email: cshuert@gmail.com

..........................................................................................................................................................

Animal-borne telemetry devices have become a popular and valuable means for studying the cryptic lives of cetaceans.
Evaluating the effect of capture, handling and tagging procedures remains largely unassessed across species. Here, we
examine the effect of capture, handling and tagging activities on an iconic Arctic cetacean, the narwhal (Monodon monoceros),
which has previously been shown to exhibit an extreme response to extended capture and handling. Using accelerometry-
derived metrics of behaviour, including activity level, energy expenditure and swimming activity, we quantify the post-release
responses and time to recovery of 19 individuals following capture and tagging activities considering the intrinsic covariates of
sex and individual size and the extrinsic covariates of handling time and presence of a ‘bolt-on’satellite telemetry device. From
accelerometer-derived behaviour, most narwhals appeared to return to mean baseline behaviour (recovery) within 24 hours
after release, which was supported by longer-term measures of diving data. None of the covariates measured, however, had
an effect on the time individuals took to recover following release. Using generalized additive models to describe changes
in behaviour over time, we found handling time to be a significant predictor of activity levels, energy expenditure and
swimming behaviour following release. Individuals held for the longest period (>40 min) were found to display the largest
effect in behaviour immediately following release with respect to swimming behaviour and activity levels. We also found
some support for relationships between activity levels, energy expenditure and swimming activity and two other covariates:
sex and the attachment of a bolt-on configuration satellite tags. Our results indicate that narwhals recover relatively quickly
following capture, handling and tagging procedures, but we suggest that researchers should minimize handling time and
further investigation is needed on how to mitigate potential effects of bolt-on satellite tags in these sensitive species.

Key words: Arctic, cetacean, accelerometry, behaviour, handling response
Editor: Steven Cooke
Received 21 July 2020; Revised 1 December 2020; Accepted 4 December 2020
Cite as: Shuert CR, Marcoux M, Hussey NE, Watt CA, Auger-Méthé M (2021) Assessing the post-release effects of capture, handling and placement of
satellite telemetry devices on narwhal (Monodon monoceros) movement behaviour. Conserv Physiol 9(1): coaa128; doi:10.1093/conphys/coaa128.

..........................................................................................................................................................

..........................................................................................................................................................
© The Author(s) 2021. Published by Oxford University Press and the Society for Experimental Biology.
This is an Open Access article distributed under the terms of the Creative Commons Attribution License (http://creativecommons.org/licenses/            1
by/4.0/), which permits unrestricted reuse, distribution, and reproduction in any medium, provided the original work is properly cited.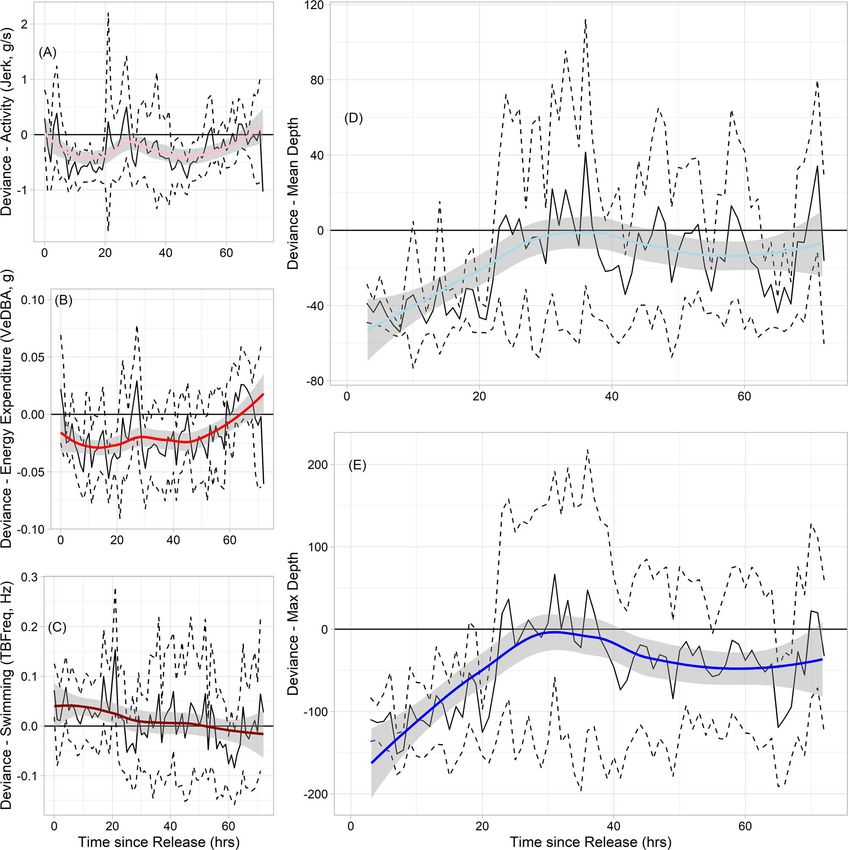
Research Article                                                                                           Conservation Physiology • Volume 9 2021
..........................................................................................................................................................

Introduction                                                                   dimorphism, both in terms of body size and most notably, by
                                                                               the presence of a tusk that primarily occurs in males (Reeves
Telemetry technology has advanced substantially over the                       and Tracey, 1980; Petersen et al., 2012; Heide-Jørgensen,
past few decades resulting in sophisticated electronic tags or                 2018). In the Canadian Arctic, narwhals typically spend the
tag packages that are now smaller than ever (Evans et al.,                     largely ice-free summer months in and around fjords, inlets
2013; Lennox et al., 2017). Animal-borne telemetry devices                     and sounds (Heide-Jørgensen et al., 2013). Using animal-
are particularly useful for the study of aquatic animals for                   borne telemetry devices, previous work has documented their
which direct observation is often prohibited by a cryptic                      yearly life cycle and movement patterns (Heide-Jørgensen
lifestyle or for those that live in remote and largely inaccessi-              et al., 2002, 2006; Laidre and Heide-Jørgensen, 2005),
ble environments (Walker et al., 2012; Hussey et al., 2015). To                deep-diving capabilities (Laidre and Heide-Jørgensen, 2005;
date, telemetry devices have provided unprecedented insights                   Heide-Jørgensen et al., 2015; Watt et al., 2015), responses
into migration routes and timing (e.g. Hauser et al. 2014),                    to predators (Laidre et al., 2006; Breed et al., 2017), novel

                                                                                                                                                             Downloaded from https://academic.oup.com/conphys/article/9/1/coaa128/6067277 by guest on 26 May 2021
diving behaviour (e.g. Owen et al., 2019), three-dimensional                   behaviours such as upside-down swimming at depth (Dietz
movement (e.g. Fahlman et al., 2008), swimming speed (e.g.                     et al., 2007) and potential for extreme sensitivity to future
Williams et al., 2004) and physiology (e.g. Andrews and                        climate scenarios (Williams et al., 2011). However, studies
Enstipp, 2016). While these data are proving powerful in                       have also revealed disturbance associated with extended
management and conservation contexts (Brooks et al., 2017;                     animal handling during the capture and tag attachment
Hays et al., 2019), there is increasing awareness of animal wel-               process (Williams et al., 2011, 2017a). The response of
fare related to invasive tagging procedures that has naturally                 individuals to handling periods greater than 60 minutes
led to a call from regulatory agencies for the development                     was characterized by extreme bradycardia coupled with
of taxon-specific guidelines for their application (Gales et al.,              higher swimming effort and deep diving (Williams et al.,
2009). Many refinement frameworks also highlight the need                      2017a). Such a strong response by narwhals post-tagging is
to assess considerations on a species-specific level (Hawkins,                 concerning and highlights the need for a greater understand-
2004) as well as across all aspects of experimental design for                 ing of the effects of capture, handling and tagging beyond the
biologging studies (Casper, 2009). As a result, several expert                 first 90 minutes post-release that were the focus of Williams
groups pooled collective knowledge from field activities, as                   et al. (2017a).
well as previous work assessing the use and placement of
telemetry devices, to create best practice recommendations                         Animal-borne accelerometers provide a tool to quan-
for pinnipeds (Horning et al., 2017b, 2019) and cetaceans                      tify behavioural effects following capture and tagging
(Andrews et al., 2019). These best-practice recommenda-                        events through recording high-resolution, continuous three-
tions provide an important framework moving forward and                        dimensional movement data over time. Several metrics of
emphasize the need for data to examine how animal handling                     behaviour have been extracted from accelerometry data
and the placement of telemetry devices potentially impact                      across a wide variety of species, including changes in activity
health, behaviour and survival of marine mammals.                              levels (norm of jerk, defined as the square-root of the sum of
                                                                               squares for differential of acceleration in all axes; Ydesen et al.
   Cetaceans, especially, have seen a rapid increase in the                    2014; Barkley et al. 2020), approximate energy expenditure
number of individuals fitted with telemetry devices over                       (Vectorial Dynamic Body Acceleration, VeDBA; Broell
recent years (McIntyre, 2014; Andrews et al., 2019). These                     et al., 2016; Stothart et al., 2016; Udyawer et al., 2017) and,
telemetry devices are generally attached using either a non-                   most often for aquatic animals including narwhal, swimming
invasive method, such as suction cup mounting (Goldbogen                       behaviour (tail-beat frequency or stroke rate; Williams et al.
et al., 2013), or through more invasive anchored mounts                        2004, 2017a, b; Sato et al., 2007; Martin Lopez et al., 2015;
along the dorsal fin or ridge, such as the ‘limpet’-style tag                  Ladds et al., 2017). Diving response has also been shown
(Andrews et al., 2015), and can often be attached without                      to be a key indicator of how individuals and populations
directly restraining individuals by using a pole or cross-                     respond to disturbance (DeRuiter et al., 2013; Miller et al.,
bow to achieve short-term (days) and medium-term (weeks)                       2015; Williams et al., 2015; van Beest et al., 2018; Warren
deployment durations. Attachment techniques for long-                          et al., 2020). Quantifying the degree of departure of animal
term deployments (months) using ‘bolt-on’ configurations,                      behaviour from the normal or baseline values following
however, often require capture and handling (Balmer et al.,                    capture and tagging events and the length over which
2011; Heide-Jørgensen et al., 2017). While researchers follow                  detrimental effects modify behaviour remains an important
best practices for capture, handling and tag attachment,                       part of holistically evaluating research activities (Wilson and
approved through Animal Care Committees in respective                          McMahon 2006). Through the use of data from individuals
organizations, assessments of the impact of these procedures                   equipped with biologging devices, it is possible to assess
on cetaceans are limited (Andrews et al. 2019).                                across- and within-individual changes in behaviour following
                                                                               capture and tagging using the above metrics. Specifically, a
   Narwhals (Monodon monoceros) are an iconic medium-                          return to a long-term mean in a given behavioural index (i.e.
sized odontocete and a culturally important species ranging                    baseline behaviour), provides an indicator of recovery for that
across much of the Eastern Arctic. Narwhals exhibit sexual                     metric following invasive research activities.

..........................................................................................................................................................
2
Conservation Physiology • Volume 9 2021                                                                                                 Research Article
..........................................................................................................................................................

   We used a combination of behavioural metrics derived                        An 11-mm stainless steel tube sharpened at one end was
from accelerometers coupled with dive data to characterize                     used to cut a path for insertion of each pin into the dorsal
both the post-release behaviour and the time to return to                      ridge. Custom-made lock washers were then placed on the
baseline behaviour of narwhals following capture and tagging                   pin to the point of skin contact with no pressure. Washers
events across three independent field programs. Specifically,                  were locked in place and pins trimmed flush to the outer-
we aimed to characterize activity levels, energy expenditure                   side of the washer. Stainless steel cables attached to the tag
and swimming behaviour across- and within-individuals fol-                     were inserted through the washers, adjusted to the desired
lowing release from capture and tagging events to assess                       length and crimped to secure the tag to the animal (Orr
the effect of handling time on these behavioural metrics for                   et al., 2001). All capture and tagging protocols were approved
the first 72 hours post-release (defined by the accelerome-                    by the Fisheries and Oceans Animal Care Committee and a
ter sampling duration). Furthermore, we examined time to                       License for Scientific Purposes was granted.
recovery to baseline behaviour (measured here as the return
                                                                                  Of the 29 narwhal captured over the three field seasons,

                                                                                                                                                             Downloaded from https://academic.oup.com/conphys/article/9/1/coaa128/6067277 by guest on 26 May 2021
of individual deviance of baseline behaviour to zero, baseline
measured beyond 36 hours after release) and assessed if key                    20 were outfitted with a telemetry device that included an
covariates (sex, handling time and the presence of a bolt-                     accelerometer unit; either an Acousonde™ (n = 13; Model
on tag) may have influenced behaviour and recovery times.                      B003B, Greeneridge Sciences, Inc.), a daily diary (n = 3; TDR-
By using longer-term measures of dive behaviour (baseline                      DD, Wildlife Computers, Inc.) or a Maritime BioLoggers
measured 7–14 days post-release), we further aimed to deter-                   (MBL) accelerometer (n = 4). Accelerometers (Acousounde,
mine if the relatively short behavioural window provided by                    TDR-DD and MBL) were fixed within recoverable biologging
acceleration data accurately captured the period of recovery                   packages that consisted of a float for recovery (i.e. to bring
in narwhals.                                                                   the device to the surface) and a SPOT and VHF tag to locate
                                                                               the unit once at the surface. Accelerometer packages were
                                                                               attached to the narwhal posterior to the dorsal ridge via
                                                                               a suction cup and/or tethered line attached to one pin of
Methods                                                                        the main satellite tag via release timers (Little Leonardo; see
                                                                               above, Fig. 1, Table 1). Accelerometers were programmed to
Study site and capture, handling and                                           remain attached on animals for 3 to 7 days (mean deployment
tagging protocols                                                              duration 53.9 hours). The Acousonde units primarily sampled
                                                                               high-resolution acoustic data, but were also programmed to
Over three summer seasons in 2012, 2017 and 2018, a total                      sample tri-axial magnetometry and acceleration as well as
of 29 narwhals were captured and equipped with satellite                       other auxiliary data channels including light level, pressure
transmitting tags and/or recoverable biologging devices in                     and temperature (Burgess, 2009). Sampling rate was set at
Tremblay Sound (72◦ 21.389 N, −81◦ 05.855 W) on northern                       800 Hz, but for the purposes of this study was subsampled at
Baffin Island, Nunavut, Canada (see Table 1). Tagging efforts                  50 Hz (± 4 g). One individual Acousonde unit, however, failed
were part of a larger program to monitor ecosystem-wide                        to collect acceleration data and was not considered further in
health in the high Arctic led by Fisheries and Oceans Canada’s                 the analysis. MBL units were programmed to sample acceler-
long-term marine mammal monitoring program.                                    ation at 50 Hz with a 4 g range. The TDR10-Daily Diary tag
    Narwhal were captured following standard protocols                         was housed in a float pack with a SPOT5 tag from Wildlife
and monitored by a veterinarian (Orr et al., 2001; Heide-                      Computers. Each float pack unit was suction cupped onto the
Jørgensen et al., 2015). In brief, a 50 m x 10 m gill net was                  side of the narwhal dorsal ridge and were not tethered to the
set perpendicular to shore and monitored by a minimum of                       satellite tag. The SPOT5 tag provided location information
two people for the entire period set. Immediately following                    useful for relocating the tag after release from the animal,
a narwhal entering the net, two boats were deployed: the                       while the Daily Diary tags sampled high-resolution acceler-
first to locate the animals and pull the net to the surface to                 ation, orientation and speed (via paddle wheel), through the
allow the individual/s to breathe and the second to release                    use of an accelerometer and magnetometer, and also include
the net from the anchor buoy. Following release, a shore                       measurements of depth, temperature and light (Wilson et al.,
based team pulled the net to the beach, securing individual                    2008). Daily Diary tags sampled acceleration at 16 Hz ± 2 g.
narwhal in approximately 50 cm of water with animals                           For one individual equipped with a TDR-DD, the tag fall off
facing out to deeper water. A padded rope loop was applied                     within one hour of deployment and consequently it was not
around the tail stalk and the animal was disentangled from                     included in analysis.
the net. Captured narwhal were then held by a minimum
of four experienced handlers and equipped with satellite                       Post-release behaviour assessed using
transmitting tags (various models including TDR10, Wildlife
Computers, Inc. and CTD Oceanography SRDL with GPS,
                                                                               accelerometer-derived metrics
SMRU Instrumentation used to derive dive behaviour, see                        We used three behavioural metrics of energy expenditure,
below) via spider wires crimped to three sub-dermal 10 mm                      swimming behaviour and activity levels from accelerometer
pins made of Tecaform™ sterilized in Ethylene Oxide gas.                       data to examine post-release behaviour. First, we used a

..........................................................................................................................................................
                                                                                                                                                         3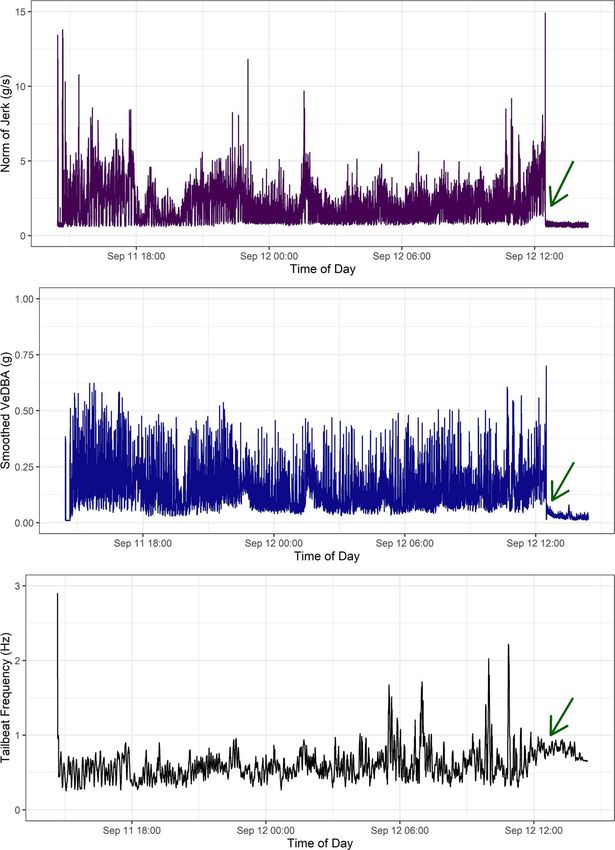
Research Article                                                                                            Conservation Physiology • Volume 9 2021
..........................................................................................................................................................

Table 1: Summary of study animals, including animal sex, animal length (cm), age class (adults classified as body length, >300 cm; Hay 1984),
minutes held follow capture and prior to release (tcap ) and the presence of a satellite tag attached via ‘bolt-on’ configuration. The type of
accelerometer (ACC-type) is also included. The number of hours of acceleration data recorded while attached to each narwhal is also included
(hours); however, several tags were programmed with delays in recording for a period of up to 4 hours (indicated by the ∗ )

      Animal              Sex           Length (cm)          Age class          tcap (min)        Bolt-on tag?           Hours            ACC type
      12–03                F                 390               Adult                30                  Y                  5               TDR-DD
      12–05                F                 262             Juvenile               30                  Y                 15               TDR-DD
      17–03                F                 400               Adult                36                  Y                182∗                MBL
      17–04                M                 432               Adult                47                  Y                 38∗                MBL
      17–05                M                 488               Adult                67                  Y                 48∗                MBL

                                                                                                                                                             Downloaded from https://academic.oup.com/conphys/article/9/1/coaa128/6067277 by guest on 26 May 2021
      17–08                F                 375               Adult                37                  Y                 83             Acousonde
      17–09                F                 385               Adult                36                  Y                 70∗            Acousonde
      17–10                M                 400               Adult                30                 N                 189∗                MBL
      17–11                F                 390               Adult                39                  Y                 12∗            Acousonde
      17–12                F                 425               Adult                25                  Y                 15∗            Acousonde
      17–13                M                 298             Juvenile               36                  Y                 26∗            Acousonde
      17–14                M                 230             Juvenile               18                 N                   3∗            Acousonde
      17–18                F                 370               Adult                31                  Y                 11             Acousonde
      17–19                F                 380               Adult                35                  Y                 15             Acousonde
      17–20                F                 408               Adult                35                  Y                 22             Acousonde
      18–02                F                 357               Adult                34                  Y                112∗            Acousonde
      18–03                M                 303               Adult                35                 N                  19∗            Acousonde
      18–04                F                 382               Adult                23                 N                 107∗            Acousonde

smoothed vector of Vectorial Dynamic Body Acceleration                         or wiggle from the tag attachment (Cade et al., 2017); any
(sVeDBA) as a proxy for coarse energy expenditure (Miwa                        spikes in frequency above 1 Hz remaining are likely due to
et al., 2015; Broell et al., 2016; Udyawer et al., 2017; Grémillet             artefacts from a quick movement experienced by the tag or
et al., 2018; Wilson et al., 2019). To derive static acceleration              where suction cups may have been dislodged (Fig. 2).
(relative animal body position and postural dynamics with
respect to gravity), raw acceleration data for each deployment                    We were interested in how these three behavioural metrics
were first low-pass filtered in each axis at 0.1 Hz (Shepard                   estimated for each narwhal deviated from long-term mean
et al., 2008). Dynamic acceleration was then derived by                        values following release from capture, handling and tagging
subtracting static acceleration from raw acceleration data in                  activities. For modelling purposes, each accelerometer-derived
each axis (Shepard et al., 2008) and VeDBA estimated by                        behavioural metric was summarized as an hourly mean value.
taking the vectorial sum of dynamic acceleration across all                    To calculate within-individual deviance for each metric, we
three orthogonal axes and smoothing using a 3 s moving                         calculated a pooled mean value using data beyond the first
window (Fig. 2; Stothart et al. 2016). Second, to quantify                     36 hours to act as a baseline. Pooled mean values were sep-
activity level, the derivative of acceleration, jerk, was calcu-               arated by tag types to account for differences in attachment
lated by taking the differential of raw acceleration in each                   set up (Acousonde and MBL/TDR-DD; see Table 1). These
axis and then computing the norm of jerk (Fig. 2; Ydesen                       pooled means were then subtracted from hourly mean values
et al. 2014). Third, we estimated tail-beat frequency per                      for each individual/tag type in order to calculate within-
second as a measure of swimming behaviour. Tail-beat fre-                      individual deviance for each behavioural metric. While any
quency (TBFreq) was derived through fast Fourier transform                     pooled mean value for ‘baseline behaviour’ would ideally be
of dynamic acceleration in the Z-axis, approximating dorso-                    derived from data several days post-release for each indi-
ventral movement, within a 9-second moving window around                       vidual separately (e.g. Dechen Quinn et al. 2012), we were
each second to minimize spectral leakage. The primary fre-                     limited in sampling duration for many of the accelerometers
quency was extracted at each second (Fehlmann et al., 2017).                   because most units detached from the narwhals earlier than
Derived TBFreq was then smoothed using a running mean of                       expected (e.g. only 6 individuals had usable acceleration
60 seconds to remove flow noise associated with swimming                       data > 48 hours post-release; Table 1). As a result of this

..........................................................................................................................................................
4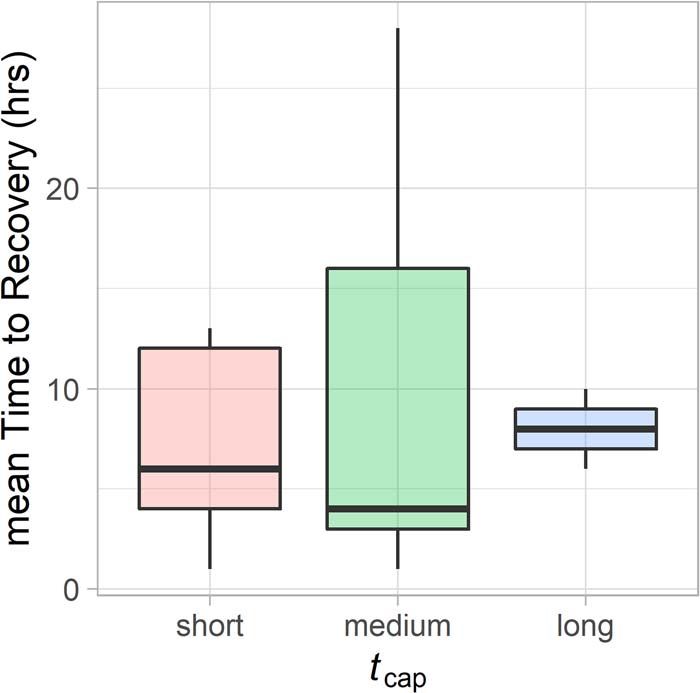
Conservation Physiology • Volume 9 2021 Research Article
..........................................................................................................................................................
Downloaded from https://academic.oup.com/conphys/article/9/1/coaa128/6067277 by guest on 26 May 2021
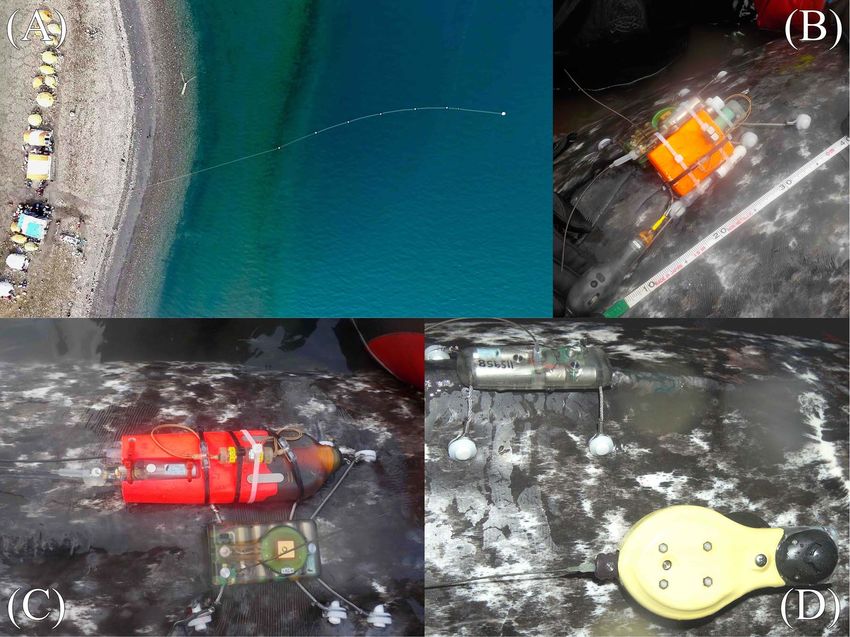
Figure 1: Images showing net deployment anchored perpendicular to shore (A) in Tremblay Sound (72◦ 21.389 N, −81◦ 05.855 W), an example
of attachment of the bolt-on configuration (3 pins) for a TDR-10 satellite tag, and accompanying (B) Maritime Biologgers (MBL) deployment
package with timed release mechanism attached to pins or (C) Acousonde unit attached via both a suction cup mounting and little Leonardo
releases held across the spider wires holding the TDR-10 satellite tag to the dorsal ridge and (D) a Daily Diary (TDR-DD) tag attached with a
suction cup under a bolt-on satellite tag (2 pins).
limitation, we explored variation in the three behavioural plotted for the first 72 hours post-release. The time at which
metrics for the first 72 hours post-release. We are confident mean hourly deviance was no longer significantly different
that this represents an acceptable time frame for assessment from zero was used as a measure of when the population of
given that several studies have noted that post-escape or post- individuals had recovered, i.e. behavioural metrics returned
disturbance behaviour returns to normal within the first few to expected values of ‘normal’ behaviour (Dechen Quinn
hours up to one day across a variety of species (Gales et al., et al., 2012; Thiemann et al., 2013; Rode et al., 2014). Within-
2012; Hastie et al., 2015; Russell et al., 2016; Whitney et al., individuals, the mean time (hour) in which centred-values
2016; Williams et al., 2017a; Blackwell et al., 2018; van Beest were no longer significantly different from zero across all
et al., 2018), and our longer-term diving data indicated that three behavioural metrics (within 95% confidence interval
narwhals recovered within 36 hours (see below). for within-individual deviance) was used to define the point
at which individuals recovered to baseline values or assumed
normal behaviour (Dechen Quinn et al., 2012; Thiemann
Modelling recovery et al., 2013; Rode et al., 2014). Individual recovery points
to baseline values were compared among individuals with
Time to recovery
additional covariates using generalized linear models with a
We determined the time point at which both the population Poisson distribution and log-link and were ranked based on
of narwhal (across-individuals) and individual animals evidence (Zuur et al., 2009). Additional individual covariates
(within-individual) had recovered, or returned to baseline comprised (i) with or without ‘bolt-on’ configuration of
behaviour. Across-individuals, patterns in mean hourly satellite telemetry device, (ii) sex, (iii) age class (adult vs.
deviance for each of the three behavioural metrics were juvenile delineated based on standard length of individuals
..........................................................................................................................................................
5Research Article Conservation Physiology • Volume 9 2021
..........................................................................................................................................................
Downloaded from https://academic.oup.com/conphys/article/9/1/coaa128/6067277 by guest on 26 May 2021
Figure 2: Example of behaviour across the full recording period (∼ 22 hours) for a 3.2 m male narwhal 17–20, including the period immediately
after release. Behavioural metrics include (a) activity levels (norm of jerk), (b) energy expenditure (sVeDBA) and (c) swimming activity (TBFreq),
before the tag fell off just after 12:00 on the second day as indicated by the green arrows.
>300 cm; Hay, 1984) and (iv) handling time (categorical; deviance for each of the accelerometer-derived metrics with a
short: tcap < 30 min; medium: 30–40 min; long: > 40 min). set of generalized additive models. Given we were interested
in how behaviours are modified post-release, our base models
Behavioural response following capture, handling described changes in all three metrics as a function of time
since release (trel ). Relationships were not linear, consequently
and tagging
single thin-plate smoothing splines were applied, with
To understand individual narwhal post-release behaviour an additional shrinkage penalty in order to obtain the
relative to tagging procedures and intrinsic factors (sex simplest spline and allow overly complex relationships
and size), we examined the temporal changes in individual to shrink to zero (Wood 2006). Models were designed
..........................................................................................................................................................
6Conservation Physiology • Volume 9 2021 Research Article
..........................................................................................................................................................
a priori for relationships of interest as well as to deal with first hour (Fig. 4A) and tail-beat frequency was slightly faster
collinearity across model covariates (including satellite tag than normal for the first 24 hours (Fig. 4C). Wide confidence
presence, sex, age class and handling time described above) intervals further highlight high variability in accelerometry-
and relatively small sample size. Each of the categorical derived behaviour following release. Individual recovery
covariates was modelled as either parametric covariates or time points were generally reached within hours following
as varying-coefficient smoothing interactions separately. All release. At the individual level, mean estimated recovery time
generalized additive modelling was performed within the R was 9 hours pooled across the three accelerometer-derived
package ‘mgcv’ (Wood, 2006). All candidate models were behaviours (range, 1–28 hours; excluding two individuals
ranked based on Akaike Information Criterion, corrected for that had < 5 hours of accelerometer data). There was no
small sample size (AICc; Burnham and Anderson, 2002). All significant difference in mean recovery time between male
analyses were conducted using R v.3.6.3 (R Core Team 2020). and female narwhal (β sex = 0.21 ± 0.18, z = 1.15, P = 0.24),
nor with respect to presence of a bolt-on satellite tag
(β tag = −0.10 ± 0.21, z = −0.51, P = 0.61). Binned handling
Downloaded from https://academic.oup.com/conphys/article/9/1/coaa128/6067277 by guest on 26 May 2021
Post-release dive behaviour to validate
time (tcap ) as a predictor mean recovery time across
accelerometry recovery estimates individuals indicated that those held for medium durations
To complement the accelerometer-based time to recovery (30–40 min) occasionally took longer to recover than those
analysis, we investigated diving data collected on a sub- held for shorter durations (40 min) had a higher mean recover time value,
if the 72 hour time frame used for the three accelerometer- however, these were not significantly different from those held
derived behavioural metrics was adequate. While changes in for a short duration (β long = 0.10 ± 0.30, z = 0.35, P = 0.72;
diving behaviour are a useful indicator to investigate post- see Fig. 5). However, all covariates were equal in explanatory
disturbance events (DeRuiter et al., 2013; Miller et al., 2015; power to that of a null model (< 3 AICc; see Table S2).
Williams et al., 2015; van Beest et al., 2018; Warren et al.,
2020), the small sample size of useable time series dive data Dive data indicated that narwhals spent significantly more
limited our capacity to investigate individual differences in time at shallower than average mean and maximum dive
dive behaviour through additive modelling. Diving behaviour depths for the first 24 hours post-release (Fig. 4D, E). After
were derived from satellite telemetry devices (TDR10 and this point, across-individual deviance in both dive metrics
CTD-SRDL; recorded approximately every 75 s) and quan- and their corresponding 95% confidence intervals were not
tified by taking hourly estimates of mean and maximum dive significantly different from the long-term mean (0, based on
depths (meters). To determine the approximate normal dive data from 7–14 days post-release). This lends confidence that
behaviour of an individual, we calculated a long-term average our accelerometer-based analysis was able to capture the post-
of mean and max depths by averaging all data between 7 release recovery period within the 72-hour time frame used.
and 14 days following release. To determine deviance in dive
behaviour across the first 72 hours, the long-term mean value Deviance in narwhal activity level (jerk) was best explained
was then subtracted from both hourly mean and maximum by a thin-plate smooth with shrinkage of trel that varied by sex
dive depths. Identical to our approach for analysing the three and included the parametric effect of binned tcap , explaining
accelerometer metrics, we then used the time when the across- 19.4% of model deviance (Table 2). Individuals who were
individual deviance for mean and maximum dive depth were held for longer periods (>40 min) tended to be more active
not significantly different from 0 as the population-level time in the first 72 hours following release (β Long = 0.26 ± 0.11,
of recovery (Dechen Quinn et al., 2012). t = 2.30, P = 0.02) than those held for short (Research Article Conservation Physiology • Volume 9 2021
..........................................................................................................................................................
Table 2: Model results for time-varying patterns in hourly post-release behaviour of narwhal following capture and handling. Time since release
(trel ) was modelled as a thin-plate smoothing spline with shrinkage. Covariates, including animal sex and the presence of a bolt-on satellite tag
(Sat.tag), and time held in captivity (binned tcap ) were modelled as both parametric terms and as varying coefficient models (‘by =’). Models
including age class were removed from model selection due to insufficient sample size. Best models are highlighted in bold, ranked based upon
Akaike Information Criterion (AICc), corrected for small sample size and deviance explained
Activity Energy expenditure Swimming
Model parameters AICc AICc Deviance AICc AICc Deviance AICc AICc Deviance
explained explained explained
null s(trel ) 1632.18 81.99 5.9% −1894.79 15.21 3.9% −647.54 95.9 1.7%
Sex + s(trel ) 1609.78 59.59 9.6% −1894.57 15.43 4.3% −689.54 53.9 8.7%
Sat.Tag + s(trel ) 1629.2 79.01 6.7% −1889.57 20.43 3.3% −645.81 97.63 1.8%
Downloaded from https://academic.oup.com/conphys/article/9/1/coaa128/6067277 by guest on 26 May 2021
tcap + s(trel ) 1604.3 54.11 10.7% −1898.71 11.29 5.2% −706.66 36.78 11.6%
s(trel , by = Sex) 1571.95 21.76 15.9% −1906.44 3.56 5.8% −649.37 94.07 2.3%
s(trel , by = Sat.Tag) 1651.58 101.39 1.1% −1891.32 18.68 3.2% −652.88 90.56 3.5%
tcap + s(trel , by = Sex) 1550.19 0 19.4% −1910.00 0 7.0% −706.14 37.3 11.7%
tcap + s(trel , by = Sat.Tag) 1620.61 70.42 8.4% −1892.22 17.78 4.0% −714.95 28.49 13.5%
s(trel , by = tcap ) 1569.35 19.16 17.9% −1894.65 15.35 4.2% −737.22 6.22 18.1%
Sex + s(trel , by = tcap ) 1565.63 15.44 18.7% −1893.58 16.42 4.4% −743.44 0 19.1%
Sat.Tag + s(trel , by = tcap ) 1563.66 13.47 19.0% −1889.57 20.43 13.4% −742.29 1.15 19.1%
however, was best explained by a spline function of trel improving issues of drag and cost of transport associated with
that varied by tcap , explaining 18.1% of model deviance carrying telemetry devices (van der Hoop et al., 2018; Kyte
(Table 2). Individuals held for the longest period of time et al., 2019). Here, we used high-resolution accelerometry
(>40 min) displayed a higher than normal swimming activity data to examine the behaviour of individual narwhal follow-
over time (Fig. 3C). There was also evidence to suggest ing routine capture and telemetry device application by way of
that sex or the presences of a ‘bolt-on’ satellite tag may evidence-based model ranking with covariates for individual
have influenced swimming behaviour in the first 72 hours characteristics, handling time and the application of ‘bolt-on’
after release (both explaining 19.1% deviance, Table 2). telemetry devices.
Females and those with ‘bolt-on’ satellite tags were found
to have an overall lower TBFreq, though the overall effect Generally, we found that individual narwhal recovered
size was extremely small (β sex = −0.04 ± 0.01, t = −3.19, quickly from capture and tagging activities. While there was
P = 0.001; β tag = −0.03 ± 0.01, t = −2.55, P = 0.01; Table S1). significant inter-individual variability in the magnitude of
The relatively low percentage of across-individual deviance the response, most individuals appeared to recover in the
explained by all models suggests a high degree of variability first 8 hours following release with respect to accelerometry-
in hourly behaviour data from these accelerometers. Age derived behavioural metrics of activity levels, energy expen-
class was ultimately removed from analyses as a covariate as diture, and swimming behaviour. We also found no evidence
all but one juvenile individual (of n = 3) had data spanning to suggest that handling time had a major impact on recovery
more than 15 hours post-release. Full model output, including time. Other studies linking changes in behaviour have found
significance of the smoothing terms, can be found in individuals recover quickly following pile-driving activities
Table S1. (Russell et al., 2016), mass-stranding events (Gales et al.,
2012) and with respect to tagging events (Whitney et al.,
2016; Warren et al., 2020). Longer-term measures of diving
Discussion behaviour in a subset of these narwhal further supported that
most individuals returned to normal diving patterns within
Evaluating the behavioural responses of individuals follow- the first 24 hours after release. A study on harbour por-
ing tagging and capture events remains an important goal poise (Phocoena phocoena) noted that individuals exhibited
for maintaining and evaluating best practices for telemetry shallower diving following both an initial handling event as
studies in cetaceans. Generally, studies of tagging effects have well as a measured noise dose-response experiment, but also
focused on wound healing assessed by photographic resight- showed that the same individuals appear to have recovered
ing of tagged individuals (Robbins et al., 2013; McIntyre, to baseline behaviour within 24 hours or less (van Beest
2014; Andrews et al., 2015; Best et al., 2015; Gendron et al., et al., 2018). Similar shallow diving has been noted in nar-
2015; Heide-Jørgensen et al., 2017; Norman et al., 2018) or whal in response to predation events and the presence of
..........................................................................................................................................................
8Conservation Physiology • Volume 9 2021 Research Article
..........................................................................................................................................................
Downloaded from https://academic.oup.com/conphys/article/9/1/coaa128/6067277 by guest on 26 May 2021
Figure 3: Plots of the interaction between time after release and sex as well as the additive effects relative to handling time, tcap , for deviance
associated with (A) activity levels and (B) energy expenditure. Changes in swimming behaviour (C) were best explained by the interaction of
time after release and handling time. Modelled behavioural responses relative to the population mean (deviance = 0) is highlighted by the
horizontal dashed line. Data for individuals that were held for the longest time (tcap > 40 min) were only modelled to 50 hours as a result of
limited accelerometry data. The spline calculated for male narwhal (B) was zeroed out as a result of the shrinkage penalty implemented to
prevent overly complex relationships.
..........................................................................................................................................................
9Research Article Conservation Physiology • Volume 9 2021
..........................................................................................................................................................
Downloaded from https://academic.oup.com/conphys/article/9/1/coaa128/6067277 by guest on 26 May 2021
Figure 4: Mean population or across-individual hourly deviance with 95% confidence intervals (solid black and dashed lines, respectively) for
accelerometer-derived behavioural metrics (A) activity levels, (B) energy expenditure, (C) swimming activity and (D, E) dive behaviour for the
first 72 hours following release from capture/tagging events. Deviance was calculated by pooling hourly mean values for accelerometry data
(36+ hours post-release, limited by measurement durations) and dive data (7–14 day hourly mean). Coloured lines represent loess-smoothed
trend lines to further highlight trends in behaviour.
predators (Laidre et al., 2006; Breed et al., 2017), though these 2018). The authors acknowledged, however, that this may be
events resulted in longer disruptions of behaviour than mea- linked to narwhal being outside the feeding grounds as there
sured here. Acoustically-tagged narwhal exhibited a period was no relation to handling time with respect to the time
of silence (no vocalizations) after tagging in East Greenland, to recovery (Blackwell et al., 2018). Sperm whale (Physeter
ranging from 9 to 37 hours after release (Blackwell et al., macrocephalus) tagged with suction cup telemetry devices via
..........................................................................................................................................................
10Conservation Physiology • Volume 9 2021 Research Article
..........................................................................................................................................................
difference in post-release behaviours. Our diving behaviour
proxies also appear to support the work of Williams et al.
(2017a); narwhals here, all held for less than 60 minutes,
generally appeared to dive to and spend the majority of their
time at shallower than normal depths for the first 24 hours
following release (Fig. 4), suggesting that individuals may
have exhibited a temporary flight response. Similar dispersal
to shallow water was noted in narwhal in the days following
an attack by killer whales (Orcinus orca; Laidre et al. 2006).
Even when individuals are not handled, cumulative exposure
to research activities may still drive a similar dive response
(Warren et al., 2020).
Downloaded from https://academic.oup.com/conphys/article/9/1/coaa128/6067277 by guest on 26 May 2021
In addition to handling time, this study also presents some
evidence to suggest that individuals with ‘bolt-on’ satellite
tags had a lower tail-beat frequency following release than
Figure 5: Summary of mean recovery time points (hours) after those without. Several studies have been attempted to deter-
release as a function of handling time (tcap : short, 40 min). Thick black bars in the middle of the devices in a wide variety of species (Walker et al., 2012;
boxes indicate the median value (bounded by the interquartile Andrews et al., 2015, 2019; Shuert et al., 2015; Chivers et al.,
range) for time to recovery for each of the handling durations. 2016; Horning et al., 2017a; Lear et al., 2018). Even when
not found to impact survival, physiological costs associated
with telemetry devices likely exist with respect to increased
drag associated with the disruption of laminar flow across the
pole deployments also displayed lower clicking and buzzing body (Andrews et al., 2015; Andrews and Enstipp, 2016; Kyte
rates, coupled with shallower dives, in the hours following tag et al., 2019). Effect sizes associated with the ‘bolt-on’ tags here
deployment (Warren et al., 2020). were very small with respect to their impact on swimming
behaviour, and we failed to find a significant relationship
Handling time was, however, found to be a significant between ‘bolt-on’ tags and recovery time. While our overall
covariate for the observed deviance in post-release behaviour sample size of individuals is large compared to other studies, it
for narwhals in the current study. Most individuals were held is unlikely that our models had sufficient power to detect any
for an average of 35 minutes, which is at the lower end of han- major behavioural differences as a result of narwhal carrying
dling times reported in previous work (Williams et al., 2017a). a ‘bolt-on’ satellite tag over longer time scales.
Our models suggest that individuals held for longer periods
of time tended to have higher than normal swimming activity Alongside the attachment of a ‘bolt-on’ satellite tag, there
immediately following release, as well as higher activity levels, was also evidence to suggest that individual sex had an
but with little change in energy expenditure. This suggests influence on all accelerometry-derived behaviours in the first
that the few individuals held for greater than 40 minutes 72 hours after release. Models including individual sex and
may have exhibited a greater escape response to handling the presence of a ‘bolt-on’ satellite tag were apparently equal
events than those held for less time (Fig. 3). Previous work in their explanatory power for swimming behaviour (AICc
has noted that narwhals can exhibit extreme responses to < 2; Table 2). Females were found to have both lower activity
handling events, sometimes expressing extreme bradycardia levels and tail-beat frequencies, but this did not appear to
events and escape responses in the first 60 minutes following have a significant effect on recovery time. While age class was
release (Williams et al., 2017a). While Williams et al. (2017a) ultimately removed, individuals with satellite tags were larger,
did not explicitly define a recovery period following tagging older individuals who may simply exhibit slower tailbeat
events, they considered a ‘post-escape period’ as occurring frequencies. Larger whales can be assumed to have larger
45 to 90 minutes after release and found that individuals peduncle muscles in which to create a greater output of
who were held for more than 60 minutes tended to display momentum for each stroke (Goldbogen et al., 2006). This
heart rate and stroke rate relationships more consistent with has been demonstrated in experimental studies of fish species
an escape response and cardiac freeze; those that were held where increased body length scales as a power equation for
for less than 60 minutes appeared to more quickly return both propulsive force, as well as a decrease in the frequency
to normal flight behaviours and cardiac output (Williams et of strokes (Bainbridge, 1958; Ware, 1978; Webb et al., 1984;
al., 2017a). Our accelerometer-derived behaviours appear to Ohlberger et al., 2007). Increased body size has been shown
support this. We found that individuals held for the longest to result in a logarithmic decrease in the cost of transport in
period displayed the largest change in activity and swimming aquatic animals, defined as the energy required to move a unit
behaviour following release, indicating that holding individ- of body mass a unit distance (Schmidt-Nielsen, 1972; Fish,
uals for greater than 40 minutes resulted in a significant 1994). Mammalian studies have used captive surrogates to
..........................................................................................................................................................
11Research Article Conservation Physiology • Volume 9 2021
..........................................................................................................................................................
scale up stroke-by-stroke energy costs to other species and investigations of data following the above approaches to
have shown similar results (Williams et al., 2004, 2017b). determine impact (Wilson and McMahon, 2006). Evidence-
While it was not possible to age these individuals beyond based effects of capture, handling and tagging generated while
coarse size classes, it is likely that this change in both activity in the field would then provide confidence in the approach,
levels and swimming behaviour is a result of differences in while considering the welfare of the animals related to uncer-
body size and development (Noren et al., 2006), but requires tainties such as impacts of climate change and remains a
further investigation. key recommendation of best practice guidelines (Wilson and
McMahon, 2006; Horning et al., 2017b, 2019; Andrews
Long-term attachments of telemetry devices, through inva- et al., 2019). Supporting the work of previous studies, we
sive procedures such as ‘bolt-on’ configurations remain an recommend that every effort should be taken to minimize
important tool for understanding aspects of marine animal handling time if active capture and ‘bolt-on’ tag placement
migrations, habitat use, site fidelity, and year-round behaviour is required. We also advocate further investigation on how to
Downloaded from https://academic.oup.com/conphys/article/9/1/coaa128/6067277 by guest on 26 May 2021
and can greatly contribute to the conservation efforts of many mitigate the potential effects of ‘bolt-on’ tags through modi-
species (Hussey et al., 2015; Hazen et al., 2017; Andrews fied designs, approaches and rigorous experimental design in
et al., 2019). Long-term deployments often require active the field in order to strive for continued refinement in biolog-
capture and handling in order to attach the devices. Con- ging applications (Hawkins, 2004; Casper 2009), especially
sideration should therefore be given to determine if such for sensitive species such as narwhal (Laidre et al., 2008).
invasive techniques are necessary in order to achieve the
goals of the proposed work (Andrews et al., 2019); planning
requires thorough and transparent discussion of questions Funding
and tagging approaches as well as potential outcomes of
the tagging mode used with all involved stakeholders. Under This work was supported by the NSERC Northern supple-
certain scenarios, short-term deployments via suction cups ment and NSERC Discovery funds to N.E.H. C.R.S was
or remote tagging can address study questions effectively supported by Mitacs through the Mitacs Accelerate pro-
(e.g. Goldbogen et al., 2013), whereby the impact of tagging gram (www.mitacs.ca) in partnership with the World Wildlife
on behaviour is minimal and therefore data loss related to Fund. M.A.M. thanks the Canadian Research Chairs pro-
non-normal behaviour is minimal. Addressing questions such gram. Funding for fieldwork was provided by Fisheries and
as migration timing and extent, however, will require more Oceans Canada, the Nunavut Wildlife Research Trust, and
invasive ‘bolt-on’ tagging procedures unless alternative long- the World Wildlife Fund.
term attachment methods are developed (Heide-Jørgensen
et al., 2017). Opportunities to advance long-term attachment
methods will require broader discussion among the scientific Acknowledgements
community and tag manufacturers that will likely lead to
smaller design and more battery efficient tags (as discussed Narwhal tagging efforts were led by the Department of Fish-
in Andrews et al., 2019; Horning et al., 2019). This will eries and Oceans long-term marine mammal monitoring pro-
also require that tag manufacturers are willing to invest gram in conjunction with the University of Windsor and
in research and development of new tags and attachment with support from the World Wildlife Fund and the Nunavut
methods. For the Arctic whales, including traditional Inuit Wildlife Management Board. All field team members of the
Qaujimajatuqangit could lead to the development and design Ecosystem Approach to Tremblay Sound are thanked for
of novel dart heads for long-term deployments via remote tag their hard work and commitment in the field, especially Bob
attachment given their wealth of experience with harpoon use Hodgson who organized and led the expeditions. We would
(Noongwook et al., 2007; Idrobo and Berkes, 2012; Johnson especially like to thank the community of Mittimatalik (Pond
et al., 2015; Pearce et al., 2015; Pedersen et al. 2020). Inlet) and the Mittimatalik Hunter and Trapper Organization
for extensive support in the field and tagging efforts. We also
Future climate scenarios (Williams et al., 2011) and an owe huge gratitude to Jack Orr for his wealth of experi-
increase in the incidence of disease in the Arctic (VanWormer ence in dealing with narwhal and for leading the expedition
et al., 2019) further highlights the importance of considering equipping narwhal with satellite transmitters during the first
the implications of capture and tagging practices, the sam- research period. Thanks also go to Polar Continental Shelf
ple sizes required to answer the question at hand (Sequeira Program and Golder Associates for logistic support in the
et al., 2019), and whether alternative tagging methods with- field. The authors also wish to thank an anonymous reviewer
out the need for capture may be more appropriate (Best et al., for constructive comments to improve an earlier version of
2015; Seyboth et al., 2017). If, for example, ‘bolt-on’ tag this manuscript.
configurations are required to investigate stock structure in
narwhal in the Arctic, researchers should consider equipping
a small sample size of animals with accelerometer packages
Conflicts of interest
in conjunction with satellite tags and undertaking initial field The authors claim no conflict of interest.
..........................................................................................................................................................
12Conservation Physiology • Volume 9 2021 Research Article
..........................................................................................................................................................
Supplementary material Cade DE, Barr KR, Calambokidis J, Friedlaender AS, Goldbogen JA (2017)
Determining forward speed from accelerometer jiggle in aquatic
Supplementary material is available at Conservation Physiol- environments. J Exp Biol jeb.170449.
ogy online.
Casper RM (2009) Guidelines for the instrumentation of wild birds and
mammals. Anim Behav 78: 1477–1483.
References Chivers LS, Hatch SA, Elliott KH (2016) Accelerometry reveals an impact
of short-term tagging on seabird activity budgets. Condor 118:
Andrews RD et al. (2019) Best practice guidelines for cetacean tagging.
159–168.
J Cetacean Res Manag 20: 27–66.
Dechen Quinn AC, Williams DM, Porter WF (2012) Postcapture move-
Andrews RD, Baird RW, Schorr GS, Mittal R, Howle LE, Hanson MB (2015)
ment rates can inform data-censoring protocols for GPS-collared
Improving attachments of remotely-deployed dorsal fin-mounted
Downloaded from https://academic.oup.com/conphys/article/9/1/coaa128/6067277 by guest on 26 May 2021
animals. J Mammal 93: 456–463.
tags: tissue structure, hydrodynamics, in situ performance, and
tagged-animal follow-up. Final report to the Office of Naval Research, DeRuiter SL et al. (2013) First direct measurements of behavioural
grant number N000141010686, 37 pp. responses by Cuvier’s beaked whales to mid-frequency active sonar.
Biol Lett 9: 20130223–20130223.
Andrews RD, Enstipp MR (2016) Diving physiology of seabirds and
marine mammals: relevance, challenges and some solutions for field
Dietz R, Shapiro AD, Bakhtiari M, Orr J, Tyack PL, Richard P, Eskesen
studies. Comp Biochem Physiol Part A Mol Integr Physiol 202: 38–52.
IG, Marshall G (2007) Upside-down swimming behaviour of free-
Bainbridge BYR (1958) The speed of swimming of fish as related to size ranging narwhals. BMC Ecol 7: 1–10.
and to the frequency and amplitude of the tail beat. J Exp Biol 35:
Evans K, Lea MA, Patterson TA (2013) Recent advances in bio-
109–133.
logging science: technologies and methods for understanding ani-
Balmer BC et al. (2011) Evaluation of a single-pin, satellite-linked trans- mal behaviour and physiology and their environments. Deep Res Part
mitter deployed on bottlenose dolphins (Tursiops truncatus) along II Top Stud Oceanogr 88–89: 1–6.
the coast of Georgia, USA. Aquat Mamm 37: 187–192.
Fahlman A, Wilson R, Svärd C, Rosen DAS, Trites AW (2008) Activity and
Barkley AN, Broell F, Pettitt-Wade H, Watanabe YY, Marcoux M, Hussey diving metabolism correlate in Steller sea lion Eumetopias jubatus.
NE (2020) A framework to estimate the likelihood of species inter- Aquat Biol 2: 75–84.
actions and behavioural responses using animal-borne acoustic
telemetry transceivers and accelerometers. J Anim Ecol 89: 146–160. Fehlmann G, O’Riain MJ, Hopkins PW, O’Sullivan J, Holton MD, Shepard
ELC, King AJ (2017) Identification of behaviours from accelerometer
Best PB, Mate B, Lagerquist B (2015) Tag retention, wound healing, and data in a wild social primate. Anim Biotelemetry 5: 6.
subsequent reproductive history of southern right whales following
satellite-tagging. Mar Mammal Sci 31: 520–539. Fish FE (1994) Influence of hydrodynamic design and propulsive mode
on mammalian swimming energetics. Aust J Zool 42: 1–16.
Blackwell SB, Tervo OM, Conrad AS, Sinding MHS, Hansen RG, Ditlevsen
S, Heide-Jørgensen MP (2018) Spatial and temporal patterns of Gales NJ, Bowen WD, Johnston DW, Kovacs KM, Littnan CL, Perrin WF,
sound production in East Greenland narwhals. PLoS One 13: 1–23. Reynolds JE, Thompson PM (2009) Guidelines for the treatment of
marine mammals in field research. Mar Mammal Sci 25: 725–736.
Breed GA, Matthews CJD, Marcoux M, Higdon JW, Le Blanc B, Petersen
SD, Orr J, Reinhart NR, Ferguson SH (2017) Sustained disruption of Gales R, Alderman R, Thalmann S, Carlyon K (2012) Satellite tracking of
narwhal habitat use and behavior in the presence of Arctic killer long-finned pilot whales (Globicephala melas) following stranding
whales. Proc Natl Acad Sci U S A 114: 2628–2633. and release in Tasmania, Australia. Wildl Res 39: 520–531.
Broell F, Burnell C, Taggart CT (2016) Measuring abnormal movements
Gendron D, Serrano IM, de la Cruz AU, Calambokidis J, Mate B (2015)
in free-swimming fish with accelerometers: implications for quanti-
Long-term individual sighting history database: an effective tool to
fying tag and parasite load. J Exp Biol 219: 695–705.
monitor satellite tag effects on cetaceans. Endanger Species Res 26:
Brooks JL et al. (2017) Use of Fish telemetry in rehabilitation planning, 235–241.
management, and monitoring in areas of concern in the Laurentian
Goldbogen JA, Calambokidis J, Friedlaender AS, Francis J, DeRuiter SL,
Great Lakes. Environ Manag 60: 1139–1154.
Stimpert AK, Falcone E, Southall BL (2013) Underwater acrobatics
Burgess WC (2009) The Acousonde: a miniature autonomous wideband by the world’s largest predator: 360◦ rolling manoeuvres by lunge-
recorder. J Acoust Soc Am 125: 2588–2588. feeding blue whales. Biol Lett 9: 20120986.
Burnham KP, Anderson DR (2002) Model Selection and Multimodel Infer- Goldbogen JA, Calambokidis J, Shadwick RE, Oleson EM, McDonald MA,
ence: A Practical Information-Theoretic Approach, Ed 2. Springer, New Hildebrand JA (2006) Kinematics of foraging dives and lunge-feeding
York. in fin whales. J Exp Biol 209: 1231–1244.
..........................................................................................................................................................
13You can also read