Automatic Monitoring Social Dynamics During Big Incidences: A Case Study of COVID-19 in Bangladesh
←
→
Page content transcription
If your browser does not render page correctly, please read the page content below
Automatic Monitoring Social Dynamics During
                                          Big Incidences: A Case Study of COVID-19 in
                                                           Bangladesh

                                                               Fahim Shahriar1 and Md Abul Bashar2
                                                               1
                                                                 Comilla University, Cumilla, Bangladesh
arXiv:2101.09667v2 [cs.CY] 31 Jan 2021

                                                                        imnirobs15@gmail.com
                                                     2
                                                         Queensland University of Technology, Brisbane, Australia
                                                                        m1.bashar@qut.edu.au

                                               Abstract. Newspapers are trustworthy media where people get the
                                               most reliable and credible information compared with other sources. On
                                               the other hand, social media often spread rumors and misleading news to
                                               get more traffic and attention. Careful characterization, evaluation, and
                                               interpretation of newspaper data can provide insight into intrigue and
                                               passionate social issues to monitor any big social incidence. This study
                                               analyzed a large set of spatio-temporal Bangladeshi newspaper data re-
                                               lated to the COVID-19 pandemic. The methodology included volume
                                               analysis, topic analysis, automated classification, and sentiment analysis
                                               of news articles to get insight into the COVID-19 pandemic in different
                                               sectors and regions in Bangladesh over a period of time. This analy-
                                               sis will help the government and other organizations to figure out the
                                               challenges that have arisen in society due to this pandemic, what steps
                                               should be taken immediately and in the post-pandemic period, how the
                                               government and its allies can come together to address the crisis in the
                                               future, keeping these problems in mind.

                                         Keywords: Topic Analysis · LDA Topic Model · Dynamic Topic Modeling ·
                                         Time Series Decomposition · Bengali Text Dataset · Newspaper · Text Classifi-
                                         cation · RNN · LSTM · Sentiment Analysis · CNN-BiLSTM

                                         1   Introduction

                                         The outbreak of COVID-19 has brought serious health and economic conse-
                                         quences to society. It triggered one of the largest recessions in the world. Travel
                                         and currency companies lost billions of dollars, global stock markets plummeted,
                                         schools were closed, and the health care system was exhausted. Mental and so-
                                         cial problems arose as people started to worry about infection, losing friends and
                                         family, losing their jobs, or isolation.
                                             Bangladesh has not been rid of this terrible virus. The virus has had major
                                         impacts on people’s lives and significantly degraded quality of life. There were
                                         significant cases of infections and deaths. The hospital did not have adequate
2       Fahim Shahriar and Md Abul Bashar

treatment facilities, including doctors, beds, and emergency supplies. Besides
the health crisis, people have suffered enormous economic losses. Many people
have lost their jobs; companies lost revenues, many of them go bankrupt. The
most affected were the day-laborer and low-income workers. The lockdown in
the pandemic suppressed their income. Many workers starved since their liveli-
hood was cut-off. Working people took to the streets in search of their livelihood.
They started protesting in the streets for relief. Seeing their plight, many people,
including the government, came forward to help them. Because of the lockdown,
the international transport system was shut down, and stopped imports and
exports. As a result, the country’s industry suffered miserably. Objective mon-
itoring and analysis of social dynamics during such a big incident can help the
government and other authorities decide and take initiatives where required. This
research proposes utilizing articles published in newspapers to objectively mon-
itor and analyze social dynamics during a big incidence, such as the COVID-19
pandemic.
    Newspapers are one of the most popular mass media in our daily life. News-
papers provide information on all the country’s financial, political, social, envi-
ronmental, etc. Whether it is a public campaign, an emergency, or a provocation,
newspapers are a great resource for keeping track of internal and external events
and stories. This mass media generally provide authentic information, whereas
social media such as Facebook and Twitter often spread rumors and cannot be
relied upon for authentic news. Effective classification, analysis, and interpreta-
tion of newspaper data can provide a deep understanding of any big incident in
a society.
    In this research, we analyzed a large spatio-temporal dataset of Bangladeshi
Daily Newspapers related to COVID-19. The approach incorporated volume
analysis, topic analysis, automatic classification of news articles, and sentiment
analysis to better understand the COVID-19 pandemic in Bangladesh’s divisions
and districts over time. The experimental results and analysis will give an ob-
jective insight into the COVID-19 pandemic in Bangladesh that will benefit the
government and other authorities for disseminating resources. This paper espe-
cially shows how to utilize automatic techniques for monitoring social dynamics
in big incidents such as a pandemic, natural disaster, and social unrest.
    This research makes the following main contributions. (1) It collects, manu-
ally classifies, and publishes a large collection of COVID-19 related Bangladeshi
news articles in Bengali and English. (2) It investigates the topics discussed dur-
ing the COVID-19 pandemic in Bangladesh and how they have changed over
time using manual and automatic techniques. (3) It designs a CNN-BiLSTM
architecture for analyzing sentiment in Bengali text. (4) It analyzes COVID-19
related sentiments in the community over time and space. (5) It automatically
categorizes documents into classes of observation interest for monitoring social
interests.
    The rest of the paper is organized as follows: Section 2 discusses related
work, Sections 3 discussed methodology and data collection, Section 4 presents
experimental results, and Section 5 concludes the paper.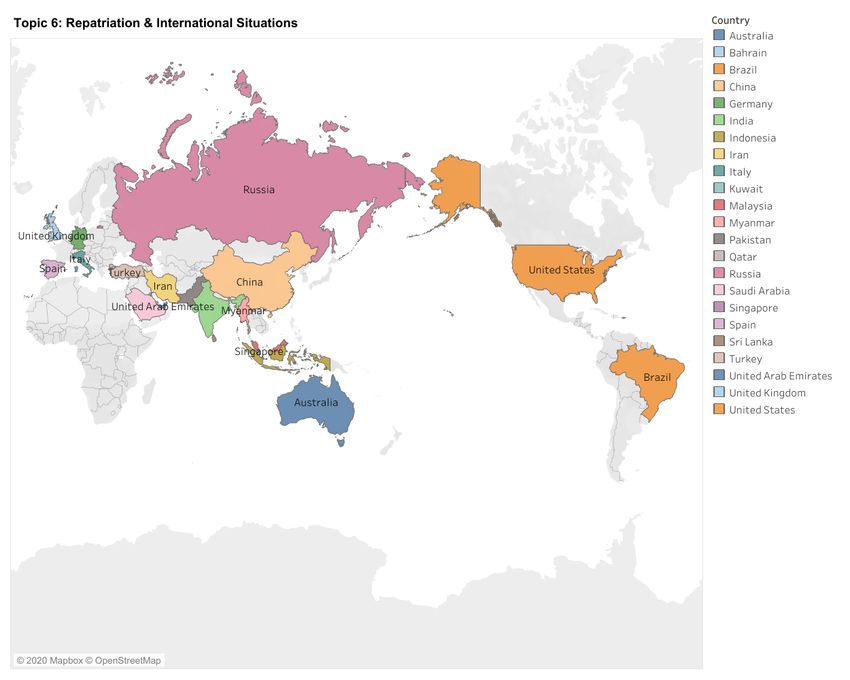
Automatic Monitoring Social Dynamics During Big Incidences        3

2     Related Work

In this segment, we will discuss some past related works done by different ana-
lysts. We will divide it into four sections: Static Topic Modeling, Dynamic Topic
Modeling, Sentiment Analysis, and Text Classification.

2.1   Static Topic Modeling

Topic modeling is a process of discovering hidden topics in a collection of texts
Bashar et al. (2020a); Balasubramaniam et al. (2020). It can be considered as
a factual show of topics through text mining. One of the most popular topics
modeling technique Latent Dirichlet Allocation (LDA) (Blei et al., 2003; Bashar
et al., 2020a) discovers topics based on word recurrence in a set of documents.
LDA is incredibly valuable for finding a sensibly precise blend of topics inside a
given record.
    Topic modeling has been well studied for English text mining. For instance,
Zhao et al. (2011) used unsupervised topic modeling in their research and com-
pared the content of Twitter with the traditional news media “New York Times”.
They used the Twitter-LDA model to find topics from a representative sample of
the entire Twitter and then used text mining techniques to compare these Twit-
ter topics with New York Times’ topics, taking into account the topic category
and type. Wang and Blei (2011) developed an algorithm to recommend scientific
articles to users in online communities. Their method combines the advantages
of traditional collaborative filtering and probabilistic topic modeling. They ap-
plied collaborative topic modeling for recommending scientific articles. Wayasti
et al. (2018) applied the Latent Dirichlet Allocation function in the research
and extracted topics based on ride-hailing customers’ posts on Twitter. In their
research, they used 40 parameter combinations of LDA to obtain the best com-
bination of topics. According to the perplexity value, the customers discussed 9
topics in the post, including keywords for each topic. Tong and Zhang (2016)
recommended two experiments to build topic models on Wikipedia articles and
Twitter users’ tweets.
    However, topic modeling has not been well studied for Bengali text mining,
unlike English text mining. Das and Bandyopadhyay (2010b) used topic wise
opinion summarization from Bengali text. They applied K-Means clustering and
document-level theme relational graph representation. However, they did not
use any topic modeling technique, such as LDA. Rakshit et al. (2015) applied
a Multi-class SVM classifier for analyzing Bengali poetry and poet relations.
They performed a subject-wise classification of poems into foreordained cate-
gories. Hasan et al. (2019) compared the performance of the LDA and LDA2vec
topic model in Bengali Newspaper. Al Helal and Mouhoub (2018) used LDA for
detecting the primary topics from a Bengali news corpus. However, they did not
directly apply LDA in the Bengali text. Instead, they translated the Bengali text
into English and then applied LDA to detect the topics. Rahman et al. (2019)
used lexical analysis for sentence wise topic modeling. Their topic modeling was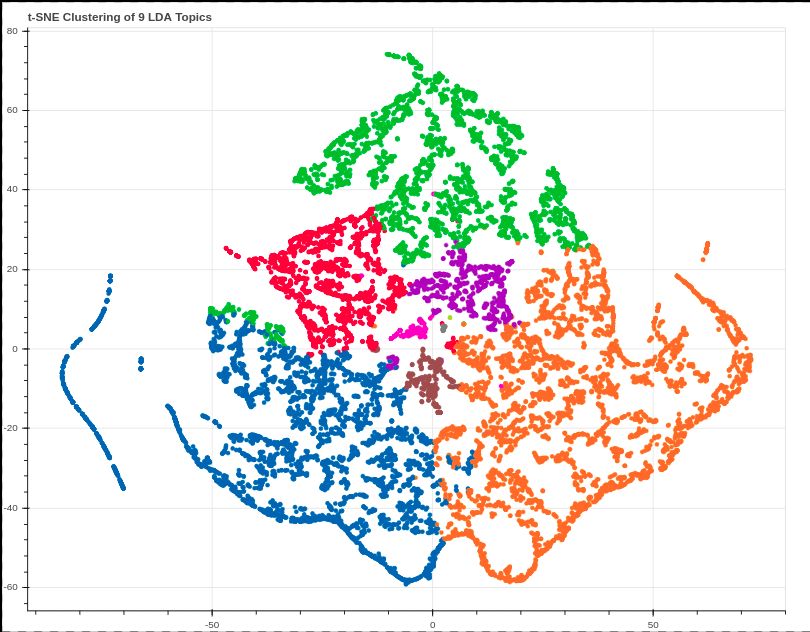
4      Fahim Shahriar and Md Abul Bashar

based on sentiment analysis. None of the existing works used Bengali text topic
modeling for monitoring a pandemic or a major event.
    In addition to English and Bengali, topic modeling in various languages is
also studied. De Santis et al. (2020) analyzed a system that uses NLP pipelines, a
theoretical framework for content aging to determine the qualitative parameters
of tweets, and co-occurrence analysis to build topic maps chart splits to identify
topics related to posts from Italian Twitter users. Han et al. (2020) extracted
topics related to COVID-19 from Sina Weibo(Chinese microblogging website)
text dataset through the LDA topic model.

2.2   Dynamic Topic Modeling
The dynamic topic model is a cumulative model that can be used to analyze
changes in document collection over time Bashar et al. (2020a). There are many
studies on dynamic topic modeling for the English language. For example, Al-
Sumait et al. (2008) showed that the LDA model could be extended to the
online version by gradually updating the current model with new data, and the
model has the ability to capture the dynamic changes of the topics. Dieng et al.
(2019) researched D-ETM on three data sets and discovered the word proba-
bilities of eight different topics that D-ETM learned over time. Nguyen et al.
(2020) discovered latent topics from the financial reports of listed companies in
the United States and studied the evolution of the themes discovered through
dynamic topic modeling methods. Marjanen et al. (2020) discussed humanistic
interpretation’s role in analyzing discourse dynamics through historical news-
papers’ topic models. Bashar et al. (2020a) extracted five COVID-19 related
topics from the Twitter dataset through LDA topic modeling, and they showed
the changes in the extracted topics over time. Nevertheless, for the Bengali lan-
guage, so far, there is no research on dynamic topic modeling. In this study, we
study the evolution of the extracted COVID-19 related topics over time using
dynamic topic modeling.

2.3   Text Classification
Text classification, moreover known as text labeling or text categorization, is
categorizing content into organized bunches Bashar et al. (2020b); Bashar and
Nayak (2020); Bashar et al. (2018); Bashar and Nayak (2020). By utilizing NLP,
classifiers can naturally label text and, after that, relegate a set of predefined
labels or categories based on its substance.
    Many researchers worked on text classification in English. For example, Patil
and Pawar (2012) used the Naive Bayes algorithm to classify website content.
They divided the website content into ten categories, and the average accuracy
of the ten categories was almost 80%. Bijalwan et al. (2014) used K-Nearest
Neighbors, Naive Bayes, and Term-gram to classify text. They showed that in
their research, K-Nearest Neighbors’ accuracy was better than Naive Bayes and
Term-gram. Tam et al. (2002) showed that K-Nearest Neighbors was superior
to NNet and Naive Bayes for English documents. Pawar and Gawande (2012)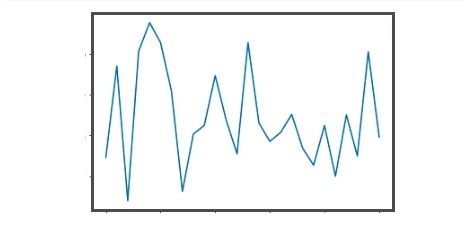
Automatic Monitoring Social Dynamics During Big Incidences           5

showed that Support Vector Machines’ performance is far superior to Decision
Trees, Naive Bayes, K-Nearest Neighbors, Rocchio’s algorithms, and Backpropa-
gation networks. Liu et al. (2010) showed that Support Vector Machines is better
than K-Nearest Neighbors and Naive Bayes.
    In addition to English text classification, some researchers have also classi-
fied Bengali text. For example, Mandal and Sen (2014) applied four supervised
learning methods: (Naive Bayes, k nearest neighbor, Decision Tree classifier, and
Support Vector Machine) for labeled web documents. They classified the doc-
uments into five categories: (Business, Sports, Health, Technology, Education).
Chy et al. (2014) applied a Naive Bayes classifier to categorized Bengali news.
Pal et al. (2015) described Naive Bayes classifier for Bengali sentence classifi-
cation. They used over 1747 sentences in their experiment and got an accuracy
of 84%. Kabir et al. (2015) used Stochastic Gradient Descent (SGD) classifier
to categorize Bengali documents. Eshan and Hasan (2017) created an applica-
tion that identifies abusive texts in Bengali. They applied Naive Bayes, Random
Forest, Support Vector Machine (SVM) with Radial Basis Function (RBF), Lin-
ear, Polynomial, and Sigmoid kernel to classify the texts and compare the results
among them. Islam et al. (2017) applied SVM, Naive Bayes, and Stochastic Gra-
dient Descent(SGD) to classify Bengali documents and compare results of those
classifiers. However, non of the existing works used Bengali text classification for
monitoring a pandemic or a major event.

2.4   Sentiment Analysis
Sentiment Analysis refers to computationally recognizing and categorizing opin-
ions communicated in a chunk of text. It is successfully used in commerce where
they use it to track online discussions to identify social estimation of their brand,
item, or benefit.
    A lot of research work has been done in sentiment analysis for the English
language. For example, Cui et al. (2006) have reviewed about 100,000 product
reviews from various websites. They divided reviews into two main categories:
positive and negative. Jagtap and Dhotre (2014) applied the Support Vector
Machine and Hidden Markov Model, and the Hybrid classification model is well
suited for extracting teacher feedback and evaluating sentiments. Alm et al.
(2005) divided the seven emotional words into three polarity categories: positive
emotion, negative emotion, and neutral, and the Winnow parameter adjustment
method used can reach 63% accuracy. For extracting the Twitter sentiment,
Agarwal et al. (2011) applied unigram, tree model, and feature-based model.
Bashar et al. (2020a) used Convolutional Neural Network to extract sentiments
related to COVID-19 from the Twitter dataset.
    Some research used sentiment analysis in Bengali texts. For instance, Das
and Bandyopadhyay (2010a) classified emotions into six categories: Happy, Sad,
Anger, Disgust, Fear, and Surprise. Chowdhury and Chowdhury (2014) used sen-
timent analysis in Bangla Microblog Posts. They applied a semi-supervised boot-
strapping method utilizing SVM and Maximum Entropy. Hasan et al. (2014) pro-
posed a strategy to identify sentiments in Bengali texts by Contextual Valency
6 Fahim Shahriar and Md Abul Bashar
Analysis. They employed the methodology of POS Tagger in their approach.
Hassan et al. (2016) used recurrent neural networks to Romanize Bengali texts
and analyze sentiments. In their experiments, they used Bangla and Romanized
Bangla Text (BRBT) dataset. For Sentiment Analysis of Bangla Microblogs,
Asimuzzaman et al. (2017) used Adaptive Neuro-Fuzzy Deduction Framework to
anticipate extremity and utilized fluffy rules of speech in semantic rules. Mahtab
et al. (2018) designed a model for sentiment analysis on Bangladesh Cricket
news. They applied TF-IDF and SVM (Support Vector Machine) in their model
and found 64.596% accuracy. Tripto and Ali (2018) used sentiment analysis on
Youtube comments. Their research built a model based on deep learning that
classifies a Bengali text into three classes and five sentiment classes. Tabassum
and Khan (2019) used the Random Forest Algorithm to classify the sentiments
in Bengali texts. Tuhin et al. (2019) applied Naive Bayes and a topic model-
ing approach to design an Automated System of Sentiment Analysis in Bengali
Text. Their system classifies emotions into six categories: happy, sad, tender,
excited, angry, and scared. However, non of the existing works used Bengali text
sentiment analysis for monitoring a pandemic or a major event.
3 Experimental Methodology
3.1 Methodology
This pandemic situation has changed society and the country by a significant
margin. The whole face of the country has changed completely. Some significant
sectors of the nation, such as economic, social, political, have been affected mas-
sively. The education systems have been hit particularly hard. This research aims
to automatically analyze the daily newspapers in Bangladesh to reveal what is
going on in society and gain knowledge to comprehend the fundamental topics
(or subjects) and sentiment arising and advance in the discussion.
This study will conduct a topic and sentiment analysis on a large collection
of COVID-19 related news articles published in Bangladesh both in Bengali and
English texts. The study will focus the analysis on both spatial and temporal
dimensions. In the topic analysis, we used LDA-based topic modeling and dy-
namic topic modeling to find the topics, their evolution over time, and their time
and space (location). We also analyzed what impact each topic had on particu-
lar areas. Then we analyzed the sentiment distribution over time and space to
identify social sentiment in space and time. The experimental workflow of this
study is shown in Figure 1.
First, we manually gathered a large collection of COVID-19 related news
articles from Bangladeshi six most circulated daily newspapers. Along with the
news, the collection contains geospatial and temporal information on the news.
The dataset was then preprocessed by removing HTML, markers, and other
non-relevant information such as adverts.
Then, we manually organized the news articles in a set of classes and sub-
classes. Then we extracted the topics and the subtopics from the dataset. WeAutomatic Monitoring Social Dynamics During Big Incidences 7
used these classes and sub-classes to perform basic analysis such as comparing
similarity and diversity in the news. These classes and sub-classes have also been
used to qualitatively evaluate the accuracy of the topics discovered by LDA and
labels predicted by classifiers before LDA and classifiers are employed for detailed
analysis.
Bengali Newspaper
Datatset Collection
Preprocessing and Data
Preparation
Automatic Classification of
Volume Analysis Topic Analysis Sentiment Analysis
News Articles
Temporal Analysis of Spatial Analysis of
Volume Volume
Dynamic Topic Modeling:
Topic Extraction Spatial Distribution of Topics
Temporal Trends of Topics
Fig. 1. Experimental Work flow
3.2 Data Collection and Preparation
These publicly available News articles related to COVID-19 have been collected
from the six most popular newspapers in Bangladesh from 21 January 2020
to 19 May 2020. The six newspapers are The Daily Prothom Alo, Bangladesh
Pratidin, Kaler Kantho, The Daily Star, Newage, and The Daily Observer. A
total of 15,565 news articles are collected from these six newspapers. From every
news article, we extracted the news title, the main body of the news, a summary
of the news (i.e., first few lines of the news body), the published date, and the
news incident’s location. We used Python’s BeautifulSoup and Newspaper3k tool
for extracting the news content. BeautifulSoup is a popular Python package for
parsing HTML and XML archives and one of the most popular web scraping
tools. Newspaper3k is a user-friendly library for scraping the news articles and
other related data from newspaper portals. It is built upon request and used
to parse LXML. This module is an improved version of the Newspaper module
and is also used for the same purpose. Table 1 summarizes the statistics of the8 Fahim Shahriar and Md Abul Bashar
collection. We call this collection Comilla University COVID-19 News Collection
(CoU-CNC). We made it available online3 for anyone for further analysis.
Article Source Language Article Count
The Daily Prothom Alo Bengali 4169
Bangladesh Pratidin Bengali 5584
Kaler Kantho Bengali 1160
The Daily Star English 1278
The Daily Observer English 1191
New Age English 2183
Table 1. CoU-CNC Dataset Statistics
Out of these six newspapers, news articles in three newspapers (The Daily
Prothom Alo, Bangladesh Pratidin, Kaler Kantho) are composed in the Ben-
gali language, and in the other three newspapers (The Daily Star, The Daily
Observer, New Age) articles are composed in the English language. There are
10,913 news articles in the Bengali language, and the remaining 4652 news arti-
cles are in the English language.
As the dataset has 4,652 articles in English and we wanted all articles in the
same language to be better parsed, so we translated the English articles into
Bengali via Python’s googletrans module. As a result, after translating these ar-
ticles, all the articles are in the Bengali language. Then, we applied tokenization
to split a string of text into smaller tokens. The news articles are split into sen-
tences, and sentences are tokenized into words. Then, we applied noise removal
(e.g., removing HTML tags, extra white spaces, special characters, numbers)
to clean up the text. Then, we removed the stopwords from the document. As
there is no build-in stopwords module for Bengali nltk, we manually created a
stopword list and made it available online4 . Then, we expanded contraction. We
set the minimum letter length to 6. We also removed all the words that were
below the minimum letter length. There are no good resources for stemming and
lemmatization in the Bengali language. So, we applied stemming and lemmati-
zation to the tokens in our own process. After removing all the stopwords and
other noises, there were a total of 80,693 tokens. There are some specific suffixes
for the Bengali language. The suffix removal from the word has also been done
with the help of Python. We used Bangla Steamer.Steamer library of Python to
improve accuracy. However, it did not show the expected results as the library
is effective for a small number of Bengali words. To increase the accuracy of this
80,693 sizes lemmatized dictionary, we manually verified about 30000 most fre-
quent tokens from 80693 words. We lemmatized where we needed to lemmatized
manually, and we also corrected the incorrect and misspelled words where it was
3
CoU-CNC Dataset: https://cutt.ly/djGILi2
4
Bengali-Stopwords: https://cutt.ly/2jXbDRBAutomatic Monitoring Social Dynamics During Big Incidences 9
needed. Many more words are manually lemmatized and corrected through this
manually 30,000 words check. We have published verified Bengali words on the
Internet and titled “Modified Bengali Words” 5 for further analysis.
To compare the number of news published and the COVID-19 cases of
Bangladesh, we collected an open-source dataset6 of confirmed COVID-19 cases
and death cases of Bangladesh from March 8 to May 19.We also collected an-
other open-source dataset7 of confirmed cases based on divisions and districts of
Bangladesh from March 8 to May 19.
Class Distribution in News Articles After collecting the new articles, first,
we analyzed them manually. In this process, we extracted eight classes (shown
in Table 2) and 19 sub-classes from the news articles. The representation of the
extracted eight classes and the hierarchical organization of sub-classes are shown
in Figure 2. The distribution of the extracted classes over news articles is shown
in Figure 3 and the distribution of the extracted sub-classes over news articles
is shown in Figure 4.
Table 2. Eight Classes Extracted from the Collected News Articles
(1) Statistics, (2) Social Information, (3) COVID-19 Effects, (4) COVID-19 Responses
and Preventive Measure, (5) Government Announcement and Responses, (6) Solidar-
ity and Cooperation, (7) International Information, and (8) Health Organization Re-
sponses
3.3 Spatio-Temporal Analysis
Time Series or temporal analysis of newspaper articles is utilized to observe the
transient expansion during the pandemic. Time series decomposition includes
considering a series of components in the time dimension: Level, Trend, Season-
ality, and Noise segments. Level refers to the average value in the series, Trend
refers to the increasing or decreasing value in the series, Seasonality refers to the
repeating short-term cycle in the series, and finally, Noise refers to the random
variation in the series. Decomposition gives a powerful supportive model for pon-
dering time series and better arrangement issues during time series analysis and
decision making. The additive model (Dagum, 2010) suggests that the segments
are added as the following formula:
y(x) = l(x) + t(x) + s(x) + n(x) (1)
where y(x) represents the additive model, l(x) represents the observed level,
t(x) represents the trend, s(x) represents the seasonality and n(x) represents
5
Modified Bengali Words: https://cutt.ly/8jE6GIC
6
https://www.worldometers.info/coronavirus/country/bangladesh/
7
https://data.humdata.org/dataset/district-wise-quarantine-for-covid-1910 Fahim Shahriar and Md Abul Bashar
Social impact
Public unawareness
Sanction
Protestation
Spread of rumors or
misinformation on corona virus
Positive patient symptoms and
identification
Severe health outcomes and
deaths
Statistics Transmission patterns and risks
Negative cases and Corona
Social Information
virus recovery stories
Global economic impact of
COVID-19 Effects
Corona virus
COVID-19 Responses and Strategic preparedness and
Preventive measure response plan
8 classes and
19 sub-classes Government
Protective products and
Announcement and
machines
responses
Corona virus treatment and
Solidarity and cooperation
Vaccine
Government guidelines,
International Information
instructions and mobilization
Health Organizations
Policy inconsistency
Responses
External support, Aids
Repatriation
Trip and transportation
Global economic impact of
Corona virus
Fig. 2. Manually Extracted Classes and Sub-classesAutomatic Monitoring Social Dynamics During Big Incidences 11
Solidarity and
4.9%
Health
5.5% COVID-19 Effects
Government 26.3%
8.9%
International
10.2%
COVID-19
Statistics
17.4%
13.1%
Social Information
13.7%
Fig. 3. Distribution of Manually Extracted Classes over News Articles
Repatriation
2.4%
Strategic
Public unawareness
19.1%
3.0%
Transmission
3.0% Sanction
Policy inconsistency 2.4%
3.4% Corona virus
Global economic 2.3%
4.7% Protestation
Negative cases and 1.6%
4.9% Trip and
Government 1.5%
8.2% Protective products
1.4%
External support,
Global political 1.0%
8.4% Spread of rumors or
0.8%
Positive patient
Severe health 11.5%
Social impact
9.4%
11.0%
Fig. 4. Distribution of Manually Extracted Sub-classes over News Articles12 Fahim Shahriar and Md Abul Bashar
the noise or residual in the signal x. This model is linear. The change over a
period of time is reliably affected by the similar sum of the linear trend as a
straight line. A linear seasonality has a similar recurrence and abundance. On
the other hand, A multiplicative model (Dagum, 2010) recommends that the
components are multiplied together as the following formula:
y(x) = l(x) × t(x) × s(x) × n(x) (2)
where y(x) represents the multiplicative model, l(x) represents the observed
level, t(x) represents the trend, s(x) represents the seasonality and n(x) repre-
sents the noise in the signal x. A multiplicative model is exponential or quadratic
when expanding or diminishing over the long run. A nonlinear pattern is a bent
line. In this examination, we disintegrated the time series utilizing the multi-
plicative model. For Spatial Analysis, we used Tableau Software to compare
the number of news published, and the number of COVID-19 confirmed cases
geographically.
3.4 Static Topic Analysis
Analyzing the topics of news articles published during a major incident or a pan-
demic like COVID-19 can help monitor the situation and understand the public
concerns, which is critical for government authorities and charity organizations
to disseminate required resources and aids. However, in such a situation, a large
number of news articles are published in various newspapers. We observed that
as the situation deteriorated during the pandemic, newspapers had to publish
much news on various topics. Manually analyzing the topics by reading a large
number of articles is time-consuming and expensive. We utilized two unsuper-
vised machine learning techniques: (a) LDA (Blei et al., 2003), a popular topic
modeling technique, as static topic modeling to automatically find topics of ar-
ticles published in newspapers, and (b) dynamic topic modeling in (Blei and
Lafferty, 2006) to see how those topics evolve over the long haul.
LDA is a Bayesian probabilistic model that discovers topics and provides
topic distribution over documents and word distribution over topics. It has two
phases: (a) the first phase models each document as a composition of topics,
and (b) the second phase models each topic as a composition of words. LDA
utilizes word co-occurrences inside documents for discovering topics in a doc-
ument assortment. Words occurring in an equivalent document are practically
coming from the same topics, and documents containing comparative words will
undoubtedly include comparable topics. In this research, the Gensim package in
Python was utilized to execute the LDA model. We utilized every news article
as a document in the topic modeling. Before applying the LDA topic model,
we manually associated documents into general classes and sub-classes to know
about the quality of LDA extracted fine-grained topics.
Then, we analyzed each LDA extracted topic’s temporal trends to see when
a topic has been discussed more or published more in the newspapers. Finally,
we analyzed each topic’s spatial distribution to see what effect each had in aAutomatic Monitoring Social Dynamics During Big Incidences 13
particular place. We used Tableau software to analyze the spatial distribution of
each topic.
3.5 Dynamic Topic Analysis
The static topic modeling treats words as interchangeable and indeed treats doc-
uments as interchangeable. However, the presumption of replaceable documents
is impractical for some assortments when accumulating along the time. For exam-
ple, tweets, news articles, and insightful articles as they are advancing substance
along time. The subjects in a newspaper article assortment develop, and it is
essential to display the elements of the fundamental topics unequivocally.
Dynamic topic modeling extends the static theme, which illustrates the pro-
gression of the theme in consolidate. Dynamic topic modeling can catch the
development of topics in a successively coordinated assortment of news articles.
In this research, the articles are synchronized by week. We used the dynamic
topic model to analyze discussion topics and topic changes over time.
3.6 Text Classification
Then we built a text classifier to verify their performance and predict the class,
sub-class, and topics in the unknown (upcoming in the future) news articles.
Such classification is important when we need to monitor a specific category (or
class or group) of news. We made Long Short-Term Memory (LSTM) Recurrent
Neural Network (RNN) models in Python utilizing Keras deep learning library
for text classification. RNN is a special kind of neural network where the previ-
ous step’s output will be used as the current step’s input. In a traditional neural
network, not all inputs and outputs are interdependent. However, interdepen-
dence is an important part of text data. In such cases, the model needs to predict
the next word given the previous words, so the previous word must be stored.
Thus RNN was born, which solved the problem with the help of hidden layers.
The primary function of RNN is also essential, namely the hidden state. It can
remember some information about the sequence.
RNN is a neural feedback network that operates on the internal memory.
Since the RNN has a similar function for each piece of information and the
current range’s output is based on the last count, the RNN is essentially recur-
sive. When there is an output, it is copied and sent back to the relay network.
The current input and the output of the previous input are taken into account
in determining the prediction of the next word. Unlike direct feedback neural
networks, RNNs can use their internal state (memory) to manage the input el-
ements’ interdependence. That makes them useful for text data, handwriting
recognition, or speech recognition. The architecture of an unrolled recurrent
neural network is shown in Figure 5.
In Figure 5, first the model gets x0 from the input sequence. Then it produces
h0 , which is used in the next input to the model along with x1 . That is, both h0
and x1 become inputs to the next step. Then, h1 and x2 are input to the next
step, and so on. Like this, RNN continues summarizing the unique circumstance14 Fahim Shahriar and Md Abul Bashar
A A A A
A
Fig. 5. Unrolled Recurrent Neural Network
in the hidden state while training. Then, it uses the summarized hidden state to
classify the sequence (Bashar et al., 2020b).
3.7 Sentiment Detection
We proposed a hybrid neural network model based on Convolutional Neural
Network (CNN) and LSTM for sentiment analysis in Bengali texts.
Integrated models are used to solve various vision and NLP problems and
improve a single model’s performance. The following subsections provide an
overview of the LSTM and CNN models offered. In subsection 3.6, we described
LSTM. In this research, we used two-layer bi-LSTM, word embedding include
words in the news articles and provide sentiments.
Another part of our proposed structure is based on Convolutional Neural
Network (CNN). CNN has very successful in various image processing and NLP
tasks these last years. They are powerful in exploration, achieving local rele-
vance, and data standards through learning. Generally, to rank text on CNN,
different words in sentences (or paragraphs) need to be placed. Stacked to form a
two-dimensional matrix, pleated filters (different lengths) are applied to the win-
dow. To use CNN for text classification, the different words stacked in a sentence
are usually stacked in a two-dimensional matrix, and afterward, a convolution
is applied to the word in the window in one word to be created applied a new
function declaration. Then, a max-pooling is applied to the new function, and
the combined functions of different filters are combined to shape a concealed
portrayal. Completely associated layers trail these portrayals for the last esti-
mate. The architecture of our CNN-BiLSTM Hybrid network model is shown in
Figure 6.
We created a sequential model that includes an LSTM layer. Then we made
our model sequential and adding layers. In the first layer, we applied a conv1D
with 200 as a filter for CNN. After that, we applied two Bi-LSTMs on the second
and third layer with an error of 0.5. Then we applied a dense network on the
remaining levels. We also used Adam as an optimizer with tight hyperparameters
and applied L2 adjustments to reduce overfitting as much as possible. We onlyAutomatic Monitoring Social Dynamics During Big Incidences 15
LSTM LSTM
লকডাউেন
রাজগার
LSTM LSTM
হারােনা
অিধকাংেশর
পিরবাের
Negative
দখা Positive
িদেয়েছ LSTM LSTM
চরম খাদ
স ট।
LSTM LSTM
Document Convolution Features LSTM Fully
Connected Output
Matrix Map Layers
Layers
Fig. 6. The architecture of CNN-BiLSTM Hybrid network for Sentiment Identification
used five epochs, as using more epochs resulted in overfitting and kept the stack
size of 256, as it worked very well.
4 Experimental Results
4.1 Volume Analysis
Temporal Analysis of Volume The time series volume analysis of newspapers
is shown in Figure 7. The figure has four plots, namely observed level, trend,
seasonal, and noise or residual. The first plot Figure 7a shows the original volume,
i.e., the number of COVID-19 related news articles in a time point. It shows that
the curve began to rise from January when some COVID-19 cases were found
in China and other countries. The plot increased sharply in early March when
a few instances of COVID-19 cases were identified in Bangladesh. The curve
remained high onward with some fluctuations. The second plot Figure 7b shows
the trend of the COVID-19 related news publication volume. It shows that the
COVID-19 related news started becoming trendy by the end of January, and
the trend increased significantly in early March. The trend stayed high through
the rest of the time with some fluctuations. The third plot Figure 7c shows the
seasonal, cyclical change in the volume. Moreover, the fourth plot Figure 7d
shows a residual or random variation in the volume.
To see how newspapers reacted during the COVID-19 pandemic, we tracked
COVID-19 cases, death from COVID-19, and COVID-19 news volume in Figure
8. The figure shows that the newspapers were vigilant from the beginning of the
pandemic. The newspaper journalists increased COVID-19 related news coverage
exponentially as soon as COVID-19 cases were found in Bangladesh in early
March. The news volume continued increasing until the last quarter of March.16 Fahim Shahriar and Md Abul Bashar
300
200
number of news 100
0
Feb Mar Apr May
2020
Date
(a) Observed
200
150
number of news
100
50
0
Feb Mar Apr May
2020
Date
(b) Trend
5.0
2.5
0.0
number of news
2.5
5.0
7.5
10.0
Feb Mar Apr May
2020
Date
(c) Seasonal
40
20
number of news
0
20
Feb Mar Apr May
2020
Date
(d) Residual
Fig. 7. Time Series DecompositionAutomatic Monitoring Social Dynamics During Big Incidences 17
This part of the news volume shows the newspapers reacted from about COVID-
19 from the very early pandemic stage. They significantly covered the pandemic
during the early period of the COVID-19 cases.
The number of identified cases increased significantly by the second quarter
of April, and it continued to increase. However, the number of COVID-19 related
news articles did not increase during this time. Even in some cases, the news
article volume decreases marginally. The possible reasons might be: (a) Because
Bangladesh is a developing country, to survive at this point, people had to think
more about earnings than pandemic. As a result, pandemic news did not increase
attention, and newspapers did not increase COVID-19 related articles. (b) Some
other big incidences gained more attention than COVID-19. (c) The newspapers
reached their allocated space for pandemic news already.
1200
1000
800
600
400
200
0
January February February March March April April May May
15 1 15 1 15 1 15 1 15
Fig. 8. Comparison of Daily News Article Counts and Daily Cases (21 January 2020 -
19 May 2020)
Spatial Analysis of Volume The spatial Distribution of Bengali newspapers
is shown in Figure 9a. The number of news articles was concentrated on the
central part of Bangladesh, mainly Dhaka, Narayanganj, and Gazipur. More than
6000 COVID-19 related news articles were published in Bangladeshi newspapers
related to Bangladesh’s central part. More than 2000 news articles related to the
southern part of Bangladesh, mainly Chittagong and Cox’s Bazar.
The spatial distribution of confirmed cases of COVID-19 is also shown in
Figure 9b. The central part of Bangladesh is the most affected area. More than
10,000 COVID-19 patients were identified in Dhaka during this time. Outbreaks18 Fahim Shahriar and Md Abul Bashar
(a) Number of News Published Up to 19 May 2020
(b) Confirmed Cases Up to 19 May 2020
Fig. 9. Spatial Analysis of News Article VolumeAutomatic Monitoring Social Dynamics During Big Incidences 19
have been reported in the surrounding areas of Dhaka, mainly Narayanganj and
Gazipur. After the Dhaka division, we can see the highest infection rate in the
southern part of Bangladesh, mainly Chittagong. Figure 9 shows a correlation
between the number of confirmed COVID-19 cases in an area and the published
news volume related to that area. This means automatic monitoring of news
article volume can give a clear view of the severity of a pandemic or big instances
in a society.
Dhaka
Chittagong
Narayanganj
Gazipur
Comilla
Khulna
Barisal
Sylhet
Kishoreganj
Tangail
0 1000 2000 3000 4000 5000
Fig. 10. District-wise Distribution of News Articles
Chittagong
Khulna 3.3%
3.5%
Mymensingh 5.2% 19.5%
Sylhet
Dhaka
Rajshahi
5.7%
Rangpur
Barisal 2.1%
2.7%
57.9%
Fig. 11. Division-wise Distribution of News Articles
The district-wise break down of published news articles for significant volume
is shown in Figure 10 and division-wise break down in Figure 11. The figures
show that most news published was related to the Dhaka district and Dhaka
division. More than 57% of the published news was related to the Dhaka division.
After Dhaka, most news has been published on Chittagong. More than 19% of
the news was related to the Chittagong division. The geospatial and temporal20 Fahim Shahriar and Md Abul Bashar
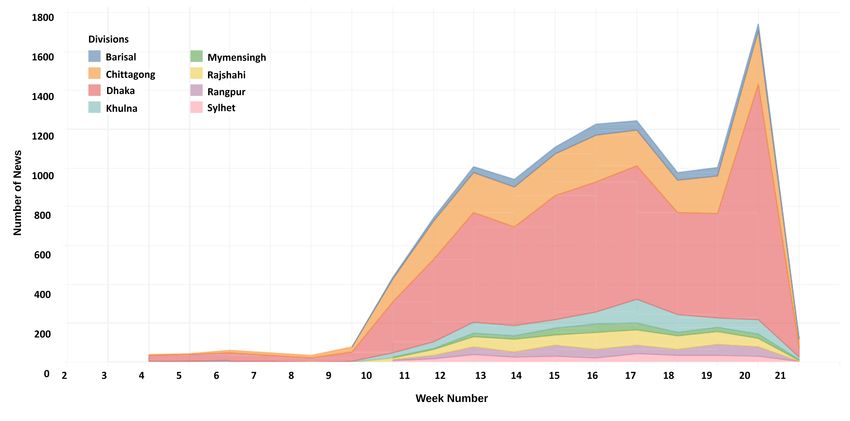
Fig. 12. Geo-spatial and Temporal Distributions of News Articles Published over Time.
Horizontal axis shows consecutive weeks in the duration and vertical axis shows the
volume (count of news articles).
distributions of newspaper articles are shown in Figure 12. The figure shows
that the volume of published news articles related to each location significantly
changed over time, lower volume before and beginning of the pandemic, and
significantly increased during the pandemic.
4.2 Topic Analysis
Topic Extraction For topic analysis through the LDA topic model, it is indis-
pensable to decide the optimal number of topics. Seeking an appropriate LDA
topic number and clarifications to examine the relationship between the COVID-
19 emergency and news articles, we have given much thought. We used a coher-
ence score and perplexity score to assess the choice of an appropriate number
of topics. After preprocessing the data, we applied the LDA model to discover
hidden topics in news articles. To determine the optimal number of topics, we
diagnosed the coherent score and the perplexity score graph shown in Figure 13.
Figure 13a is showing the coherent score graph and Figure 13b is showing the
perplexity score graph.
From the coherence score graph, we got the highest coherence score (0.5077)
when we set the number of topics to 9, shown in Figure 13a. Moreover, from
the perplexity score graph, we got the highest perplexity score (-7.59) when we
set the number of topics to 24, shown in Figure 13b. We chose the coherent
score between the coherent score and perplexity score as the optimal number of
topics for the coherent score is 9, which is very close to the number of manually
extracted classes of 8, shown in Table 2. So we set the number of topics for LDA
topic extraction to 9. The word clouds for top words (i.e., keywords) in each of
the nine topics is shown in Figure 14. The weights and appearance counts of theAutomatic Monitoring Social Dynamics During Big Incidences 21
-7.59
-7.60
0.50
-7.61
Perplexity
0.49 -7.62
Score
Coherent
Score
-7.63
0.48
-7.64
0.47
-7.65
5 10 15 20 25 30 5 10 15 20 25 30
Number of Topics Number of Topics
(a) Coherent Score (b) Perplexity Score
Fig. 13. Determining optimal number of topic
keywords in each topic is shown in Figure 15. The visualization of the clusters
of documents in a 2D space using the t-SNE (t-distributed stochastic neighbor
embedding) algorithm is shown in Figure 16. In Figure 17, inter-topic distance
map and 30 relevant keywords are displayed for each topic. They discovered nine
topics are listed in Table 3.
Table 3. Nine Topics Discovered by LDA
(1) Economic Crisis and Incentives, (2) Epidemic Situation and Outbreak, (3) Vaccine
and Treatment, (4) Demonstration for Wages and Relief, (5) Medical Care and Health
Organization Responses, (6) Repatriation and International Situations, (7) Daily In-
fected Death and Recovered Cases, (8) Strategic Preparedness, and (9) Government
Announcement and Responses
Figure 18 shows the topic frequency ratio in the document collection (news
articles). The figure shows that Topic 8 (Strategic Preparedness) is the most
frequent topic amongst all the nine topics discovered by LDA, and this topic ac-
counted for 26.3% of all the nine topics. The second most frequent LDA topic is
Topic 2 (Epidemic Situation and Outbreak), which accounted for 20.1%. Topic 9
(Government Announcement and Responses) and Topic 7 (Daily Infected, Death,
and Recovered Cases) are 13.6% and 11.7%, respectively, and are the third and
fourth most frequent topics. Topic 5 (Medical Care and Health Organization
Responses), Topic 3 (Vaccine and Treatment), and Topic 4 (Demonstration for
Wages) and Relief are at fifth, sixth, and seventh positions, and They accounted
for 9.8%, 5.7%, and 5.2%, respectively. Finally, Topic 6 (Repatriation and In-
ternational Situations) and Topic 1 (Economic Crisis and Incentives) are the
least frequent topics, and the proportion of these two topics is less than 5%. By
reviewing all these topics and analysis, we can insight into the pandemic or any
important incident in a society.22 Fahim Shahriar and Md Abul Bashar
Topic 1 Topic 2 Topic 3
(a) Word cloud of Topic 1 (b) Word cloud of Topic 2 (c) Word cloud of Topic 3
Topic 4 Topic 5 Topic 6
(d) Word cloud of Topic 4 (e) Word cloud of Topic 5 (f) Word cloud of Topic 6
Topic 7 Topic 8 Topic 9
(g) Word cloud of Topic 7 (h) Word cloud of Topic 8 (i) Word cloud of Topic 9
Fig. 14. Word Clouds for nine topicsAutomatic Monitoring Social Dynamics During Big Incidences 23
Word Count and Importance of Topic Keywords Word Count and Importance of Topic Keywords Word Count and Importance of Topic Keywords
Topic: 1 Topic: 2 Topic: 3
3500 0.030 3500 0.030 3500 0.030
Word Count Weights Word Count Weights Word Count Weights
3000 3000 3000
0.025 0.025 0.025
2500 2500 2500
0.020 0.020 0.020
2000 2000 2000
Word Count
Word Count
Word Count
0.015 0.015 0.015
1500 1500 1500
0.010 0.010 0.010
1000 1000 1000
0.005 0.005 0.005
500 500 500
0 0.000 0 0.000 0 0.000
(a) Word counts of Topic 1 (b) Word counts of Topic 2 (c) Word counts of Topic 3
Word Count and Importance of Topic Keywords Word Count and Importance of Topic Keywords Word Count and Importance of Topic Keywords
Topic: 4 Topic: 5 Topic: 6
3500 0.030 3500 0.030 3500 0.030
Word Count Weights Word Count Weights Word Count Weights
3000 3000 3000
0.025 0.025 0.025
2500 2500 2500
0.020 0.020 0.020
2000 2000 2000
Word Count
Word Count
Word Count
0.015 0.015 0.015
1500 1500 1500
0.010 0.010 0.010
1000 1000 1000
0.005 0.005 0.005
500 500 500
0 0.000 0 0.000
0 0.000
(d) Word counts of Topic 4 (e) Word counts of Topic 5 (f) Word counts of Topic 6
Word Count and Importance of Topic Keywords Word Count and Importance of Topic Keywords Word Count and Importance of Topic Keywords
Topic: 7 Topic: 8 Topic: 9
3500 0.030 3500 0.030 3500 0.030
Word Count Weights Word Count Weights Word Count Weights
3000 3000 3000
0.025 0.025 0.025
2500 2500 2500
0.020 0.020 0.020
2000 2000 2000
Word Count
Word Count
Word Count
0.015 0.015 0.015
1500 1500 1500
0.010 0.010 0.010
1000 1000 1000
0.005 0.005 0.005
500 500 500
0 0.000 0 0.000 0 0.000
(g) Word counts of Topic 7 (h) Word counts of Topic 8 (i) Word counts of Topic 9
Fig. 15. Word Counts for nine topics
Fig. 16. t-SNE clustering chart24 Fahim Shahriar and Md Abul Bashar
1/14/2021 outputframe(17).html
Intertopic Distance Map (via multidimensional scaling) Top-30 Most Salient Terms1
0 5,000 10,000 15,000 20,000 25,000
PC2
হাসপাতাল
উপেজলা
8 মৃতু
শনা
কেরানাভাইরাস
পরী া
সং মণ
িচিকৎসক
ভাইরাস
া
2 িমক
9 মিডেকল
বি
নাগিরক
3
PC1 াইট
িচিকৎসা
সাজন
যা ী
ব াংক
4 সং হ
6
আইইিডিসআর
কারখানা
অিধদ র
আইেসােলশন
যু রা
1
কায়ােরি ন
5 কমকতা
7 পিরবার
কমে
Marginal topic distribution লকডাউন
Overall term frequency
2% Estimated term frequency within the selected topic
5% 1. saliency(term w) = frequency(w) * [sum_t p(t | w) * log(p(t | w)/p(t))] for topics t; see Chuang et. al (2012)
2. relevance(term w | topic t) = λ * p(w | t) + (1 - λ) * p(w | t)/p(w); see Sievert & Shirley (2014)
10%
Selected Topic: 0 Previous Topic Next Topic Clear Topic
file:///home/qwertyz/Downloads/LDA_bn2.ipynb - Colaboratory_files/outputframe(17).html 2/3
Fig. 17. Interactive Topic Visualization
Epidemic Situation & Outbreak
Economic Crisis & Incentives
Repatriation & International
Situations
9.8%
20.1% Daily infected,death and
5.2% recovered cases
5.7% Strategic Preparedness
3.5% Government Announcement
and Responses
4.3%
13.6%
Vaccine & Treatment
11.7% Demonstration for wages and
relief
Medical Care & Health
26.2% Organization Re...
Fig. 18. Proportion of Topic Frequency Distribution in the News CollectionAutomatic Monitoring Social Dynamics During Big Incidences 25
(a) Topic 1: Economic Crisis & Incentives (b) Topic 2: Epidemic Situation & Outbreak
350
2000
300
250 1500
200
Frequency
Frequency
150 1000
100
500
50
0 0
4 6 8 10Week number of the12year 2020 14 16 18 4 6 8 10Week number of the12year 2020 14 16 18
(a) Topic 1 (b) Topic 2
(c) Topic 3: Vaccine & Treatment (d) Topic 4: Demonstration for wages and relief
400
2000
300
1500
Frequency
Frequency
1000 200
500 100
0 0
4 6 8 10Week number of the12year 2020 14 16 18 4 6 8 10Week number of the12year 2020 14 16 18
(c) Topic 3 (d) Topic 4
(e) Topic 5: Medical Care & Health Organization Responses (f) Topic 6: Repatriation & International Situations
1000
2000
800
1500
600
Frequency
Frequency
1000
400
500 200
0 0
4 6 8 10Week number of the12year 2020 14 16 18 4 6 8 10Week number of the12year 2020 14 16 18
(e) Topic 5 (f) Topic 6
(g) Topic 7: Daily infected,death and recover cases (h) Topic 8: Strategic Preparedness
2000 2000
1500 1500
Frequency
Frequency
1000 1000
500 500
0 0
4 6 8 10Week number of the12year 2020 14 16 18 4 6 8 10Week number of the12year 2020 14 16 18
(g) Topic 7 (h) Topic 8
(i) Topic 9: Government Announcement and Responses
2000
1500
Frequency
1000
500
0
4 6 8 10Week number of the12year 2020 14 16 18
(i) Topic 9
Fig. 19. Topics Evolution of nine topics26 Fahim Shahriar and Md Abul Bashar
Dynamic Topic Modeling: Temporal Trends of Topics To show the evo-
lution of topics overtime during the pandemic, we used Dynamic Topic Modeling
Blei and Lafferty (2006). Figure 19 shows the evolution of nine topics over weeks
during the pandemic. The figure shows how the popularity of each topic and the
top words (i.e., keywords) in the topic changed over time. The overall temporal
trend of these topics is shown in Figure 20.
Topic 1: “Economic Crisis and Incentives” climbed from early March and
stopped rising at the end of March. Then the curve continued to decline until
the beginning of April and rose slowly in the middle of April. Then again, the
curve continued to decline until the beginning of May. Then finally it reached a
peak in the middle of May.
Topic 2: “Epidemic Situation and Outbreak” climbed from the beginning of
March and stopped rising at the end of April. The curve then steadily continued
to decline until the beginning of April. Then slowly rose the curve to the middle
of April. Furthermore, again continued to decrease the curve until the beginning
of May and then rose to a peak in the middle of May finally.
Topic 3: “Vaccine and Treatment” climbed from the end of February and
stopped growing at the beginning of March. Then the curve steadily continued
to decline until the middle of March. And then again started to rise and reached
a peak at the end of March. Then it also started to decline the curve until the
middle of May. After that, the curve fluctuated till the end.
Topic 4: “Demonstration for wages and relief” climbed from the beginning
of March. Then the curve stopped rising in the middle of March. After that, the
curve was fluctuating between the middle of March and the middle of April, and
then the curve reached a peak in the middle of April. Then the curve steadily
declined until the beginning of May and rose slowly in the middle of May.
Topic 5: “Medical Care and Health Organization Responses” climbed from
the beginning of February and stopped rising in early March. Then the curve
started to rise from the beginning of March. In the middle of April, the curve
reached its peak point. Then The slope of the curve gradually deteriorates after
the middle of April.
Topic 6: “Repatriation and International Situations” climbed from the be-
ginning of February and stopped rising early in March. The curve then steadily
declined and then again started to rise from early March to the middle of March.
After that, the curve had a steady state for a while; it went to the top at the end
of March. Then again, the curve steadily declined until the beginning of April.
Then the curve fluctuated till the end.
Topic 7: “Daily infected, death and recovered cases” climbed from the begin-
ning of February. As the number of infected and death cases was growing every
day so that the number of daily infected deaths, death cases were also rising
every day. So the curve was also rising. The curve reached its peak at the end of
April. Then the curve declined until the beginning of May. After that, the curve
again started to rise from the end of April to the end.
Topic 8: “Strategic Preparedness” climbed from the beginning of March and
stopped rising at the end of March. Then the curve declined until the end ofAutomatic Monitoring Social Dynamics During Big Incidences 27
March. After that, the curve started to rise from the end of March. Suddenly
the curve downgraded for a while and then again started to rise up and then it
peaked. The curve then steadily declined until the beginning of May and rose
slowly in the middle of May.
Topic 9: “Government Announcement and Responses” climbed from the be-
ginning of March and reached a peak in the middle of March. Then the curve
declined until the middle of April. After that, the curve again started to fluctuate.
Then also, the curve steadily deteriorated until the end of April. Furthermore,
finally, the curve rose slowly till the end.
Spatial Distribution of Topics This subsection details the experimental re-
sults of the spatial distribution of the topics.
Topic 1: “Economic Crisis and Incentives” mainly concentrated on the Dhaka
division shown in Figure 21a. Most people of the Dhaka division lost their job in
that period. This incident also happened in Chittagong to a small extent. The
government and various agencies provided Relief and incentives to the victims.
In this case, the area that has received the most relief is the Dhaka and the
Chittagong division.
Topic 2: “Epidemic Situation and Outbreak” mainly focused on the central
and southern parts of Bangladesh, shown in Figure 21b. We can see that Dhaka
is the most affected city in Bangladesh at that particular time. Most COVID-19
infected patients have been identified in Dhaka, more deaths have been reported
in Dhaka, the situation in Dhaka was much worse than other districts and divi-
sions at that time, and there was a much higher prevalence. Apart from Dhaka,
Narayanganj, Gazipur, Chittagong has also been affected so much.
Topic 3: “Vaccine and Treatment” mainly focused on Dhaka, Chittagong,
Gazipur, Narayanganj area in Bangladesh, shown in Figure 21c. Since the preva-
lence of COVID-19 is higher in Dhaka, its adjoining districts like Narayanganj,
Gazipur, and Chittagong so that treatments were shouted comparatively higher
than in other districts. COVID-19 vaccine is also being studied in Dhaka.
Topic 4: “Demonstration for wages and relief” is mainly concentrated all over
the country shown in Figure 21d. The situation is terrible all over the country
due to COVID-19. Those who are day laborers have lost their jobs; they have
become destitute. For this, they had to come out of the house to survive. They
had to move on the streets to provide food for their families. Since in every
district of Dhaka, Chittagong, Rajshahi, Barisal, Khulna, Mymensingh, Sylhet,
Rangpur, people had taken to the streets to protest for survival.
Topic 5: “Medical Care and Health Organization Responses” also focused
all over the country like Topic 4, shown in Figure 21e. The state of the health
system in the whole country is deplorable. Health organizations were in a very
critical situation.
Topic 6: “Repatriation and International Situations” mainly concentrated on
China, USA, Italy, Russia, and other countries shown in Figure 21f. This topic
talks about the situations of foreign countries and the immigrants who wanted
to return to Bangladesh. Here those countries have been shown in Figure 21f.You can also read