A standardized database of Marine Isotope Stage 5e sea-level proxies in southern Africa (Angola, Namibia and South Africa) - ESSD
←
→
Page content transcription
If your browser does not render page correctly, please read the page content below
Earth Syst. Sci. Data, 13, 953–968, 2021
https://doi.org/10.5194/essd-13-953-2021
© Author(s) 2021. This work is distributed under
the Creative Commons Attribution 4.0 License.

            A standardized database of Marine Isotope Stage 5e
               sea-level proxies in southern Africa (Angola,
                         Namibia and South Africa)
                                       J. Andrew G. Cooper1,2 and Andrew N. Green2,1
           1 Geography   and Environmental Science, Ulster University, Coleraine BT52 1SA, Northern Ireland, UK
                          2 Discipline of Geology, University of KwaZulu-Natal, Durban, South Africa

                              Correspondence: J. Andrew G. Cooper (jag.cooper@ulster.ac.uk)

                                     Received: 22 June 2020 – Discussion started: 25 August 2020
                          Revised: 2 December 2020 – Accepted: 14 January 2021 – Published: 9 March 2021

       Abstract. Evidence for sea-level change during and around Marine Isotope Stage (MIS) 5e (ca. 125 ka) in
       southern Africa derives from a wide variety of geomorphic and sedimentological sea-level indicators, supported
       in the past 2 decades by absolute chronological control, particularly on littoral deposits, some of which have
       a quantifiable relationship to former sea level. In addition to these proxies, data provided by both terrestrial
       (dune sediments and archaeological remains) and marine (lagoonal and nearshore littoral sediments) limiting
       points provide broad constraints on sea level. Here, we review publications describing such data points. Us-
       ing the framework of the World Atlas of Last Interglacial Shorelines, we insert in a standardized database
       (https://doi.org/10.5281/zenodo.4459297, Cooper and Green, 2020) all the elements available to assess former
       palaeo-relative sea level (palaeo-RSL) and the chronological constraints associated with them (including un-
       certainties). Overall, we reviewed 71 studies, from which we extracted 39 sea-level indicators and 26 limiting
       points. As far as age attribution is concerned, early analysis of molluscs and whole-rock beachrock samples us-
       ing U series allowed dating of several sea-level indicators during the 1980s, but the more widespread application
       of optically stimulated luminescence (OSL) dating since 2004 has yielded many more (and more accurate) sea-
       level indicators from several sites. This has helped resolve the nature and timing of MIS 5e shorelines and has
       the potential to further elucidate the apparent presence of two or more sea-level peaks at several South African
       sites during this interval. The standardized sea-level database presented in this paper is the first of its kind for this
       region. Future research should be directed to improve the stratigraphic description of last interglacial shorelines
       and to obtain better dating, high-accuracy elevation measurements with better palaeo-RSL interpretation.

1   Introduction                                                      by Düsterhus et al. (2016). In brief, the WALIS interface al-
                                                                      lows a large range of data and metadata on last interglacial
This paper aims to describe in detail the background in-              relative sea-level indicators and associated ages to be inserted
formation contained in the southern Africa Marine Isotope             into a MySQL database. An export tool allows users to down-
Stage (MIS) 5e sea-level database, which was compiled as              load their datasets as a multi-sheet XLS file. The database for
a contribution to the World Atlas of Last Interglacial Shore-         southern Africa described in this study represents the output
lines (WALIS) ESSD special issue. The database was created            of the export tool mentioned above, it is open access (Cooper
using the WALIS interface, available at https://warmcoasts.           and Green, 2020, https://doi.org/10.5281/zenodo.4459297),
eu/world-atlas.html (last access: 23 February 2021). The              and it is available at https://zenodo.org/record/4459297#
WALIS interface has been built following the lessons learned          .YAwp0MX7RQ8. Each field in our database is de-
from the PALSEA (a PAGES–INQUA) working group in                      scribed by Rovere et al. (2020) at the following link:
terms of sea-level databases, summarized in a recent paper            https://doi.org/10.5281/zenodo.3961544. The open access

Published by Copernicus Publications.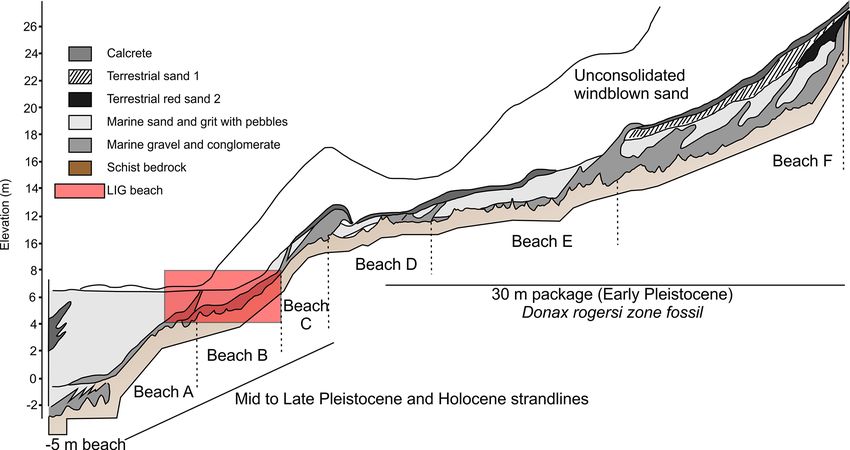
954                                 J. A. G. Cooper and A. N. Green: A standardized database of MIS 5e sea-level proxies

database will facilitate research on the global and regional      5 because they contained Acheulean tools. The presence of
patterns of sea-level change by the sea-level research com-       stone tools of only the Sangoan culture (130–10 ka BP) was
munity, including geophysical modellers, oceanographers,          regarded as indicative of last interglacial shorelines: for ex-
geologists and archaeologists.                                    ample, on this basis Davies (1970) assigned a probable last
   To describe our database, and help the reader navigate         interglacial age to a shoreline at ca. +9 m in KwaZulu-Natal,
through our choices in standardizing other authors’ works,        on the east coast of South Africa (Fig. 1). Archaeological
we first give an overview of the published literature in the      investigations (e.g. Fisher et al., 2013) continue to identify
region of interest (See Sect. 2). While not all the studies       sites that may hold evidence of former sea levels during for-
cited in this section contain enough data to be included in       mer highstands.
the database, they represent the historical background upon          The presence of Early Pleistocene and Tertiary animal
which new data were collected and include sites that provide      macrofossils (e.g. Hendey, 1970; Kensley and Pether, 1986;
the potential for further investigation with modern dating        Pether, 1986; Le Roux, 1990) provided the first absolute con-
techniques. Then, we describe the types of sea-level indica-      trols on some elevated shorelines, particularly in the Western
tors and elevation measurement techniques we encountered          Cape. These studies demonstrated that shorelines higher than
while compiling the database (see Sects. 3 and 4). In Sect. 5,    ca. 10 m were Early Pleistocene or older (several high shore-
we report details for each administrative province/region         lines date to the Miocene and Pliocene). Le Roux (1990)
within the area of interest, where sea-level data were re-        used these macrofossils to correlate Neogene units (includ-
viewed. In the final two sections, we discuss further details     ing shoreline deposits) around the entire Cape coast of South
on other metadata on palaeo-sea-level indicators that are not     Africa.
included in our database but that might be useful as research        Dating and identification of the relationship of potential
on Quaternary shoreline progress in southern Africa. We dis-      last interglacial shorelines to former sea levels remained
cuss future research directions that may stem from this data      problematic and contentious through the 1970s to the 1990s.
compilation in Sect. 6.                                           Tankard (1975a, b) noted the presence of shoreline de-
                                                                  posits (open coast and lagoonal) associated with higher-than-
                                                                  present sea levels in the Western Cape (St Helena Bay area)
2   Literature overview                                           (Fig. 1). By comparison with modern open-coast and estuar-
                                                                  ine deposits, the former sea level was calculated at +6.25 m
Multiple elevated shorelines (some exceeding 100 m above          (Tankard, 1975a), and by comparison with global occur-
sea level) occur around the coast of southern Africa (Angola,     rences of shorelines at this elevation, it was assigned a prob-
Namibia and South Africa). Many of these extend over large        able MIS 5e age. These deposits contained sub-fossil mol-
distances, and they have long been recognized and described       lusc shells (in life position and transported) that included
in varying levels of detail (e.g. Krige, 1927; Haughton, 1931;    a cool-water open-coast assemblage and a lagoonal assem-
Soares do Carvalho, 1961; Davies, 1970, 1972, 1973, 1980).        blage that included species currently confined to the trop-
These and other studies have enabled a compilation of South       ics. These thermally anomalous molluscs (Tankard, 1975b)
African sea-level data for the Plio–Pleistocene (Hearty et al.,   were taken as indicative of warmer waters during the last
2020). Many early descriptions of sedimentary evidence of         interglacial. Tankard (1975b) noted several sites between
former sea level are rather vague, with imprecise levelling,      St Helena Bay and Knysna where these assemblages oc-
positioning and a lack of absolute (and even relative) dating     curred in sediments associated with a former sea level of ca.
control, but they drew attention to the presence and nature of    +6 m (Fig. 1). In a regional review of Pleistocene shorelines,
many potential MIS 5e deposits. Geomorphological and oc-          Davies (1970, 1971, 1972, 1980) presented a gazette of sev-
casional sedimentological description of these raised coastal     eral potential last interglacial sites, both estuarine and open
deposits was often scarce or incomplete, and their relation-      coast, in South Africa and Namibia where molluscs that are
ship to former sea level was imprecisely defined. The issues      currently restricted to warmer waters of west and east Africa
regarding levelling are discussed below (Sect. 4), but in this    occur. These he termed the Swartkops fauna. Davies (1980)
overview, unless otherwise stated, elevations are expressed in    stated (p. 154) “In estuaries of the South Cape between Co-
relation to mean sea level (MSL).                                 ega and Mossel Bay and apparently as far west as Arniston,
   Previous dating of higher-than-present shorelines in south-    beds occur with warm-water fauna at peak altitudes of +4
ern Africa came from the study of archaeological mate-            to +9 m. Some have probably been eroded, and all would
rial with no fixed relationship to sea level. It could, how-      have been laid down under water, so MSL would have been
ever, be used to constrain the minimum age of coastal de-         over +9 m”. A warm-water estuarine fauna from a +6–8 m
posits. The presence of Acheulean (approx. 1.5 Ma–150 ka)         estuarine terrace at Kosi Bay (Fig. 1) was also assigned to
tools in littoral deposits or on elevated marine terraces was     the last interglacial (Cooper et al., 1989). Subsequently, Le
frequently used to differentiate pre-last-interglacial shore-     Roux (1990) reported that these warm-water mollusc species
lines. Davies (1980), for example, maintained that all ele-       from estuarine/lagoonal facies were associated with the 6–
vated beach deposits above 4 m in Namibia were pre-MIS            8 m shoreline and are probably coincident with “the well-

Earth Syst. Sci. Data, 13, 953–968, 2021                                           https://doi.org/10.5194/essd-13-953-2021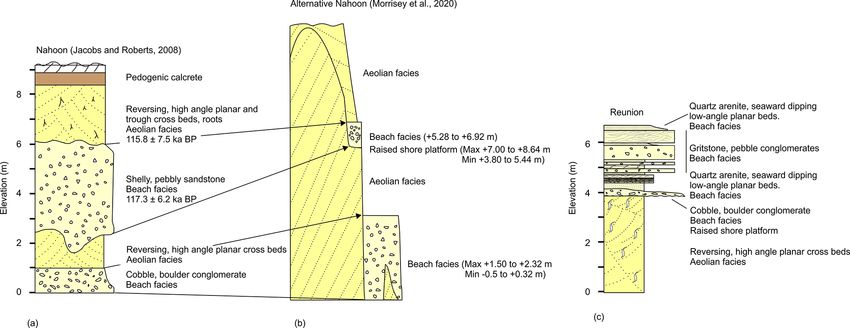
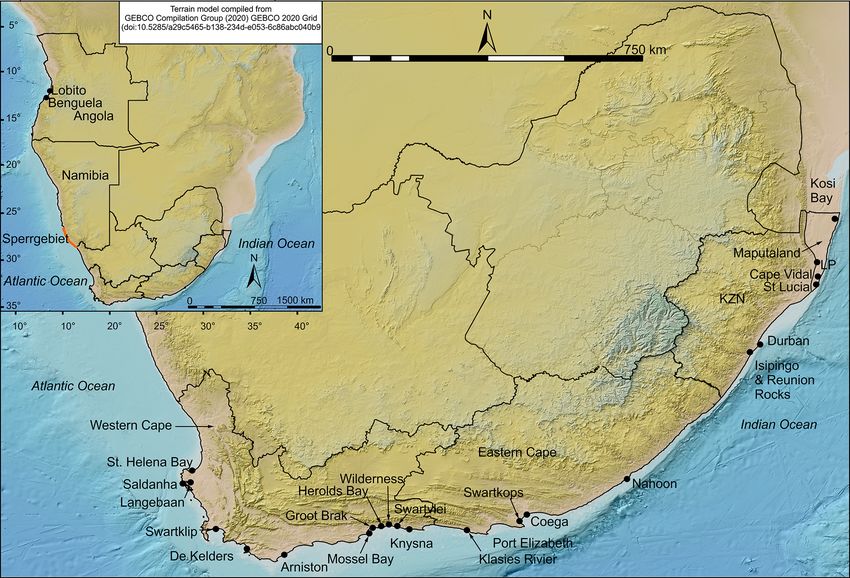
J. A. G. Cooper and A. N. Green: A standardized database of MIS 5e sea-level proxies                                                    955

Figure 1. (Inset) Locality Map of the Angolan, Namibian and South African coasts showing sites mentioned in the text. Main map shows
details of sites in South Africa (KZN: KwaZulu-Natal province; LP: Lister’s Point). Co-ordinates for each site are provided in the database.

documented period of higher temperatures at c. 120 000 B.P.              stands during the 5e interglacial, separated by a period of
(Kilburn & Tankard, 1975).”                                              regression and dune building.
   Several sedimentological and geomorphological obser-                     From the 1970s until early 2000s, in the absence of direct
vations suggested the presence of more than one last in-                 dating, it was widely accepted that the MIS 5e shoreline(s)
terglacial stillstand of sea level at South African sites.               in South Africa was associated with sea level in the approx-
Hobday (1976) recognized three last interglacial shore-                  imate +6–8 m range (e.g. Hobday, 1976; Hobday and Jack-
lines from Lake St Lucia (+8, +3.4–5.3 and +4.5 m),                      son, 1979; Barwis and Tankard, 1983; Cooper and Flores,
and Tankard (1976) found three last interglacial shorelines              1991). The lack of dating control beyond old (contaminated)
around Saldanha Bay (+6.3, +2–3.5 and 0 m) (Fig. 1). At                  C14 dates limited further comment on the time of deposition
least the lowest of these three in each case may now be tenta-           of these units.
tively assigned a Late Holocene age (Cooper et al., 2018).                  Hendey and Cooke (1985) and Hendey and Volman (1986)
Davies (1971, 1972, 1980) noted the repeated occurrence                  mounted a challenge to this view after they found (on the ba-
around the entire South African coast of a +6 m terrace in-              sis of vertebrate fossil evidence) that deposits at Saldanha
cised into a +9 m terrace, implying two highstands separated             Bay associated with a +6–8 m shoreline (that had previously
by a regression. Barwis and Tankard (1983) also recorded                 been correlated with MIS 5e) were actually of Early Pleis-
two shorelines separated by a regression at Swartklip near               tocene (1–1.5 Ma) age. Building on this, they then challenged
Cape Town (Fig. 1). Cooper and Flores (1991) described the               the admittedly tenuous reported links between sea level and
sedimentary facies of an outcrop at Isipingo near Durban                 human occupation of important archaeological deposits in a
(Fig. 1) and demonstrated that sediments from two former                 cave at the Klasies River mouth (Fig. 1). This evidence, they
high sea levels were preserved between +5 and +6 m. Sedi-                maintained, supported an Early Pleistocene age for formation
mentological work at Nahoon near East London (Jacobs and                 of the +6–8 m erosional terrace in the cave. They asserted
Roberts, 2009) (Fig. 1) also pointed to two sea-level high-              that occupation of the cave (supported by U / Th dates of 98

https://doi.org/10.5194/essd-13-953-2021                                                    Earth Syst. Sci. Data, 13, 953–968, 2021
956                                 J. A. G. Cooper and A. N. Green: A standardized database of MIS 5e sea-level proxies

and 110 ka) was contemporaneous with formation of a lower         Sperrgebiet, or forbidden zone (Fig. 1), rest on erosional ter-
(supposed MIS 5e) erosional terrace associated with a +4 m        races and were labelled A–F (with increasing elevation) by
sea level. Based on observations at this and two other cave       Corvinus (1983) (Fig. 2). This terminology has since been
sites (at De Kelders and Herolds Bay, Fig. 1), they contended     widely applied. Shorelines D, E and F range in bedrock plat-
that the +6–8 m shoreline in South Africa was Early Pleis-        form height from +10 to +30 m a.m.s.l. (Fig. 2). They con-
tocene and the MIS 5e sea level did not exceed +4 m. Sub-         tain a warm-water marine zone fossil Donax rogersi and are
sequent OSL dating (see below) shows that their contention,       Tertiary in age (SACS, 1980; Apollus, 1995; Jacob, 2001;
based on universal extrapolation from a few sites, was incor-     Roberts and Brink, 2002). Shorelines A, B and C are charac-
rect.                                                             terized by modern cold-water faunas, particularly the infau-
   Barwis and Tankard (1983) reported undated observations        nal bivalve Donax serra (Pickford and Senut, 2000; Pether,
of shoreline deposits related to two closely spaced highstands    2000; Jacob, 2001; Miller, 2008). These littoral deposits trun-
at Swartklip, near Cape Town. The sedimentary deposits            cate calcrete sandstones and underlying sands bearing the
were interpreted as beachrock capped by calcrete, topped by       fossil Equus capensis and Acheulean artefacts and are there-
estuarine sediments and washover fans. These in turn were         fore younger than Middle Pleistocene (Pickford and Senut,
overlain by aeolian dunes. The washover deposits were tenta-      2000). Fossil and Middle Stone Age archaeological remains
tively linked to a 135 ka sea-level high and have been widely     suggest that these lower shorelines (A–C) are younger than
cited as examples of last interglacial shorelines. Subsequent     200 000 years. The supposed Middle Pleistocene (C beach)
sedimentological and fossil analysis (John Pether, personal       is located at +8 m, and the Late Pleistocene (MIS 5e) (B
communication, 2020), however, reveals that the estuarine         beach) is at +4 m (Hallam, 1964; Corvinus, 1983; Pether,
and washover deposits represent inter-dune wetlands and ae-       1986; Schneider and Miller, 1992; Ward, 2000; Pether et al.,
olian deposits, respectively, and that both form part of a ma-    2000). The A beach at +2–3 m is likely of Holocene age, but
jor MIS 7 aeolian dune deposit (Roberts et al., 2009). MIS        no absolute dating control has been established on shorelines
5 shorelines are, however, represented in the immediate sur-      A, B or C.
roundings by marine erosional surfaces and littoral deposits         In Angola, Soares do Carvalho (1961) first identified sev-
that require further study (John Pether, personal communica-      eral marine terraces at various elevations above present sea
tion, 2020).                                                      level. These had littoral deposits resting upon them, and as
   Apart from several old and contaminated radiocarbon            in Namibia, terraces and overlying deposits were considered
dates, no absolute dates existed for supposed MIS 5e shore-       to be broadly coeval. Giresse at al. (1984) reported U-series
line deposits in South Africa until Davies (1980, p. 162) re-     dates on a number of these terraces at elevations between
ported the results of amino acid racemization dating of mol-      0 and 55 m near Benguela and Lobito (Fig. 1). Of these,
luscs from three sites near Port Elizabeth (Fig. 1). The re-      three dates, deemed by the authors to be acceptable, were in
sults, although inconclusive, suggested that two shells from      the MIS 5 range. Mollusc samples from a +10–12 m terrace
a deposit at +6.5 m but “contemporary with the +8 m beds          dated to 91 and 136 ka, and those from a +20 m terrace dated
upstream” in the Swartkops estuary “may be 130 000 B.P. or        to 103 ka. These provided little additional insight into the
perhaps in the range 160 000–220 000”. The first published        chronology of the Angolan shorelines, which remained enig-
compilation of late Quaternary to recent sea-level data (Ram-     matic. Walker et al. (2016) identified a widespread terrace
say and Cooper, 2002) included only four dates from the late      at +25 m elevation that dated to 45 ka (based on eight OSL
Quaternary, all of them based on uranium series dating. Since     dates). This demonstrated Late Pleistocene dynamic uplift of
then, detailed studies in the Wilderness and Mossel Bay ar-       the Angolan coast by ca. 300 m (ca. 2 mm/yr) via a mantle
eas of the Western Cape (Fig. 1) (Carr et al., 2010; Bate-        done with diameter of ca. 1000 km, centred on Benguela.
man et al., 2008, 2011) and the Maputaland coastal plain in       This finding of substantial tectonic deformation along the
KwaZulu-Natal (Porat and Botha, 2008) applied OSL dating          Angolan coast effectively requires a reappraisal of the ages
to aeolianite and occasional littoral facies to investigate the   and elevations of all shorelines in Angola, which has yet to
timing of major coastal barrier and dune-building episodes.       be undertaken.
These were subsequently extended by offshore investigations          We note that our database contains information on palaeo-
that applied optically stimulated luminescence (OSL and, in       relative sea levels. The relative term highlights the fact that
one instance, paired OSL and U series) dating to submerged        every palaeo-sea level we report is uncorrected for poten-
deposits (Bosman, 2012; Cawthra et al., 2018, 2019, 2020).        tial post-depositional uplift or subsidence due to, for exam-
Data from these studies are reported below in a regional re-      ple, tectonics or glacial isostatic adjustment. Although the
port of data availability.                                        South African coast is regarded as tectonically stable dur-
   In southern Namibia, diamond mining provided the im-           ing the Quaternary, the potential impact of neotectonics on
petus for investigation of former shoreline deposits both         raised shoreline elevation has also been raised in northwest-
onshore and offshore (e.g. Spaggiari et al., 2006; Spag-          ern South Africa (Namaqualand) and Namibia. Roberts and
giari, 2011; Runds, 2017; Runds et al., 2019; Kirkpatrick et      Brink (2002) reported deformation of Miocene and Pliocene
al., 2019). The several higher-than-present “beaches” of the      shorelines on the NW coast of South Africa involving ca.

Earth Syst. Sci. Data, 13, 953–968, 2021                                           https://doi.org/10.5194/essd-13-953-2021
J. A. G. Cooper and A. N. Green: A standardized database of MIS 5e sea-level proxies                                              957

Figure 2. Schematic east–west cross section through the raised beach deposits of southern Namibia (modified from Runds, 2017). Subtidal
to +10 m elevations represent the A, B and C beaches, and the +30 m package represents the D, E and F beaches). Data were compiled
originally from Hallam (1964) and Jacob (2001). Beach “B” is commonly ascribed to MIS 5e but has not been dated definitively.

50 m vertical displacement. Raised beaches in the southern            them. Although they can be related to former sea levels by
Sperrgebiet (southern Namibia, Fig. 1) said to be of Plio–            comparison with modern regional equivalents (Smith et al.,
Pleistocene age appear to diminish in altitude from south to          2010; Dixon et al., 2015; Cooper and Green, 2016), few of
north (Stocken, 1978; Dingle et al., 1983) and may imply              these documented occurrences have been dated. Notable ex-
recent deformation. Pickford and Senut (2000) note, how-              ceptions are the raised beaches overlying shore platforms in
ever, that some of the Sperrgebiet shorelines may be as old           Angola (Walker et al., 2016) that proved not to be of MIS 5
as Miocene and the appearance of tilting could be an artefact.        age but which establish the utility of this sea-level indicator.
                                                                         Contemporary tidal inlet (Cooper, 1990, 2001) and fore-
                                                                      shore facies (Smith et al., 2010) extend over a vertical range
3   Sea-level indicators                                              of a few metres on the microtidal (ca. 2 m) and high-energy
                                                                      coast of southern Africa, and no systematic report of their
In reviewing existing studies, we identified several types of         relationship to contemporary sea-level datums exists. Conse-
last interglacial sea-level indicators in the region (Table 1).       quently, the former sea level associated with these deposits
All are sedimentological (based on distinctive sedimentary            can only be constrained to within a few metres through com-
facies that are diagnostic of particular marine, coastal and          parison with their modern equivalents (Carr et al., 2010;
terrestrial environments), while one (beachrock) has an addi-         Cawthra et al., 2018). Identification of swash zone sediments
tional diagenetic component. Their indicative meaning (i.e.           can potentially provide somewhat better constraint on for-
the relationship between the elevation of the indicator and           mer sea level (Cooper, 2014) as the swash zone typically ex-
the palaeo-relative sea level it represents) can be inferred          tends from the low water mark to the beach berm. However,
by comparison with modern equivalents within certain error            wave run-up on beaches depends on many factors includ-
limits (Shennan et al., 2015; Rovere et al., 2016), but this          ing the beach slope and grain size and can be significantly
was not always undertaken in the original study. In such in-          higher during storms. Wave run-up on South African beaches
stances, in the database we have sought to retrofit this in-          ranged from 2 to 9 m during a storm in 2007 (Mather et al.,
terpretation to the reported observations. Several other data         2010).
points are simply limiting dates. These occur an unquantifi-             Following Hearty et al. (2007), the contact between
able distance above (terrestrial limiting) or below (marine           shoreface and foreshore sediments was used as a sea-level in-
limiting) sea level. Most of these included in the dataset are        dicator in South Africa by Roberts et al. (2012) and Cawthra
derived from aeolianite that accumulated above (Mean High             et al. (2018). This occurs in outcrop as a planar, conformable
Water) (MHW).                                                         contact between cross-bedded gravelly sands (shoreface) and
   The most widespread sea-level indicators in southern               planar bedded, gently dipping sands (foreshore) and is corre-
Africa are shore platforms (Kennedy, 2015; Rovere, 2016)              lated with mean low tide.
that sometimes have associated littoral deposits resting upon

https://doi.org/10.5194/essd-13-953-2021                                                Earth Syst. Sci. Data, 13, 953–968, 2021
958 J. A. G. Cooper and A. N. Green: A standardized database of MIS 5e sea-level proxies
Table 1. Sea-level indicators used in this study and their relationship to sea level at the time of deposition. MHHW: mean higher high water;
MLLW: mean lower low water (chart datum); MLW: mean low water.
Name of RSL indicator Description of RSL indicator Description of relative Description of indica- Indicator reference
water level tive range
Beach deposit or beachrock Definition by Mauz et (Ordinary Ordinary Mauz et al. (2015);
al. (2015): “Fossil beach berm + breaking berm − breaking Rovere et al. (2016)
deposits may be composed of depth)/2 depth
loose sediments, sometimes
slightly cemented. Beachrocks
are lithified coastal deposits
that are organized in sequences
of slabs with seaward incli-
nation generally between 5◦
and 15◦ .” Definition of indica-
tive meaning from Rovere et
al. (2016).
Beach swash deposit Part of the beach face located (Upper limit − lower Cooper (2013)
between mean sea level and limit)/2
foredune. Upper limit = spring
tidal range/2 or
MHHW
Lower limit = MSL
Foreshore deposits Beach deposits characterized (MHHW to MLLW)/2 MHHW to MLLW Cawthra et al. (2018)
by a horizontal or gentle
seaward-dipping lamination.
Lagoonal deposit Lagoonal deposits consist (Mean lower low wa- Mean lower low wa- Rovere et al. (2016);
of silty and/or clayey sedi- ter + modern lagoon ter − modern lagoon Zecchin et al. (2004)
ments, horizontally laminated depth)/2 depth
(Zecchin et al., 2004) and asso-
ciated with fossils of brackish
or marine water fauna. Defini-
tion of indicative meaning from
Rovere et al. (2016).
Shore platform Kennedy (2015) defines shore [Mean higher high Mean higher high Kennedy (2015)
platforms as “sub-horizontal water + (breaking water − (breaking Rovere et al. (2016)
rocky surfaces that interrupt depth − MLLW)/2]/2 depth − MLLW)/2
vertical cliffs at or near sea
level”. Definition of indica-
tive meaning adapted by
Rovere et al. (2016) from
Kennedy (2015).
Tidal inlet facies Coarse-grained, thickly bed- −0.5 to −3.5 m.s.l. −0.5 to −3.5 m.s.l. Carr et al. (2010)
ded, trough cross bedding, her-
ringbone cross bedding, multi-
ple scours, Ophiomorpha and
Skolithos trace fossils.
Foreshore/shoreface contact Highest elevation of contact The indicator marks ex- As the indicator is re- Roberts et al. (2012);
between cross-bedded gravelly actly MLW. ported to mark exactly Hearty et al. (2007)
shoreface sands and planar the MLW, the IR is
bedded, gently seaward dip- zero.
ping, foreshore sands. Occurs at
MLW.
Earth Syst. Sci. Data, 13, 953–968, 2021 https://doi.org/10.5194/essd-13-953-2021J. A. G. Cooper and A. N. Green: A standardized database of MIS 5e sea-level proxies 959
Beachrock is defined by a unique combination of sedimen- undertaken using total station and/or differential GPS with a
tary texture and cement (Vousdoukas et al., 2007; Mauz et al., reported vertical measurement error of ±1.5 cm.
2015). The distinctive bedding (near-horizontal plane lami-
nation, symmetrical ripples, and/or planar and trough cross 5 Overview of data points inserted in the database
beds) derives from deposition on the lower intertidal beach
and the cement is diagnostic of cementation in the intertidal The sea-level information reviewed for South Africa was ex-
zone. Several generations of cement can be present, and these tracted from sources that are described hereafter, with details
may reflect changes in porewater chemistry that result from reported in the Supplement annexed to this paper, as exported
changes in sea level and beach morphology (Kelly et al., from the WALIS data insertion. All site names are the same
2014; Wiles et al., 2018). Careful identification of particu- as those reported in the database.
lar beachrock sub-facies can provide sub-metre constraints The database includes 54 data points from stratigra-
on former sea level (Mauz et al., 2015). phy. Chronological control is based on luminescence dating
Many South African estuaries and lagoons contain brack- (49 data points), luminescence dating (12 data points), and
ish water back-barrier sediments with distinctive molluscan amino acid racemization (AAR) (1 data point), and 1 data
faunas, of which several are known to exist in a quantifiable point relies on chronostratigraphic control. The highest re-
relationship to sea level (Kilburn and Rippey, 1982). No in- ported accuracy is associated with the luminescence dates,
dicators of this type, have, however, been reported for MIS 5 whereas the AAR data point is extremely uncertain. Eleva-
in the study area. Sediments in contemporary back-barrier tions cited in the following text are stated in relation to MSL
locations extend from MHW to a maximum of −3 m, al- unless there is explicit information to relate them to another
though during fluvial floods, water levels can extend to 3– datum.
4 m higher (Cooper et al., 1990). In South African perched
lagoons (Cooper, 2001), which lack a surface connection to
5.1 Western Cape
the ocean for extended periods, the enclosed water level and
associated sediments may reach higher levels (seldom > 1 m In the Western Cape, important work on last interglacial
above MHW). No systematic morphological measurements shorelines has been conducted by Carr et al. (2010), who
are available for southern African back-barrier systems (Har- provided a detailed analysis from sites at three locations
rison et al., 2000). (Swartvlei, Great Brak estuary and Cape Agulhas) on the
The database also includes some broad indicators that south coast (Fig. 1). This involved several OSL dates for
simply record whether sea level was higher or lower than sea-level indicators (tidal inlet, beach berm and foreshore)
the dated sample. These include terrestrial limiting dates set and several terrestrial limiting data from overlying terres-
by aeolianites (now-cemented aeolian dunes that formed by trial dune (aeolianite) deposits. Collectively, these define a
wind action on dry land) or marine limiting dates set by sequence of sea-level indicators recording transgression to
undifferentiated shoreface sediments that formed at an un- a peak of ca. +8.5 m at ca. 127 ka followed by regression.
known depth below mean low water in the marine environ- At Swartvlei and Great Brak tidal inlet facies overlain by
ment. shoreface or aeolian facies indicate a highstand 6.0–8.5 m
above modern sea level. At Cape Agulhas, a gravel beach
(ca. 3.8 m a.m.s.l.) and an overlying sandy shoreface facies
4 Elevation measurements (up to 7.5 m a.m.s.l.) were deposited between 138 ± 7 ka and
118 ± 7 ka. The highstand was followed by accumulation of
The reviewed studies report elevations measured by either aeolian dunes (dating to 122 ± 7 ka and 113 ± 6 ka).
barometric altimeter (limited to early studies), levelling, or Cawthra et al. (2014) broadly confirmed these observa-
echo-sounding (multibeam echo-sounding in more recent tions but identified a second sea-level peak from the Great
studies) or do not report the elevation measurement method. Brak River sequence based on a lower foreshore deposit
As a consequence, the sea-level datum to which the data overlain by aeolianite in a regressive succession, which is in
are referred is usually not reported but has been assumed to turn overlain by a higher foreshore deposit heralding renewed
be mean sea level. The spring tidal range around southern transgression. The two foreshore units separated by aeolian-
Africa is generally less than 2 m, but more precise record- ite suggest two sea-level highstands separated by regression.
ing and reporting of the relationship of former littoral de- The second sea-level peak is represented by an ∼ 2 m thick
posits to contemporary sea level (and preferably a fixed da- coarse sandy tabular deposit with an orthometric height of
tum with a known relationship to modern sea level) are de- 6.8 m a.m.s.l. It was not dated but is younger than the under-
sirable in future studies in order to reduce vertical uncertain- lying foreshore sediments (111.2 ± 7 ka).
ties. Roberts et al. (2012) present a model for future inves- In a study primarily of MIS 11 deposits at Dana Bay,
tigations in which all elevations are reported to orthometric Roberts et al. (2012) also described and dated a regressive
zero, which is linked in turn to land levelling datum and the MIS 5 sequence comprising shoreface, foreshore and aeolian
WGS84 horizontal and vertical datums. Measurements were units. The shoreface–foreshore contact, marked by a transi-
https://doi.org/10.5194/essd-13-953-2021 Earth Syst. Sci. Data, 13, 953–968, 2021960 J. A. G. Cooper and A. N. Green: A standardized database of MIS 5e sea-level proxies
tion from cross-bedded gravelly sand to gently seaward dip- (Fig. 1), where an oyster shell from a beach whose base is at
ping planar bedded sands, was invoked as a palaeo-shoreline +4.5 m yielded a U / Th age of 104.9 ± 9 ka (Ramsay and
indicator as this contact occurs in contemporary beaches at Cooper, 2002)
mean low water. Using this approach in conjunction with
detailed and accurate levelling tied to fixed absolute levels,
Roberts et al. (2012) established the former low-tide level 5.3 KwaZulu-Natal
at +5.2 m. MSL is 1 m higher. Sea-level index points were Porat and Botha (2008), in a comprehensive study of dune
derived by OSL dating of the foreshore sands (125 ± 9 and development on the Maputaland coastal plain, established a
116 ± 9 ka), and a limiting date (125 ± 9 ka) was set by the chronology for the many aeolian depositional units. This en-
overlying aeolianite. abled a reappraisal of the regional stratigraphy (Botha, 2018).
At Langebaan several dated samples yielded a largely con- They, however, recorded only one MIS 5e date (132.7 ka,
cordant series of thermoluminescence (TL), infrared stimu- MP-22) from the crest of a 50 m high coastal dune at Cape
lated thermoluminescence (IRSL) and U-series ages. The ho- Vidal (Fig. 1), which gave no clear indication of the associ-
minid footprints horizon was dated to ∼ 108 ka, (corrected ated sea level. A cluster of U / Th ages from 95.7 to 117 ka
to ∼117 ka based on global sea-level curves and the con- (Ramsay et al., 1993), however, derived from marine shells,
formable contact with the underlying strata) (Roberts, 2008). beachrock and an elephant tusk associated with a solution
A discordant (older) TL date was attributed to incomplete pothole on an erosional terrace cut into aeolianite near Dur-
bleaching of quartz grains (Roberts and Berger, 1997). The ban, identify a sea level at about +6 m. This was correlated
Langebaan footprints were interpreted to date from initial re- with the second of two supposed (but undated) MIS 5 shore-
gression from the younger of two MIS 5e highstands identi- lines described at adjacent sites at Isipingo by Cooper and
fied at Nahoon (see below) at ∼ 120 ka (Roberts, 2008). Flores (1991). Similarly, supposed last interglacial shore-
line deposits were described from adjacent sites at Durban
5.2 Eastern Cape (Cawthra et al., 2012). At Phinda Game Reserve near St Lu-
cia (Fig. 1), an oyster shell in a palaeo-shoreline yielded a
Jacobs and Roberts (2009) undertook a detailed study to clar- U / Th age of 95 ± 4 ka (Ramsay and Cooper, 2002). Several
ify apparently conflicting ages of hominid footprint-bearing beachrock and aeolianite outcrops on the continental shelf
aeolianite at Nahoon (Fig. 3). They dated aeolianite and asso- (Ramsay, 1994; Bosman, 2012) have yielded sea-level index
ciated beach facies, reporting limiting ages for the aeolianite points and limiting dates on either side of MIS 5e (Table 1).
and an index point for the beach facies. The analysis also re-
vealed the presence of two MIS 5e beaches, only the younger
of which was OSL dated (117 ± 6 ka). Roberts (2008) noted 5.4 Namibia
“already fully lithified footprint-bearing [a]eolianites of the
Nahoon Formation in the area had been planed off and gul- The geological and sedimentological literature on the
lied by a later sea level which rose to ∼ 6 m a.m.s.l. This sug- Namibian coastal deposits is quite extensive, but none of the
gested a Marine Isotope Stage 5e (MIS 5e) event. The Na- literature surveyed meets the minimum database standards
hoon Formation [a]eolianites rest on shallow marine deposits for MIS 5e sea-level quantification. The potential 5e sites re-
at ∼ 1 m a.m.s.l., representing an older sea-level highstand. ported in the literature lack absolute dating control; to our
Thus the geological evidence from Nahoon points to two knowledge, and despite the extent of diamond mining from
highstands, an older event at ∼ 2 m a.m.s.l. and a younger raised shorelines north (downdrift) of the Orange River, no
counterpart at ∼ 6 m a.m.s.l.” Subsequent sedimentary anal- MIS 5e dates have been presented for raised shorelines in
ysis (Morrissey et al., 2020, p. 1) delivered an alternative Namibia. It has been supposed on molluscan fossil evidence
interpretation in which two phases of aeolianite deposition that a shoreline complex at +8 m (the C beach of Corvinus,
were separated by “a single stepped sea-level transgression 1983) is of Middle Pleistocene and a +4 m (B beach) is of
phase up to +7.82 ± 0.82 m a.s.l., evidenced by intrafor- last interglacial age. These deposits require further investiga-
mational beachrock facies and marine benches”. No further tion, especially to establish their ages.
dates were provided.
At Blind River, East London, Wang et al. (2008) pro- 5.5 Angola
vide two OSL dates on “estuarine calcarenite” that is con-
formably overlain by a “storm beach gravel” between +8 and Early U-series dates presented by Giresse et al. (1984) in-
+10 m m.s.l. The stratigraphically conformable dates from cluded three potential MS5e ages for raised shorelines at
the estuarine deposit (119 ± 9 and 118 ± 7 ka) were from +5 +12 and +20 m. These require reappraisal, however, in the
and +6.5 m, respectively. light of the subsequent presentation of multiple OSL dates
Although many potential MIS 5 deposits have been re- for a +25 m shoreline dating to 45 ka (Walker et al., 2016),
ported from the open coast and estuaries of the Eastern Cape, which implies large-scale Quaternary uplift along the An-
the only other dated evidence comes from sites at Coffee Bay golan coast. The Giresse et al. (1984) data are included in
Earth Syst. Sci. Data, 13, 953–968, 2021 https://doi.org/10.5194/essd-13-953-2021J. A. G. Cooper and A. N. Green: A standardized database of MIS 5e sea-level proxies 961
the database, but their reliability and actual significance is MIS 7 OSL dates in the Western Cape has been highlighted
uncertain. by Roberts et al. (2009, 2014).
6.3 Holocene sea-level indicators
6 Further details
Shorelines associated with a Holocene sea-level highstand
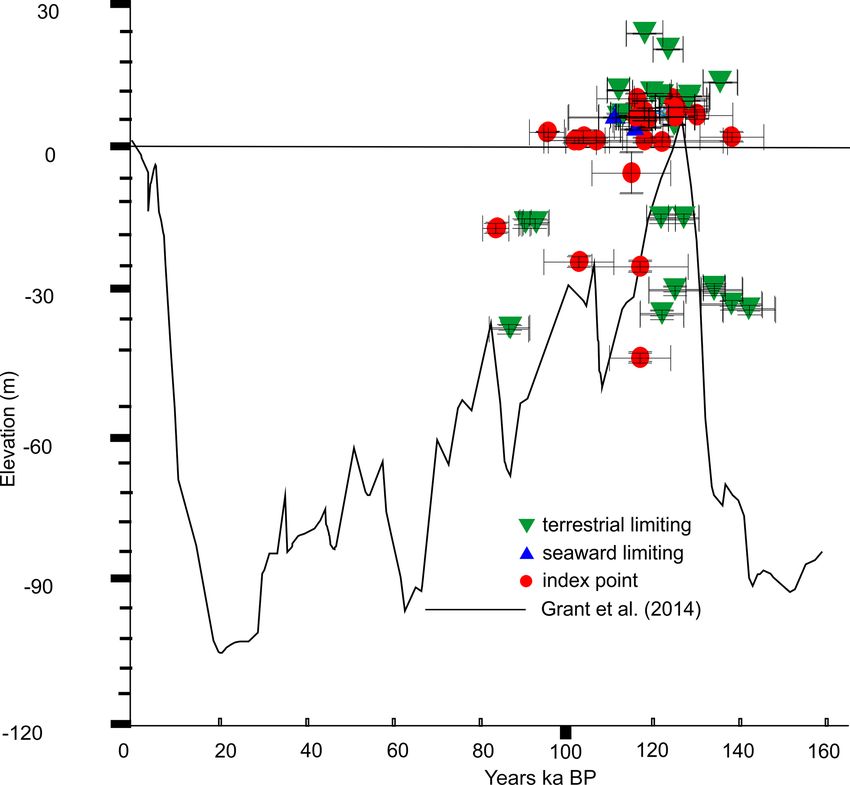
6.1 Last interglacial sea-level fluctuations are well developed around the coast of South Africa (Ram-
say, 1996; Compton, 2001) and Namibia (Compton, 2006).
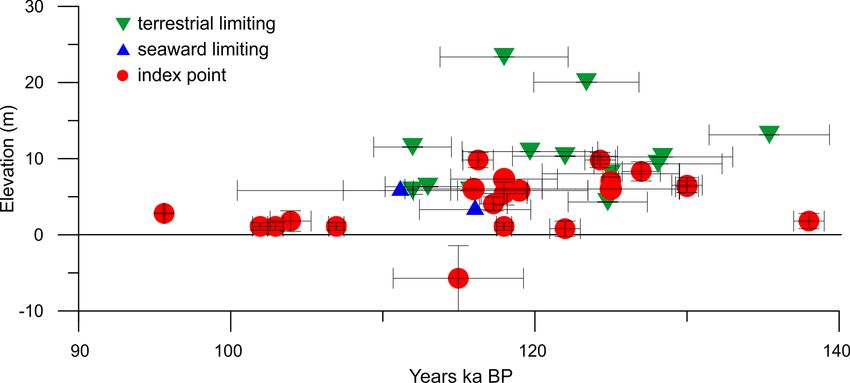
The collated data from South Africa for the period 140–
A recent regional review (Cooper et al., 2018) identified a
80 ka BP are shown in Fig. 4 superimposed on a continuous
Middle Holocene highstand of +2 to +4 m between 7.3 and
record from the Red Sea to provide temporal context. Data
6 ka BP, with potential Late Holocene oscillations of < 1 m
from 90 to 140 ka are shown in detail in Fig. 5. The record
amplitude around the present sea level in the subsequent in-
is largely internally consistent, although some OSL dates on
terval.
submerged aeolianites plot well under the sea level inferred
by emergent sea-level indicators. These may be the result
of ex situ sampling of loose boulders on the seabed. Carr 6.4 Controversies
et al. (2010) presented the earliest dated point for sea level
The past controversy around the age of the +6–8 m shore-
above present ca. 138 ka. Data from Cawthra et al. (2018)
line, created by Hendey and Volman (1986), was an artefact
suggest a subsequent period of lower-than-present sea levels
of limited chronological control and a lack of detailed sed-
around 130 ka. Carr et al. (2010) provide several data points
imentological analysis and reporting. OSL dating has since
for an MIS 5e sea-level highstand of ca. +8 m centred on
proved that last interglacial shorelines do extend between
ca. 125 ka, and there is a cluster of dates for a highstand be-
+6 and +8 m. Their work does, however, point to the need
tween 115 and 120 ka. Taken together, however, the collated
for caution in making broad generalizations about the age of
regional data are inconclusive regarding the presence of more
shorelines at specific elevations, and it is clear that shore-
than one sea-level peak during MIS 5e (Fig. 5); the paucity of
line deposits of various ages can occur at similar levels if
data points and overlaps in the age ranges preclude a defini-
the right conditions exist for preservation. The widely cited
tive statement. In the lack of full dating control it is not possi-
Swartklip section (Barwis and Tankard, 1983) does not con-
ble to argue for the presence (Hearty et al., 2007) or absence
tain MIS 5 sea-level indicators and is now established as dat-
(Mauz et al., 2018) of two sea-level peaks in MIS 5e.
ing to MIS 7 (Roberts et al., 2014). The question of poten-
tial tectonism in Angola and Namibia is a relatively recent
6.2 Other interglacials one. The evidence of uplift of Quaternary shorelines pre-
sented by Walker et al. (2016) from central Angola is per-
Tertiary and Early Pleistocene shoreline deposits are widely suasive, but the spatial and temporal extent of tectonic influ-
developed on the east and west coasts of South Africa, ence on raised shorelines on the coast of Angola, Namibia
Namibia and Angola. These were recently reviewed by and possibly Namaqualand in NW South Africa requires fur-
Hearty et al. (2020) in the context of global climate change. ther investigation. De Beer (2012), for example, provided ev-
Well-preserved littoral deposits of the prolonged MIS 11 idence of Plio–Pleistocene reactivation of Mesozoic faults in
highstand containing diagnostic sea-level information were Namaqualand, possibly as recently as the latest Pleistocene.
described by Roberts et al. (2012) from near Mossel Bay This was attributed to local seismogenic activity rather than
in the Western Cape. These dated to ∼ 390 ka and yielded regional uplift.
a precise maximum elevation of +14 m (correction for mi-
nor crustal uplift, and glacial isostatic adjustment (GIA) indi- 6.5 Uncertainties and data quality
cated eustatic sea level of +13 m ± 2 m). The sequence also
revealed sea-level fluctuations during MIS 11, including an The data reported are subject to a variety of uncertainties re-
early highstand close to present sea level. lated to the original elevation and associated datum. In few
In both the Western Cape and KwaZulu-Natal, coastal studies are these described adequately. In addition, regional
dunes of MIS 7 have been dated, but no sea-level indicators data on the relationship of contemporary sedimentary facies
have been reported. Ramsay and Cooper (2002) reported a and geomorphic units to any tidal datum are lacking. This
U / Th age of 182 ± 18 ka (Pta-U430) from aeolianite from adds to the uncertainty in determining the indicative mean-
Reunion Rocks near Durban, which overlaps with an OSL ing of the sedimentary facies.
date of 203 ± 13 ka (MP-33) from the same location reported Elevation and datum uncertainties in the sampled mate-
by Porat and Botha (2008). Bateman et al. (2004) similarly rial must be considered, especially in pre-2004 studies (the
recorded three OSL dates in the range of 176–283 ka from a advent of OSL dating). Very many studies do not explicitly
landward dune ridge at Wilderness (Shfd02132, 02133 and report the elevation measurement technique or the measure-
02134). The widespread occurrence of aeolianites that yield ment error. In the database, these errors have been estimated
https://doi.org/10.5194/essd-13-953-2021 Earth Syst. Sci. Data, 13, 953–968, 2021962 J. A. G. Cooper and A. N. Green: A standardized database of MIS 5e sea-level proxies Figure 3. Diagrammatic sequence of depositional events and sea-level change associated with recorded hominid footprints on a fossil dune surface at Nahoon, East London. Two interpretations of the sequence are compared. In each, the starting point (a) is the same, but in the interpretation of Jacobs and Roberts (2009) (b–d), the footprints are buried by further aeolian sedimentation, and the (undated) but supposed early MIS 5e dune/beach succession is lithified (b), indicating that sea level had fallen by an unknown magnitude below the present level. In (c) a later (higher) MIS 5e highstand (to about ±6 m) partly erodes the earlier MIS 5e marine and aeolian deposits, and in panel (d) further erosion of the MIS 5e dune/beach succession occurs during the Holocene highstand, resulting in the development of an overhang, the underside of which bears the (natural) casts of the footprints. In the interpretation (x–z) of Morrissey et al. (2020), littoral sedimentation deposits an onlapping and conformable littoral unit during a continuously rising MIS 5e sea level. via the authors’ own experience. In most instances, elevation cation of modern analogues is based on a combined analysis measurements are not reported to a specified datum, whether of the global literature on sea-level indicators (Rovere et al., chart datum (marine) or ordnance datum (terrestrial), or a 2016), especially on high-energy coasts (e.g. Cooper, 2013; tidal level. This reduces the vertical resolution of most data Mauz et al., 2015), descriptions of the contemporary South points, which have been referred to MSL in the database. African littoral geomorphology and sedimentology (Smith et Palaeo-RSL calculations from modern analogues rely on al., 2010; Bond et al., 2013; Kelly et al., 2014; Dixon et al., detailed knowledge of contemporary coastal environments 2015; Cooper and Green, 2016; Wiles et al., 2018; Green and associated sedimentary facies. Southern Africa has a et al., 2019), and our own experience. More direct measure- high-energy, wave-dominated coast within which distinctive ment (especially in relation to a fixed datum) and reporting of sedimentary facies have a large vertical range. Our quantifi- the distribution and variability of ranges of open-coast sed- Earth Syst. Sci. Data, 13, 953–968, 2021 https://doi.org/10.5194/essd-13-953-2021
J. A. G. Cooper and A. N. Green: A standardized database of MIS 5e sea-level proxies                                                963

                                                                       database interface on 23 January 2021. A descrip-
                                                                       tion of each field in the database is contained at
                                                                       https://doi.org/10.5281/zenodo.4459297, which is readily ac-
                                                                       cessible and searchable at https://walis-help.readthedocs.io/
                                                                       en/latest/ (Rovere, 2021a). More information on the World
                                                                       Atlas of Last Interglacial Shorelines can be found at https:
                                                                       //warmcoasts.eu/world-atlas.html (Rovere, 2021b). Users of
                                                                       our database are encouraged to cite the original sources
                                                                       alongside with our database and this article.

                                                                       8   Future research directions

                                                                       Our newly compiled database provides a means to investigate
                                                                       the record of sea-level variability around southern Africa and
                                                                       to identify data gaps and precise questions for further inves-
                                                                       tigation. In this regard, and in light of recent developments
                                                                       in dating, several sites that were reported in earlier studies as
Figure 4. Sea-level index points, together with seaward and land-      likely MIS 5e shorelines merit further investigation as they
ward limiting points for all available data from the Angolan, Namib-   may help refine the detailed pattern of sea-level change dur-
ian and South African coasts. Plotted data span MIS 5a to e. To        ing that interval. Sites with particularly well preserved lit-
provide temporal context, the Red Sea sea-level curve of Grant et      toral sedimentary facies that record sea-level variability merit
al. (2014) is superimposed.                                            fresh investigation. Particularly high-priority sites (Fig. 6) in-
                                                                       clude the poorly age constrained sites at Isipingo and Re-
                                                                       union (KwaZulu-Natal) (Cooper and Flores, 1991) and Na-
imentary facies in the region would help constrain compar-
                                                                       hoon Point (Eastern Cape), where two contrasting interpre-
isons with modern analogues. Tidal-inlet-associated units are
                                                                       tations have been presented (Jacobs and Roberts, 2009; Mor-
particularly difficult to constrain because of the marked vari-
                                                                       rissey et al., 2020) (Fig. 3). The added potential to date sub-
ability in geomorphology of estuaries and their inlets around
                                                                       merged littoral sediments, as has been carried out at several
the South African coast (Cooper, 2001) and the paucity of
                                                                       sites in South Africa, holds the possibility of elucidating the
direct measurements of inlet depth. The ranges listed in the
                                                                       timing and magnitude of sea-level fluctuations between sea-
database are based on the authors’ own experience.
                                                                       level highstands.
   Uncertainties related to dating refer mainly to U-series
                                                                          In addition, the widespread palaeo-lagoonal/estuarine de-
dates. These are sometimes at odds with other dating meth-
                                                                       posits that occur in many estuaries from KwaZulu-Natal to
ods and suggest issues with the source material (not from
                                                                       the Western Cape that have been noted (Davies, 1970, 1971,
closed systems, for example). OSL dating, in contrast, seems
                                                                       1972, 1980; Cooper, 1996, 1999) but little investigated, re-
to have given more consistent results, although even here
                                                                       main a valuable resource for detailed sea -level reconstruc-
there are some inconsistencies between aeolianite and other
                                                                       tion around the MIS 5e interglacial. In particular, the Lister’s
dates. The OSL dates are, however, on sandy sediments
                                                                       Point outcrop in Lake St Lucia (KwaZulu-Natal) (Fig. 1),
from the high-energy coast where vertical uncertainties (see
                                                                       which has been the subject of controversy due to poorly
above) are comparatively high. Many of the U-series dates
                                                                       resolved stratigraphy, is worthy of further detailed inves-
are from estuarine sediments where vertical uncertainties on
                                                                       tigation. Part of the confusion (and unnecessarily strongly
sea-level indicators could potentially be better constrained
                                                                       held opinions) that surrounds the site arises from poorly de-
due to the lower-energy conditions in which they accumulate
                                                                       tailed stratigraphical investigations. Cooper et al. (2013) es-
and the specific vertical ranges of certain organisms.
                                                                       tablished that at least 5 highstand deposits are preserved,
   A mandatory evaluation of data quality is included with
                                                                       including two separate coral-bearing units, the uppermost
each RSL data point. This was undertaken following the
                                                                       of which is probably from the last interglacial. The site is
WALIS guidelines (Rovere et al., 2020).
                                                                       also adjacent to other deposits that have yielded U / Th ages
                                                                       suggestive of MIS 5e, although they are somewhat younger
7   Data availability                                                  (Ramsay and Cooper, 2002).

The southern Africa database (Cooper and Green, 2020,
https://doi.org/10.5281/zenodo.4459297) is open access.                Supplement. The supplement related to this article is available
The files at this link were exported from the WALIS                    online at: https://doi.org/10.5194/essd-13-953-2021-supplement.

https://doi.org/10.5194/essd-13-953-2021                                                 Earth Syst. Sci. Data, 13, 953–968, 2021
964 J. A. G. Cooper and A. N. Green: A standardized database of MIS 5e sea-level proxies
Figure 5. Collated sea-level index points together with seaward and terrestrial limiting points for the South African coast surrounding the
last interglacial of MIS 5e (Table 1). The y axis records inferred MIS 5e sea level relative to present.
Figure 6. Key sites in South Africa with sedimentary but not fully dated records of sea-level variability during MIS 5e. Locations on Fig. 1.
(a) Sequence at Nahoon (after Jacobs and Roberts, 2009). A similar lowermost beach facies represents a possible early MIS 5e highstand at
∼ +1 m, with a regression represented by the aeolian facies, followed by a second transgression. (b) Alternative interpretation of the Nahoon
sequence (from Morrissey et al., 2020), in which the two beach units are regarded as coeval. (c) An undated sequence of littoral sediments
overlying an aeolianite at Reunion, Durban, adjacent to the site at Isipingo described by Cooper and Flores (1991). The lowermost beach
facies overlies the platform from which Ramsay et al. (1993) described an elephant tusk found in a solution pothole. The sequence holds the
potential to investigate the relationship between platform formation and beach deposition in relation to former sea levels.
Author contributions. JAGC and ANG both reviewed the liter- Acknowledgements. The data used in this study were compiled
ature, compiled the data, and discussed and assigned indicative in WALIS, a sea-level database interface developed by the ERC
meanings. Both wrote and edited the manuscript, designed and pre- Starting Grant WARMCOASTS (ERC-StG-802414), in collabo-
pared the figures, and addressed referee comments. ration with the PALSEA (PAGES–INQUA) working group. The
database structure was designed by Alessio Rovere, Deirdre Ryan,
Thomas Lorscheid, Andrea Dutton, Peter Chutcharavan, Do-
Competing interests. The authors declare that they have no con- minik Brill, Nathan Jankowski, Daniela Mueller, Melanie Bartz,
flict of interest. Evan Gowan and Kim Cohen. The data points used in this study
were compiled and contributed to WALIS by Andrew Cooper and
Andrew Green. We are grateful to Alessio Rovere for guidance
Special issue statement. This article is part of the special issue and assistance in the preparation of this paper. Reviews by Hay-
“WALIS – the World Atlas of Last Interglacial Shorelines”. It is not ley Cawthra and Natasha Barlow and comments by Barbara Mauz
associated with a conference. greatly helped in preparation of the final paper. John Pether kindly
Earth Syst. Sci. Data, 13, 953–968, 2021 https://doi.org/10.5194/essd-13-953-2021J. A. G. Cooper and A. N. Green: A standardized database of MIS 5e sea-level proxies 965
provided comments and unpublished observations on the Swartklip from dated sub-bottom profiles and archaeological shellfish as-
and adjacent sections. semblages, Quaternary Sci. Rev., 235, 106107, 2019.
Cawthra, H. C., Frenzel, P., Hahn, A., Compton, J. S., Gander, L.,
and Zabel, M.: Seismic stratigraphy of the inner to mid Ag-
Review statement. This paper was edited by Alessio Rovere and ulhas Bank, South Africa, Quaternary Sci. Rev. 235, 105979,
reviewed by Natasha Barlow and one anonymous referee. https://doi.org/10.1016/j.quascirev.2019.105979, 2020.
Compton, J. S.: Holocene sea-level fluctuations inferred from the
evolution of depositional environments of the southern Lange-
baan Lagoon salt marsh, South Africa, Holocene, 11, 395–405,
References 2001.
Compton, J. S.: The mid-Holocene sea-level highstand at Bogen-
Apollus, L.: The distribution of diamonds on a late Cainozoic gravel fels Pan on the southwest coast of Namibia, Quaternary Res., 66,
beach, southwestern Namibia, MS thesis, unpublished, Depart- 303–310, 2006.
ment of Geology and Applied Geology, University of Glasgow, Cooper, J. A. G.: Ephemeral stream-mouth bars at flood-breach
Glasgow, United Kingdom, 170 pp., 1995. river mouths on a wave-dominated coast: Comparison with ebb-
Barwis, J. H. and Tankard, A. J.: Pleistocene shoreline deposition tidal deltas at barrier inlets, Mar. Geol., 95, 57–70, 1990.
and sea-level history at Swartklip, South Africa, J. Sediment. Cooper, J. A. G.: Geomorphological variability among microtidal
Res.„ 53, 1281–1294, 1983. estuaries from the wave-dominated South African coast, Geo-
Bateman, M. D., Holmes, P. J., Carr, A. S., Horton, B. P., and morphology, 40, 99–122, 2001.
Jaiswal, M. K.: Aeolianite and barrier dune construction span- Cooper, J. A. G.: Sedimentary indicators of relative sea-level
ning the last two glacial–interglacial cycles from the southern change–high energy, Encyclopedia of Quaternary Science, 4,
Cape coast, South Africa, Quaternary Sci. Rev., 23, 1681–1698, 385–395, 2013.
2004. Cooper, J. A. G. and Green, A. N.: Geomorphology and preser-
Bateman, M. D., Carr, A. S., Murray-Wallace, C. V., Roberts, D. L., vation potential of coastal and submerged aeolianite: examples
and Holmes, P. J.: A dating intercomparison study on Late Stone from KwaZulu-Natal, South Africa, Geomorphology, 271, 1–12,
Age coastal midden deposits, South Africa, Geoarchaeology, 23, 2016.
715–741, 2008. Cooper, J. A. G., and Green, A. N.: Database of Last Inter-
Bateman, M. D., Carr, A. S., Dunajko, A. C., Holmes, P. J., Roberts, glacial sea levels in Angola, Namibia and South Africa, Zenodo,
D. L., McLaren, S. J., Bryant, R. G., Marker, M. E., and Murray- https://doi.org/10.5281/zenodo.4459297, 2020.
Wallace, C. V.: The evolution of coastal barrier systems: a case Cooper, J. A. G. and Flores, R. M.: Shoreline deposits and diage-
study of the Middle-Late Pleistocene Wilderness barriers, South nesis resulting from two Late Pleistocene highstands near +5
Africa, Quaternary Sci. Rev., 30, 63–81, 2011. and +6 metres, Durban, South Africa, Mar. Geol., 97, 325–343,
Bond, J., Green, A. N., Cooper, J. A. G., and Humphries, M. S.: 1991.
Seasonal and episodic variability in the morphodynamics of an Cooper, J. A. G, Kilburn, R. N., and Kyle, R.: A late Pleistocene
ephemeral inlet, Zinkwazi Estuary, South Africa, J. Coastal Res., molluscan assemblage from Lake Nhlange, Zululand, and its
65, 446–451, 2013. palaeoenvironmental implications, S. Afr. J. Geol., 92, 73–83,
Bosman, C.: The marine geology of the Aliwal Shoal, Scottburgh, 1989.
South Africa, PhD Thesis, unpublished, University of KwaZulu- Cooper, J. A. G., Mason, T. R., Reddering, J. S. V., and Illenberger,
Natal, Durban, South Africa, 2012. W. K.: Geomorphological effects of catastrophic flooding on a
Botha, G. A.: Lithostratigraphy of the late Cenozoic Maputaland small subtropical estuary, Earth Surf. Proc. Land., 15, 25–41,
Group, S. Afr. J. Geol., 121, 95–108, 2018. 1990.
Carr, A. S., Bateman, M. D., Roberts, D. L., Murray-Wallace, C. V., Cooper, J. A. G., Green, A. N., and Smith, A. M.: Vertical stacking
Jacobs, Z., and Holmes, P. J.: The last interglacial sea-level high of multiple highstand shoreline deposits from the Cretaceous to
stand on the southern Cape coastline of South Africa, Quaternary the present: facies development and preservation, J. Coastal Res.,
Res., 73, 351–363, 2010. 65, 1904–1908, 2013.
Cawthra, H. C., Uken, R., and Ovechkina, M. N.: New insights into Cooper, J. A. G., Green, A. N., and Compton, J. S.: Sea-level change
the geological evolution of the Durban Bluff and adjacent Blood in southern Africa since the Last Glacial Maximum, Quaternary
Reef, South Africa, S. Afr. J. Geol., 115, 291–308, 2012. Sci. Rev., 201, 303–318, 2018.
Cawthra, H. C., Bateman, M. D., Carr, A. S., Compton, J. S., Cooper, M. R.: The Cainozoic palaeontology and stratigraphy of
and Holmes, P. J.: Understanding Late Quaternary change at the KwaZulu-Natal: Part 1. The Mtunzini Formation. Stratigraphy
land–ocean interface: a synthesis of the evolution of the Wilder- and fauna, Durban Museum Novitates, 21, 1–10, 1996.
ness coastline, South Africa, Quaternary Sci. Rev., 99, 210–223, Cooper, M. R.: The Cainozoic palaeontology and stratigraphy of
2014. KwaZulu-Natal. Part 3. The Mduku Formation. Stratigraphy and
Cawthra, H. C., Jacobs, Z., Compton, J. S., Fisher, E. C., Karkanas, fauna, Durban Museum Novitates, 24, 48–56, 1999.
P., and Marean, C. W.: Depositional and sea-level history from Cooper, M. R.: The Cainozoic palaeontology and stratigraphy of
MIS 6 (Termination II) to MIS 3 on the southern continental shelf KwaZulu-Natal. Part 5. The False Bay coral limestone Forma-
of South Africa, Quaternary Sci. Rev., 181, 156–172, 2018. tion. Stratigraphy and fauna, Durban Museum Novitates, 37, 7–
Cawthra, H. C., Anderson, R. J., De Vynck, J. C., Jacobs, Z., Jer- 24, 2014.
ardino, A., Kyriacou, K., and Marean, C. W.: Migration of Pleis-
tocene shorelines across the Palaeo-Agulhas Plain: Evidence
https://doi.org/10.5194/essd-13-953-2021 Earth Syst. Sci. Data, 13, 953–968, 2021You can also read