Pollen-based temperature and precipitation changes in the Ohrid Basin (western Balkans) between 160 and 70 ka - Climate of the Past
←
→
Page content transcription
If your browser does not render page correctly, please read the page content below
Clim. Past, 15, 53–71, 2019
https://doi.org/10.5194/cp-15-53-2019
© Author(s) 2019. This work is distributed under
the Creative Commons Attribution 4.0 License.

Pollen-based temperature and precipitation changes in the
Ohrid Basin (western Balkans) between 160 and 70 ka
Gaia Sinopoli1,2,3 , Odile Peyron3 , Alessia Masi1 , Jens Holtvoeth4 , Alexander Francke5,6 , Bernd Wagner5 , and
Laura Sadori1
1 Dipartimento   di Biologia Ambientale, Sapienza University of Rome, Rome, Italy
2 Dipartimento   di Scienze della Terra, Sapienza University of Rome, Rome, Italy
3 Institut des Sciences de l’Evolution de Montpellier, University of Montpellier, CNRS,

IRD, EPHE, Montpellier, France
4 Organic Geochemistry Unit, School of Chemistry, University of Bristol, Bristol, UK
5 Institute of Geology and Mineralogy, University of Cologne, Cologne, Germany
6 Wollongong Isotope Geochronology Laboratory, School of Earth and Environmental Sciences,

University of Wollongong, Wollongong, Australia

Correspondence: Alessia Masi (alessia.masi@uniroma1.it)

Received: 18 June 2018 – Discussion started: 6 July 2018
Revised: 3 December 2018 – Accepted: 3 December 2018 – Published: 11 January 2019

Abstract. Our study aims to reconstruct climate changes that         After the Eemian, an alternation of four warm/wet periods
occurred at Lake Ohrid (south-western Balkan Peninsula),          with cold/dry ones, likely related to the succession of Green-
the oldest extant lake in Europe, between 160 and 70 ka (cov-     land stadials and cold events known from the North Atlantic,
ering part of marine isotope stage 6, MIS 6; all of MIS 5; and    occurred. The observed pattern is also consistent with hydro-
the beginning of MIS 4). A multi-method approach, includ-         logical and isotopic data from the central Mediterranean.
ing the “Modern Analog Technique” and the “Weighted Av-              The Lake Ohrid climate reconstruction shows greater sim-
eraging Partial Least-Squares Regression”, is applied to the      ilarity with climate patterns inferred from northern European
high-resolution pollen sequence of the DEEP site, collected       pollen records than with southern European ones, which is
from the central part of Lake Ohrid, to provide quantitative      probably due to its intermediate position and the mountain-
estimates of climate and bioclimate parameters. This allows       ous setting. However, this hypothesis needs further testing as
us to document climatic change during the key periods of          very few climate reconstructions are available for southern
MIS 6 and MIS 5 in southern Europe, a region where ac-            Europe for this key time period.
curate climate reconstructions are still lacking for this time
interval.
   Our results for the penultimate glacial show cold and dry
conditions, while the onset of the “last interglacial” is char-   1   Introduction
acterized by wet and warm conditions, with temperatures
higher than today (by ca. 2 ◦ C). The Eemian also shows the       Since the Middle Pleistocene, the Quaternary is character-
well-known climatic tri-partition in the Balkans, with an ini-    ized by high-amplitude glacial–interglacial climate variabil-
tial pre-temperate phase of abrupt warming (128–121 ka), a        ity, occurring cyclically with a 100 ka (kiloanni) periodicity
central temperate phase with decreasing temperatures asso-        (e.g. Raymo et al., 1989; Tzedakis et al., 1997). The marine
ciated with wet conditions (121–118 ka), followed by a post-      isotope stages MIS 6 (penultimate glacial) and MIS 5 (Last
temperate phase of progressive change towards cold and dry        Interglacial Complex, LIC) are defined by marine oxygen
conditions (118–112 ka).                                          isotope records (δ 18 O; Lisiecki and Raymo, 2005). MIS 6
                                                                  is also named the penultimate glacial (Riss glaciation in the
                                                                  alpine area, Late Saale or Saalian Complex in northern and

Published by Copernicus Publications on behalf of the European Geosciences Union.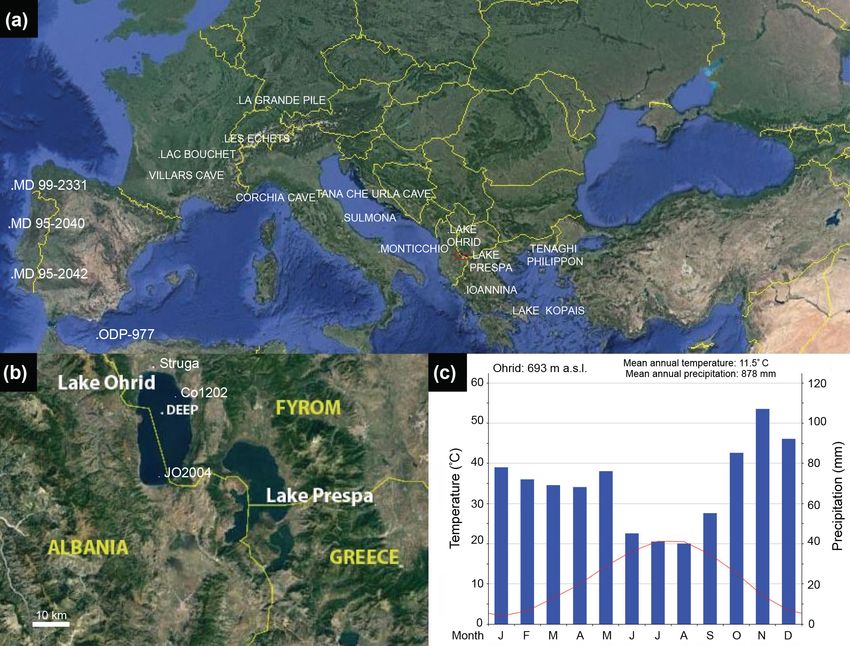
54                                                    G. Sinopoli et al.: Pollen-based temperature and precipitation changes

central Europe) and can be roughly dated from ca. 190 to          lived climatic fluctuation, the intra-Eemian cold event, oc-
ca. 130 ka, while MIS 5 lasts from ca. 130 to ca. 80 ka (Govin    curred around 122 ka (Maslin and Tzedakis, 1996). Climate
et al., 2015; Railsback et al., 2015, and references therein).    change across the penultimate glacial and the Eemian is doc-
The penultimate glacial is characterized by millennial-scale      umented by numerous pollen records from marine and ter-
climate variability (Martrat et al., 2004) and ends by sev-       restrial archives (e.g. Govin et al., 2015; Kaspar et al., 2005;
eral abrupt events, which are probably related to the iceberg-    Otto-Bliesner et al., 2013). Some of these records have been
rafted debris (IRD) deposition intervals in the north-east        used for the reconstruction of climatic parameters with a
Atlantic (McManus et al., 1999). In contrast, the LIC in-         quantitative approach synthesized in Brewer et al. (2008).
cludes the “last interglacial” (roughly equivalent to MIS 5e,     However, most of these have been carried out using pollen
or Eemian), followed by a period named “early last glacial”       data from European sites located north of 45◦ N, while only
characterized by a succession of stadial (cold and dry con-       few reconstructions were carried out in southern Europe.
ditions) and interstadial (warm and wet conditions) periods       Two are based on pollen continental records, Lago Grande
(MIS 5d to 5a). These stadials and interstadials correlate to     di Monticchio in southern Italy (Allen et al., 2000) and Ioan-
glacial advances or retreats that are documented by ice-rafted    nina in north-western Greece (Tzedakis, 1994) and two on
debris in North Atlantic sediments (e.g. Bond events and          marine pollen records, MD 99-2331 and MD 99-2042 on
Heinrich events: Bond et al., 1992; Bond and Lotti, 1995) and     the Iberian margin (Sánchez-Goñi et al., 2005; Brewer et al.,
by changes in oxygen isotope composition in Greenland ice         2008). A first north–south comparison suggests that the two
cores (Dansgaard–Oeschger cycles; Dansgaard et al., 1993).        regions may have experienced a somewhat different climatic
Equivalent to the marine isotope stages, the ice core records     pattern during the Eemian (Brewer et al., 2008). While both
distinguish Greenland stadials (GS) and Greenland intersta-       regions experienced an early temperature optimum followed
dials (GI) where short-lived cold episodes are associated with    by a cooling trend, towards the end of the Eemian, temper-
surface ocean cooling (C events). Across the LIC, seven such      atures and precipitation decreased more strongly in northern
cold events (C19–25) have been documented (McManus et             Europe compared to southern Europe (Brewer et al., 2008;
al., 1994; Oppo, 2006; Rasmussen et al., 2014).                   Sánchez-Goñi, 2007, and references therein). Given that this
   The Eemian (127–110 ka; Turner 2002; Shackleton et al.,        comparison is based on 13 north European sites and on only 4
2003) is of particular interest with regard to orbital param-     south European sites, there is a need to provide more reli-
eters inducing a strong seasonal forcing of insolation, con-      able quantitative climate reconstructions in southern Europe
trasted vegetation changes (de Beaulieu and Reille, 1992; Za-     for the penultimate glacial, for the Eemian and for the en-
gwijn, 1996) and climatic conditions (Cheddadi et al., 1998;      tire LIC in order to improve our understanding of the climate
Sánchez-Goñi et al., 2012). Therefore, this period is also        response to climate changes.
considered as a useful target for general circulation mod-           The Balkan Peninsula is unambiguously a key region at
els (GCMs) data–model comparison (Kaspar et al., 2005;            the confluence of central European and Mediterranean cli-
Otto-Bliesner et al., 2013). In the Northern Hemisphere, the      mate influences. The area is rich in extant Quaternary lakes
Eemian was wetter (Fauquette et al., 1999; Guiot, 1990;           and palaeolakes, with sediment records providing essential
Guiot et al., 1993; Klotz et al., 2003) and by up to 1–2 ◦ C      information on past vegetation and climate changes going
warmer in summer than the Holocene (Kaspar et al., 2005;          back hundreds of thousands of years, such as Lake Ohrid (Al-
Otto-Bliesner et al., 2013; Overpeck et al., 2006;), while        bania and FYROM; e.g. Lézine et al., 2010; Sinopoli et al.,
sea level was ca. 6–9 m higher (e.g. Kopp et al., 2009). The      2018; Wagner et al., 2017), Lake Prespa (Albania, FYROM
Eemian thus allows us to study climate dynamics and ecosys-       and Greece; Panagiotopoulos et al., 2014), Ioannina (west
tem response in a warmer than present Northern Hemisphere         Greece; Tzedakis et al., 2003), Tenaghi Philippon (north-east
without the influence of anthropogenic activity, thereby con-     Greece; Milner et al., 2016) and Kopais (south-east Greece;
tributing to assessments of the future impact of the current      Tzedakis, 1999; Okuda et al., 2001). Despite the richness
anthropogenic climate change. Earlier studies of the Eemian       in long palaeoenvironmental archives, quantitative palaeo-
considered it a stable, uninterrupted warm period (e.g. Guiot     climatic reconstructions have been rarely attempted or cover
et al., 1993; McManus et al., 1994; Pons et al., 1992; Zag-       relatively short periods.
wijn, 1996) with climatic oscillations only recorded in the fi-      In this study, we use a multi-method approach to recon-
nal part at the transition with the following glacial, i.e. the   struct climate parameters between the end of the penultimate
Weichselian of central and northern Europe, named early           glacial (160–128 ka) and the LIC (128–70 ka) inferred from
Würm in the alpine region (de Beaulieu and Reille, 1984,          the exceptionally long palynological record (569 m) of the
1989; Field et al., 1994; Litt et al., 1996). However, more       Ohrid Basin in the western Balkans (Sadori et al., 2016).
recent studies suggest that low-amplitude climatic fluctua-       The palynological data have been acquired from a sediment
tions did occur during the Eemian (e.g. Brewer et al., 2008;      core from the centre of the lake (DEEP site; Sinopoli et al.,
Sanchéz-Goñi et al., 2005; Sirocko et al., 2005) and in           2018). The MIS 6 to MIS 5 transition at Lake Ohrid has
NGRIP (North Greenland Ice Core Project) ice core iso-            been the subject of accurate chronological alignments and
tope records (NGRIP Members, 2004). A pronounced short-           synchronizations (Zanchetta et al., 2016) that yield an offset

Clim. Past, 15, 53–71, 2019                                                                    www.clim-past.net/15/53/2019/
G. Sinopoli et al.: Pollen-based temperature and precipitation changes                                                                 55

Figure 1. (a) Location map of the Mediterranean records cited in this paper. (b) Location map of Lake Ohrid and its surroundings (US Dept.
of State Geographer© 2017 Google Image Landsat/Copernicus, Data SIO, NOAA, US Navy, NGA, GEBCO) (c). Ombrothermic diagram of
Struga meteorological station (http://en.climate-data.org/location/29778/, last access: 17 December 2018).

of 2 ka compared to other records (e.g. Govin et al., 2015;            2   Site description
Railsback et al., 2015). The approach for paleoclimate re-
construction applied herein includes two methods frequently            Lake Ohrid is located on the Balkan Peninsula at the border
used in palaeoclimate reconstructions: the Modern Analog               between the Former Yugoslav Republic of Macedonia (FY-
Technique (MAT; Guiot, 1990) and the weighted averaging                ROM) and Albania (Fig. 1). It is probably the oldest lake in
partial least-squares regression (WAPLS; Ter Braak and Jug-            Europe, with an estimated age of > 1.2 Ma. The lake has a
gins, 1993). In order to test the reliability of our numeri-           tectonic origin, as its catchment is located in a graben that
cal approach, we compare the results to independent climate            formed during the Alpine orogenesis between ca. 10–2 Ma.
proxies from the Ohrid Basin such as biomarkers (Holtvoeth             Today, Lake Ohrid has a surface area of 360 km2 (30 km
et al., 2017) and total inorganic carbon (TIC) concentrations,         long, 15 km wide, 693 m a.s.l.), an average depth of 164 m
which largely represent authigenic calcite precipitation (Vo-          and a maximum depth of 293 m. The basin is bordered to
gel et al., 2010; Francke et al., 2016). To discuss the climate        the west by the Jablanica mountains (1514 m a.s.l.) and to
signal at a more global scale, we compare our results to avail-        the east by the Galičica mountains (2265 m a.s.l.). The lat-
able pollen-based reconstructions from northern Europe and             ter separate the watersheds of Lake Ohrid and the adjacent
the Mediterranean, and to marine and terrestrial proxies from          Lake Prespa (849 m a.s.l.), which is located ca. 10 km to
the Mediterranean and the Northern Hemisphere (e.g. De                 the east, although the two lakes are connected via a karst
Abreu et al., 2003; Drysdale et al., 2005; NGRIP Members,              aquifer system. Apart from inflow from Lake Prespa, Lake
2004; Lisiecki and Raymo, 2005; Martrat et al., 2004; Regat-           Ohrid is supplied with water from surface run-off via small
tieri et al., 2014, 2017; Sánchez-Goñi et al., 1999; Wang et           streams, rivers and by direct precipitation. Modern climate
al., 2010).                                                            in the Ohrid region is Mediterranean with continental influ-
                                                                       ences. The thermal capacity of the lake as well as its prox-
                                                                       imity to the Adriatic Sea and the local topography affects
                                                                       the local climate. The mean annual temperature recorded in
                                                                       the Ohrid region averages 11.5 ◦ C; temperatures range be-

www.clim-past.net/15/53/2019/                                                                            Clim. Past, 15, 53–71, 2019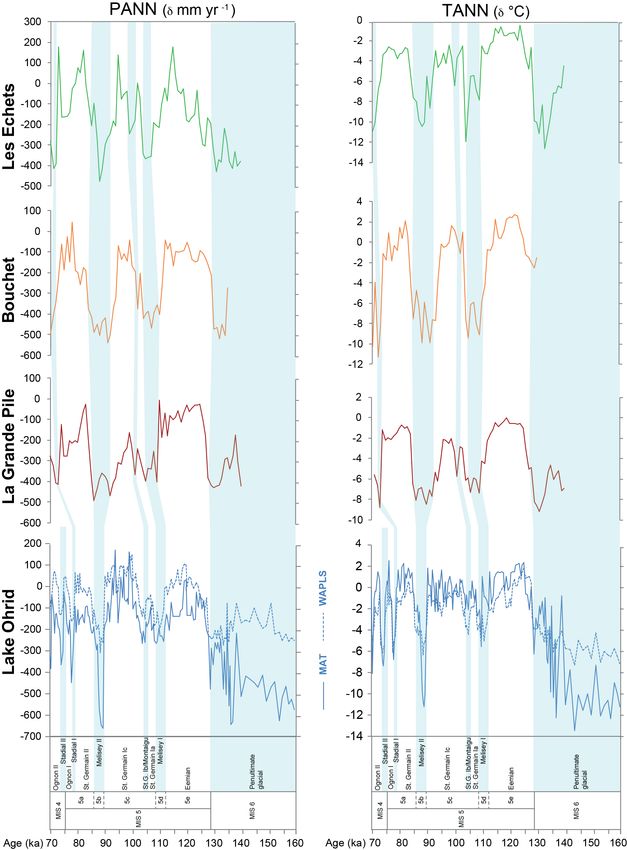
56                                                     G. Sinopoli et al.: Pollen-based temperature and precipitation changes

tween ca. 2 and 6 ◦ C in winter (minimum in January) and           permost 247.8 m of the DEEP core cover the last 637 ka
between 10 and 22 ◦ C in summer (maximum in July). The             (Francke et al., 2016).
morphology of the catchment also affects the wind regime,             Palynological data has been published for the upper 200 m
with northerly winds prevailing during winter and south-           of the DEEP pollen record, covering the last 500 ka, with
southeasterly winds during spring and summer. The pluvio-          a time resolution of ca. 1600 years (Bertini et al., 2016;
metric regime is Mediterranean, with an average annual pre-        Sadori et al., 2016, 2018). Results have shown an alterna-
cipitation of 878 mm (Fig. 1).                                     tion of forested and non-forested periods that are ascribed to
   Lake Ohrid has a rich macrophytic flora (more than 124          five glacial–interglacial cycles. The study presented herein
species) distributed into different zones dominated by Lemna       is based on “higher-resolution” pollen data summarized in
trisulca L., Phragmites australis (Cav.) Trin. ex Steud., Pota-    Fig. 2 (one sample every ca. 400 years; Sinopoli et al., 2018,
mogeton L., Characeae, Ceratophyllum L., Myriophyllum L.           in the following named “high-resolution”).
and the colonial alga Cladophora spp. The present vegetation
around Lake Ohrid belongs to the sub-mediterranean type, in        3.2   Quantitative reconstruction of temperature and
which mediterranean and Balkan elements dominate together                precipitation
with central European ones. The vegetation is sequenced
in altitudinal belts, starting from lake level (693 m a.s.l.) to   We adopted two different methods in order to improve the er-
the top of the mountains (ca. 2200 m a.s.l.). Riparian for-        ror assessment of our approach (e.g. Klotz et al., 2003; Kühl
est (dominated by Salix alba L.), with elements of mediter-        et al., 2010; Peyron et al., 2005, 2011, 2013). It has been
ranean vegetation (Fraxinus ornus L., Pistacia terebinthus         demonstrated by several studies that reconstructions based
L. and Phyllirea latifolia L.), is present from the altitude of    on just one method can have limitations, depending on the
the lake level to lower elevations together with Buxus sem-        time interval and on the methods chosen (Birks et al., 2010;
pervirens L., Quercus trojana Webb, Carpinus orientalis L.         Brewer et al., 2008). Here, we have selected the Best Analogs
and Ostrya carpinifolia Scop. Otherwise, forests are charac-       Approach or Modern Analog Technique (MAT; Guiot, 1990)
terized by mixed deciduous elements and are mainly com-            and the Weighted Average Partial Least-Squares Regres-
posed of Quercus cerris L., Q. frainetto Ten., Q. petraea          sion (WAPLS; Ter Braak and Juggins, 1993), two classical
(Matt.) Liebl., Q. pubescens Willd. up to 1600 m a.s.l., fol-      methods already used to reconstruct climate changes in the
lowed by montane and mesophilous forests (from 1600 to             Mediterranean during the Holocene and other time periods
1800 m a.s.l.) dominated by Fagus sylvatica L. in association      (e.g. Brewer et al., 2008; Mauri et al., 2015; Peyron et al.,
with Carpinus betulus L., Corylus colurna L. and Acer ob-          2011, 2013). Both methods are based on the assumption that
tusatum (Acer opalus subsp. obtusatum (Waldst. & Kit. ex           climate change strongly influences the distribution and com-
Willd.) Gams). Abies alba Mill. and A. borisii-regis Matt.         position of vegetation as every plant species tolerates distinct
mixed forests grow below 1900 m a.s.l. at the upper limit of       ranges of temperature and humidity. The MAT is based on
the forested area, while sub-alpine grassland and shrubland        the comparison between fossil pollen assemblages and mod-
with Juniperus excelsa (subsp. polycarpos (K. Koch) Takhta-        ern ones. The MAT determines the degree of dissimilarity
jan) are found above the treeline in mountains situated at         (in terms of taxa abundance and composition) between mod-
south-east of the lake. Towards the east, Pinus peuce Griseb.,     ern pollen data (associated with known climatic parameters)
is present at high elevation, associated with Pteridium aquil-     and the fossil data for which the climatic parameters are to
inum (L.) Kuhnor, Vaccinium myrtillus L. Sparse population         be estimated. For each fossil pollen assemblage, a number of
of Pinus species considered to be Tertiary relics are present      modern pollen assemblages are selected (based on a chord
in the wider area.                                                 distance calculation) as the closest ones or “analogues”. The
                                                                   number of analogues used may affect the quality of the re-
                                                                   constructions. In the present paper, the most robust recon-
3     Materials and methods                                        structions are obtained using six analogues. This is the opti-
                                                                   mal number of analogues (determined using the lowest root-
3.1    Pollen data from the DEEP core                              mean-square error of prediction) in order to minimize the
                                                                   chances of falsely determining two modern samples to be
A drilling campaign within the scope of the International          analogues or considering two analogous samples not to be
Continental Scientific Drilling Program (ICDP) was carried         analogues. The method uses the present-day climate data as-
out as part of the project Scientific Collaboration On Past        sociated with the selected modern analogues to infer the past
Speciation Conditions in Lake Ohrid (SCOPSCO) in 2013.             climate values (Guiot, 1990). In contrast to the MAT, the
Six parallel cores were recovered from the depocentre of           WAPLS method is a transfer function, which uses a real sta-
the lake at 243 m water depth (DEEP site). A composite se-         tistical calibration between climate parameters and modern
quence representing an overall sediment depth of 569 span-         pollen data. The method is based on unimodal relationships
ning at least the last 1.2 million years has been obtained         between pollen percentages and climate. In WAPLS, several
(Wagner et al., 2017). According to the age model, the up-         components are calculated based on weighted averaging al-

Clim. Past, 15, 53–71, 2019                                                                     www.clim-past.net/15/53/2019/
G. Sinopoli et al.: Pollen-based temperature and precipitation changes                                                                 57

Figure 2. Lake Ohrid (FYROM and Albania) – DEEP core – Pollen percentage diagram of selected taxa and ecological groups against
age (ka). Montane vegetation: Abies, Betula, Fagus, Ilex, Picea; mesophilous vegetation: Acer, Buxus, Carpinus betulus, Castanea, Celtis,
Corylus, Fraxinus excelsior/oxycarpa, Ostrya/Carpinus orientalis, Hedera, Quercus robur type, Quercus cerris type, Tilia, Ulmus, Zelkova;
Mediterranean vegetation: Cistus, Fraxinus ornus, Olea, Phillyrea, Pistacia, Quercus ilex type, Rhamnus; steppe: Artemisia, Amaranthaceae,
Chicoriodeae and Asteroideae; and grassland: Poaceae and Cyperaceae. Data from Sadori et al. (2016) and Sinopoli et al. (2018).

gorithms that successively explain more variance in the data;          tem for statistical computation and graphics (R Foundation,
this means that taxa, which better define a climate parameter,         https://www.r-project.org/, last access: 17 December 2018)
are weighted more than the other ones (Ter Braak and van               by using the package “rioja” (Juggins, 2016). Error bars have
Dam, 1989). A cross-validation has been performed to de-               been calculated but are not shown in the figure for graphic
termine the right number of components (Ter Braak and Jug-             clarity. They are available in the Supplement (Fig. S2). Fig-
gins, 1993). For both methods, we have used a modern pollen            ure S3 indicates the reliability of the analogues selected by
dataset containing more than 3088 samples from European                reporting the squared-chord distance between the first and
and Mediterranean regions (Peyron et al., 2013). From this             the last analogue for a chosen climate parameter (TANN)
dataset, we have excluded those pollen samples collected in            calculated by the MAT method. The first (last) analogue cor-
warm to hot steppes in order to improve the climate recon-             responds to the closest analogue with the low (high) chord
struction during steppic phases (Tarasov et al., 1998). More-          distance.
over, Pinus has been excluded due to its overwhelming pres-
ence in the DEEP record that potentially masks climatically
controlled environmental signals from other taxa. The differ-          4   Results
ences between the two methods probably depend on the lack
of present-day European analogues for some glacial vegeta-             Previous low-resolution data show that MIS 6 was charac-
tion formations.                                                       terized by a prevalence of Artemisia, Amaranthaceae and
   Five climate parameters have been reconstructed for the             Asteroideae since 160 ka (Sadori et al., 2016). During the
DEEP pollen record excluding Pinus (Fig. 3; for the recon-             LIC, high-resolution data provide evidence for forested pe-
struction with Pinus see Fig. S1 in the Supplement) with               riods (interglacial and interstadials) alternating with peri-
each method: (1) the mean temperature of the coldest month             ods of a more open environment (stadials). The pollen anal-
(MTCO), (2) the mean temperature of the warmest month                  ysis revealed that the surroundings of Lake Ohrid during
(MTWA), (3) the mean annual temperature (TANN), (4) the                the Eemian were characterized by mesophilous communi-
mean annual precipitation (PANN) and (5) the growing de-               ties prevailing on montane ones (Fig. 2). Forests were mainly
gree days above 5 ◦ C (GDD5) (Peyron et al., 1998). The                featured by expansion of Quercus robur and Q. cerris types
analysis was carried out with the software package R, a sys-           together with Pinus and Abies (Sinopoli et al., 2018). Trees
                                                                       never completely disappear, being also recorded during sta-

www.clim-past.net/15/53/2019/                                                                            Clim. Past, 15, 53–71, 2019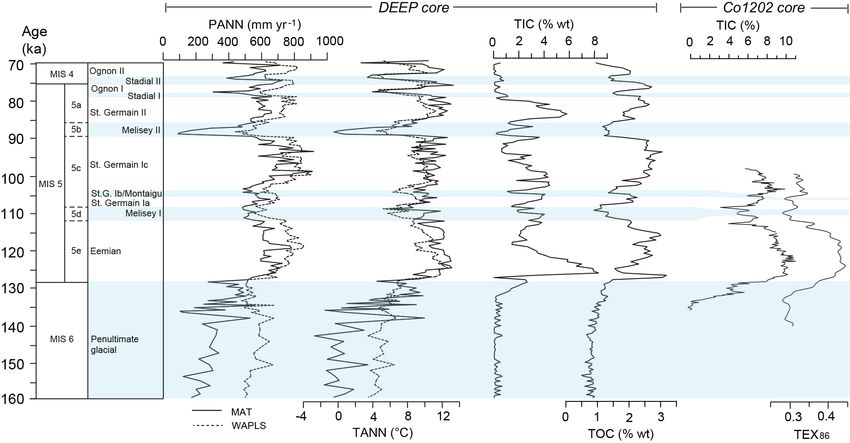
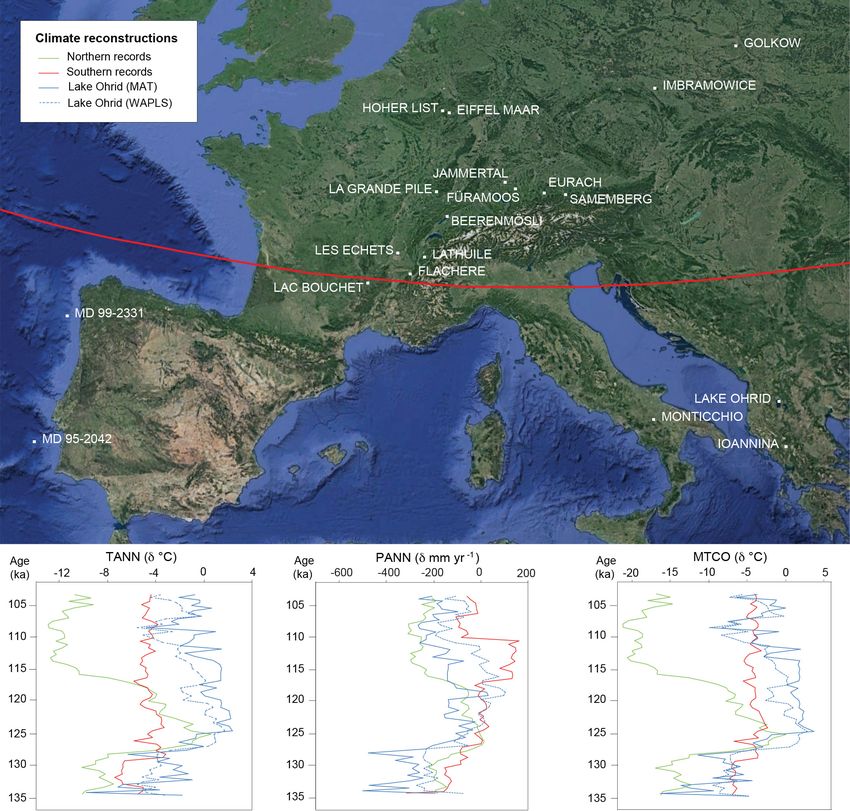
58                                                        G. Sinopoli et al.: Pollen-based temperature and precipitation changes

Figure 3. Climate reconstruction inferred from Lake Ohrid pollen data (Sadori et al., 2016; Sinopoli et al., 2018). Climate parameters
obtained with the MAT method (blue line) and the WAPLS method (red line): MTCO (mean temperature of the coldest month), MTWA
(mean temperature of the warmest month), PANN (mean annual precipitation), TANN (mean annual temperature) and GDD5 (growing
degrees days over 5 ◦ C). Climate parameter values are plotted against age (ka); they are not expressed in anomalies (past climate value minus
the modern measured value). Blue shading indicates cold periods (penultimate glacial and early last glacial stadials).

Clim. Past, 15, 53–71, 2019                                                                              www.clim-past.net/15/53/2019/
G. Sinopoli et al.: Pollen-based temperature and precipitation changes                                                         59

dial periods, albeit at low percentages. Here we adopt the ter-   also warmer than today, while summer temperatures were
minology used by Woillard (1978) for La Grande Pile pollen        close to modern values and precipitation 100 mm lower than
record to enhance comparability (see Table 1). We are aware       present day (Figs. 3, 5). A cool event is suggested between
that the marine stratigraphy does not always precisely match      121 and 118 ka, while precipitation reaches the highest val-
the terrestrial one (e.g. Sánchez-Goñi et al., 2007).             ues of the Eemian at around 119.4 ka. After this cool phase,
   Our climate reconstruction suggests cold and dry condi-        during the last part of the last interglacial (118–112 ka), we
tions during MIS 6 and, in MIS 5, an alternation of warm          reconstruct a progressive cooling and a decrease in precipi-
and wet conditions during the Eemian and St. Germain I and        tation until the end of the Eemian at 112 ka.
II interstadials with cooler and dryer ones occurring during
stadials (Fig. 3).                                                4.2.2   The early last glacial (112–70 ka)

4.1     The late part of the penultimate glacial (MIS 6,          The early last glacial (Table 1) is characterized by an alterna-
        160–128 ka)                                               tion of short cold and dry periods with longer warm and wet
                                                                  ones.
The second part of MIS 6 was very cold and dry (Fig. 3)
as suggested by the results from both MAT and WAPLS.                – Warm and wet interstadial periods: St. Germain I (108–
This portion of the glacial period can be divided into a              90.2 ka), St. Germain II (85.7–78.8), Ognon I (77.6–
first part, between 160 and 143 ka, which is characterized            75 ka), Ognon II (73.4–69.9 ka).
by cold and dry climate conditions (mean annual temper-
                                                                    – Cool and dry stadial periods: Melisey I (112–108 ka),
ature below 6 ◦ C and annual precipitation mainly between
                                                                      Montaigu (105.2–104 ka), Melisey II (90.2–85.7 ka),
350 and 600 mm yr−1 ), and a second part, lasting from 143
                                                                      stadial I (78.8–77.6 ka), stadial II (75–73.4 ka).
to 128 ka, when several short-term high-amplitude oscilla-
tions are reconstructed, especially from 140 to 135 ka. These
abrupt changes involve all the climate parameters. These os-      Interstadials: warm and wet conditions
cillations represent significant shifts in mean annual temper-
                                                                  The first interstadial following the Eemian (Fig. 3) corre-
ature (TANN) and precipitation (PANN), ranging from 2.7
                                                                  sponds to the St. Germain I (108–90.2 ka) that can be di-
to 10 ◦ C and from 120 to 600 mm yr−1 , respectively. The
                                                                  vided (Table 1) into three parts, two of which, St. Germain Ia
GDD5 (growing degrees days over 5 ◦ C, annual accumu-
                                                                  (108–105.2 ka) and St. Germain Ic (104–90.2 ka), are warm
lated temperature over 5 ◦ C) pattern is strongly linked to the
                                                                  and wet, while the other, Melisey II (105.2–104 ka), is cold
MTWA (mean temperature of the warmest month) pattern.
                                                                  and dry. During St. Germain Ia, both TANN and PANN in-
The pronounced peak in temperature around 138 ka is proba-
                                                                  crease suggesting that the St. Germain I was warm and wet,
bly linked to the high percentages of mesophilous taxa; how-
                                                                  but still to a lower extent than the Eemian. In contrast, the
ever, this increase seems overestimated with the MAT. No-
                                                                  St. Germain Ic appears to be wetter and overall warmer than
tably, this oscillation and also the other lower-amplitude os-
                                                                  St. Germain Ia (Fig. 3). The precipitation increases strongly
cillations between 143 and 128 ka are more marked in the
                                                                  and reaches values between ca. 600 and 900 mm yr−1 , which
reconstruction inferred from the MAT (Fig. 3). These values
                                                                  is the wettest period between 160 and 70 ka. A pronounced
are probably overestimated as the MAT is more sensitive than
                                                                  dry event is centred at 95.3 ka. The second interstadial (85.7–
WAPLS and other methods such as a PDF (probability den-
                                                                  78.8 ka) corresponding to St. Germain II is characterized by
sity function; Brewer et al., 2008; Kühl et al., 2010). Brewer
                                                                  temperate conditions comparable to those of St. Germain Ic
et al. (2008) demonstrated that a wider spread of estimates
                                                                  (104–90.2 ka) even if it seems drier. The following two in-
is found during colder periods and that the analogue meth-
                                                                  terstadials corresponding to the Ognon I and II (77.6–75 and
ods seem to give a larger variability in time than the other
                                                                  73.4–69.9 ka) show climate conditions comparable to those
methods, especially during the cold periods.
                                                                  occurring during the second interstadial (Fig. 3).

4.2     The Last Interglacial Complex, LIC (MIS 5,
                                                                  Stadials: cold and dry conditions
        128–70ka)
                                                                  The temperate conditions of the last interglacial are inter-
4.2.1    The last interglacial (128–112 ka) or Eemian
                                                                  rupted by a first cooling event corresponding to the sta-
The transition to the last interglacial, dated at 128 ka, is      dial Melisey I (112–108 ka) characterized by cold and dry
marked by a rapid rise in temperature and in precipitation,       conditions (Fig. 3). A second abrupt event is recorded be-
being very close to modern values. The so-called thermal          tween 105.2 and 104 ka, namely during the Montaigu cooling
maximum of the Eemian, occurring at Lake Ohrid between            (St. Germain Ib) that divides the St. Germain I into two “in-
128 and 121 ka, is characterized by TANN between 10 and           terstadials”. During this event, precipitation reaches values
12 ◦ C, the highest of the investigated period, 2 ◦ C warmer      similar to those of the previous stadial (Melisey I). Temper-
than the present day (Figs. 3, 5, 6). Winter temperatures were    ature and precipitation follow the same pattern with a strong

www.clim-past.net/15/53/2019/                                                                      Clim. Past, 15, 53–71, 2019
60 G. Sinopoli et al.: Pollen-based temperature and precipitation changes
Table 1. Correlation of nomenclature defined by Woillard (1978) for La Grande Pile (NE France) with common terrestrial nomenclature and
the marine isotope stages (MIS; Lisiecki and Raymo, 2005). This is just a scheme and a precise correspondence between MIS 5 substages
and the terrestrial phases defined by Woillard (1978) is not yet precisely established.
decrease at 104.6 ka. Melisey II (90.2–85.7 ka) appears as the 5 Discussion
coldest and driest event of the early last glacial (Fig. 3), with
a strong temperature and precipitation decrease evidenced by 5.1 Differences between MAT and WAPLS and reliability
both methods. As during the end of MIS 6, the cooling recon- of the methods
structed with the MAT is probably overestimated given that
the analogue method provides a large variability during the The temperature reconstructions from both methods are rea-
cold periods. However, the climate was certainly very cold sonably coherent (trends and values) during the interglacial
during Melisey II, particularly in winter as illustrated by the and interstadials, but a wider spread of estimates is found
WAPLS. Precipitation reaches extremely low values, drop- during colder periods (Fig. 3) for which the analogues
ping to ca. 100 mm yr−1 , which is even lower than in MIS 6 method suggests higher-amplitude oscillations and lower val-
but here too the drying seems overestimated with the MAT ues than those inferred by the transfer function (Fig. 3). More
for the same reasons as temperatures. The following two sta- precisely, during ca. 160–143 ka, both methods produce low-
dials (78.8–77.6 and 75–73.4 ka) should indicate a pattern amplitude oscillations in temperatures, but the values deter-
very similar to Melisey II, with an abrupt decrease in temper- mined by MAT appear to be around 4 ◦ C lower than those
ature and precipitation followed by a likewise abrupt increase determined by WAPLS. Even if the precipitation curves pro-
at the end of each phase (Fig. 3). duced by both methods show the same trend, reconstructed
values by MAT are roughly 300 mm lower than those result-
ing from WAPLS. After 143 ka, the differences between the
two methods are more pronounced (Fig. 3). It is worth men-
tioning that WAPLS precipitation values are inside the error
bars (Fig. S1). Discrepancies between the methods may be
Clim. Past, 15, 53–71, 2019 www.clim-past.net/15/53/2019/G. Sinopoli et al.: Pollen-based temperature and precipitation changes 61
related to several factors that either depend on the method bly result from differences in pollen assemblages due to the
itself or on the composition of past pollen assemblages. As different positions of the analysed cores. Core JO2004 was
mentioned in Sect. 3.2 modern analogues methods are very retrieved from the southern part of the lake, closer to the lake
sensitive to minor variations in the pollen assemblages, es- shoreline. Therefore, its pollen assemblages show increased
pecially during glacial periods (Brewer et al., 2008). Simi- values of local taxa and of those not dispersed over long dis-
lar discrepancies associated with MAT also occur in the re- tances; in contrast, these taxa are found in lower abundance
construction of La Grande Pile; strong cold and dry oscil- or not at all in the central part of the basin from where the
lations are evidenced (and probably overestimated) after the DEEP core was retrieved. Due to the central position of the
Eemian thermal optimum by Brewer et al. (2008). MAT is DEEP and the morphology of the territory around the lake
frequently used to reconstruct the climate of the Late Glacial (vegetation organized in altitudinal belts) we assume that
and Holocene (e.g. Mauri et al., 2015; Peyron et al., 2005) our climate reconstruction integrates the palynological sig-
but, as demonstrated by Guiot et al. (1993), ambiguous out- nal of the surrounding mountain ranges and, consequently,
comes may occur particularly for past glacial and cold inter- our data accounts for a regional and not a local climate recon-
vals (stadials). The major problem appears to be the lack of struction. In Fig. 4, the temperature and precipitation (PANN
modern analogues or only limited similarity with past glacial and TANN) signals are compared to the TIC and the total
vegetation (Guiot et al., 1993; Peyron et al., 1998). Indeed, as organic carbon (TOC) records from the DEEP core and to
reported in several studies (Guiot, 1987; Guiot et al., 1993; the TIC and TetraEther indeX of archaeal lipids (TEX86 )
Klotz et al., 2003), glacial steppe vegetation dominated by from core Co1202. For more information about these prox-
high percentages of Amaranthaceae (as at Lake Ohrid, Fig. 2) ies see Francke et al. (2016), Vogel et al. (2010), Holtvoeth
has no present-day analogue in Europe. For this reason, we et al. (2017) and references therein. All proxies reported in
have used modern samples from cold steppe principally from Fig. 4 are used as indicators for environmental and climatic
the Tibetan Plateau and from Russia as “potential” analogues change. Concerning proxies from the DEEP core, PANN and
for glacial periods (Peyron et al., 1998, 2005). Squared-chord TANN resemble TIC and TOC. TIC concentrations and pre-
distance has been used to determine the degree of dissimilar- cipitation of mainly authigenic carbonate is controlled by wa-
ity (Fig. S1), revealing that our reconstruction can be judged ter temperature and productivity, but also by ion concentra-
reliable and without a no-analogs situation occurring. The tions in the lake, which depend on precipitation and the ac-
differences between the two methods for cool/cold periods tivity of the karst aquifer system (Vogel et al., 2010; Francke
may also be ascribed to the quasi-continuous presence of ar- et al., 2016). Minima in TOC that correspond to minima in
boreal taxa in steppic assemblages. During the period be- TANN indicate that these minima are the result of restricted
tween 143 and 128 ka, the major oscillations are probably productivity combined with increased decomposition of or-
overestimated and likely linked to the presence of arboreal ganic matter due to the prolonged winter season and en-
mesophilous (temperate) taxa in steppic pollen assemblages. hanced mixing of the water column (Francke et al., 2016).
Mesophilous taxa amount to 10 %–30 %, with a prevalence However, TOC reflects autochthonous and allochthonous or-
of deciduous and semi-deciduous oaks, while pioneer shrubs ganic matter input, i.e. supply of biomass from both the
are between 5 % and 10 %, with prevalence of Juniperus lake as well as the surrounding land (Francke et al., 2016;
(Fig. 2). This discrepancy attests to the specific local hy- Holtvoeth et al., 2017; Zanchetta et al., 2018). The produc-
droclimatic features of the Ohrid Basin and its fundamental tivity of the terrestrial vegetation and supply of terrestrial
role as a refugium for many arboreal taxa. Considering the organic matter to the lake seem to be largely controlled by
very high sensitivity of the MAT, WAPLS seems to be a bet- precipitation rather than temperature; thus, explaining sim-
ter method to reconstruct the climatic changes during cold ilarities with the PANN record. While TIC and TOC may
events in refuge areas. co-vary at times they are not generally causally related. Dur-
ing MIS 6, TIC is mostly very low, suggesting cold and
5.2 Climate changes at Lake Ohrid: comparison with
dry climate conditions (Francke at al., 2016), in agreement
independent proxies and other climate
with the pollen-inferred mean annual temperature and pre-
reconstructions
cipitation (Fig. 4). At the transition toward MIS 5, TIC and
TEX86 values increase together, indicating a warming and
Our data are in agreement with climate signals depicted augmentation of humidity, consistent with the increase in
in geochemical data from the DEEP site (Francke et al., PANN and TANN inferred from pollen. The distinct high-
2016; Wagner et al., 2017) and other Lake Ohrid cores amplitude fluctuations inferred from pollen during the fi-
(core JO2004 from the south of the lake; Bordon, 2008; nal part of MIS 6 could at least partly be due to lake-level
core Co1202 from the north-east; Holtvoeth et al., 2017; see changes as the water table during this period was generally
Fig. 1; Vogel et al., 2010). When comparing our results to the on the rise (Lindhorst et al., 2010; Holtvoeth et al., 2017;
Eemian climate reconstruction of JO2004 (Bordon, 2008), Wagner et al., 2017). As mentioned before, the (modern)
the trends are similar, while some differences in temperature lake basin and parts of the lake floor show a pronounced ter-
and precipitation values should be pointed out. They proba- raced morphology. The relatively rapid flooding of extended,
www.clim-past.net/15/53/2019/ Clim. Past, 15, 53–71, 201962 G. Sinopoli et al.: Pollen-based temperature and precipitation changes
nearly horizontal surfaces, in particular at the northern and 5.3 Comparison with European climate reconstructions
southern ends of the lake, may thus have diminished size- inferred from pollen records
able parts of (flat) terrestrial habitat in short periods of time.
The impact of lake-level change on the low-lying terrestrial Lake Ohrid’s chronology is well established for MIS 5 due
habitats could be clearly seen in the biomarker and pollen to the high number of tephra layers (Francke et al., 2016;
records of core Co1202 (Holtvoeth et al., 2017). While local- Leicher et al., 2016), in particular for the transition between
ized processes are likely averaged out by the longer-distance the Riss glaciation and the Eemian, for which a further cor-
transport of material towards the distal DEEP site, a basin- relation with geochemical and pollen data from Lake Ohrid
wide effect of lake-level change and the associated distribu- and other proxies from Mediterranean sequences was carried
tion of low-lying biomes in the north, northeast and south of out by Zanchetta et al. (2016). For other European pollen
the basin might have to be considered in order to explain the records such chronological constraints are not available and
observed fluctuations in the PANN and TANN records of the thus the chronologies are probably less precise. Keeping in
DEEP core between 136 and 130 ka precipitation-controlled mind the existing chronological uncertainties, a comparison
lake-level change may have affected the surface area of low- of precipitation and temperature anomalies is carried out,
lying terrestrial habitats on terrace surfaces before the tem- with the values inferred from three other long pollen records
perature threshold for the precipitation of authigenic carbon- (Fig. 5) spanning the interval between 140 and 70 ka: Les
ate (TIC) was crossed, leading to the 2000 or 3000 years Echets, Le Bouchet and La Grande Pile (Fig. 1). Lake Ohrid,
offset in the beginning of the high-amplitude fluctuations in despite being considered as “a southern site”, shows past
pollen-derived PANN and TANN records and the rise in TIC. climate trends similar to the French records (Fig. 5). This
The beginning of the last interglacial is almost syn- similarity is probably due to its high elevation, causing en-
chronous as indicated by the records of TIC (DEEP), carbon- hanced precipitation relative to the rest of southern Europe
ate and TEX86 (Co1202, Fig. 4). However, according to the and making it similar to regions directly subjected to the
TIC and TEX86 records of Co1202, the thermal maximum, North Atlantic circulation. In order to discuss Lake Ohrid’s
characterized by stable conditions, occurs between 126.5 and climate record more in depth on a European scale, a further
124 ka in contrast to our reconstructed temperature that in- comparison is shown in Fig. 6. Here, Lake Ohrid climate
creases earlier at 127 ka. This slight discrepancy is proba- anomalies are plotted with the ones estimated by Brewer et
bly due to differences in the chronology established indepen- al. (2008) for southern and central-northern European sites,
dently for the two cores. An explanation for the delay of TIC using a pollen-inferred multi-method approach that takes into
values takes into account the time needed for the dissolution account the various sources of errors in paleoclimate recon-
of calcite from the surrounding rocks and/or dissolution of structions. The investigated interval is, in this case, limited
endogenic calcite after deposition (see Francke et al., 2016). to the period 135–105 ka, which includes the whole Eemian
At long timescales, calcite precipitation occurs during peri- (ca. MIS 5e–d according to Sánchez-Goñi, 2007). During the
ods of high precipitation such as interglacials and interstadi- final part of MIS 6 (Figs. 3, 6), climate seems to have been
als when supply of calcium and carbonate ions from calcite particularly harsh at Lake Ohrid, with highly reduced pre-
dissolution into the lake increases, and/or elevated tempera- cipitation compared to other European sites (Brewer et al.,
ture and high evaporation occur. Biogenic calcite formation 2008) or to the present. However, the precipitation anomaly
is hampered during dry and cold periods (glacial and stadi- values are comparable to those of the French sites (Fig. 5).
als) due to decreased precipitation and associated nutrient For the latter, we have to consider that the same methods
supply to reduced terrestrial calcite dissolution and inflow have been applied, which could have resulted in the more
of dissolved carbonate from the karst system (Lézine et al., consistent values. There are opposite trends, difficult to in-
2010). Soon after the “thermal maximum” (128–121 ka) TIC terpret, in the anomalies at the end of MIS 6 in the consid-
values decrease together with mean annual temperature; by ered records. La Grande Pile, Les Echets and Le Bouchet re-
contrast, at the same time precipitation rises. The low TIC constructions show a “thermal maximum”, the so-called cli-
content can be explained by lower water temperature, which mate optimum, from 127 to 118 ka followed by an abrupt
hampers calcite precipitation. Slight progressive drying oc- cooling around 117 ka (Fig. 6 and Brewer et al., 2008). The
curs from 121 ka until the end of the Eemian at 112 ka. This signal reconstructed for northern Europe is different from
trend corroborates the climate reconstruction based on core the French sites; Brewer et al. (2008) had identified a cli-
JO2004 (Bordon, 2008) and confirms the assumption that mate tri-partition during the Eemian, already evidenced by
the Last Interglacial was not a uniform wet and warm phase Tzedakis (2007, and references therein): early optimum, fol-
in western Europe (e.g. Cheddadi et al., 1998; Guiot et al., lowed by slight cooling, followed by a sharp drop in temper-
1993; Klotz et al., 2004; Kühl and Litt, 2003; Rousseau et atures and precipitation. This set of changes appears to be
al., 2006; Sánchez-Goňi et al., 2005) and that successive cool restricted to the north, with a very different set of changes in
and dry events occur at ca. 110 and 105 ka. the south. In southern Europe, the Eemian climate appears to
have remained warm with stable conditions over a long pe-
riod between 126 and 105 ka (Fig. 6). Lake Ohrid is located
Clim. Past, 15, 53–71, 2019 www.clim-past.net/15/53/2019/G. Sinopoli et al.: Pollen-based temperature and precipitation changes 63 Figure 4. Lake Ohrid: comparison between DEEP core annual temperature (TANN), precipitations (PANN) and TIC (Francke et al., 2016) with TIC and TEX86 (Co1202 core; Holtvoeth et al., 2017). Blue shading indicates cold periods (penultimate glacial and early last glacial stadials). in a central position on the Balkans Peninsula, at the conflu- cording to several studies carried out in central and northern ence of central European and Mediterranean climates. The Europe (Guiot et al., 1993; Klotz et al., 2004; Rioual et al., Lake Ohrid climate reconstruction also shows a climate op- 2001), the Melisey I event is characterized by an abrupt de- timum in the early part of the Eemian and then a progressive cline in temperatures first, followed by increasing continen- cooling without a sharp drop in temperatures and precipi- tal conditions, with a subsequent decline in winter tempera- tation (Fig. 6); this suggests an intermediate climate signal, tures and an increase in summer temperatures. Other pollen more similar to the French sites (Fig. 5) than to the north- records from Lake Ohrid also strongly suggest that climatic ern or southern European ones (Fig. 6). Brewer et al. (2008) conditions remained favourable to grow mesophilous taxa show that climate changes during this period were heteroge- (Bordon, 2008; Holtvoeth et al., 2017; Lézine et al., 2010). neous, with greater winter warming in the centre and north- St. Germain Ia (Figs. 3 and 5) is drier than St. Germain Ic at east of Europe than in the west and north-west. Other stud- Lake Ohrid, with the latter showing annual precipitation up ies of the spatial distribution of temperature changes during to ca. 400 mm yr−1 higher than during the former. The values this period have shown similar trends in temperature, with are consistent with the data obtained by Klotz et al. (2004) the largest positive anomalies in central and northern Eu- for central Europe, more specifically in the northern Alpine rope, and negative anomalies in south-eastern Europe (Kas- foreland. The same trend is also recorded in the French sites par et al., 2005; Turney and Jones, 2010; Otto-Bliesner et al., presented here (Fig. 5). Melisey II appears as the most ex- 2013). Furthermore, one remaining question is whether the treme stadial of the LIC, coinciding with the maximum ex- climate of this period was very close to modern values or tension of ice sheets during the Early Weichselian. However, warmer and wetter than the present day as suggested by ex- the cooling reconstructed at Ohrid is probably overestimated isting studies (Guiot et al., 1989). The time series of anoma- with the MAT for the same reasons as during MIS 6. If we lies presented here (Fig. 5) suggest a positive anomaly of consider the WAPLS reconstruction, the anomalies estimated 1 to 2 ◦ C for the Ohrid Basin, strongly depending on the at Ohrid during Melisey II are 2 ◦ C higher than for the French method used. Melisey I is the first cooling event, with a sites (Figs. 3 and 5). During St. Germain II, temperature and significant reduction in temperatures and precipitation, al- precipitation values for Lake Ohrid are similar to those of though less pronounced than at the French sites (Fig. 5). St. Germain Ia (Figs. 3 and 5). This pattern is corroborated At Lake Ohrid, a surprising positive anomaly in the middle by other studies for the North Atlantic, using marine δ 18 O of Melisey I is suggested and is potentially due to the per- data (Keigwin et al., 1994), for North Europe (e.g. Guiot et sistence of trees during stadials, highlighting the important al., 1989) and for the Iberian margin (Sánchez-Goñi et al., role of the Ohrid Basin as a refugium for arboreal taxa. Ac- 2000). At the end of the interstadial, a trend towards low www.clim-past.net/15/53/2019/ Clim. Past, 15, 53–71, 2019
64                                                      G. Sinopoli et al.: Pollen-based temperature and precipitation changes

Figure 5. Comparison between Lake Ohrid climate parameters with available climate reconstructions: Les Echets (265 m a.s.l.), Le Bouchet
(1200 m a.s.l.) and La Grande Pile (330 m a.s.l.) from Guiot et al. (1989, 1990, 1993). TANN (mean annual temperature) and PANN (mean
annual precipitation) are plotted against age (ka). Values represent anomalies (past climate value minus the modern measured value). Blue
shading indicates cold periods (penultimate glacial and early last glacial stadials).

Clim. Past, 15, 53–71, 2019                                                                          www.clim-past.net/15/53/2019/
G. Sinopoli et al.: Pollen-based temperature and precipitation changes 65
Figure 6. Comparison between the Lake Ohrid climate reconstruction and the climate reconstruction performed by Brewer et al. (2008) for
north and south Europe; TANN (mean annual temperature), PREC (mean annual precipitation) and MTCO (mean temperature of the coldest
month) are plotted against chronology (ka). Values represent anomalies (past climate value minus the modern measured value).
temperatures and an increase in precipitation is recorded at rameters with marine and continental proxies from Mediter-
Lake Ohrid, in agreement with the climate reconstruction of ranean and North Atlantic regions (Fig. 1).
Guiot et al. (1989) for the French pollen records (Fig. 5). In speleothem and lake sediment records, δ 18 O is mostly
The most striking feature of Lake Ohrid, recorded at the top seen as an indicator of the “amount of precipitation”, lower
of the studied sequence, is the presence of two interstadi- (higher) values are related to increasing (decreasing) humid-
als following St. Germain II, namely Ognon I and Ognon II. ity (Bard et al., 2002; Drysdale et al., 2005, 2009; Regattieri
These interstadials are visible, even if less marked in other et al., 2014; Zanchetta et al., 2007, 2016). The Ohrid pre-
eastern Mediterranean records (Tenaghi Philippon; Müller et cipitation trend shows similarities with the oxygen isotope
al., 2011; Lake Van: Pickarski et al., 2015) and could be cor- records reported in Fig. 7, suggesting a generally good agree-
related with the Dansgaard–Oeschger events DO 19 and 20 ment with the variations in Mediterranean rainfall detected
(Dansgaard et al., 1993). in Italy in speleothems from Antro del Corchia and Tana che
Urla (Drysdale et al., 2005; Regattieri et al., 2014) and in the
lake record of Sulmona (Regattieri et al., 2017). According
5.4 Comparison with other European and North Atlantic to Drysdale et al. (2009), there is a break in the decrease in
proxy records δ 18 O in continental and marine values prior to the beginning
of the Eemian at ca. 129 ka, which can be related to Heinrich
In order to discuss the Ohrid climate signal at a wider scale, event 11 (H11; Shackleton et al., 2003). During this event,
Fig. 7 shows the correlation of the reconstructed climate pa-
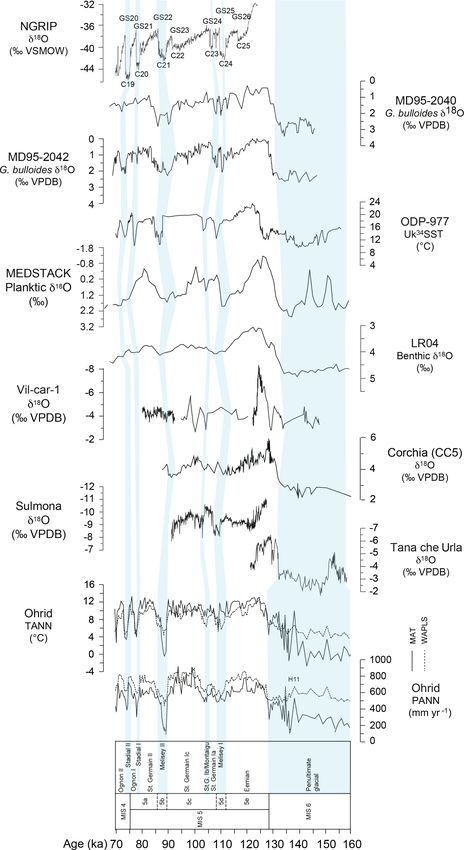
www.clim-past.net/15/53/2019/ Clim. Past, 15, 53–71, 201966 G. Sinopoli et al.: Pollen-based temperature and precipitation changes Figure 7. Comparison of TANN and PANN values from Lake Ohrid with other hydrological and climate proxies from the Mediterranean and the North Atlantic: δ 18 O speleothem record from Tana che Urla cave and δ 18 O of endogenic calcite from Sulmona lake (Regattieri et al., 2017 and 2014, respectively); δ 18 O speleothem record from Corchia cave (CC5, Drysdale et al., 2005); δ 18 O benthic from LR04 stack (Lisiecki and Raymo, 2005); planktic δ 18 O from MEDSTACK data (Wang et al., 2010); sea surface temperature (SST) from core ODP-977 (Western Mediterranean; Martrat et al., 2004); planktic δ 18 O from Iberian margin (MD95-2042; Sánchez Goñi et al., 1999; Sánchez Goñi et al., 2005); planktic δ 18 O from Iberian margin (MD95-2040, De Abreu et al., 2003); Greenland δ 18 O record (NGRIP Members, 2004). Numbers denote Greenland stadials (GS) corresponding to North Atlantic cold events (C events; after McManus et al., 1994). Blue shading indicates cold periods (penultimate glacial and early last glacial stadials). Clim. Past, 15, 53–71, 2019 www.clim-past.net/15/53/2019/
G. Sinopoli et al.: Pollen-based temperature and precipitation changes                                                                 67

the North Atlantic thermohaline circulation and the North          104, 90.2–85.7, 78.8–77.6 and 75–73.4 ka) attributable to the
Atlantic deep-water formation shut down with a consequent          well-known succession of climatic events occurring during
phase of cooler and drier conditions for mid-latitude western      MIS 6 and 5.
Europe (Genty et al., 2003). At Lake Ohrid (Fig. 7), H11 is           With regard to the last interglacial, our results provide ev-
clearly detected for the first time in a climate reconstruction,   idence that the Eemian was not as stable, confirming ex-
and in the TIC records of the DEEP core and Co1202 core            isting studies. The climate reconstruction led to distinguish
(Figs. 4, 7).                                                      three periods: a climatic optimum (128–121 ka), followed by
   Important changes during the LI have also been detected,        progressive cooling in conjunction with an increase in pre-
besides at Lake Ohrid, in the alkenone-based sea surface tem-      cipitation (121–118 ka), and, finally, a period characterized
perature (SST) reconstruction of the ODP-977 sediment core         by a decrease in both temperatures and precipitation (118–
(Alboran Basin; Martrat et al., 2004) in δ 18 O records of the     112 ka).
Iberian margin (MD95-2042 and MD95-2040; Sánchez Goñi                 The early last glacial (from 112 to 70 ka) is characterized
et al., 1999, 2005; De Abreu et al., 2003) and from Green-         by a succession of cold and warm periods (stadials and inter-
land (Fig. 7), in line with other studies on speleothems and       stadials) in which cold ones show an increase in seasonality
on Mediterranean and North Atlantic marine records (e.g.           and dry conditions. This climatic trend can be correlated to
De Abreu et al., 2003; Demény et al., 2017; Drysdale et al.,       the succession of Greenland stadials and of North Atlantic
2009; Lisiecki and Raymo, 2005; Martrat et al., 2007, 2014;        cold events (Dansgaard et al., 1993; GRIP Members, 1993),
McManus, et al., 1994; Mokeddem et al., 2014; NGRIP                illustrating the teleconnections between the North Atlantic
Members, 2004; Oppo et al., 2006; Sánchez Goñi et al., 1999,       realm and the Mediterranean region. The same succession of
2005; Wang et al., 2010). Based on the ODP-977 alkenone            cold and dry events at Lake Ohrid is also coherent with hy-
data (Martrat et al., 2004, 2014), warm SSTs occurred during       drological and isotopic data from the central Mediterranean.
interstadial periods, while cold SSTs persisted during stadi-         At a wider scale, our results showed a great similarity be-
als Melisey I and II. SST changes are associated with large        tween Lake Ohrid and climate reconstructions of French and
shifts in mean annual air temperature and moisture content         central European records rather than the stacked curve of four
as reflected in vegetation changes inferred from pollen anal-      southern European records. Lake Ohrid shows intermediate
ysis in European and Mediterranean records (Martrat et al.,        features between these two areas; our curves are in line with
2004; Tzedakis et al., 2003). The connection between Lake          those of other southern European climate proxies (e.g. central
Ohrid and the North Atlantic (Fig. 7) is also highlighted by       Italian speleothems). Future climate reconstructions and in-
the evidence of the Melisey I stadial, which corresponds to        dependent proxies are needed for the southern Mediterranean
the North Atlantic event C24 (and to GS25), the Montaigu           to resolve the complex regional expressions of past climate
event, corresponding to C23 (and GS24), and the Melisey            changes.
II stadial, which corresponds to C21 (and GS22). Besides
this event, the final part of MIS 5 at the transition to MIS 4
at Lake Ohrid is characterized by a series of abrupt climate       Data availability. Pollen data from the first 500 ka years of the
changes (Ognon I and II phases) composed of two intersta-          sequence (Sadori et al., 2016) are available through the online
dials and two stadials. The latter correspond to the North At-     database PANGAEA at https://doi.org/10.1594/PANGAEA.892362
lantic cold events C20 (GS21) and C19 (GS20) (Fig. 7). A           (Sadori et al., 2018). Higher resolution pollen data (Sinopoli et al.,
                                                                   2018) and climate reconstruction data (this paper) are not public yet
similar pattern can be depicted in the SST record of ODP-
                                                                   as they will be part of further elaborations by authors of this article.
977 (Fig. 7) with two abrupt warming events, preceded by a
strong cooling after a long period of stability (Martrat et al.,
2014).                                                             Supplement. The supplement related to this article is available
                                                                   online at: https://doi.org/10.5194/cp-15-53-2019-supplement.

6   Conclusions
                                                                   Author contributions. The paper was written by GS, LS (all sec-
We provide a quantitative reconstruction of climate parame-        tions) and OP (Sects. 3, 4, 5, 6) with substantial contributions from
ters based on the pollen record from Lake Ohrid (DEEP site),       BW, AF, JH (Sects. 1, 2, 5, 6) and AM (Sects. 1, 4, 5, 6). Data
using two complementary approaches for the period between          analysis was carried out by GS with the supervision of OP. Data
160 and 70 ka. This period covers the last part of the penulti-    management and the elaboration of figures and diagrams have been
mate glaciation, equivalent to MIS 6 (160–128 ka), and the         provided by GS and AM.
Last Interglacial Complex (LIC, 128–70 ka), equivalent to
MIS 5, as well as the first part of MIS 4.
   Our results for the LIC show an alternation of warm             Competing interests. The authors declare that they have no con-
and wet periods (128–112, 108–90.2, 85.7–78.8, 77.6–75             flict of interest.
and 73.4–70 ka) with cold and dry ones (112–108, 105.2–

www.clim-past.net/15/53/2019/                                                                           Clim. Past, 15, 53–71, 2019
You can also read