City of Revelstoke Corporate Energy and Greenhouse Gas Emission Inventory and Reduction Strategy
←
→
Page content transcription
If your browser does not render page correctly, please read the page content below
City of Revelstoke
   Corporate Energy and Greenhouse Gas
Emission Inventory and Reduction Strategy

                                March 2011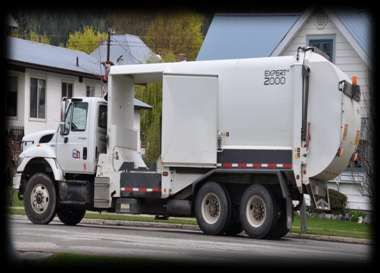
City of Revelstoke Corporate Greenhouse Gas Emission Inventory and Reduction Strategy   2

Prepared for:
Brian Mallett
Director of Engineering and Public Works
City of Revelstoke
216 Mackenzie Avenue
Revelstoke, BC
V0E 2S0

Prepared by:
Penny Page-Brittin, HBSc.
Environmental Sustainability Coordinator
City of Revelstoke

March 2011
City of Revelstoke Corporate Greenhouse Gas Emission Inventory and Reduction Strategy               3

Executive Summary
Greenhouse gases that accumulate in the earth’s atmosphere act as a blanket which prevents the sun’s
heat from escaping. While these gases are necessary for life to exist on earth, an increase in greenhouse
gases in the last century has resulted in a trend toward global warming. As a result, countries around
the world are creating policies and examining methodologies to reduce our reliance on fossil fuels and
to create a low carbon society, reducing the release of carbon dioxide into the atmosphere.

The Federation of Canadian Municipalities administers the Partners for Climate Protection Program that
sets a five milestone approach to measure greenhouse gas emissions and take action to reduce energy
consumption and emissions. The five milestones are:
    1. Create a greenhouse gas inventory and forecast.
    2. Set an emission reduction target.
    3. Develop a local action plan that outlines how emissions and energy use will be reduced.
    4. Implement the action plan.
    5. Monitor progress and report results.
The program is part of ICLEI (International Council for Local Environmental Initiatives) Local
Governments for Sustainability, Cities for Climate Protection Network, which involves more than 900
communities worldwide. The City of Revelstoke became a member of the Partners for Climate
Protection Program in 2006.

The Government of British Columbia has also implemented legislation, policies and actions to address
climate change. One of the actions at the municipal level was to create the voluntary Climate Action
Charter and a joint Provincial Government –UBCM Green Communities Committee to support local
governments in planning and implementing climate change initiatives. The Climate Action Charter
commits signatory municipalities to become carbon neutral in municipal operations by 2012. To be
carbon neutral means there is no net release of carbon or greenhouse gas emissions into the
atmosphere as a result of city operations. Being carbon neutral with current technologies is difficult. As
a result, it is achieved through a combination of reductions and offsets. The steps to being carbon
neutral are:
     1. Measure greenhouse gas emissions
     2. Reduce where possible
     3. Offset the remaining emissions by purchasing carbon offsets
     4. Report to the Provincial-UBCM Green Communities Committee on the above actions
The City of Revelstoke signed the Climate Action Charter in the fall of 2008.

International standards for creating a greenhouse gas emission inventory for municipal operations
follow the International Local Government GHG Emissions Analysis Protocol. Following this protocol, a
municipality is responsible for emissions where they have financial or operational control, and therefore
City of Revelstoke Corporate Greenhouse Gas Emission Inventory and Reduction Strategy 4
the ability to make changes. Under the Climate Action Charter, the joint Provincial-UBCM Green
Communities committee has established criteria based on “traditional services”, a group of services that
municipalities typically provide and are responsible for to be carbon neutral.
This report has been written to meet the criteria of the Local Government GHG Emission Analysis
Protocol and to achieve Milestones 1-3 of the Partners for Climate Protection Program for corporate
operations. This includes a greenhouse gas emissions inventory and forecast, a reduction target, and an
energy and emissions reduction strategy. The report also identifies emissions that the City will be
responsible for to meet the commitment made under the Climate Action Charter to be carbon neutral
by 2012.
By creating a greenhouse gas emissions inventory, a local government can quantify its energy
consumption, energy spending and the resulting greenhouse gas emissions or carbon footprint. Data
was gathered for each of the following sectors:
Municipal Buildings
Vehicle Fleet
Streetlights/Traffic Signals
Water/ Wastewater
Corporate Solid Waste
Other.
The “Other” sector compiles
Greenhouse Gas Emissions emissions mainly from
City of Revelstoke Corporate Revelstoke Community Forest
Operations (2007) Corporation, and contracted
out services, over which the
City has financial or operational
Buildings control.
13% Vehicle Fleet
5% A baseline year of 2007 was
Streetlights/Traffic Signals
38% chosen to be consistent with
8%
Water/Wastewater the Community Energy and
2%
Solid Waste Emission Inventory (CEEI) done
Other by the province, which
34%
Total Greenhouse Gas quantifies energy consumption
Emissions = 1457 t CO2e and greenhouse gas emissions
for the community as a whole.
Figure 1: Greenhouse Gas Emissions per Sector, City of Revelstoke Corporate Data was also collected for
Operations Inventory, 2007. 2008 and 2009.City of Revelstoke Corporate Greenhouse Gas Emission Inventory and Reduction Strategy 5
The total greenhouse gas emissions for all sectors
water/ Greenhouse Gas Emissions
of corporate operations in 2007 were 1457 tonnes waste
CO2e. The breakdown of emissions for each sector water
10%
can be seen in Figure 1. From this inventory, the
street
emissions that are a result of “traditional lights/traffic
services”, and need to be measured under the lights
2%
Climate Action Charter are 1178 tonnes CO2e. buildings
These are the emissions that will need to be 46%
vehicle fleet
reduced or offset to be carbon neutral in 42%
corporate operations in 2012. Tota l GHG
Emi s sions:
1188 tCO2e
A greenhouse gas emission forecast was done for
corporate operations for the ten year period 2007
to 2017. Forecasting is done using a “business- water/ Energy
waste
as- usual” approach, predicting population growth water
and the resulting impact on municipal services. 12%
street
Forecasting is difficult, particularly in Revelstoke, lights/
where the impact on population growth over the traffic lights
7%
next ten years is unclear since the opening of
Revelstoke Mountain Resort in 2007. While vehicle fleet
16% buildings
forecasting is challenging, it aids in setting 65%
Tota l
reduction targets, which are absolute reductions Energy:
from the baseline year of 2007. 42,747 GJ
The forecasted emissions for 2017 is an estimated
increase of approximately 248 tonnes CO2e. This is
Energy Spending
a “business -as- usual” approach based on water/
waste
operations in 2007 and does not take into account water
11%
reduction actions that have occurred since 2007,
or changes in technology that may occur. street
lights/
traffic lights
12% buildings
Collecting data on greenhouse gas emissions,
vehicle fleet 55%
energy and energy spending aids in identifying 22%
opportunities to reduce energy, save money and Tota l Energy
reduce emissions. Figure 2 shows greenhouse gas Spending:
$867,624
emissions, energy consumption and spending for
each sector in 2007. The “Other” and “Solid Figure 2: Greenhouse Gas Emissions, Energy and Energy
Sending by Sector, City of Revelstoke Corporate Operations,
Waste” categories have been omitted for this 2007.
comparison.City of Revelstoke Corporate Greenhouse Gas Emission Inventory and Reduction Strategy 6
To gain a further understanding of energy used in
corporate operations, the emissions, energy Greenhouse Gas Emissions
consumption and energy spending are compared district
heating
for each of the five energy sources, electricity, electricity
7%
12%
propane, district heating, gas and diesel. This
comparison is seen in Figure 3.
Greenhouse gas emissions calculated for electricity
vehicle fuel
are the resulting emissions from the creation of propane Tota l GHG
42%
39% Emi s sions:
electricity, while emissions from gasoline, diesel, 1188 tCO2e
and propane are emissions as a direct result of
combustion of fuel. District heating in Revelstoke
is heat produced from the burning of waste wood
or biomass. Although biomass is considered Energy
carbon neutral, propane is also used for district
heating to meet peak demands. The greenhouse
gas emissions for district heating are a result of the district
propane used. heating
21%
electricity
Reductions in each energy type impact greenhouse 45%
vehicle fuel
gas emissions and energy spending differently. 16%
While a reduction in electricity will save money, it propane
Tota l Energy:
will not have a large impact on reducing emissions. 18%
42,747 GJ
A reduction in vehicle fuel or propane will have a
much greater impact on reducing emissions and
may also save on energy spending. A balanced
Energy Spending
approach is needed to address reduction actions
which evaluate cost to implement, energy and cost
savings and reduction in greenhouse gas emissions.
district
A review of each sector of corporate operations, heating
18%
resources available through the Partners for electricity
Climate Protection Program, the BC Climate Action 43%
vehicle fuel
Toolkit, actions and policies implemented in other 22%
Tota l Energy
communities, the Carbon Neutral Kootenay Action propane Spending:
Guide and consultation with municipal staff was 17% $867,624
conducted to identify actions to reduce energy
consumption and decrease emissions.
Figure 3: Greenhouse Gas Emissions, Energy and Energy
Spending by Energy Source, City of Revelstoke Corporate
Operations 2007.City of Revelstoke Corporate Greenhouse Gas Emission Inventory and Reduction Strategy 7
Fifteen recommended actions have been identified:
1. Conduct comprehensive energy audits and opportunity assessments of all municipal buildings
Using a qualified Energy Advisor conduct energy audits to assess opportunities to increase energy
efficiencies, save money and reduce greenhouse gas emissions. Areas that should be considered
include HVAC energy cost savings strategies, lighting recommendations and building envelope
improvements.
2. Establish a Green Building Policy
Establish a Green Building policy which commits the City to achieve a given standard that reduces
energy consumption and greenhouse gas emissions when building new buildings or retrofitting
existing buildings.
3. Implement an Energy Efficient Equipment Policy
An Energy Efficient Equipment Policy would commit the City to purchase equipment such as
appliances, office equipment and consumer electronics that are energy efficient.
4. Implement a Corporate Idle Reduction Policy including driver education and awareness
Implement a Corporate Idle Reduction Policy which is directed toward all City staff including
contracted out snow removal. Diver education and awareness of idling reduction practices can lead
to reduced fuel consumption and will show leadership to the community as a whole.
5. Ensure vehicle data collection and preventative maintenance scheduling are in place.
Ensuring vehicle date is collected including tracking of kilometers travelled, fuel consumed and
downtime, allows for evaluation of fuel efficiency and life cycle costing of vehicles in the fleet.
6. Establish a Fuel Efficient Vehicle Purchasing Policy
When purchasing vehicles use “right sizing” and life cycle costing. Determine what the vehicle is
being used for and whether a more fuel efficient vehicle can be purchased.
7. Consider alternative fuels and technologies
Evaluate options, cost and feasibility to use a non-food grade biodiesel in the city vehicle fleet.
8. Continue to improve energy efficiency in streetlights and traffic signals
Evaluate the capital cost, cost savings and payback period for replacing lights in signs and
ornamental lighting with more energy efficient bulbs.City of Revelstoke Corporate Greenhouse Gas Emission Inventory and Reduction Strategy 8 9. Optimize operation of water and waste water infrastructure Continue to improve energy efficiency in water and wastewater infrastructure. 10. Encourage water conservation Expand existing water conservation measures. 11. Reduce solid waste through diversion Increase the number of recycling containers at municipal facilities. Place containers directly beside waste garbage containers to increase the ease of recycling. 12. Encourage energy and emissions reduction in contracted out services Include contractors in energy and emissions initiatives including anti-idling awareness programs, and alternative fuels. Require all new contracts to provide fuel consumption data. 13. Ensure ownership of the plan Ensure there are adequate staff resources to implement and monitor the plan and that energy and emission reductions are recorded and communicated to the community. 14. Engage municipal staff Engaging staff and achieving “buy-in” are important for successfully implementing actions where a behavioural change is required. Through workshops ensure an understanding of greenhouse gas emissions and impact on global warming and climate change. Through further municipal engagement, potential obstacles, alternatives or missed opportunities in general operations may be identified. 15. Establish an Energy and Emissions Reduction Program Establish an Energy and Emissions Reduction Program to finance some of the initiatives and actions that have been identified in this report. Funding of $20,000 annually, beginning in 2012, would allow for reduction projects that will further reduce emissions and save on the cost of paying carbon offsets in 2012.
City of Revelstoke Corporate Greenhouse Gas Emission Inventory and Reduction Strategy               9

The Partners for Climate Protection Program recommends setting a reduction target of 20% from
baseline over a ten year period for corporate operations. Given the reduction potential in the above
actions it is recommended that Revelstoke adopt a 20% reduction target from 2007 baseline by 2020.
However, this target should be re-evaluated in 5 years, in the event the community sees a much larger
increase in population and demand on municipal services compared with the assumptions used to
create the energy and emissions forecast. The year 2020 was chosen as a target year to be consistent
with the year chosen in the Community Energy and Emissions Plan (CEEP).

Many of the recommended actions require increased education and awareness, and research toward
implementation of new “Green” policies, which will not require a lot of funding. Until energy audits and
opportunity assessments are completed for municipal buildings and water/waste water infrastructure, it
is unclear what opportunities exist and what the financial impact might be.

The funds in an Energy and Emission Reduction Program (recommendation 15) will likely be adequate
funding for completion of energy audits on most, if not all, municipal buildings. Following completion of
this opportunity assessment, an implementation strategy for the plan should be completed that details
potential projects, a timeline, capital cost, payback period, energy saved and resulting cost savings and
greenhouse gas reduction. Potential funding opportunities for implementation of the plan are detailed
in the report.

It is not completely clear at this time what it will cost to be carbon neutral in corporate operations in
2012. Currently the cost of carbon offsetting by Pacific Carbon Trust, a British Columbia Provincial
Crown Corporation is $25/tonne CO2e. Assuming this cost, carbon offsetting based on 2007 emissions
will be $29,450. Based on 2007 energy consumption, the Carbon Action Revenue Incentive Plan (CARIP)
funding in 2012 will be approximately $24,900. The CARIP is a grant equal to 100% of the provincial
carbon tax paid as a direct expenditure by a local government.

As different options to offset carbon under the Climate Action Charter are being developed it will be
important to address possible ways to meet carbon offset requirements through investing in Revelstoke
Community Energy Corporation (RCEC) and Revelstoke Community Forest Corporation (RCFC).

To allow for monitoring of the reduction actions identified in this report, and to quantify emission
reductions and identify successes, it is important to annually track energy consumption, emissions and
energy spending in an updated spreadsheet. It is important that emissions related to “traditional
services” that fall under the City’s carbon obligations under the Climate Action Charter are readily
identified.

Options for potential funding for implementation of the recommended actions and toward completion
of Milestone 4 (Implementation) and Milestone 5, (Monitoring Progress and Reporting) of the Partners
for Climate Protection Program are detailed in this report.
City of Revelstoke Corporate Greenhouse Gas Emission Inventory and Reduction Strategy 10
Acknowledgements
The City of Revelstoke would like to acknowledge the Carbon Neutral Kootenay Project, an initiative
jointly funded by the Regional Districts of Central Kootenay, East Kootenay and Kootenay Boundary and
the Columbia Basin Trust and implemented by the Sheltair Group (now Stantec) and The Community
Energy Association. The City of Revelstoke was one of 28 municipalities included in this project.
A spreadsheet and initial compilation of data completed by the Carbon Neutral Kootenay project was
built upon to create this energy and greenhouse gas emissions inventory. Also, the “Carbon Neutral
ACTION guide, A Starting Point for Local Governments” developed by the Carbon Neutral Kootenay
project formed a framework to identify potential energy and emissions reduction opportunities.
Thank you to City staff for their input, for providing data, and answering many questions. Particular
thanks to Elaine Greenwood, and Tina Miertsch for gathering and inputting data.
The following people were also instrumental in providing the necessary date to complete this energy
and emissions inventory:
Louise Thrale and Larry Marchand, Revelstoke Community Energy Corporation
Diane O’Brien, Revelstoke Community Forest Corporation
Bret Renaud, BRESCO
Darrel O’Shaughnessy, Commissionaires
John Franks, Revelstoke Golf Course
Horst Miola, Williamson Lake Campground
Margaret Pacaud, Visual Arts SocietyCity of Revelstoke Corporate Greenhouse Gas Emission Inventory and Reduction Strategy 11
Table of Contents
Executive Summary............................................................................................................................3
Acknowledgements.......................................................................................................................... 10
1.0 Introduction ............................................................................................................................... 13
1.1 Climate Change and Greenhouse Gases ........................................................................................... 13
1.2 Partners for Climate Protection ........................................................................................................ 13
1.3 British Columbia’s Climate Action Plan ............................................................................................. 14
1.4 Carbon Neutrality.............................................................................................................................. 15
1.5 Community Profile ............................................................................................................................ 15
1.6 Revelstoke Community Energy Corporation (RCEC) ......................................................................... 16
1.7 Revelstoke’s Commitment to Climate Change ................................................................................. 16
1.8 Objectives of the Corporate Greenhouse Gas Emissions Inventory and Reduction Strategy .......... 17
2.0 Energy and Greenhouse Gas Emissions Inventory – Milestone One .............................................. 18
2.1 Methodology..................................................................................................................................... 18
2.2 Emission Factors................................................................................................................................ 18
2.3 Municipal Buildings Emissions Inventory .......................................................................................... 20
2.3.1 Electricity.................................................................................................................................... 20
2.3.2 District Heating .......................................................................................................................... 21
2.3.3 Propane ...................................................................................................................................... 22
2.4 Vehicle Fleet Emissions Inventory .................................................................................................... 23
2.5 Streetlights/Traffic Signals Emissions Inventory ............................................................................... 23
2.6 Water/Wastewater Emissions Inventory .......................................................................................... 24
2.7 Solid Waste Emissions Inventory ...................................................................................................... 26
2.8 Other Sector Emissions Inventory..................................................................................................... 27
2.9 Greenhouse Gas Emission Inventory Summary ................................................................................ 28
2.10 Climate Charter Considerations ...................................................................................................... 29
2.11 How does Revelstoke Compare to Other Communities? ............................................................... 30
2.12 Baseline Year ................................................................................................................................... 31
2.13 Greenhouse Gas Emissions Forecast .............................................................................................. 31City of Revelstoke Corporate Greenhouse Gas Emission Inventory and Reduction Strategy 12
3.0 Energy and Emissions Reduction Plan and Reduction Target – Milestones Two and Three ............ 34
3.1 Why reduce energy consumption and greenhouse gas emissions? ................................................. 34
3.2 Energy Savings verse Greenhouse Gas Emission Reduction ............................................................. 35
3.3 Methodology..................................................................................................................................... 36
3.4 Emission Reduction Actions in Place and Future Opportunities ...................................................... 37
3.4.1 Municipal Buildings .................................................................................................................... 37
3.4.2 Vehicle Fleet ............................................................................................................................... 41
3.4.3 Streetlight/Traffic Signals ........................................................................................................... 45
3.4.4 Water/Wastewater .................................................................................................................... 45
3.4.5 Solid Waste ................................................................................................................................ 47
3.4.6 Other .......................................................................................................................................... 48
3.5 Setting a Reduction Target................................................................................................................ 49
4.0 Plan Implementation .................................................................................................................. 50
4.1 Implementation Strategy .................................................................................................................. 51
4.2 Resources and Potential Funding Opportunities .............................................................................. 51
4.3 Federation of Canadian Municipalities Green Municipal Fund ........................................................ 52
4.4 Carbon Action Revenue Incentive Plan (CARIP) ................................................................................ 52
4.5 Community Works Fund ................................................................................................................... 53
5.0 Plan Monitoring and Reporting ................................................................................................... 53
5.1 Reporting........................................................................................................................................... 53
5.2 Climate Action Charter Considerations............................................................................................. 54
5.3 Carbon Offsetting .............................................................................................................................. 54
6.0 Conclusion ................................................................................................................................. 55
7.0 References ................................................................................................................................. 56
8.0 Appendices ................................................................................................................................ 57
Appendix A: City of Revelstoke Resolution, Partners for Climate Protection........................................ 57
Appendix B: City of Williams Lake, Vehicle/Equipment Idle Free Policy ............................................... 59
Appendix C: City of Dawson Creek, Green Vehicle Policy ...................................................................... 62City of Revelstoke Corporate Greenhouse Gas Emission Inventory and Reduction Strategy 13 1.0 Introduction 1.1 Climate Change and Greenhouse Gases Climate change refers to variations in the earth’s atmosphere over time including global or regional changes in temperature, pressure or weather. One type of climate change that has been observed in recent decades is global warming. Scientific findings of the Intergovernmental Panel on Climate Change (IPCC) indicate “Warming of the climate system is unequivocal, as is now evident from observations of increases in global average air and ocean temperature widespread melting of snow and ice, and rising global average sea level”.1 It is widely recognized that global warming is caused by an increase in greenhouse gases in the atmosphere as a result of human activity. Greenhouse gases include water vapor, carbon dioxide, methane, nitrous oxide and other gases. These gases accumulate in the atmosphere to form an invisible blanket-like layer that traps heat within the atmosphere. Although greenhouse gases are necessary to trap the heat needed to make life on earth possible, it is when their balance is changed that global warming is created. This balance is thrown off by human activity that increases greenhouse gases into the atmosphere, such as the burning of fossil fuel or decreases in carbon sinks that reduce the levels of carbon dioxide, like deforestation. The main greenhouse gases emitted by human activity are carbon dioxide (C02), methane (CH4) and nitrous oxide (N2O). Each gas has a greenhouse gas potential, where some have more impact as a greenhouse gas compared to others. For example, the greenhouse gas potential for methane is 21 times that of C02. To allow for a better understand and tracking of greenhouse gases, all gases are expressed in terms of their potential in relation to C02 or their C02 equivalent, C02(e). 1.2 Partners for Climate Protection The Partners for Climate Protection Program is the Canadian component of ICLEI’s (International Council for Local Environmental Initiatives) Local Governments for Sustainability, Cities for Climate Protection network, which involves more than 900 communities worldwide. The program is administered through the Federation of Canadian Municipalities and is a network of Canadian municipal governments that have committed to reducing greenhouse gases and taking action on climate change. Currently 210 Canadian municipalities are members, with 65 of them being in British Columbia. 1 International Panel for Climate Change, “Summary for Policymakers”, Climate Change 2007: Synthesis Report, http://www.ipcc.ch/pdf/assessment-report/ar4/syr/ar4_syr_spm.pdf, assessed on-line October 20, 2010.
City of Revelstoke Corporate Greenhouse Gas Emission Inventory and Reduction Strategy                    14

The program consists of a five milestone framework to be completed for both the local government’s
corporate operations and for the community as a whole:

     1.   Create a greenhouse gas inventory and forecast.
     2.   Set an emission reduction target.
     3.   Develop a local action plan that outlines how emissions and energy use will be reduced.
     4.   Implement the action plan.
     5.   Monitor progress and report results.

To date, 21 municipalities in British Columbia have completed at least the first three milestones for
corporate operations, and 11 municipalities have also completed these milestones for the community as
a whole. The City of Vancouver and the Resort Municipality of Whistler are the only municipalities in
British Columbia to have completed all five milestones for both corporate operations and the
community as a whole.2

1.3 British Columbia’s Climate Action Plan
The Provincial government has recently created a number of programs and legislation to take action on
climate change. Bill 44 (2007) Greenhouse Gas Reduction Target Act has established a province wide
greenhouse gas emissions reduction target of 33% below 2007 levels by 2020, and a reduction of 80% by
2050.

A Provincial Climate Action Plan has been developed to meet these targets, and is aimed at reducing
greenhouse gas emissions in all sectors of the province’s economy, requiring all ministries and other
public sector organizations to be carbon neutral by 2010.

Recognizing that local governments have influence over approximately half of the provinces greenhouse
emissions, the provincial government created:

     1. Bill 27 (2008) Local Government (Green Communities) Statutes Amendment Act which requires
        local governments include reduction targets, policies and actions in their Official Community
        Plans by May 31st 2010 and in Regional Growth Strategies by May 31st 2011. Bill 27 also gives
        local governments a number of tools to help reduce greenhouse gas emissions, conserve energy
        and work toward creating more compact and sustainable communities. These include expanded
        Development Cost Charge authority, new development permit area designations and greater
        authority to vary off-street parking.

2
 Federation for Canadian Municipalities, Partners for Climate Protection. http://fmv.fcm.ca/Partners-for-Climate-
Protection/milestones/British-Columbia.asp, assessed on-line October 2010.
City of Revelstoke Corporate Greenhouse Gas Emission Inventory and Reduction Strategy 15
2. The Climate Action Charter a voluntary charter, where signatories commit to:
Being carbon neutral in their municipal operations by 2012.
Measuring and reporting on their community greenhouse gas emission profile (currently
being completed by the Community Energy Emission Initiative (CEEI) through the
Ministry of the Environment).
Creating complete, compact and more energy efficient communities.
1.4 Carbon Neutrality
Under the Climate Action Charter the joint Provincial Government –UBCM Green Communities
Committee was created to support local governments in planning and implementing climate change
initiatives toward being carbon neutral in their operations by 2012. To be carbon neutral in corporate
operations means there is no net release of carbon or greenhouse gas emissions into the atmosphere as
a result of city operations. Being carbon neutral with current technologies is difficult. As a result
carbon neutrality is reached through a combination of reductions and offsets. The steps to being
carbon neutral are:
1. Measure the GHG emissions in corporate operations
2. Reduce the emissions where possible
3. Offset the remaining emissions by purchasing carbon offsets
4. Report to the Provincial-UBCM Green Communities Committee on the above actions
A carbon offset is a reduction in carbon that occurs by others through a project or activity, often
referred to as a carbon credit. To become carbon neutral the local government is required to purchase
qualified carbon offsets or greenhouse gas reduction projects. The criteria for a local government
greenhouse gas reduction project are currently under review by the Green Communities Committee.3
1.5 Community Profile
Revelstoke is located within the Columbia Mountains in the Interior of British Columbia, approximately
midway between Calgary and Vancouver. The City is located on the Columbia River, nestled between
the Monashee mountain range to the West and the Selkirk mountain range to the East, with a
population estimated to be 8,125.4 Although Revelstoke is located along two main transportation
corridors, the Trans-Canada Highway and the mainline of the Canadian Pacific Railway, the City is
relatively isolated, with the closest community in any direction being approximately an hour away.
3
The Workbook, Helping Local Governments Understand How to be Carbon Neutral in their Corporate Operations,
UBCM, Province of British Columbia, September 2010.
4
City of Revelstoke’s webpage, www.cityofrevelstoke.com, assessed on-line, October 2010.City of Revelstoke Corporate Greenhouse Gas Emission Inventory and Reduction Strategy 16
Revelstoke is a vibrant mountain community that takes pride in its beautiful mountain setting and many
recreational and cultural opportunities. Revelstoke Mountain Resort opened in 2007, with additional
expansion in 2008, boasting the longest vertical ski run in North America.
1.6 Revelstoke Community Energy Corporation (RCEC)
Revelstoke is a leader in district heating, being the first City in British Columbia in 2005 to build a
biomass-fired district heating system. Revelstoke Community Energy Corporation is a wholly owned
subsidiary of the City of Revelstoke and provides district heating to ten buildings in the community,
including the Community and Aquatic Center, City Hall and the Arena.
Wood waste from the local mill, Downie Timber Ltd., is used in a biomass boiler to provide steam for
Downie’s kilns and heat for district heating. Using locally produced renewable fuel reduces the
community’s dependence on non-renewable fossil fuels, primarily propane. The burning of biomass is
considered carbon neutral because the emitted carbon dioxide would have eventually been released in
natural processes when the biomass died and decayed, and is therefore considered to be part of the
natural carbon cycle.5 Emissions related to the burning of propane which is used to manage peak
demand and ensure a reliable heating source needs to be accounted for when determining the
greenhouse gas emissions related to district heating.
District heating was initially studied as a means of diverting wood waste from a beehive burner at
Downie’s saw mill. The resulting district heating system has improved air quality, created increased
energy self-sufficiency, reduced energy costs, created local employment, retained energy revenue in the
community and reduced greenhouse gas emissions.6
1.7 Revelstoke’s Commitment to Climate Change
The City of Revelstoke has showed a commitment to tackling environmental concerns and addressing
climate changes through the following actions:
The City of Revelstoke’s vision statement includes “Revelstoke will be a leader in achieving a
sustainable community by balancing environmental, social and economic values within a local,
regional and global context”.7
5
International Local Government GHG Emissions Analysis Protocol (IEAP), Version 1.0 (October 2009) - ICLEI
6
Revelstoke Community Energy Corporation, A Community Partnership in Energy Innovation,
http://www.cityofrevelstoke.com/pdf/RCEC%20brochure_100110.pdf, assessed on-line December 7, 2010.
7
City of Revelstoke Official Community Plan, July 2009City of Revelstoke Corporate Greenhouse Gas Emission Inventory and Reduction Strategy 17
In June of 2006 the City of Revelstoke joined the Partners for Climate Protection program
(Appendix A) and in the fall of 2008 became a signatory to the Climate Action Charter.
A list of goals and targets relating to solid waste management, air quality, water, and climate
change and energy conservation have been included in the Revelstoke and Area Community
Development Action Plan (2007).
A community wide greenhouse gas reduction target of 6% below 2007 levels by 2020, a
sustainability framework with a list of goals, and a Smart Growth Development Checklist were
adopted into the Official Community Plan in 2010.
A Community Energy and Emission Plan (CEEP) and a District Energy Expansion Pre- Feasibility
Study (DEEP) for Revelstoke Community Energy Corporation (RCEC) are being completed.
The City of Revelstoke has contracted an Environmental Sustainability Coordinator.
1.8 Objectives of the Corporate Greenhouse Gas Emissions Inventory
and Reduction Strategy
The objectives of this report are to:
Provide a better understanding to municipal staff and City Council regarding climate change and
the City’s obligations under the Climate Action Charter and the Partners for Climate Protection
program.
Show leadership by the City of Revelstoke in addressing corporate emissions and actions.
Meet the criteria for Milestones 1, 2 and 3 of the Partners for Climate Protection Plan for
corporate emissions (The Community Energy and Emission Plan (CEEP) is addressing community
emissions).
Develop a greenhouse gas emission inventory that also meets the criteria of the provincial
Climate Action Charter.
Develop a set of actions that will reduce energy consumption, decrease expenditure on energy
and reduce greenhouse gas emissions.
Provide an understanding of the City’s financial obligations to becoming carbon neutral in its
operations by 2012.
Address key environmental priorities identified in the Revelstoke and Area Community
Development Action Plan 2007: greenhouse gas inventory and reduction plan, water
conservation, municipal energy conservation practices, and ‘green’ building bylaws.
Provide guidance on implementing the plan and possible funding opportunities.City of Revelstoke Corporate Greenhouse Gas Emission Inventory and Reduction Strategy 18
2.0 Energy and Greenhouse Gas Emissions
Inventory – Milestone One
2.1 Methodology
An inventory of greenhouse gas emissions has been compiled following the criteria established by the
International Local Government Greenhouse Gas Emission Analysis Protocol (IEAP). This protocol has
been developed by ICLEI Local Governments for Sustainability, and is informed by a number of
documents including ISO 14064 Greenhouse Gases Series of Standards. This protocol requires all
emissions are attributed to the organization that has financial or operational control of the activity,
since they have the ability to make changes that will impact the level of emissions.
Fuel consumption data and activity estimates have been collected for each of the sectors in Table 1 for
municipal operations as detailed by the Partners for Climate Protection outline.8 An additional sector
“Other” has been added which is detailed in section 2.8. Data for 2007, 2008 and 2009 was collected
and entered into a spreadsheet developed by the Carbon Neutral Kootenays Project.
Table 1: Sectors in Municipal Operations
Municipal Operations
Buildings
Vehicle Fleet
Streetlights/Traffic Signals
Water/Wastewater
Solid Waste
Other
2.2 Emission Factors
In the majority of cases, the most significant greenhouse gas emissions in a local government inventory
are carbon dioxide (CO2), Methane (CH4) and Nitrous Oxide (N2O).9 Gases that have been identified as
greenhouse gases have been given a global warming potential compared to that of CO2, resulting in
greenhouse gas inventories being expressed as an overall amount of tonnes of carbon dioxide
8
Developing Inventories for Greenhouse Gas Emissions and Energy Consumption: A Guidance Document for
Partners for Climate Protection in Canada, Federation for Canadian Municipalities (FCM)
9
International Local Government GHG Emissions Analysis Protocol (IEAP) Version 1.0 (October 2009)City of Revelstoke Corporate Greenhouse Gas Emission Inventory and Reduction Strategy 19
equivalent or CO2(e). Emission factors have been calculated to take into account all of the greenhouse
gases generated from a given energy use and given a value in CO2e. The tonnes of CO2e emission can be
calculated for a specific fuel type by multiplying the fuel consumed by its emission factors.
Ex: Fuel consumed x emission factor = GHG emission in C02e
420 L of gasoline x 0.00238 tCO2e/L = 1 tonne CO2e
A direct emission factor calculates the emissions as a result of directly burning a fuel, as in the case of
diesel, gasoline, and propane. An indirect emission factor, as in the case of electricity, represents the
emissions in the production of the electricity. The emission factor for solid waste calculates the landfill
gases of CO2 and methane as a result of the anaerobic decomposition of biomass.
The emission factors used in this inventory are taken from the initial inventory done by the Carbon
Neutral Kootenay Project. The emission factors and sources are detailed in the chart below.
Table 2: Emission Factors for 2007 – 2009. Adopted from the Carbon Neutral Kootenays Energy Consumption Greenhouse
10
Gas Emissions Inventory.
Energy Source GHG emission Units Source notes
Factor
BC Hydro 26 tonnes CO2e/GWh Smart tool for Carbon Neutral BC Hydro 3 year average
Government intensity of BC
Propane 0.00154 tonnes CO2e/L Environment Canada.
0.061 tonnes CO2e/GJ Canada’s GHG Emissions
0.025 GJ/L Inventory.
Natural Gas 0.051 tonnes CO2/GJ Terasen Gas
Gasoline 0.00238 tonnes CO2e/L Environment Canada.
0.036 GJ/L Canada’s GHG Emissions
Inventory
Diesel 0.00279 tonnes CO2e/L Environment Canada
0.038 GJ/L Canada’s GHG Emissions
Inventory
Biodiesel (B5) 0.00265 tonnes CO2e/L Environment Canada Tailpipe emissions only,
0.0377 GJ/L Canada’s GHG Emissions prorated from diesel
Inventory emissions, based on biodiesel
content
Biodiesel (B10) 0.00251 tonnes CO2e/L Environment Canada
0.0377 GJ/L Canada’s GHG
Emissions Inventory
Biodiesel (B20) 0.00223 tonnes CO2e/L Environment Canada
0.0377 GJ/L Canada’s GHG Emissions
Inventory
Solid Waste 0.482 tonnes CO2e/tonne of solid PCP/ICLEI spread sheet tool
waste
10
Carbon Neutral Kootenays, Local Governments and First Nations Reducing Emissions Energy Consumption
Greenhouse Gas Emissions Inventory for Revelstoke, draft report April 2010.City of Revelstoke Corporate Greenhouse Gas Emission Inventory and Reduction Strategy 20
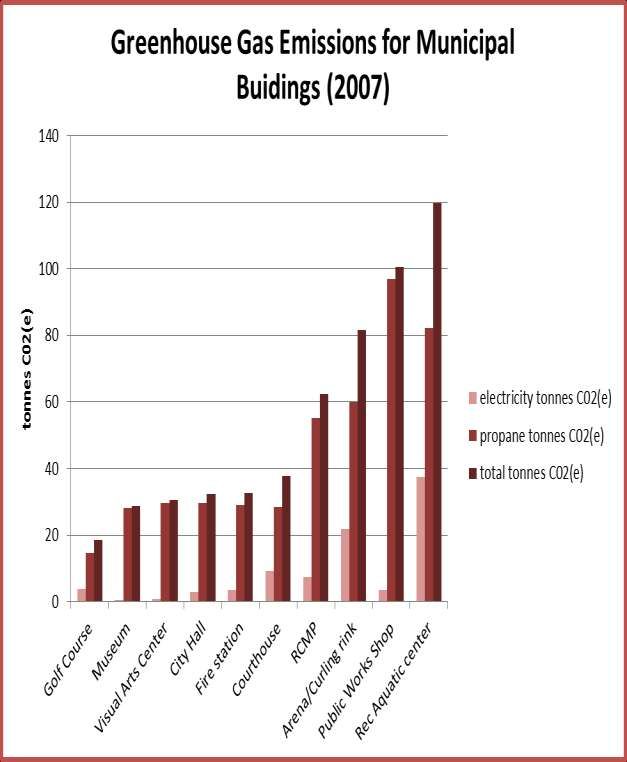
2.3 Municipal Buildings Emissions Inventory
Electricity, district heating and propane consumption, resulting greenhouse gas emissions and costs
were compiled for municipal buildings and buildings owned by the City. Data was collected from an
Account History Record provided by BC Hydro and billing information from Terasen Gas and Revelstoke
Energy Corporation (RCEC).
2.3.1 Electricity
Electricity consumption, greenhouse gas emissions and expenses for electricity used for Municipal
Buildings are detailed in Table 3.
Table 3: Municipal Buildings - Electricity Consumption, Greenhouse Gas Emissions, and Cost
Buildings Electricity (kWh) GHG Emissions Cost
(tonnes CO2e)
2007 2008 2009 2007 2008 2009 2007 2008 2009
City Hall 105,720 120,840 124,440 2.75 3.14 3.23 7,484 8,823 9,563
Public Works 135,353 147,440 131,600 3.52 3.83 3.42 9,470 10,327 9,806
RCMP 281,600 220,160 243,200 7.32 5.72 6.32 17,111 15,273 17,309
Community/ 1,438,040 1,142,440 1,144,000 37.38 29.70 29.74 71,501 62,998 66,989
Aquatic Center
Fire Station 135,840 137,520 156,000 3.53 3.58 4.06 11,777 12,842 14,566
Arena/Curling Rink 834,480 767,880 784,080 21.70 19.96 20.39 45,235 43,713 47,566
Revelstoke Museum 21,778 18,841 24,888 0.57 0.49 0.65 1,557 1,421 1,944
Courthouse 353,600 332,640 303,280 9.19 8.65 7.89 18,031 19,136 18,462
Century Vallen 0 0 1,008 0 0 .03 0 0 92
Golf Course 148,882 166,768 145,296 3.87 4.34 3.78 10,495 12,227 11,700
Visual Arts Center 27,981 30,147 33,544 0.73 0.78 0.87 2,060 2,278 2,642
Forestry Museum 16,197 12,689 11,670 0.42 0.33 0.30 1,171 974 941
Williamson Lake 42,543 47,422 47,094 1.11 1.23 1.22 3,571 4,245 4,228
campground
Townley building 2,051 3,201 1,827 0.05 0.08 0.05 195 285 194
Queen’s Park 2,197 973 519 0.06 0.03 0.01 371 252 212
washrooms
Centennial Park 4,241 4,500 23,640 0.11 0.12 0.61 428 419 1977
washrooms
Grizzly Plaza 11,144 16,204 14,782 0.29 0.42 0.38 829 1198 1161
washrooms
Beruschi Park 13,487 11,475 19,598 0.35 0.30 0.51 984 837 1495
amenity building
Total 3,575,134 3,181,140 3,210,466 93.0 82.7 83.5 $202,270 $197,248 $210,847
kWh kWh kWh tCO2e tCO2e tCO2eCity of Revelstoke Corporate Greenhouse Gas Emission Inventory and Reduction Strategy 21
2.3.2 District Heating
The Community and Aquatic Center, and the Arena use district heating. City Hall was connected at the
end of 2009, and since it only used district heating for two weeks in 2009, it was not included in the
2009 data. Although district heating is predominately fueled by biomass, which is considered carbon
neutral, the facility also utilizes propane to manage peak energy needs. A portion of the propane used
by Revelstoke District Energy Corporation has been partitioned to each of the facilities using district
heating according to their consumption.11 It should be noted that the large increase in propane
consumption seen in 2009 was a result of a fire at RCEC. Historically RCEC utilizes 85% biomass and 15%
propane in its operations.12 Energy consumption, propane petitioning, greenhouse gas emissions and
cost for district heating for municipal building are detailed in Table 4.
The information collected for each of these years is based on actual propane consumption at RCEC in
each year, and a distribution to each facility based on their proportion of total consumption of the
steam produced at the facility. It may be appropriate in future inventory years to establish an emission
factor for RCEC, based on historic propane/biomass consumption using the methodology described in
the Local Government Protocol (2009).
Table 4: Municipal Buildings – District Heating Consumption, Cost and Propane Used.
District heat MWh GJ Cost
2007 2008 2009 2007 2008 2009 2007 2008 2009
Arena 323.5 342.0 322.0 1164.6 1231.2 1159.2 30,004 31,789 31,568
Community/Aquatic 2,131.9 2,281.1 1,937.9 7,674.8 8,211.9 6,976.4 128,936 135,650 128,791
Center
Total 2455.4 2623.1 2259.9 8839.4 9443.1 8135.6 $158,940 $167,439 $160,359
MWh MWh MWh GJ GJ GJ
District heat Propane used at GHG Emissions
RCEC(GJ)
2007 2008 2009 2007 2008 2009
Arena 194.3 326.0 375.8 11.9 19.4 22.9
Community/Aquatic 1,280.3 2,180.0 2,910.0 78.1 129.5 177.5
Center
Total 1,475 2,506 3,285.8 90 152.9 200.4
GJ GJ GJ tCO2e tCO2e tCO2e
11
Information provided by Larry Marchand, RCEC Operations Manager.
12
Information provided by Larry Marchand, RCEC Operations Manager.City of Revelstoke Corporate Greenhouse Gas Emission Inventory and Reduction Strategy 22
2.3.3 Propane
Propane consumed, resulting greenhouse gas emissions and cost are detailed in Table 5. Although the
Community and Aquatic Center and the Arena are connected to district heating, propane is utilized in
the kitchen at the Community Center and large propane overhead heaters are used in the stands at the
Arena. Propane consumption at the Golf Course is used for cooking. At Williamson Lake Campground a
small amount of propane is used for cooking and the remainder is used to provide hot water for
showers. Propane is purchased in bulk at Williamson Lake Campground and, since it is not necessarily
used in the year purchased has been averaged over the three years. The Golf Course, Williamson Lake
Campground and the Visual Arts Center are not directly operated by the City, but are included since they
are City owned.
Propane consumption per year varies depending on winter temperatures. As previously mentioned,
propane consumption and costing data was taken from Terasen gas accounts. In some cases a meter
reading was not taken each month, which was the case between Nov 2008 and Feb 2009. In this case an
average for propane consumption was used for each month. More accurate consumption data could be
calculated by determining average daily temperatures during this time period, but was not done at this
time.
Table 5: Municipal Buildings - Propane Consumption, Greenhouse Gas Emissions, and Cost
Building Propane GHG Emissions Cost
(GJ) (CO2e)
2007 2008 2009 2007 2008 2009 2007 2008 2009
City Hall 483.9 565.6 438.4 29.5 34.5 26.7 8,873 12,592 8,543
Public Works 1,587.8 2,323.6 1,606.6 96.9 141.7 98.0 28,432 48,567 30,214
Buildings
RCMP 903.9 938.9 899.4 55.1 57.3 54.9 16,359 20,471 16,578
Community/Aquatic 68.9 55.8 83.3 4.2 3.4 5.1 1,559 1,539 1,772
Center
Fire Station 476.1 523.4 473.4 29.0 31.9 28.9 8,710 11,320 9,133
Arena/Curling Rink 787.7 836.2 852.9 48.0 51.0 52.0 15,144 19,803 16,508
Revelstoke Museum 463.0 552.8 463.5 28.2 33.7 28.3 8,475 12,021 8,884
Courthouse 465.2 728.4 723.9 28.4 44.4 44.2 8,497 15,975 13,917
Golf Course 237.4 306.9 285.0 14.5 18.7 17.4 4,512 7,552 4,580
Visual Arts Center 486.3 385.4 331.1 29.7 23.5 20.2 8,746 8,672 6,269
Williamson Lake 65.2 65.2 65.2 4.0 4.0 4.0 2,137 2,137 2,137
Campground
Total 6025 7282 6223 367.5 444.1 379.7 $111,444 $160,649 $118,535
GJ GJ GJ tCO2e tCO2e tCO2eCity of Revelstoke Corporate Greenhouse Gas Emission Inventory and Reduction Strategy 23
2.4 Vehicle Fleet Emissions Inventory
The municipal vehicle fleet consists of 76 vehicles. Gasoline and diesel consumption was collected from
records of liters consumed through bulk purchase used at the public works yard and through invoice
records from a local service station. Quantity and cost of propane used at the arena for the zamboni
was calculated from invoice records. Table 4 details gasoline, diesel and propane consumed, resulting
greenhouse gas emissions and cost.
Table 6: Vehicle Fleet – Fuel Consumption, Greenhouse Gas Emissions, and Cost
2007 2008 2009
Liters tCO2e Cost Liters tCO2e Cost Liters t CO2e Cost
Diesel 135,211 377.2 (est.)139,547 113,482 316.6 127,858 145,622 406.3 121,313
Gasoline 47,330 112.6 (est.) 47,826 50,348 119.8 56,587 53,007 126.2 47,543
Propane (est.) 3,020 4.6 2,807 (est.) 2,699 4.2 2,882 (est.) 2,710 4.2 3,050
Total 185,561 494.4 $190,180 166,529 440.6 $187,327 201,339 536.7 $171,906
L tCO2e L tCO2e L tCO2e
2.5 Streetlights/Traffic Signals Emissions Inventory
This sector includes outdoor lighting such as lighting for parking lots, signs and traffic signals. Data from
this sector has been taken from the inventory spreadsheet completed by the Carbon Neutral Kootenay
Project. The information was collected from an Account History Record provided by BC Hydro. The
accounts have been grouped into the following categories: sign lighting, ornamental street lighting,
general street and area lighting, and traffic signals. Electricity consumption, greenhouse gas emissions
and cost for each category are detailed in Table 7.
Table 7: Streetlights/Traffic Signals – Electricity Consumption, Greenhouse Gas Emissions, and Cost
Category Electricity GHG Emissions Cost
(kWh) (CO2e)
2007 2008 2009 2007 2008 2009 2007 2008 2009
Sign lighting 16,300 19,944 20,286 0.42 0.52 0.53 1,444 1,762 1,864
Ornamental 422,167 432,392 431,314 10.98 11.24 11.21 26,083 27,787 29,178
Street lighting
General 378,712 379,129 363,573 9.85 9.86 9.45 79,599 83,145 86,092
street and
area lighting
Traffic signals 5,261 9,643 8,898 0.14 0.25 0.23 419 717 704
Total 822,440 841,108 824,071 21.4 22.0 21.5 $107,545 $113,411 $117,838
kWh kWh kWh tCO2e tCO2e tCO2eCity of Revelstoke Corporate Greenhouse Gas Emission Inventory and Reduction Strategy 24
2.6 Water/Wastewater Emissions Inventory
Emissions in this sector include all activities related to water treatment and waste water or sewage.
Table 8 details electricity consumption, greenhouse gas emissions and cost related to providing drinking
water. The increase in electricity consumption seen in 2009 is a result of additional water being
provided by the well at the golf course. Table 9 details propane consumption, greenhouse gas emissions
and cost related to heating at the water treatment plant. Table 10 provides data relating to electricity
consumption for wastewater. The increase seen in 2009 is a result of the sewer expansion to Revelstoke
Mountain Resort and upgrades to the sewer treatment plant.
Table 8: Water – Electricity Consumption, Greenhouse Gas Emissions, and Cost
Water Electricity GHG Emissions
Cost
kWh CO2e
Location 2007 2008 2009 2007 2008 2009 2007 2008 2009
Water 10,299 6,421 7,502 0.27 0.17 0.20 764 510 614
Reservoir
Gate house
Arrow 4,448 4,309 3,829 0.12 0.11 0.10 362 364 347
Heights
Water tank
Arrow 48,780 54,180 52,920 1.27 1.41 1.38 3,600 3,947 4,035
heights PRV
Golf Course 34,793 65,827 119,567 0.90 1.71 3.11 3,293 6,538 10,902
Chlorination
building
Greeley 274,320 274,320 286,920 7.13 7.13 7.46 19,303 19,918 22,235
Water
Treatment
Plant
Total 372,640 405,057 470,738 9.7 10.5 12.2 $27,322 $31,277 $38,133
kWh kWh kWh tCO2e tCO2e tCO2e
Table 9: Water – Greeley Water Treatment Plant, Propane Consumption, Greenhouse Gas emissions and Cost
Propane (L) Propane (GJ) GHG Emissions Cost
tCO2e
2007 2008 2009 2007 2008 2009 2007 2008 2009 2007 2008 2009
Greeley 62,339 72,454 57,389 1559 1811 1435 96 112 88 $31,917 $44,044 $37,878
Water L L L GJ GJ GJ tCO2e tCO2e tCO2e
Treatment
PlantCity of Revelstoke Corporate Greenhouse Gas Emission Inventory and Reduction Strategy 25
Table 10: Waste water – Electricity Consumption, Greenhouse Gas Emissions, and Cost
Waste Electricity GHG Emissions Cost
Water kWh tCO2e
Location 2007 2008 2009 2007 2008 2009 2007 2008 2009
3rd St. Lift 13,798 9,306 12,284 0.36 0.24 0.32 1,006 719 980
Station
Oscar St. 14,888 19,923 12,271 0.39 0.52 0.32 1,082 1,497 986
sewer pump
Burke drive 7,275 8,058 7,293 0.19 0.21 0.19 560 632 606
Lift station
Front/Wales 46,101 45,701 46,351 1.20 1.19 1.21 3,237 3,352 3,540
lift station
Downie Lift 133,680 140,040 149,880 3.48 3.64 3.90 10,256 10,907 12,342
station
Edward lift 3,960 4,140 4,140 0.10 0.11 0.11 327 355 369
station
Camozzi Rd 0 0 10,200 0 0 0.27 0 0 826
Lift station
Airport Rd 15,420 0 0 0.40 0 0 1,224
Lift station
Sewer 17,061 26,632 16,380 0.44 0.69 0.43 1,232 1,938 1,273
Treatment
Plant –
Chlorine
building
Sewer 0 252,000 749,280 0 6.55 19.5 0 11,964 37,714
Treatment
Plant – 600V
Sewer 383,200 247,360 0 9.96 6.43 0 20,310 13,899 0
treatment
plant
Total 619,963 753,160 1,023,499 16.1 20.0 26.7 $38,010 $45,263 $59,860
kWh kWh kWh tCO2e tCO2e tCO2eCity of Revelstoke Corporate Greenhouse Gas Emission Inventory and Reduction Strategy 26
2.7 Solid Waste Emissions Inventory
Solid waste generated at all municipal facilities including buildings and parks are included in the
corporate inventory. Solid waste generated by the community is not included, but waste deposited by
the community at public facilities is included. An estimate is used based on the number of bins at
municipal buildings, their size, and frequency of pickups. Consideration has been given for increased
frequency of pick up during seasonal events. Tipping fees from 2010 summer data have been used to
calculate ball park and event waste. Data has also been collected for the waste from underground
garbage cans at Woodenhead Park and the amount is estimated based on tipping fees.
Wood waste collected at the Public Works yard has been excluded, since it is being diverted from the
landfill. It is assumed that bins are full and that 1 cubic yard = 75kg.13 There has been very little change
in the diversion of recycling or organic waste between 2007 and 2010, except for a recycling/bear bin in
front of the community center and small recycling wire baskets on the decorative garbage containers in
the downtown core in 2009. The emissions from waste calculated below are an estimate and are
generally a very small part of a municipal operations emission inventory.14 As a result, the data below is
being used as an estimate for greenhouse gas emissions for 2007, 2008 and 2009. Emissions from solid
waste are a calculation of the carbon dioxide and methane released at the landfill over time as a result
of the anaerobic decomposition of biomass or biological materials.
Table 11: Solid Waste – Greenhouse Gas Emissions
Bin Size and Frequency of Total annual Annual mass (kg) Conversion to tonnes
number of bins pickup/week volume tonnes CO2e
(yard3) (yard3)
Arena 1-6 yard 2 624 46,800 46.8 22.6
Public Works 3- 4 yard 1 624 46,800 46.8 22.6
RCMP 1-3 yard 1 156 11,700 11.7 5.6
Rec. Center 1-3 yard 3 468 35,100 35.1 16.9
Ball Park 1-4 yard 1/week 48 3,600 3.6 1.7
July – Sept.15
Ball Park 1-4yard 1/week 112 8,400 8.4 4.0
April - October
Woodenhead Park Avg 425 kg Every 6 weeks 2,975 3.0 1.4
(May-Nov).16
Total 155,375 155.4 74.8
13
Average weight of municipal waste collected in Revelstoke, conversation with contractor and waste hauler Brett
Renaud.
14
Developing Inventories for Greenhouse Gas Emissions and Energy Consumption: A Guidance Document for
Partners for Climate Protection in Canada, FCM, ICLEI.
15
Based on volume picked up in 2009 and 2010.
16
Based on weight in 2010.You can also read