A triple active galactic nucleus in the NGC 7733-7734
←
→
Page content transcription
If your browser does not render page correctly, please read the page content below
A&A 651, L9 (2021)
https://doi.org/10.1051/0004-6361/202141210                                                                         Astronomy
c ESO 2021                                                                                                           &
                                                                                                                    Astrophysics

                                                         LETTER TO THE EDITOR

                A triple active galactic nucleus in the NGC 7733–7734
                                    merging group
                     Jyoti Yadav1,2 , Mousumi Das1 , Sudhanshu Barway1 , and Francoise Combes3

      1
          Indian Institute of Astrophysics, Koramangala II Block, Bangalore 560034, India
          e-mail: jyoti@iiap.res.in
      2
          Pondicherry University, R.V. Nagar, Kalapet 605014, Puducherry, India
      3
          Observatoire de Paris, LERMA, College de France, CNRS, PSL University, Sorbonne University, 75014 Paris, France

     Received 29 April 2021 / Accepted 22 June 2021

                                                                  ABSTRACT

     Context. Galaxy interactions and mergers can lead to supermassive black hole (SMBH) binaries, which become active galactic nucleus
     (AGN) pairs when the SMBHs start accreting mass. If there is a third galaxy involved in the interaction, then a triple-AGN system
     can form.
     Aims. Our goal is to investigate the nature of the nuclear emission from the galaxies in the interacting pair NGC 7733–NGC 7734
     using archival VLT/MUSE integral field spectrograph data and study its relation to the stellar mass distribution traced by near-infrared
     (NIR) observations from the South African Astronomical Observatory (SAAO).
     Methods. We conducted NIR observations using the SAAO and identified the morphological properties of bulges in each galaxy. We
     used MUSE data to obtain a set of ionized emission lines from each galaxy and studied the ionization mechanism. We also examined
     the relation of the galaxy pair with any nearby companions with far-ultraviolet observations using the UVIT.
     Results. The emission line analysis from the central regions of NGC 7733 and NGC 7734 shows Seyfert and low ionization nuclear
     emission-line regions type AGN activity. The galaxy pair NGC 7733−34 also shows evidence of a third component, which has Seyfert-
     like emission. Hence, the galaxy pair NGC 7733−34 forms a triple-AGN system. We also detected an extended narrow-line region
     associated with the nucleus of NGC 7733.
     Key words. galaxies: individual: NGC7733 – galaxies: individual: NGC7734 – galaxies: interactions – galaxies: active –
     galaxies: Seyfert – techniques: imaging spectroscopy

1. Introduction                                                           and AGN activity if the galaxies are gas rich (Duc & Renaud
                                                                          2013). Gas can also be pulled out due to tidal interaction and
Galaxy interactions and mergers are the major drivers of galaxy           ram pressure stripping, as seen in the tails of HI gas or star-
evolution in our low redshift universe, leading to the growth of          forming knots in Hα and ultraviolet (UV; Kenney et al. 2004;
supermassive black holes (SMBHs), bulges, and massive galax-              von der Linden et al. 2010; Yadav et al. 2021).
ies (Di Matteo et al. 2005). One of the most favorable envi-                  As galaxies merge, the dynamical friction on the SMBHs
ronments for such activity are galaxy groups where galaxies               in the individual galaxies causes them to move closer together.
are closely interacting, especially those that have significant           If the SMBHs are accreting, they can form AGN pairs
reservoirs of cold gas that can be used to fuel star formation            (Rubinur et al. 2019). Studies show that there is a higher frac-
and active galactic nuclear (AGN) activity (Eastman et al. 2007;          tion of dual AGN in interacting galaxies, which indicates that
Georgakakis et al. 2008; Arnold et al. 2009; Martini et al. 2009;         galaxy interactions can trigger AGN activity (Satyapal et al.
Tzanavaris et al. 2014).                                                  2014; Kocevski et al. 2015; Koss et al. 2018). Several dual AGN
    The tidal forces during galaxy interactions may trigger the           have been detected locally (Koss et al. 2012; Rubinur et al.
formation of bars and spiral arms that produce gravitational              2018; Imanishi et al. 2020) and at higher redshifts (Myers et al.
torques on the stars and gas in the galaxy disks. These, in turn,         2008; Hennawi et al. 2010; Silverman et al. 2020; Silva et al.
drive gas into the nuclear regions, triggering central star for-          2021). However, only a few binary AGN have been detected
mation (Springel et al. 2005; Hopkins & Quataert 2011). The               (Kharb et al. 2017).
gas accretion onto the SMBHs can trigger AGN activity, but                    Galaxy interactions can also lead to triple merger systems,
the details of how the gas reaches the inner-kiloparsec region            and if the SMBHs of the individual galaxies are accreting,
are still not clear. However, processes such as nuclear spirals           a triple-AGN system will form. Although such systems are
and kiloparsec-scale bars likely play an important role (Combes           rare, a few have been discovered (Koss et al. 2012; Pfeifle et al.
2001). Observations suggest that most galaxies are associated             2019). It is important to detect more multiple AGN in order
with groups or have some companions (McGee et al. 2009).                  to understand how AGN activity can affect the merging pro-
The galaxy interactions within the group can strongly affect              cesses on kiloparsec scales. In this Letter we present the detec-
the galaxy morphologies, and they can trigger star formation              tion of a kiloparsec-scale triple-AGN system in the nearby

                                                       Article published by EDP Sciences                                           L9, page 1 of 6
A&A 651, L9 (2021)
Table 1. Details of the galaxies. exposure times of 30 s each, giving a total exposure time of typ-
ically ∼120 min for the combined set of exposures. Data reduc-
Source RA Dec z tion was carried out with a pipeline for the SIRIUS observations,
(hh mm ss) (dd mm ss) including corrections for nonlinearity, dark subtraction, and flat
fielding.
NGC 7733 23:42:32.79 −65:57:27.42 0.03392 ± 0.00003
NGC 7734 23:42:43.20 −65:56:44.19 0.03527 ± 0.00006
NGC 7733N 23:42:32.25 −65:57:09.43 0.03619 ± 0.00012 3.3. MUSE data
2MASS 2342 23:42:49 −65:58:26 We used Multi Unit Spectroscopic Explorer (MUSE) archival
Notes. Columns 2 and 3 are the coordinates of galaxies in J2000.0. data to study the optical emission lines from NGC 7733−34.
Column 4 is the redshift of NGC 7733 and NGC 7734 taken MUSE is an integral field spectrograph (IFU) on the Very Large
from Mathewson & Ford (1996) and de Vaucouleurs et al. (1991), Telescope (VLT) and gives 3D spectroscopic data cubes with
respectively. very high resolution. We used the data from the wide-field mode,
which has a field of view of 10 × 10 . It has a spatial sampling of
0.200 × 0.200 and a spectral resolution of 1750 at 4650 Å to 3750
galaxy pair NGC 7733–NGC 7734 (hereafter NGC 7733−34). at 9300 Å.
The instruments, methods, and results are described below. We ran the Galaxy IFU Spectroscopy Tool (GIST1 ver-
The value of the Hubble constant (H0 ) used in this Letter is sion 3.0.3; Bittner et al. 2019) pipeline to analyze the MUSE
67.8 km s−1 Mpc−1 . data. GIST uses a python implemented version of GANDALF
(Sarzi et al. 2006; Falcón-Barroso et al. 2006; Bittner et al.
2019) for fitting the gas emission lines and the Penalized Pixel-
2. NGC 7733–34 group Fitting (pPXF; Cappellari & Emsellem 2004; Cappellari 2017)
NGC 7733−34 is a group of interacting galaxies at a distance method for stellar continuum fitting. GIST gives stellar kinemat-
of 154 Mpc (Arp & Madore 1987). NGC 7734 is at a distance ics and gas emission line properties based on binned data over
of 48.3 kpc and has a velocity of 406 km s−1 with respect to a given wavelength range and signal-to-noise ratio (S/N). For
NGC 7733 (de Vaucouleurs et al. 1991). NGC 7733 is a barred stellar velocity calculations, the code convolves the linear com-
spiral that shows knots in the arms and hosts a Seyfert 2 nucleus bination of spectral energy templates with line of sight velocity
(Tempel et al. 2016). NGC 7734 is a barred spiral with pecu- distribution and fits that with the spectra from each bin.
liar arms (de Vaucouleurs et al. 1991; Paturel et al. 1989). The We Voronoi binned the data based on Hα (6555−6575 Å)
atomic gas content of the galaxy pair is ≤4.2 × 10⁹ M , and emission. For binning, we used an S/N of 30. We also corrected
the molecular content of NGC 7733 and NGC 7734 is ≤15.4 × the spectra for the Milky Way extinction. We adopted the method
108 M and '1.073 × 10¹⁰ M , respectively (Horellou & Booth used in Comerón et al. (2021) and fitted the continuum using
1997). Jahan-Miri & Khosroshahi (2001) identified the star- a multiplicative eighth-order Legendre polynomial. We used a
forming knots and their ages in the individual galaxies and minimum S/N of 3 to remove noisy data before binning the data.
found that NGC 7733 has a much younger stellar population than We used GIST emission line fluxes for [O iii], [N ii], Hα, and Hβ
NGC 7734. The properties of the galaxies are given in Table 1. for further analysis.
Figure 1 shows the FUV, Hα, and NIR J band images
of the galaxy group. The FUV and J band images reveal an
3. Observations and data analysis extended source (2MASS 23424898−6558257, referred to as
2MASS 2342) southeast of the galaxy NGC 7733. The FUV
3.1. UV data image reveals a bright bridge in the southeastern region con-
necting NGC 7733 to 2MASS 2342. The extended object in
We observed NGC 7733−34 in the far-ultraviolet (FUV) band
the southeastern region of NGC 7733 could be interacting with
using the Ultraviolet Imaging Telescope (UVIT) on board
NGC 7733 and forms part of the NGC 7733−34 group. The pro-
ASTROSAT (Kumar et al. 2012). The UVIT has two tele-
jected spatial separation of 2MASS 2342 from NGC 7733 is
scopes that can simultaneously observe in three bands: FUV
∼87 kpc, assuming that both galaxies are at the same redshift.
(1300−1800 Å), near-ultraviolet (NUV; 2000−3000 Å), and the
visible band. Drift correction was done with the visible channel.
The UVIT has a spatial resolution of around 100 and a field of 4. Nature of the emission from the nuclei in
view of 280 . We reduced the UVIT level 1 data downloaded from
the Indian Space Science Data Centre (ISSDC) using CCDLAB NGC 7733–34
(Postma & Leahy 2017, 2020). To study the mechanism producing the ionized gas, we derived
the Baldwin-Phillips-Terlevich (BPT; Baldwin et al. 1981) plots
3.2. Near-infrared data of the two galaxies. The BPT diagram uses the [O iii]λ5007/Hβ
and the [N ii]λ6563/Hα line ratios to classify the origin of the
We performed deep near-infrared (NIR) imaging of the galaxy emission. Figures 2a and b show the BPT plots of NGC 7733 and
group NGC 7733−34 with the SIRIUS camera (Nagayama et al. NGC 7734, respectively. The nuclear emission from NGC 7733
2003) on the Infrared Survey Facility (IRSF) 1.4 m telescope lies in the Seyfert part of the BPT plot, while NGC 7734 shows
at South African Astronomical Observatory (SAAO) Suther- low ionization nuclear emission-line regions (LINER) emission
land, South Africa. The SIRIUS camera has three 1024 × 1024 from the central region. The BPT diagram of NGC 7733 also
HgCdTe detectors, which give simultaneous imaging in the J, shows the ongoing star formation in the arms and Seyfert-like
H, and K bands, with a field of view of 7.70 × 7.7 0 , and the emission along the minor axis of the bar.
pixel scale is 0.4500 (Nagayama 2012). The images were taken in
automatic dithering mode with ∼2000 steps with individual frame 1
https://abittner.gitlab.io/thegistpipeline/
L9, page 2 of 6J. Yadav et al.: A triple active galactic nucleus in the NGC 7733–7734 merging group
FUV H J Band
-65°56'00"
NGC7734
30"
NGC7733N
57'00"
Dec(J2000)
30"
NGC7733
58'00" 2MASS 2342
20 kpc
30"
23h42m48s 42s 36s 30s 23h42m48s 42s 36s 30s 23h42m48s 42s 36s 30s
RA(J2000) RA(J2000) RA(J2000)
-65°57'00"
05"
10"
15"
23h42m33s 32s 31s 30s 29s 28s 23h42m33s 32s 31s 30s 29s 28s 23h42m33s 32s 31s 30s 29s 28s
Fig. 1. Multiwavelength images of NGC 7733–7734 group. Upper panel: FUV, Hα, and J band images of galaxy group NGC 7733–34. Bottom
panel: zoomed-in version of the red rectangles. The blue box represents the possible merging galaxy 2MASS 2342, and the yellow ellipse shows
the bridge between NGC 7733 and the merger candidate 2MASS 2342.
(a) (b)
1.5 1.5 20
Seyfert 20 Seyfert Seyfert
1.0 1.0
10
0.5 10 0.5 LINER
[arcsec]
[arcsec]
log [OIII] / H
log [OIII] / H
LINER LINER 0
0.0 0 0.0 Comp.
10
0.5 10 0.5 SF
1.0 1.0 20
SF 20 SF low_SNR
1.5 1.5 30
2 1 0 1 20 0 20 2 1 0 1 20 10 0 10 20
log [NII]/ H [arcsec] log [NII]/ H [arcsec]
Fig. 2. [N ii] BPT diagrams of (a) NGC 7733 and (b) NGC 7734. The ∆α and ∆δ are right ascension and declination with respect to the central
position of the source, which is indicated in Table 1. The solid curve in the BPT diagrams is taken from Kauffmann et al. (2003), and the region
below this line shows the ionization due to star-forming regions. The dashed curve is taken from Kewley et al. (2001), and the region above this
line shows the ionization due to AGN. The dashed-dotted line is taken from Schawinski et al. (2007), which divides the LINER and Seyfert AGN.
The bins with an amplitude-to-noise ratio (A/N) of less than 4 in any of the lines are shown in gray.
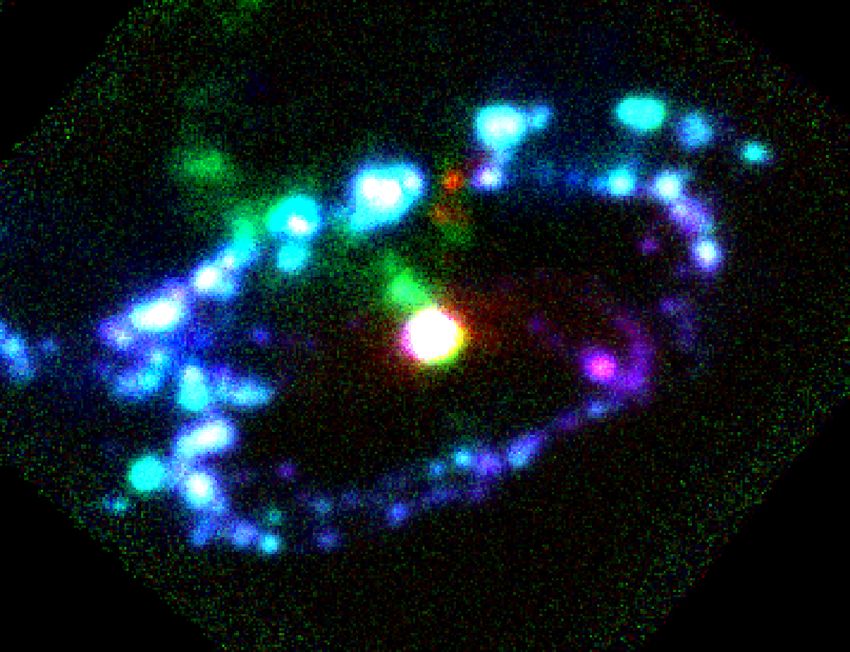
Figure 3 shows the color composite image of Hα (blue), 5. Signatures of a third galaxy
[O iii] (green), and [N ii] (red) emissions, respectively. The
bright Hα emission, in blue along the arms of NGC 7733, con- The FUV, J band, and MUSE Hα images show a large bright
firms the ongoing star formation in the arms of the galaxy. The knot in the northern arm of NGC 7733. This region was identi-
[O iii] emission is extended toward the northeast, which con- fied as a star-forming knot in Jahan-Miri & Khosroshahi (2001).
firms that it is due to emission from the extended narrow-line The knot appears to be extended in the J band, as shown in
region (ENLR) along the minor axis of the galaxy. The ori- the red box in Fig. 1. Figure 4 shows the velocity field of the
entation is due to projection effects. The ENLR is associated galaxy NGC 7733. Most of the velocity field shows features typ-
with photoionized gas around the AGN and can be traced out ical of a rotating disk, with the Doppler-shifted velocities of the
to ∼18 kpc in the northeastern region of NGC 7733. The veloc- approaching (blue) and receding sides (yellow and red). How-
ity field and the trailing spirals suggest that the northeastern ever, the velocity of the knot (shown in the rectangle) is clearly
side is the near side of the galaxy, so the [O iii] emission is different from the velocity field of the disk.
extended toward us. The southeastern ENLR is extended away
from our line of sight and is not visible due to obscuration by the 5.1. Decomposition using GALFIT
dust in the galaxy. Ongoing star formation activity in NGC 7733
(Jahan-Miri & Khosroshahi 2001) suggests the presence of gas We decomposed the NIR images of NGC 7733 and NGC 7734
and dust in this galaxy. into bulge, disk, and bar components using the GALFIT
L9, page 3 of 6A&A 651, L9 (2021)
16000
H [100 km/s]
H [667 km/s]
NII[690 km/s]
NII[89 km/s]
NII[97 km/s]
14000
OIII[138 km/s]
OIII[656 km/s]
ergs/s/cm2/Å)
-65°57'30" 12000
10000
H [114 km/s]
H [685 km/s]
Dec (ICRS)
8000
45"
6000
20
Flux(10
4000
58'00" 2000
10 kpc 0
23h42m51s 48s 45s 42s 4860 4880 5000 5020 6540 6560 6580 6600
RA (ICRS) Wavelength(Å)
Fig. 3. Color composite image of NGC 7733. Blue, green, and red Fig. 5. Emission line fitting of NGC 7733 and NGC 7733N. The blue
represent the Hα, [O iii], and [N ii] emissions, respectively. The [O iii] and red vertical dashed lines correspond to the spectra of NGC 7733
emission toward the northeastern side shows the ENLR. and NGC 7733N, respectively. Observed and fitted spectra are shown
in red and black. The continuum is shown with dotted green horizontal
VStellar [km s 1] lines. The vertical dashed lines show the peaks of emission lines along
200 100 0 100 200 with their respective velocities.
20
1.2
NII BPT Diagram
15
1.0 Seyfert
10 0.8
0.6
log (OIII / H )
5
[arcsec]
0 0.4
LINER
5
0.2 SF
0.0
10
0.2
NGC7733
15 0.4 NGC7733N
20 1.5 1.0 0.5 0.0 0.5
30 20 10 0
[arcsec]
10 20 log (NII/ H )
Fig. 6. BPT diagram for NGC 7733 and its companion NGC 7733N.
Fig. 4. Stellar velocity map of NGC 7733 obtained from GIST. The ∆α
Blue crosses and red dots represent the emission from NGC 7733 and
and ∆δ are right ascension and declination with respect to the central
NGC 7733N, respectively.
position of the source, which is indicated in Table 1. The black rectangle
in the northwest shows that the velocity of NGC 7733N is different from
that of galactic rotation.
is instead a separate system that is visually overlapping with
the arm of the galaxy. We use “NGC 7733N” to refer to the
(Peng et al. 2002) 2D decomposition code. We modeled both knot in the following text. To check the nature of emission from
the bulges and the bars using Sersic profiles, and the disks with NGC 7733N, we used the fluxes of Hβ, [O iii], Hα, and [N ii]
exponential profiles. A χ2 minimization technique was used to emission lines for all bins in the rectangle shown in Fig. 4. We
carry out this fit. We also used the Sersic profile to fit the knot divided the spectrum into three wavelength ranges, 4851−4883,
on the northwest arm of NGC 7733 using GALFIT. We found 4996−5029, and 6532−6608 Å. We fitted Gaussian profiles to
that the effective radius, re , of the Sersic profile in the J band is Hβ, [O iii], Hα, and [N ii] lines and to a constant continuum, as
3.20400 , which corresponds to ∼2.4 kpc. Such a large value for shown in Fig. 5. The emission lines from some of the bins could
the radius of the knot suggests that it is likely to be the bulge of a not be fitted due to poor S/N. The resultant fits confirmed that
galaxy, instead of being a star-forming region within NGC 7733. NGC 7733N has its own set of emission lines. We calculated the
mean velocity of Hα in NGC 7733 and NGC 7733N after fitting
5.2. Emission line analysis of the knot in NGC 7733 the emission lines. We found that NGC 7733N is moving with
a mean velocity of +655 ± 46 km s−1 with respect to NGC 7733
The knot shows a different velocity compared to the northern and is at a redshift of 0.03619 ± 0.00012.
arm of NGC 7733, as indicated by the rectangle in Fig. 4. The The BPT diagram of two sets of emission lines is shown in
MUSE spectra from this region show that there are two sets Fig. 6. The red markers and blue crosses show the emission from
of emission lines, as shown in Fig. 5. The knot appears to be NGC 7733N and NGC 7733, respectively. The emission from the
redshifted by ∼650 km s−1 with respect to the galaxy. This is a NGC 7733 component of this region is due to the star formation,
strong indication that the knot is not a part of the galaxy and which is expected since it originates from the arm. The emission
L9, page 4 of 6J. Yadav et al.: A triple active galactic nucleus in the NGC 7733–7734 merging group
Table 2. Properties of galactic bulges and central black holes.
Galaxy MK Re log(M? ) Black hole mass (108 M )
(mag) (arcsec) M• −LK M• −σ M• −Mbulge
MH2003 KH2013 Gu2009 MM2013 KH2013 MH2003 MM2013 KH2013
+0.89
NGC 7733 −24.09 1.73 11.39 1.83+0.62 +1.14 +0.05
−0.43 4.68−1.03 0.54−0.05 0.64+0.03
−0.03 1.24+0.06
−0.07 1.31−0.31 1.86+0.73
−0.56 3.04+0.91
−0.73
+0.90
NGC 7734 −23.74 1.58 11.81 1.28+0.36 +0.20
−0.26 3.18−0.77 1.13−0.18 1.70+0.18
−0.17 2.63+0.28 +0.60
−0.26 0.90−0.21 1.25+0.57
−0.41 1.98+0.67
−0.52
NGC 7733N −22.11 3.1 9.96 0.23+0.01 +0.24
−0.01 0.51−0.17 0.15+0.10
−0.04 0.19+0.14
−0.09 0.26+0.14
−0.09
Notes. Column 2: K band absolute magnitude of bulges. Column 3: Effective radius of bulges. Column 4: Stellar mass estimated in K band using
M/L = 0.6 (McGaugh & Schombert 2014). Columns 5 and 6: Mass of central black holes using M• and K band luminosity. Columns 7–9: Mass
of central black holes using the M• −σ relation. Columns 10–12: Mass of central black holes using the M• –Mass of bulge relation.
References. MH2003: Marconi & Hunt (2003). KH2013: Kormendy & Ho (2013). Gu2009: Gültekin et al. (2009). MM2013: McConnell & Ma
(2013).
from NGC 7733N lies in the Seyfert region, indicating an AGN 7. Implications for our triple-AGN detection
in this galaxy.
Dual AGN have been detected in many galaxies, but triple AGN
are rare. Our study shows that multiple-AGN systems can be
6. Triple interacting galaxies present in galaxy groups that show ongoing mergers. Since galaxy
groups are fairly common (Tempel et al. 2017), they can be good
6.1. Tidal features in UV and Hα targets for detecting multiple AGN. Another important implica-
Figure 1 shows an arm-like structure above the main arm in tion of our study is the enhanced AGN feedback in such sys-
the northern part of NGC 7733 in the UVIT FUV and MUSE tems, which can heat the intracluster medium in clusters and
Hα images. The arm or tidal tail starts from the western side enrich the circumgalactic medium around galaxies (Fabian 2012;
and merges with the location of NGC 7733N. It is likely to Tumlinson et al. 2017). Although multiple-AGN feedback is rel-
have formed via the tidal interaction between NGC 7733 and atively unexplored, it must play an important role in building
NGC 7733N. There are bright UV and Hα knots in the tidal hot gas reservoirs around galaxies, especially at early epochs
arm, which suggests that there is ongoing massive star for- when galaxy mergers were more frequent (Lackner et al. 2014;
mation triggered by the interaction. NGC 7733N then repre- Man et al. 2016; Mundy et al. 2017). Feedback processes such
sents the bulge of the merging companion galaxy (Fig. 1), as jets or intense quasar outflows from AGN can affect the
which may have already lost most of its disk mass in the tidal evolution of the host galaxy (Salomé et al. 2016; Harrison et al.
interaction. 2018). Enhanced multiple-AGN feedback effects may lead to
faster SMBH growth (Volonteri et al. 2020). There may be addi-
tional star formation if the AGN outflows interact with one
6.2. Masses of the central black holes in NGC 7733, another. Triple-AGN systems such as the one we have detected in
NGC 7733N, and NGC 7734 NGC 7733−34 are thus ideal laboratories for studying the growth
We estimated the K band magnitude and effective radius of of hot gas, AGN feedback, and SMBH growth in mergers and
the bulges in NGC 7733, NGC 7733N, and NGC 7734 using should be relatively common in gas-rich galaxy groups.
GALFIT and corrected the magnitude for Milky Way extinc-
tion using Schlafly & Finkbeiner (2011). We estimated the stel- 8. Conclusions
lar mass (M? ) of each galaxy using the mass–luminosity relation
(McGaugh & Schombert 2014). Based on the stellar mass Our main conclusions are the following.
ratios, NGC 7733–NGC 7734 is a major merging system and 1. We find that the paired galaxies NGC 7733 and NGC 7734
NGC 7733N–NGC 7733 is a minor merging system. The nuclear host LINER- and Seyfert-type nuclei, respectively.
black hole masses (M• ) were estimated using the following rela- 2. We detected an ENLR from the AGN in NGC 7733 toward
tions: (i) M• –luminosity in the K band (Marconi & Hunt 2003; the northeastern region.
Kormendy & Ho 2013), (ii) the M−σ relation (Gültekin et al. 3. The multiwavelength data show a tidal arm above the north-
2009; McConnell & Ma 2013; Kormendy & Ho 2013), and ern arm of NGC 7733, and the tidal arm connects with the
the (iii) M• –bulge mass relation (Marconi & Hunt 2003; location of a third galaxy, which we call NGC 7733N.
McConnell & Ma 2013; Kormendy & Ho 2013). The SMBH 4. We have confirmed the existence of the third galaxy,
masses for the three AGN and the stellar masses of the galax- NGC 7733N, in the NGC 7733−34 group. It appears to over-
ies are listed in Table 2. The bulge velocity dispersion of lap with the northern arm of NGC 7733. The emission line
NGC 7733N is not reliable, so we could not calculate the analysis of NGC 7733N shows that it hosts a Seyfert nucleus.
black hole mass in NGC 7733N using the M−σ relation. The 5. The UV and NIR images show a fourth galaxy
nuclear black hole masses of NGC 7733 (0.54−4.68 × 10⁸ M ) (2MASS 2342) lying southeast of the galaxy pair, which
and NGC 7734 (0.90−3.18 × 10⁸ M ) have a similar range of could be part of the merging system. We see a potential
values, and their stellar masses are also comparable. NGC 7733N bridge between NGC 7733 and 2MASS 2342 in the UV
hosts the least massive stellar disk and the least massive map. This bridge is composed of hot gas that had been
nuclear black hole (1.53−5.15 × 10⁷ M ) in the triple-AGN pulled out during the interaction phase. However, redshift
system. estimation is necessary to confirm this.
L9, page 5 of 6A&A 651, L9 (2021)
Triple AGN are rare; however, detailed studies could enhance Jahan-Miri, M., & Khosroshahi, H. G. 2001, AJ, 122, 792
their observed frequency in groups, and especially at high red- Kauffmann, G., Heckman, T. M., Tremonti, C., et al. 2003, MNRAS, 346, 1055
shift. Although this study focuses only on one system, the results Kenney, J. D. P., van Gorkom, J. H., & Vollmer, B. 2004, AJ, 127, 3361
Kewley, L. J., Dopita, M. A., Sutherland, R. S., Heisler, C. A., & Trevena, J.
suggest that small merging groups are ideal laboratories for 2001, ApJ, 556, 121
studying multiple-AGN systems. Kharb, P., Lal, D. V., & Merritt, D. 2017, Nat. Astron., 1, 727
Kocevski, D. D., Brightman, M., Koekemoer, A. M., & Nandra, K. 2015, Are
Compton-Thick AGN the Missing Link Between Mergers and Black Hole
Acknowledgements. We thank the anonymous referee for the thoughtful review, Growth?, HST Proposal
which improved the impact and clarity of this work. This publication uses the Kormendy, J., & Ho, L. C. 2013, ARA&A, 51, 511
data from the UVIT, which is part of the AstroSat mission of the Indian Space Koss, M., Mushotzky, R., Treister, E., et al. 2012, ApJ, 746, L22
Research Organisation (ISRO), archived at the Indian Space Science Data Centre Koss, M. J., Blecha, L., Bernhard, P., et al. 2018, Nature, 563, 214
(ISSDC). This research has also used NIR data from IRSF at the South African Kumar, A., Ghosh, S. K., Hutchings, J., et al. 2012, in Space Telescopes
Astronomical Observatory (SAAO). Part of the results are based on observa- and Instrumentation 2012: Ultraviolet to Gamma Ray, eds. T. Takahashi,
tions collected at the European Southern Observatory under ESO programme S. S. Murray, & J. W. A. den Herder, SPIE Conf. Ser., 8443, 84431N
0103.A-0637, run B. This research has made use of the NASA/IPAC Extra- Lackner, C. N., Silverman, J. D., Salvato, M., et al. 2014, AJ, 148, 137
galactic Database (NED) which is operated by the Jet Propulsion Laboratory, Man, A. W. S., Zirm, A. W., & Toft, S. 2016, ApJ, 830, 89
California Institute of Technology, under contract with the National Aeronautics Marconi, A., & Hunt, L. K. 2003, ApJ, 589, L21
and Space Administration. M.D. acknowledges the support of Science and Engi- Martini, P., Sivakoff, G. R., & Mulchaey, J. S. 2009, ApJ, 701, 66
neering Research Board (SERB) MATRICS grant MTR/2020/000266 for this Mathewson, D. S., & Ford, V. L. 1996, ApJS, 107, 97
research. McConnell, N. J., & Ma, C.-P. 2013, ApJ, 764, 184
McGaugh, S. S., & Schombert, J. M. 2014, AJ, 148, 77
McGee, S. L., Balogh, M. L., Bower, R. G., Font, A. S., & McCarthy, I. G. 2009,
References MNRAS, 400, 937
Mundy, C. J., Conselice, C. J., Duncan, K. J., et al. 2017, MNRAS, 470, 3507
Arnold, T. J., Martini, P., Mulchaey, J. S., Berti, A., & Jeltema, T. E. 2009, ApJ, Myers, A. D., Richards, G. T., Brunner, R. J., et al. 2008, ApJ, 678, 635
707, 1691 Nagayama, T. 2012, African Skies, 16, 98
Arp, H. C., & Madore, B. 1987, A Catalogue of Southern Peculiar Galaxies and Nagayama, T., Nagashima, C., Nakajima, Y., et al. 2003, in Instrument Design
Associations (Cambridge: Cambridge University Press) and Performance for Optical/Infrared Ground-based Telescopes, eds. M. Iye,
Baldwin, J. A., Phillips, M. M., & Terlevich, R. 1981, PASP, 93, 5 & A. F. M. Moorwood, SPIE Conf. Ser., 4841, 459
Bittner, A., Falcón-Barroso, J., Nedelchev, B., et al. 2019, A&A, 628, A117 Paturel, G., Fouque, P., Bottinelli, L., & Gouguenheim, L. 1989, A&AS, 80, 299
Cappellari, M. 2017, MNRAS, 466, 798 Peng, C. Y., Ho, L. C., Impey, C. D., & Rix, H.-W. 2002, AJ, 124, 266
Cappellari, M., & Emsellem, E. 2004, PASP, 116, 138 Pfeifle, R. W., Satyapal, S., Manzano-King, C., et al. 2019, ApJ, 883, 167
Combes, F. 2001, in Advanced Lectures on the Starburst-AGN, eds. I. Aretxaga, Postma, J. E., & Leahy, D. 2017, PASP, 129, 115002
D. Kunth, & R. Mújica, 223 Postma, J. E., & Leahy, D. 2020, PASP, 132, 054503
Comerón, S., Knapen, J. H., Ramos Almeida, C., & Watkins, A. E. 2021, A&A, Rubinur, K., Das, M., & Kharb, P. 2018, JApA, 39, 8
645, A130 Rubinur, K., Das, M., & Kharb, P. 2019, MNRAS, 484, 4933
de Vaucouleurs, G., de Vaucouleurs, A., & Corwin, H. G., Jr. 1991, Third Salomé, Q., Salomé, P., Combes, F., & Hamer, S. 2016, A&A, 595, A65
Reference Catalogue of Bright Galaxies Sarzi, M., Falcón-Barroso, J., Davies, R. L., et al. 2006, MNRAS, 366, 1151
Di Matteo, T., Springel, V., & Hernquist, L. 2005, Nature, 433, 604 Satyapal, S., Ellison, S. L., McAlpine, W., et al. 2014, MNRAS, 441, 1297
Duc, P. A., & Renaud, F. 2013, in Tides in Colliding Galaxies, eds. J. Souchay, Schawinski, K., Thomas, D., Sarzi, M., et al. 2007, MNRAS, 382, 1415
S. Mathis, & T. Tokieda, 861, 327 Schlafly, E. F., & Finkbeiner, D. P. 2011, ApJ, 737, 103
Eastman, J., Martini, P., Sivakoff, G., et al. 2007, ApJ, 664, L9 Silva, A., Marchesini, D., Silverman, J. D., et al. 2021, ApJ, 909, 124
Fabian, A. C. 2012, ARA&A, 50, 455 Silverman, J. D., Tang, S., Lee, K.-G., et al. 2020, ApJ, 899, 154
Falcón-Barroso, J., Bacon, R., Bureau, M., et al. 2006, MNRAS, 369, 529 Springel, V., Di Matteo, T., & Hernquist, L. 2005, ApJ, 620, L79
Georgakakis, A., Gerke, B. F., Nandra, K., et al. 2008, MNRAS, 391, 183 Tempel, E., Kipper, R., Tamm, A., et al. 2016, A&A, 588, A14
Gültekin, K., Richstone, D. O., Gebhardt, K., et al. 2009, ApJ, 698, 198 Tempel, E., Tuvikene, T., Kipper, R., & Libeskind, N. I. 2017, A&A, 602, A100
Harrison, C. M., Costa, T., Tadhunter, C. N., et al. 2018, Nat. Astron., 2, 198 Tumlinson, J., Peeples, M. S., & Werk, J. K. 2017, ARA&A, 55, 389
Hennawi, J. F., Myers, A. D., Shen, Y., et al. 2010, ApJ, 719, 1672 Tzanavaris, P., Gallagher, S. C., Hornschemeier, A. E., et al. 2014, ApJS, 212, 9
Hopkins, P. F., & Quataert, E. 2011, MNRAS, 415, 1027 Volonteri, M., Pfister, H., Beckmann, R. S., et al. 2020, MNRAS, 498, 2219
Horellou, C., & Booth, R. 1997, A&AS, 126, 3 von der Linden, A., Wild, V., Kauffmann, G., White, S. D. M., & Weinmann, S.
Imanishi, M., Kawamuro, T., Kikuta, S., Nakano, S., & Saito, Y. 2020, ApJ, 891, 2010, MNRAS, 404, 1231
140 Yadav, J., Das, M., Patra, N. N., et al. 2021, ApJ, 914, 54
L9, page 6 of 6You can also read