$FAKE: Evidence of spam and bot activity in stock microblogs on Twitter
←
→
Page content transcription
If your browser does not render page correctly, please read the page content below
$FAKE: Evidence of spam and bot activity in stock microblogs on Twitter

          Stefano Cresci1 , Fabrizio Lillo2 , Daniele Regoli3 , Serena Tardelli1 , Maurizio Tesconi1
                      1
                          Institute of Informatics and Telematics, IIT-CNR, Italy [name.surname]@iit.cnr.it
                       2
                           Department of Mathematics, University of Bologna, Italy fabrizio.lillo@unibo.it
                                        3
                                          Scuola Normale Superiore, Italy daniele.regoli@sns.it

                            Abstract                                 world consequences would be severe. This study moves in
                                                                     the direction of investigating the presence of spam and bot
  Microblogs are increasingly exploited for predicting prices
                                                                     activity in stock microblogs, thus paving the way for the de-
  and traded volumes of stocks in financial markets. However, it
  has been demonstrated that much of the content shared in mi-       velopment of intelligent financial-spam filtering techniques.
  croblogging platforms is created and publicized by bots and        Specifically, we first collect a rich dataset comprising 9M
  spammers. Yet, the presence (or lack thereof) and the impact       tweets posted between May and September 2017, discussing
  of fake stock microblogs has never systematically been inves-      stocks of the 5 main financial markets in the US. We en-
  tigated before. Here, we study 9M tweets related to stocks of      rich our dataset by collecting financial information from
  the 5 main financial markets in the US. By comparing tweets        Google Finance about the 30,032 companies mentioned in
  with financial data from Google Finance, we highlight im-          our tweets. Cross-checking discussion patterns on Twitter
  portant characteristics of Twitter stock microblogs. More im-      against official data from Google Finance uncovers anoma-
  portantly, we uncover a malicious practice perpetrated by co-      lies in tweets related to some low-value companies. Fur-
  ordinated groups of bots and likely aimed at promoting low-
                                                                     ther investigation of this issue reveals a large-scale specu-
  value stocks by exploiting the popularity of high-value ones.
  Our results call for the adoption of spam and bot detection        lative campaign perpetrated by coordinated groups of bots
  techniques in all studies and applications that exploit user-      and aimed at promoting low-value stocks by exploiting the
  generated content for predicting the stock market.                 popularity of high-value ones.

                                                                                           Related work
                          Introduction
                                                                     Finance and social media Starting from the general as-
The exploitation of user-generated content in microblogs for
                                                                     sumption that user-generated messages about a company’s
the prediction of real-world phenomena, has recently gained
                                                                     future prospects provide a rich and diverse source of infor-
huge momentum. An important application domain for such
                                                                     mation, much effort has been devoted towards the detection
approach is that of finance, and in particular, stock mar-
                                                                     of correlations between metrics extracted from social media
ket prediction. Indeed, a number of works developed algo-
                                                                     posts and stock market prices. In particular, sentiment met-
rithms and tools for extracting valuable information from
                                                                     rics have been widely used as a predictor for stock prices
microblogs and proved capable of predicting prices and
                                                                     and other economic indicators (Gilbert and Karahalios 2010;
traded volumes of stocks in financial markets (Bollen, Mao,
                                                                     Bollen, Mao, and Pepe 2011; Sprenger 2011). Others have
and Zeng 2011). Meanwhile, evidence of spam and auto-
                                                                     instead proposed to exploit the overall volume of tweets
mated (bot) activities in social platforms is being reported
                                                                     about a company (Mao et al. 2012) and the topology of
at a growing rate (Ferrara et al. 2016b). The existence of
                                                                     stock networks (Ruiz et al. 2012) as predictors of financial
fictitious, synthetic content appears to be pervasive since it
                                                                     performance. However, subsequent work (Zheludev, Smith,
has been witnessed both in online discussions about impor-
                                                                     and Aste 2014) evaluated the informativeness of sentiment-
tant societal topics (e.g., politics, terrorism, immigration), as
                                                                     and volume-derived predictors, showing that the sentiment
well as in discussions about seemingly less relevant topics,
                                                                     of tweets contains significantly more information for pre-
such as products on sale on e-commerce platforms, and mo-
                                                                     dicting stock prices than just their volume. The role of in-
bile applications (Cresci et al. 2017a).
                                                                     fluencers in social media has also been identified as a strong
   Thus, on the one hand, user-generated content in mi-
                                                                     contributing factor to the formation of market trends (Caz-
croblogs is being exploited for predicting trends in the stock
                                                                     zoli et al. 2016). Others have instead used weblogs for study-
market. On the other hand, without a thorough investiga-
                                                                     ing the relationships between different companies (Khar-
tion, we run the risk that much of the content we rely on, is
                                                                     ratzadeh and Coates 2012). In detail, co-occurrences of
actually fake and possibly purposely created to mislead al-
                                                                     stock mentions in weblogs have been exploited to create a
gorithms and users alike. Should this risk materialize, real-
                                                                     graph of companies, which was subsequently clustered. Au-
Copyright c 2018, Association for the Advancement of Artificial      thors have verified that companies belonging to the same
Intelligence (www.aaai.org). All rights reserved.                    clusters feature strong correlations in their stock prices. This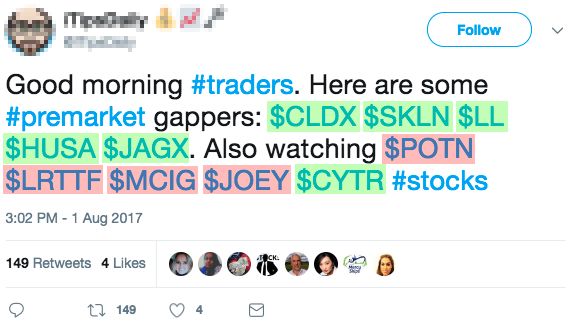
financial data                 twitter data       data about given companies (Hentschel and Alonso 2014).
 markets        companies      median capitalization     users       tweets
                                                                              For this reason, we based our Twitter data collection on an
                                                                              official list of cashtags. Specifically, we first downloaded a
 NASDAQ             3,013               365,780,000    252,587    4,017,158   list of 6,689 stocks traded on the most important US mar-
 NYSE               2,997             1,810,000,000    265,618    4,410,201
                                                                              kets (e.g., NASDAQ, NYSE) from the official NASDAQ Web
 NYSEARCA             726               245,375,000     56,101      298,445
                                                                              site1 . Then, we collected all tweets shared between May and
 NYSEMKT              340                78,705,000     22,614      196,545
 OTCMKTS           22,956                31,480,000     64,628      584,169
                                                                              September 2017, containing at least one cashtag from the
                                                                              list. Data collection from Twitter has been carried out by ex-
                                                                              ploiting Twitter’s Streaming APIs. After our 5 months data
           Table 1: Overall statistics about our dataset.
                                                                              collection, we ended up with ∼9M tweets (of which 22% are
                                                                              retweets), posted by ∼2.5M distinct users, as shown in Ta-
                                                                              ble 1. As a consequence of our data collection strategy, every
methodology can be employed for market prediction and as                      tweet in our dataset contains at least one cashtag from the
a portfolio-selection method, which has been shown to out-                    starting list. However, many collected tweets contain more
perform traditional strategies based on company sectors or                    than one cahstag, many of which are related to companies
historical stock prices. Nowadays, results of studies such as                 not included in our starting list. Overall we collected data
those briefly surveyed in this section are leveraged for the                  about 30,032 companies traded across 5 different markets.
development of automatic trading systems that are largely
fed with social media-derived information (Feldman 2013).                     Financial data collection We enriched our Twitter dataset
As a consequence, such automatic systems can potentially                      by collecting financial information about each of the 30,032
suffer severe problems caused by large quantities of ficti-                   companies found in our tweets. Financial information have
tious posts.                                                                  been collected from public company data hosted on the
                                                                              Google Finance Web site2 . Among collected financial infor-
Spam and bots in social media Many developers of
                                                                              mation, is the market capitalization (market cap) of a com-
spammer accounts make use of bots in order to simulta-
                                                                              pany and its industrial classification. The capitalization is
neously and continuously post a great deal of spam con-
                                                                              the total dollar market value of a company. For a given com-
tent. This is one of the reasons why, despite bots being in
                                                                              pany i, it is computed as the share price P (si ) times the
rather small numbers when compared to legitimate users,
                                                                              number of outstanding shares |si |: Ci = P (si ) × |si |. In
they nonetheless have a profound impact on content popu-
                                                                              our study, we take the market cap of a company into ac-
larity and activity in social media (Gilani, Farahbakhsh, and
                                                                              count, since it allows us to compare the financial value of
Crowcroft 2017). In addition, bots are driven so as to act in a
                                                                              that company with its social media popularity and engage-
coordinated and synchronized way, thus amplifying their ef-
                                                                              ment. In Table 1 we report the median capitalization of the
fects (Ratkiewicz et al. 2011). Another problem with bots is
                                                                              companies for each considered market. As shown, impor-
that they evolve over time, in order to evade established de-
                                                                              tant markets such as NYSE and NASDAQ trade, on average,
tection techniques (Cresci et al. 2017a). Recently, a general-
                                                                              stocks with higher capitalization than those traded in minor
purpose overview of the landscape of automated accounts
                                                                              markets. Industrial classification is expressed via the Thom-
was presented in (Ferrara et al. 2016a). This work testifies
                                                                              son Reuters Business Classification3 (TRBC). TRBC is a 5-
the emergence of a new wave of social bots, capable of mim-
                                                                              level hierarchical sector and industry classification, widely
icking human behavior and interaction patterns in social me-
                                                                              used in the financial domain for computing sector-specific
dia better than ever before. A subsequent study (Cresci et al.
                                                                              indices. In our study, we compare companies belonging to
2017a) compared “traditional” and “evolved” bots in Twit-
                                                                              the same category, across all 5 levels of TRBC.
ter, and demonstrated that the latter are almost completely
undetected by platform administrators, by users themselves,
and even by the majority of state-of-the-art bot detection                                      Analysis of stock microblogs
techniques. The combination of automatic systems feeding                      Dataset overview Surprisingly, the vast majority (76%) of
on social media data and the pervasive presence of spam and                   companies mentioned in our dataset do not belong to the
bots, motivates our investigation on the presence of spam                     NASDAQ list and are traded in OTCMKTS, as shown in Ta-
and bots in stock microblogs.                                                 ble 1. Having so many OTCMKTS companies in our dataset is
                                                                              already an interesting finding, considering that our data col-
                                  Dataset                                     lection grounded on a list of high-capitalization (high-cap)
Our dataset for this study is composed of: (i) stock mi-                      companies. OTCMKTS is a US financial market for over-
croblogs collected from Twitter, and (ii) financial informa-                  the-counter transactions, thus with far less stringent require-
tion collected from Google Finance.                                           ments than those needed from NASDAQ, NYSE, NYSEARCA,
                                                                              and NYSEMKT. For this reason, many small companies opt
Twitter data collection Twitter users follow the conven-                      to be traded in OTCMKTS instead of the more requiring mar-
tion of tagging stock microblogs with so-called cashtags.
The cashtag of a company is composed of a dollar sign fol-                        1
                                                                                      http://www.nasdaq.com/screening/company-list.aspx
lowed by its ticker symbol (e.g., $AAPL is the cashtag of                         2
                                                                                      https://www.google.com/finance
Apple, Inc.). Similarly to hashtags, cashtags can be used as                      3
                                                                                    https://financial.thomsonreuters.com/en/products/data-analytics/market-
an efficient mean to filter content on Twitter and to collect                 data/indices/trbc-indices.html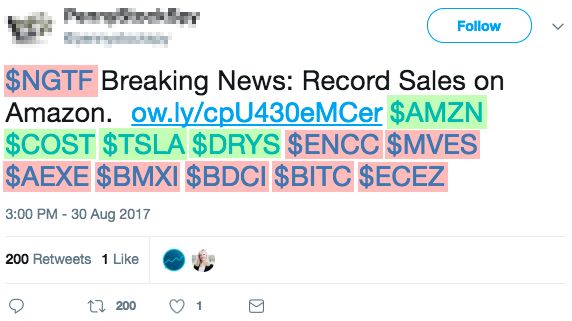
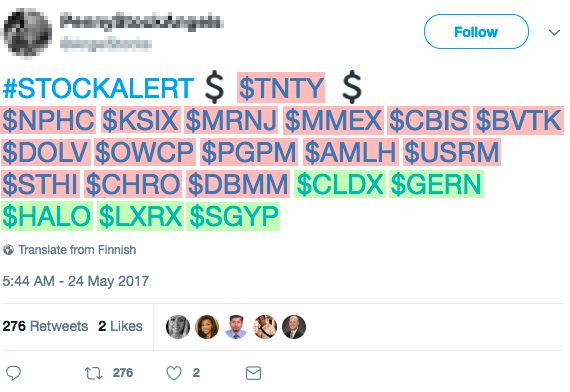
(a) $AAPL (Apple, Inc.).           (b) $FB (Facebook, Inc.).

            Figure 1: Examples of stock time series.                            Figure 2: Examples of suspicious peak tweets.

kets. Thus, from a company viewpoint, our dataset is dom-             ple, Figure 2 shows 4 of such suspicious tweets. In figure,
inated by OTCMKTS. However, OTCMKTS companies play                    in every tweet, a few cashtags of high-capitalization (high-
a marginal role from both a financial and social viewpoint,           cap) stocks co-occur with many cashtags of low-cap stocks.
having low capitalization and small numbers of tweets, the            Furthermore, in order to assess the real-world relatedness of
vast majority of which are retweets. In contrast, companies           stocks, we evaluated the extent to which co-occurring stocks
from NASDAQ and NYSE have high capitalization and are                 belong to the same (or to different) TRBC class(es), for all
mentioned in many tweets, with low percentage of retweets.            the 5 hierarchical levels of TRBC. As a measurement for
                                                                      the difference in TRBC classes across stocks in a tweet, we
Stock time series analysis In order to uncover possi-
                                                                      leveraged the notion of entropy. Results show that the nor-
ble malicious behaviors related to stock microblogs, we
                                                                      malized median entropy ∼ 1 for all 5 TRBC levels, meaning
build and analyze the hourly time series of each of the
                                                                      that co-occurring stocks in peak tweets are almost unrelated.
6,689 stocks downloaded from the NASDAQ Web site.
                                                                      The results of this experiment seem to suggest that, overall,
Given a stock i, its time series is defined as si =
                                                                      co-occurrences of stocks in peak tweets are not motivated by
(si,1 , si,2 , . . . , si,N ), with si,j being the number of tweets
                                                                      the fact that stocks belong to the same industrial or economic
that mentioned the stock i during the hour j. Figure 1 shows
                                                                      sectors.
some examples of our stock time series. As shown in fig-
ure, stock time series are characterized by long time spans              Since real-world relatedness (as expressed by industrial
over which tweet discussion volumes remain rather low, oc-            classification) is not a plausible explanation for co-occurring
casionally interspersed by large discussion spikes. To give           stocks, we now turn our attention to market capitalization.
a better characterization of this phenomenon we ran a sim-            For instance, legitimate peak tweets could mention multi-
ple anomaly detection technique on all the 6,689 time se-             ple stocks with similar capitalization. Conversely, malicious
ries. Our anomaly detection technique is designed so as to            users could try to exploit the popularity of high-cap stocks
detect a peak pi,j in a time series si iff the tweet volume           by mentioning them together with low-cap ones. One way
for the hour j deviates from the mean tweet volume s̄i by             to evaluate the similarity (or dissimilarity) in market capi-
a number K = 10 of standard deviations. Next, we are                  talization of co-occurring stocks is by computing statistical
interested in analyzing the tweets that generated the peaks           measures of spread, such as the standard deviation (std.).
(henceforth, peak tweets: t ∈ t). We find out that, on av-            Thus, for each peak tweet t ∈ t we computed the std. of
erage, 60% of tweets t ∈ t are retweets. In other words,              the capitalization of all companies mentioned in t. Results
the peaks identified by our anomaly detection technique are           highlight a large empiric std. between the capitalization of
largely composed of retweets. In addition, considering that           co-occurring companies. This means that in our peak tweets,
our time series have hourly granularity, those retweets also          high-cap companies co-occur with low-cap ones. Moreover,
occurred within a rather limited time span, in a bursty fash-         the measured std. is larger than that obtained with a random
ion. This finding is particularly interesting also considering        baseline (i.e., a bootstrap). In turn, this means that the large
that in all our dataset, we had only 22% retweets, versus 60%         difference in capitalization can not be explained by the in-
measured for peak tweets.                                             trinsic characteristics of our dataset, but it is rather the con-
                                                                      sequence of an external action.
Co-occurence analysis We also analyzed tweets t ∈ t by
considering the co-occurrences of stocks. From this analy-
sis we see that tweets t ∈ t typically contain many more
                                                                                   Analysis of suspicious users
cashtags than tweets t ∈  / t. Indeed, the mean number of             In previous sections we identified a wide array of suspi-
cashtags per tweet is 6 for t ∈ t, versus 2 for the whole             cious phenomena related to stock microblogs. In this section
dataset. The cashtags that co-occur in peak tweets seem un-           we employ a state-of-the-art bot and spam detection sys-
related, and the authors of those tweets don’t provide further        tem – specifically developed for spotting malicious group
information to explain such co-occurrences. As an exam-               activities – to classify suspicious users (Cresci et al. 2016;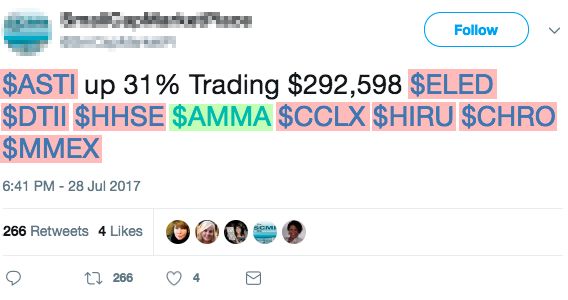
2017b). The goal of this experiment is to assess whether           phenomena. In ICWSM’11. AAAI.
users that shared/retweeted the suspicious peak tweets we          Bollen, J.; Mao, H.; and Zeng, X. 2011. Twitter mood pre-
previously identified, are classified as bots. In turn, this       dicts the stock market. Journal of computational science.
would bring substantial evidence of bot activities in the stock
                                                                   Cazzoli, L.; Sharma, R.; Treccani, M.; and Lillo, F. 2016. A
microblogs that we analyzed.
                                                                   large scale study to understand the relation between Twitter
   Because of the computationally intensive analyses per-
                                                                   and financial market. In ENIC’16. IEEE.
formed by (Cresci et al. 2016; 2017b), we constrained this
experiment to the 100 largest peaks (i.e., those generated         Cresci, S.; Di Pietro, R.; Petrocchi, M.; Spognardi, A.; and
by the greatest number of tweets) of our dataset. Starting         Tesconi, M. 2016. DNA-inspired online behavioral model-
from those top-100 peaks, we then analyzed the 25, 988 dis-        ing and its application to spambot detection. IEEE Intelli-
tinct users that shared or retweeted at least one peak tweet.      gent Systems.
Data needed by the detection system to perform user clas-          Cresci, S.; Di Pietro, R.; Petrocchi, M.; Spognardi, A.; and
sification have been collected by crawling the Twitter time-       Tesconi, M. 2017a. The paradigm-shift of social spambots:
lines of such 25, 988 users. Notably, the bot detection sys-       Evidence, theories, and tools for the arms race. In WWW’17
tem classified as much as 71% (18, 509) of the analyzed            Companion. ACM.
users as bots. A manual analysis of a subset of bots al-           Cresci, S.; Di Pietro, R.; Petrocchi, M.; Spognardi, A.; and
lowed to identify characteristics shared between all the users     Tesconi, M. 2017b. Social fingerprinting: detection of
(e.g., similar name, join date, profile picture, etc.), support-   spambot groups through DNA-inspired behavioral model-
ing the hypothesis that they are part of a larger botnet. Users    ing. IEEE Transactions on Dependable and Secure Com-
classified as bots also feature very high retweet rates (ra-       puting.
tio of retweets over all posted tweets), thus explaining the
                                                                   Feldman, R. 2013. Techniques and applications for senti-
large number of retweets in our peaks and among OTCMKTS
                                                                   ment analysis. Communications of the ACM.
stock microblogs. We obtained these results by analyzing
only the 100 largest detected peaks, therefore analyses of         Ferrara, E.; Varol, O.; Davis, C.; Menczer, F.; and Flammini,
minor peaks might yield different results. Nonetheless, the        A. 2016a. The rise of social bots. Communications of the
overwhelming ratio of bots that we discovered among large          ACM.
peaks discussing popular stocks, raises serious concerns           Ferrara, E.; Varol, O.; Menczer, F.; and Flammini, A.
over the reliability of stock microblogs.                          2016b. Detection of promoted social media campaigns. In
                                                                   ICWSM’16. AAAI.
                       Conclusions                                 Gilani, Z.; Farahbakhsh, R.; and Crowcroft, J. 2017. Do bots
Motivated by the widespread presence of social bots, we            impact Twitter activity? In WWW’17 Companion. ACM.
carried out the first large-scale, systematic analysis on the      Gilbert, E., and Karahalios, K. 2010. Widespread worry and
presence and impact of spam and bot activity in stock mi-          the stock market. In ICWS’10. AAAI.
croblogs. By cross-checking 9M stock microblogs from               Hentschel, M., and Alonso, O. 2014. Follow the money: A
Twitter with financial information from Google Finance,            study of cashtags on Twitter. First Monday.
we uncovered a malicious practice aimed at promoting
low-value stocks by exploiting the popularity of high-value        Kharratzadeh, M., and Coates, M. 2012. Weblog analy-
ones. In detail, many stocks with low market capitaliza-           sis for predicting correlations in stock price evolutions. In
tion, mainly traded in OTCMKTS, are mentioned in mi-               ICWSM’12. AAAI.
croblogs together with a few high capitalization stocks            Mao, Y.; Wei, W.; Wang, B.; and Liu, B. 2012. Correlating
traded in NASDAQ and NYSE. We showed that such co-                 S&P 500 stocks with Twitter data. In KDD’12 Workshops.
occurring stocks are not related by economic and indus-            ACM.
trial sector. Moreover, the large discussion spikes about low-     Ratkiewicz, J.; Conover, M.; Meiss, M. R.; Gonçalves, B.;
value stocks are due to mass, synchronized retweets. Finally,      Flammini, A.; and Menczer, F. 2011. Detecting and tracking
an analysis of retweeting users classified 71% of them as          political abuse in social media. In ICWSM’11. AAAI.
bots. Given the severe consequences that this new form of          Ruiz, E. J.; Hristidis, V.; Castillo, C.; Gionis, A.; and Jaimes,
financial spam could have on unaware investors as well as          A. 2012. Correlating financial time series with micro-
on automatic trading systems, our results call for the prompt      blogging activity. In WSDM’12. ACM.
adoption of spam and bot detection techniques in all appli-
cations and systems that exploit stock microblogs.                 Sprenger, T. O. 2011. TweetTrader.net: Leveraging crowd
                                                                   wisdom in a stock microblogging forum. In ICWSM’11.
Acknowledgments This research is supported in part by              AAAI.
the EU H2020 Program under the schemes INFRAIA-                    Zheludev, I.; Smith, R.; and Aste, T. 2014. When can social
1-2014-2015: Research Infrastructures grant agreement              media lead financial markets? Scientific reports.
#654024 SoBigData: Social Mining & Big Data Ecosystem.

                        References
Bollen, J.; Mao, H.; and Pepe, A. 2011. Modeling public
mood and emotion: Twitter sentiment and socio-economic
You can also read