Determining AGN Black Hole Masses from Two-Dimensional Gas Kinematics
←
→
Page content transcription
If your browser does not render page correctly, please read the page content below
Determining AGN Black Hole Masses
from Two-Dimensional Gas Kinematics

        Erin K. S. Hicks & Matthew A. Malkan
        University of California, Los Angeles

Erin K. S. Hicks – UCLA   email: ehicks@astro.ucla.edu   NNG 2005 Poster (page by page)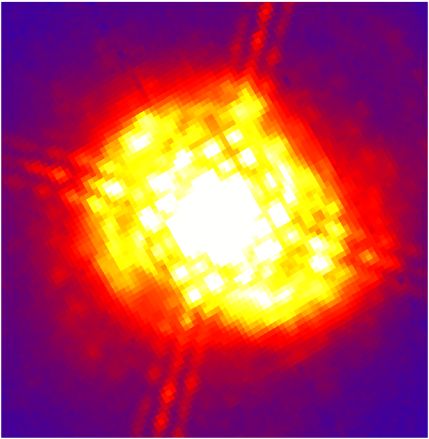
Poster Abstract We have measured two-dimensional nuclear gas kinematics of a sample of nine Seyfert 1 galaxies. The inner arcsecond of each AGN is well sampled with Keck NIRSPEC K-band spectroscopy obtained with adaptive optics and a 4'' slit at a high spatial resolution (0''.0185 pixel-1). The typical point spread function has a full-width- half-maximum of 0''.1, which for our sample corresponds to 21 pc on average, with a range from 3 to 29 pc. The spectra contain many emission lines from molecular hydrogen and Brγ, as well as coronal lines. The gas velocity fields are measured to an accuracy of around 20 km s-1, and for two galaxies, NGC 3227 and NGC 7469, steep gradients of over 150 km s-1 are observed across the central arcsecond. The two-dimensional (2D) flux distributions of the line emitting gases are also mapped, with NGC 3227 showing an offset in molecular hydrogen of 0''.5 SE from the AGN, while Brγ is peaked at the AGN location. The 2D gas kinematics are interpreted using dynamical models; these provide an estimate for the central mass in each AGN, presumably a supermassive black hole. The models assume a co-planar thin disk undergoing circular rotation, and they take into account the point spread function for each spectroscopic exposure (measured simultaneously using the slit viewing camera). Also included in the models are the emission line surface brightness distribution and the stellar gravitational field (estimated from HST NICMOS near-infrared images by separating the stellar light from the point source and assuming a constant stellar mass-to-light ratio). Compared to most non-active spiral galaxies, both NGC 3227 and NGC 7469 appear to have higher stellar surface densities in the inner two arcseconds. Preliminary results indicate NGC 3227 has a black hole of 5 x 10⁶ ≤ MBH ≤ 108 M, while NGC 7469 contains a black hole of 2.5x10⁷ ≤ MBH ≤ 108 M, depending strongly on the stellar mass-to-light ratio. For both objects the steepness of the inner rotation curve can not be fit without a black hole. Erin K. S. Hicks – UCLA NNG 2005 Poster (page by page)
Observations
Spectroscopy of the Seyfert 1 galaxies was obtained at the Keck II telescope using NIRSPEC
(McLean et al. 1998, SPIE, 3354, 566) with adaptive optics (AO). The Seyfert nucleus was utilized
as the guiding source for the AO system. Spectra of 1.9–2.4µm (roughly K-band) were obtained
over 10 half-nights, each with a different slit position angle. See Fig. 1 for placement of the slits
and total on-source exposure time for each object. The AO correction typically resulted in a strehl
of around 0.3 and FWHM of 0''.1. See Fig. 2 for examples of the spectra obtained.
Indispensable to the project is the slit-viewing camera, SCAM, with a 0''.017 pixel scale and a field
of view of 4''.4 x 4''.4. Images are taken approximately every minute throughout spectroscopic
exposures, resulting in a very accurate determination of the PSF and the slit position as well as
any drift of the slit throughout the spectroscopic exposure (typically < 1 pixel during 600 seconds).
Slit Placement
Galaxy NGC 3227 NGC 3516 NGC 4051 NGC 4151
6''
pc/'' 5.1 hr 74 1.8 hr 172 3.9 hr 47 4.1 hr 64
Total Exp.
NGC 4593 NGC 5548 NGC 6814 NGC 7469 Ark 120
175 1.3 hr 334 0.9 hr 101 3.1 hr 318 1.9 hr 613
0.3 hr
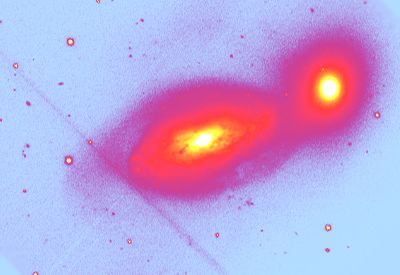
Fig 1. Overlay of slit positions on HST images of each Seyfert 1 galaxy in the sample.
Each thin black line is a single slit position; thicker lines are overlapping slit positions.
Also included are the total exposure time and a 1'' bar and corresponding distance in
parsecs. See upper left for legend. Assumed Ho = 75 km s -1 Mpc-1.
Erin K. S. Hicks – UCLA NNG 2005 Poster (page by page)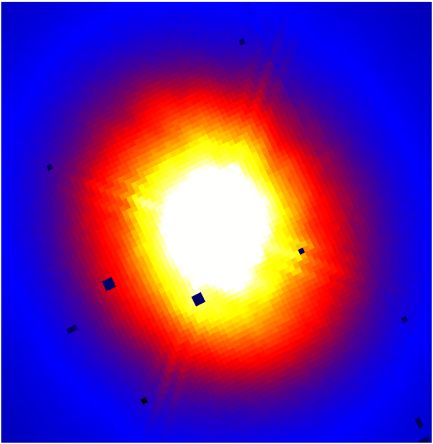
Fig 2. Example nuclear spectra from a 0''.05 x 0''.04 aperture. Several H2 emission
        lines and Brγ are labeled. Also labeled are some stellar absorption features, most
        notably the CO bandheads at 2.3µm.

Erin K. S. Hicks – UCLA                                           NNG 2005 Poster (page by page)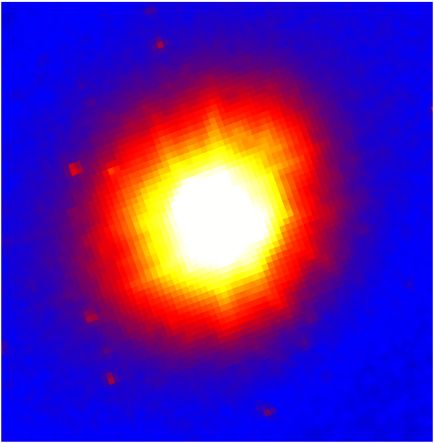
Data Analysis
The 2D kinematics are constructed from up to dozens of slit positions. The velocity of
the gas, as well as the flux of the emission, is determined from a single Gaussian fit to
the emission line profile. 2D maps were created for each object using all emission lines
with at least a 3σ detection; for most objects this included two or more of the following:
H2 1.9576, 2.1218, 2.2235, 2.2477, 2.4066, 2.4237, and Brγ 2.1661µm. Example 2D velocity
and flux distribution maps for NGC 3227 and NGC 7469 are shown in Figures 3 and 4,
respectively.
Data reduction was done using IRAF. Following cosmic ray removal, the spectral
images were rectified using the WMKONSPEC reduction package. Sky subtraction was
done by differencing dithered pairs (2'' nod) of spectral images, and spectra were
extracted and then wavelength calibrated using arc lamp spectra taken immediately
following the spectroscopic exposure.

Erin K. S. Hicks – UCLA                                     NNG 2005 Poster (page by page)
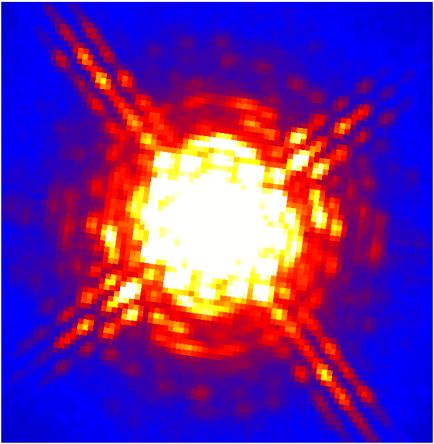
Fig 3a Fig 3b
Fig 3c Fig 3d
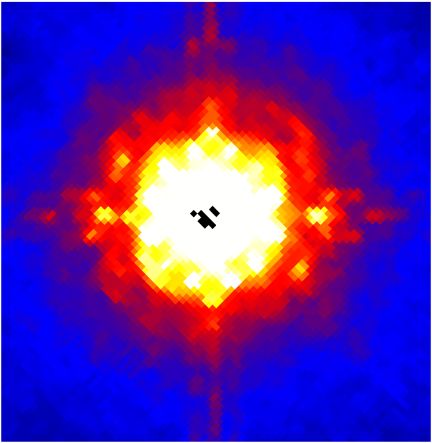
Fig 3. 2D velocity of the central 1''.5 of NGC 3227 for (a) H2 2.1218 and (b) H2 2.4237.
Both lines exhibit organized rotation. Brγ and H2 2.4066 are also consistent with this
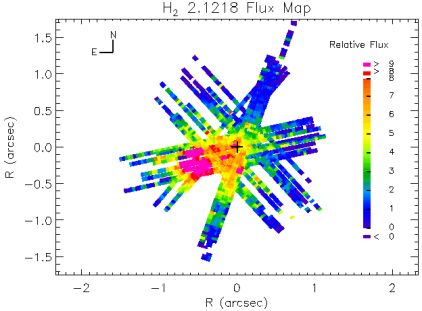
rotation. (c) In NGC 3227 the distribution of Brγ is centrally concentrated while the
peak of H2 is offset from the AGN by 0".5 SE. (d) The 2D flux distribution of the
continuum from 2.14-2.15µm is, as expected, centrally concentrated.
Erin K. S. Hicks – UCLA NNG 2005 Poster (page by page)
Fig 4a

                                                                          Fig 4c

                                    Fig 4b

Fig 4. 2D velocity maps of the central 1''.5 of NGC 7469 for (a) H2 2.1218 and (b) H2
1.9576. The organized rotation of both lines is consistent, as is that of Brγ. (c) The Brγ
and H2 flux distributions are both centrally concentrated.

Erin K. S. Hicks – UCLA                                      NNG 2005 Poster (page by page)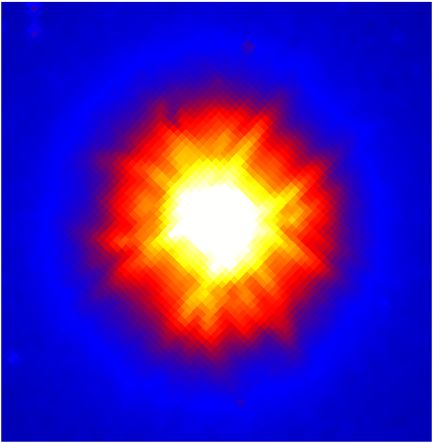
Summary of 2D Velocity Fields
 Object               Emission Lines Measured                            Nuclear Velocity Field

NGC 3227      H2 2.1218, Brγ 2.1661, H2 2.4066, H2 2.4237   Organized Gradient: 150 km s-1 in central arcsec

NGC 3516                       H2 2.1218                            No Velocity Gradient Measured

NGC 4051                 H2 2.1218, Brγ 2.1661              Organized Gradient: 100 km s-1 in central arcsec

NGC 4151                 H2 2.1218, Brγ 2.1661              Organized Gradient: 100 km s-1 in central arcsec

NGC 4593                 H2 2.1218, H2 2.4066                   Emission too Weak to Measure Reliably

NGC 5548                       H2 2.1218                            No Velocity Gradient Measured

NGC 6814       H2 2.1218, H2 2.2014, H2 2.2235, H2 2.2477           No Velocity Gradient Measured

NGC 7469            H2 1.9576, H2 2.1218, H2 2.2235         Organized Gradient: 150 km s-1 in central arcsec

Ark 120                        H2 2.1218                        Emission too Weak to Measure Reliably

    Erin K. S. Hicks – UCLA                                          NNG 2005 Poster (page by page)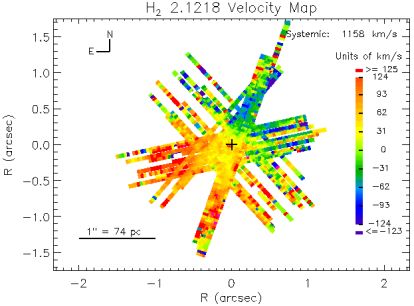
Modeling Dynamical models have been created assuming a co-planar thin gas disk undergoing circular rotation. The gravitational potential is assumed to be created by both the stellar gravitational field, which is determined from the separation of the AGN and stellar light in HST F160W images (see below), and a point source mass, presumably a supermassive black hole. The model velocity field is then synthetically observed using the same parameters used for the actual observations. This includes the point spread function for each spectroscopic exposure and the emission line surface brightness distribution. See the handouts for more details. Free parameters in the model are the black hole mass (MBH), the H-band mass-to-light ratio (M/L), and the disk inclination and position angle of its major axis. Preliminary results indicate that for NGC 3227 a black hole of 5x10⁶ ≤ MBH ≤ 108 M is favored for 0.5 ≤ M/L ≤ 1.0. For NGC 7469, a black hole of 2.5x10⁷ ≤ MBH ≤ 108 M is favored, again dependent on the M/L. For both objects, an unreasonably high M/L (~1.5) must be used to fit the data with no black hole. The mass estimate for NGC 3227 is consistent with that based on reverberation mapping, which gives MBH = 4.2 ± 2.1x10⁷ M, while for NGC 7469 reverberation mapping gives a slightly lower estimate of MBH = 1.2 ± 0.1x10⁷ M. Figures 6 and 7 give more detailed modeling results. Erin K. S. Hicks – UCLA NNG 2005 Poster (page by page)
Stellar Gravitational Field
Separation of the stellar light from the point source
was done by fitting a Sérsic function plus a point
source to HST NICMOS H-band images. The strip
brightness method (Moriondo et al. 1998, AA, 339, 409)
                                                                          Fig. 5a
was used to deproject the fitted stellar distribution. An                 Observ ed Surface Brightness
assumed constant M/L in the range 0.1-1.5 H-band
units (Bell & de Jong 2001, ApJ, 550, 221) was then
used to determine the stellar mass distribution. As a
check on this method, a scaled Tiny Tim PSF was
subtracted from the images to determine the minimum
amount of stellar light that is acceptable. See Fig. 5 for
the fits, deprojections, and resulting velocity fields for
NGC 3227.       Compared to most non-active spiral
galaxies (Scarlata et al. 2004, ApJ, 128, 1124, Seigar et
                                                                          Fig. 5b
al. 2002, AJ, 123, 184), both NGC 3227 and NGC 7469                       Deproj ected 3D Stellar Density
appear to have higher stellar surface densities in the
inner two arcseconds.
                                                                          Fig. 5c
                                                                          Velocity Field
Fig 5. (a) Sérsic (n=3) plus point source fit to the NICMOS
F160W image of NGC 3227.                (b) Stellar density after
deprojection. Each of the Sérsic fits and the remaining stellar
light after PSF subtraction are shown for both the maximum
and minimum allowable star light. The n=2 and n=3 Sérsic fits
are the best fits to the data. (c) The resulting intrinsic velocities
in the plane of the disk assuming a disk inclination of i = 56o
and mass-to-light ratio (H-band) = 0.5.

     Erin K. S. Hicks – UCLA                                            NNG 2005 Poster (page by page)
NGC 3227
Fig 6a
All three H2 lines and Brγ have similar
rotation patterns, with a major axis PA=130o,
in contrast to the PA of 158o seen at greater
radii. The 2D map reveals a velocity field that
is generally in organized circular rotation, but
with many reproducible smaller scale
“wiggles” in the curve indicating that gas
motion is not purely circular in a thin disk.
Mass estimate of 5x10⁶ ≤ MBH ≤ 108 M is
favored for 0.5 ≤ M/L ≤ 1.0.
Fig 6. (a) Delta Chi-Squared of the best fit model and
H2 2.1218 2D velocity field, which has PA=130 o and
i=56o . The best fit MBH ranges from 5x10⁶ to 10 8 M,
depending on the M/L. (b) Data along a single slit
position (angle=100o, offset=0''.09) with Sérsic n=3
stellar models with MBH = 0, 10 7, and 10 8 M.
Fig 6b
Erin K. S. Hicks – UCLA NNG 2005 Poster (page by page)NGC 7469
Fig 7a
Both H2 lines and Brγ have similar rotation
patterns, with a major axis PA=128o,
consistent with that based on the motion of
CO gas in the inner 3'' (Davies, R. I. et al.
2004, ApJ, 602, 148). Rotation curves are
consistent with Davies et al. who measured
H2 with the same instrumental setup at two
position angles (33o and 128o) centered on
the galaxy.
Mass estimate of 2.5x10⁷ ≤ MBH ≤ 108 M is
favored for 0.5 ≤ M/L ≤ 1.0.
Fig 7. (a) Delta Chi-Squared of the best fit model and
H2 2.1218 2D velocity field, which has PA=128o and
i=45o . The best fit MBH ranges from 2.5x10 7 to 108 M,
depending on the M/L. (b) Data along a single slit
position (angle=-30o, offset=0''.09) with Sérsic n=2
stellar models with MBH = 0, 5x10⁷, and 5x10⁸ M.
Fig 7b
Erin K. S. Hicks – UCLA NNG 2005 Poster (page by page)Determining AGN Black Hole Masses from Two-Dimensional Gas Kinematics
Erin K. S. Hicks & Matthew A. Malkan - University of California, Los Angeles
Abstract
We have measured two-dimensional nuclear gas kinematics of a sample of nine Seyfert 1 galaxies. The inner arcsecond of each AGN is well sampled with Keck NIRSPEC K-band spectroscopy obtained with adaptive optics and a 4'' slit at a high spatial resolutio
n (0''.0185 pixel-1). The typical point spread function has a full-width-half-maximum of 0''.1, which for our sample corresponds to 21 pc on average, with a range from 3 to 29 pc. The spectra contain many emission lines from molecular hydrogen and Brγ,
as well as coronal lines. The gas velocity fields are measured to an accuracy of around 20 km s-1, and for two galaxies, NGC 3227 and NGC 7469, steep gradients of over 150 km s-1 are observed across the central arcsecond. The two-dimensional (2D) flux d
istributions of the line emitting gases are also mapped, with NGC 3227 showing an offset in molecular hydrogen of 0''.5 SE from the AGN, while Brγ is peaked at the AGN location. The 2D gas kinematics are interpreted using dynamical models; these provide
an estimate for the central mass in each AGN, presumably a supermassive black hole. The models assume a co-planar thin disk undergoing circular rotation, and they take into account the point spread function for each spectroscopic exposure (measured simul
taneously using the slit viewing camera). Also included in the models are the emission line surface brightness distribution and the stellar gravitational field (estimated from HST NICMOS near-infrared images by separating the stellar light from the point
source and assuming a constant stellar mass-to-light ratio). Compared to most non-active spiral galaxies, both NGC 3227 and NGC 7469 appear to have higher stellar surface densities in the inner two arcseconds. Preliminary results indicate NGC 3227 has a
black hole of 5 x 10⁶ ≤ MBH ≤ 108 M, while NGC 7469 contains a black hole of 2.5x10⁷ ≤ MBH ≤ 108 M , depending strongly on the stellar mass-to-light ratio. For both objects the steepness of the inner rotation curve can not be fit without a black hole.
Observations Data Analysis Modeling
Spectroscopy of the Seyfert 1 galaxies was obtained at the Keck II telescope using NIRSPEC The 2D kinematics are constructed from up to dozens of slit positions. The velocity of the gas, as Dynamical models have been created assuming a co-planar thin gas disk undergoing circular
(McLean et al. 1998, SPIE, 3354, 566) with adaptive optics (AO). The Seyfert nucleus was utilized as well as the flux of the emission, is determined from a single Gaussian fit to the emission line profile. rotation. The gravitational potential is assumed to be created by both the stellar gravitational field,
the guiding source for the AO system. Spectra of 1.9–2.4µm (roughly K-band) were obtained over 10 2D maps were created for each object using all emission lines with at least a 3σ detection; for most which is determined from the separation of the AGN and stellar light in HST F160W images (see
half-nights, each with a different slit position angle. See Fig. 1 for placement of the slits and total on- objects this included two or more of the following: H2 1.9576, 2.1218, 2.2235, 2.2477, 2.4066, 2.4237, below), and a point source mass, presumably a supermassive black hole. The model velocity field is
source exposure time for each object. The AO correction typically resulted in a strehl of around 0.3 and Brγ 2.1661µm. Example 2D velocity and flux distribution maps for NGC 3227 and NGC 7469 are then synthetically observed using the same parameters used for the actual observations. This
and FWHM of 0''.1. See Fig. 2 for examples of the spectra obtained. shown in Figures 3 and 4, respectively. includes the point spread function for each spectroscopic exposure and the emission line surface
brightness distribution. See the handouts for more details. Free parameters in the model are the
Indispensable to the project is the slit-viewing camera, SCAM, with a 0''.017 pixel scale and a field of Data reduction was done using IRAF. Following cosmic ray removal, the spectral images were rectified using
black hole mass (M BH), the H-band mass-to-light ratio (M/L), and the disk inclination and position
view of 4''.4 x 4''.4. Images are taken approximately every minute throughout spectroscopic the WMKONSPEC reduction package. Sky subtraction was done by differencing dithered pairs (2'' nod) of
angle of its major axis.
exposures, resulting in a very accurate determination of the PSF and the slit position as well as any spectral images, and spectra were extracted and then wavelength calibrated using arc lamp spectra taken
drift of the slit throughout the spectroscopic exposure (typically < 1 pixel during 600 seconds). immediately following the spectroscopic exposure. Preliminary results indicate that for NGC 3227 a black hole of 5x10⁶ ≤ M BH ≤ 108 M is favored for 0.5
Summary of 2D Velocity Fields ≤ M/L ≤ 1.0. For NGC 7469, a black hole of 2.5x10⁷ ≤ MBH ≤ 108 M is favored, again dependent on the
Slit Placement
Object Emission Lines Measured Nuclear Velocity Field M/L. For both objects, an unreasonably high M/L (~1.5) must be used to fit the data with no black
Galaxy NGC 3227 NGC 3516 NGC 4051 NGC 4151
hole. The mass estimate for NGC 3227 is consistent with that based on reverberation mapping,
NGC 3227 H2 2.1218, Brγ 2.1661, H 2 2.4066, H2 2.4237 Organized Gradient: 150 km s-1 in central arcsec which gives MBH = 4.2 ± 2.1x10⁷ M , while for NGC 7469 reverberation mapping gives a slightly lower
6''
estimate of MBH = 1.2 ± 0.1x10⁷ M . Figures 6 and 7 give more detailed modeling results.
NGC 3516 H2 2.1218 No Velocity Gradient Measured
NGC 4051 H2 2.1218, Brγ 2.1661 Organized Gradient: 100 km s-1 in central arcsec
Stellar Gravitational Field
Separation of the stellar light from the point source was done by fitting a Sérsic function plus a
Total Exp. pc/'' 5.1 hr 74 1.8 hr 172 3.9 hr 47 4.1 hr 64 NGC 4151 H2 2.1218, Brγ 2.1661 Organized Gradient: 100 km s-1 in central arcsec point source to HST NICMOS H-band images. The strip brightness method (Moriondo et al. 1998, AA,
339, 409) was used to deproject the fitted stellar distribution. An assumed constant M/L in the range
NGC 4593 NGC 5548 NGC 6814 NGC 7469 Ark 120 NGC 4593 H2 2.1218, H2 2.4066 Emission too Weak to Measure Reliably
0.1-1.5 H-band units (Bell & de Jong 2001, ApJ, 550, 221) was then used to determine the stellar mass
NGC 5548 H2 2.1218 No Velocity Gradient Measured distribution. As a check on this method, a scaled Tiny Tim PSF was subtracted from the images to
determine the minimum amount of stellar light that is acceptable. See Fig. 5 for the fits,
NGC 6814 H2 2.1218, H2 2.2014, H2 2.2235, H 2 2.2477 No Velocity Gradient Measured deprojections, and resulting velocity fields for NGC 3227. Compared to most non-active spiral
NGC 7469 H2 1.9576, H2 2.1218, H2 2.2235 Organized Gradient: 150 km s-1 in central arcsec
galaxies (Scarlata et al. 2004, ApJ, 128, 1124, Seigar et al. 2002, AJ, 123, 184), both NGC 3227 and NGC
7469 appear to have higher stellar surface densities in the inner two arcseconds.
0.3 hr 175 1.3 hr 334 0.9 hr 101 3.1 hr 318 1.9 hr 613
Ark 120 H2 2.1218 Emission too Weak to Measure Reliably
NGC 3227 NGC 7469
Fig 1. Overlay of slit positions on HST images of each Seyfert 1
galaxy in the sample. Each thin black line is a single slit
All three H2 lines and Brγ have similar rotation Both H2 lines and Brγ have similar rotation
position; thicker lines are overlapping slit positions. Also patterns, with a major axis PA=130o, in contrast patterns, with a major axis PA=128o , consistent
included are the total exposure time and a 1'' bar and to the PA of 158o seen at greater radii. The 2D with that based on the motion of CO gas in the
corresponding distance in parsecs. See upper left for legend.
Assumed Ho = 75 km s -1 Mpc-1.
map reveals a velocity field that is generally in inner 3'' (Davies, R. I. et al. 2004, ApJ, 602, 148).
organized circular rotation, but with many Rotation curves are consistent with Davies et al.
Fig 2. Example nuclear spectra from a 0''.05 x 0''.04 aperture.
Several H 2 emission lines and Brγ are labeled. Also labeled are reproducible smaller scale “wiggles” in the who measured H 2 with the same instrumental
some stellar absorption features, most notably the CO curve indicating that gas motion is not purely setup at two position angles (33o and 128 o ) Fig. 5a
bandheads at 2.3µm.
circular in a thin disk. centered on the galaxy. Observed Surface Brightness
Fig 3. 2D velocity of the central 1''.5 of NGC 3227 for (a) H2 Fig 4a
2.1218 and (b) H 2 2.4237. Both lines exhibit organized rotation.
Brγ and H2 2.4066 are also consistent with this rotation. (c) In
NGC 3227 the distribution of Brγ is centrally concentrated Fig 7a
Fig 6a
while the peak of H2 is offset from the AGN by 0".5 SE. (d) The
2D flux distribution of the continuum from 2.14-2.15µm is, as
expected, centrally concentrated.
Email for Erin Hicks: ehicks@astro.ucla.edu
Fig. 5b
Deprojected 3D Stellar Density
Fig 4b
Fig. 5c
Velocity Field
Fig 3a Fig 3b
Fig 6b Fig 7b
Fig 4c
Fig 5. (a) Sérsic (n=3) plus point source fit to the NICMOS
F160W image of NGC 3227. (b) Stellar density after
Fig 6. (a) Delta Chi-Squared of the best fit model and H2 2.1218 2D Fig 7. (a) Delta Chi-Squared of the best fit model and H2 2.1218 2D deprojection. Each of the Sérsic fits and the remaining
velocity field, which has PA=130o and i=56o . The best fit MBH velocity field, which has PA=128o and i=45o . The best fit MBH ranges stellar light after PSF subtraction are shown for both the
from 2.5x10 7 to 108 M , depending on the M/L. (b) Data along a single Fig 4. 2D velocity maps of the central 1''.5 of NGC 7469 for
Fig 3c Fig 3d ranges from 5x10⁶ to 108 M, depending on the M/L. (b) Data along maximum and minimum allowable star light. The n=2 and
a single slit position (angle=100o , offset=0''.09) with Sérsic n=3 slit position (angle=-30o , offset=0''.09) with Sérsic n=2 stellar models (a) H2 2.1218 and (b) H2 1.9576. The organized rotation of
n=3 Sérsic fits are the best fits to the data. (c) The
with M BH = 0 and the best fit masses of 5x10 7 to 108 M. both lines is consistent, as is that of Brγ. (c) The Brγ and H2
stellar models with MBH = 0 and the best fit masses of 2.5x10⁷ to 108 resulting intrinsic velocities in the plane of the disk
M . flux distributions are both centrally concentrated.
assuming a disk inclination of i = 56o and mass-to-light
ratio (H-band) = 0.5.You can also read