Tracing satellite planes in the Sculptor group
←
→
Page content transcription
If your browser does not render page correctly, please read the page content below
Astronomy & Astrophysics manuscript no. aanda                                                                                        ©ESO 2021
                                               June 17, 2021

                                                                       Tracing satellite planes in the Sculptor group:
                                                                     I. Discovery of three faint dwarf galaxies around NGC 253
                                                    David Martínez-Delgado1? , Dmitry Makarov2 , Behnam Javanmardi3 , Marcel S. Pawlowski4 , Lidia Makarova2 ,
                                                          Giuseppe Donatiello5 , Dustin Lang6 , Javier Román1,7,8 , Kathy Vivas9 , Julio A. Carballo-Bello10

                                                      1
                                                        Instituto de Astrofísica de Andalucía, CSIC, E-18080 Granada, Spain
                                                      2
                                                        Special Astrophysical Observatory of the Russian Academy of Sciences, Nizhnij Arkhyz, 369167, Russia
                                                      3
                                                         LESIA, Observatoire de Paris, Université PSL, CNRS, Sorbonne Université, Université de Paris, 5 place Jules Janssen, 92195
                                                      Meudon, France
arXiv:2106.08868v1 [astro-ph.GA] 16 Jun 2021

                                                      4
                                                        Leibniz-Institut für Astrophysik Potsdam (AIP), An der Sternwarte 16, D-14482 Potsdam, Germany
                                                      5
                                                        UAI – Unione Astrofili Italiani /P.I. Sezione Nazionale di Ricerca Profondo Cielo, 72024 Oria, Italy
                                                      6
                                                        Perimeter Institute for Theoretical Physics, 31 Caroline St N, Waterloo, Canada
                                                      7
                                                        Instituto de Astrofísica de Canarias, c/ Vía Láctea s/n, E-38205, La Laguna, Tenerife, Spain
                                                      8
                                                        Departamento de Astrofísica, Universidad de La Laguna, E-38206, La Laguna, Tenerife, Spain
                                                      9
                                                        Cerro Tololo Inter-American Observatory, NSF’s NOIRLab, Casilla 603, La Serena, Chile
                                                      10
                                                         Instituto de Alta Investigación, Sede Esmeralda, Universidad de Tarapacá, Av. Luis Emilio Recabarren 2477, Iquique, Chile

                                                      April 2021

                                                                                                                  ABSTRACT

                                                      Context. In the last years, a new generation of large-scale imaging surveys have probed for the first time wide field regions around
                                                      some nearby galaxies at unprecedented low surface brightness regime (∼ 28.0–29.0 mag arcsec−2 ). This offers a chance of discovering
                                                      very faint dwarf satellites by means of systematic visual inspection of these public deep images.
                                                      Aims. In this paper we report the first results of a systematic survey of faint dwarf spheroidal galaxies in the vicinity of the bright
                                                      late-type spiral NGC 253 galaxy by means of a visual inspection of the images taken by the Dark Energy Survey.
                                                      Methods. We performed a new NGC 253 satellite search using coadded image cutouts reprocessed in the DESI Legacy imagen
                                                      surveys. We used galfit software for the photometric and structural properties of three dwarf galaxies.
                                                      Results. Three new dwarf galaxies have been discovered in the vicinity of the brightest member of the Sculptor filament, the late-type
                                                      spiral NGC 253, located at a distance of 3.7 Mpc towards Anti-Virgo. We named them Do II, Do III and Do IV. Assuming they are
                                                      companions of NGC 253, their total absolute V-magnitudes fall in the −7 to −9 mag range, which is typical for dwarf satellites in
                                                      the local Universe.The central surface brightness tend to be extremely low for all the discovered dwarfs and fall roughly in the range
                                                      of 25–26 mag arcsec−2 in g-band. Using known data on distances and velocities of galaxies, we estimate the total virial mass of the
                                                      NGC 253 group to be 8 × 10¹¹ M , which gives the virial radius R200 = 186 kpc and the turn-around radius of 706 kpc. We also discuss
                                                      the possible existence of a spatially flattened and velocity-correlated satellite system around NGC 253. This large-scale structure is
                                                      orientated almost edge-on to line of sight. The possible plane of satellites is only 31 kpc thick with the minor-to-major axis ratio of
                                                      0.14. Four out of five galaxies with measured velocities follow a common velocity trend similar to those observed in the planes of
                                                      satellites around the Andromeda and Centaurus A galaxies. However, the small number of galaxies with known velocities prevents to
                                                      reach a definitive conclusion about the formation scenario of the structure and its possible relation to the surrounding cosmic web.
                                                      Key words. galaxies: individual: NGC253 – galaxies: formation – galaxies:dwarf – surveys

                                               1. Introduction                                                             the Milky Way (Pawlowski & Kroupa 2013) and M 31 (Ibata
                                                                                                                           et al. 2013); Smercina et al. (2018) and Bennet et al. (2019)
                                               Dwarf galaxies are rich laboratories for studying stellar popu-             reported a missing satellites problem in the M 94 and M 101
                                               lations (Tolstoy 2000; Grebel 2005), galaxy formation scenar-               groups; and Javanmardi & Kroupa (2020) found an unexpected
                                               ios, cosmological models, and gravitational theories (Kroupa                correlation between the number of satellites and the bulge-to-
                                               et al. 2018). The observations of dwarf galaxies in the Local               total baryonic mass ratio extending beyond the LG. These find-
                                               Group (LG) has faced the standard Lambda-Cold-Dark-Matter                   ings require further deep surveys of faint dwarf galaxies around
                                               (ΛCDM) cosmological model with a number of challenges (see                  as many massive galaxies in the local volume as possible.
                                               e.g. Bullock & Boylan-Kolchin 2017, for a review). In fact,
                                               some recent observational studies indicate that the challenges to               ΛCDM simulations predict that subhalos around more mas-
                                               ΛCDM appear not to be limited to only the LG. Chiboucas et al.              sive host halos, such as that expected to surround the Milky Way,
                                               (2013) and Müller et al. (2018b) found discs of satellites around           are mostly randomly isotropically distributed and have largely
                                               M 81 and the Centaurus A galaxy similar to those rotating around            uncorrelated relative velocities. While some anisotropy in dis-
                                                                                                                           tribution and some coherence in motion is expected – induced
                                                ?
                                                    Talentia Senior Fellow                                                 by the preferential accretion of subhalos along cosmic filaments
                                                                                                                                                                      Article number, page 1 of 12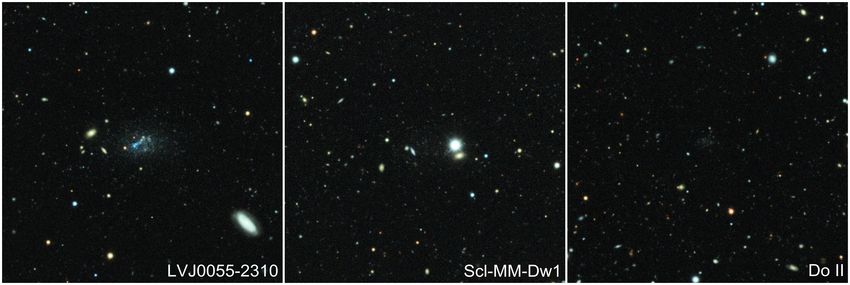
A&A proofs: manuscript no. aanda

and in small groups (Libeskind et al. 2011; Pawlowski et al.             tems. However, modern surveys are now routinely finding dwarf
2012; Shao et al. 2018) – an overall close-to-isotropic distribu-        galaxies within the virial radius of the Milky Way (∼ 300 kpc)
tion of satellite systems is a robust prediction of the underlying       (see the recent review by Simon 2019, and references therein).
model. This is because the positions and motions of satellites           The larger distance of the Andromeda galaxy makes it pro-
on scales of 100’s of kpc are not strongly affected by the in-           hibitive to resolve their stellar halo stars fainter than the red
tricacies of baryonic physics, or the minutiae of how these are          clump/horizontal branch level Dey et al. (e.g., PAndAS pho-
implemented in cosmological simulations. Testing this predic-            tometry: 2019). Thus, the M 31 satellite population can only be
tion for the phase-space distribution of satellite galaxies has re-      traced by observations of the less numerous, bright red-giant
vealed a serious challenge to ΛCDM in the LG: the observed               branch (RGB) stars. This means that the dwarf galaxy hunting in
satellite galaxy systems of the Milky Way (Pawlowski & Kroupa            Andromeda is certainly biased due to the lack of enough stellar
2013) and M 31 (Ibata et al. 2013) display flattened distributions,      tracers for dwarf galaxies with absolute magnitude fainter than
whose kinematics indicate a preference of satellites to co-orbit         about −6 mag, which are barely resolved into stars with ground-
along these structures. Recent proper motion data indicate that          based telescopes. In the last years, new generation large-scale
a substantial fraction of the Milky Way satellites (Fritz et al.         imaging surveys (e.g., the DESI imaging Legacy surveys: Dey
2018; Li et al. 2021), as well as at least two of M 31’s on-plane        et al. 2019) have covered for the first time wide field regions
satellites (Sohn et al. 2020), indeed orbit along these planes of        around nearby galaxies at unprecedented low surface brightness
satellite galaxies. Simulated systems with similar degrees of co-        regime (∼ 28.0–28.5 mag arcsec−2 ). This offers the possibility of
herence are exceedingly rare in cosmological simulations (Ibata          detecting hitherto diffuse dwarf satellites by means of systematic
et al. 2014). For a review, see Pawlowski (2018).                        searches based on visual inspection of these public images (e.g.,
     Some similar satellite alignments have been identified out-         Martinez-Delgado et al. 2021b) or on automatic detection algo-
side the LG. The most prominent to date is a flattened distri-           rithms (e.g., Greco et al. 2018; Tanoglidis et al. 2021; Müller &
bution of satellites, close to an edge-on orientation, identified        Schnider 2021; Prole et al. 2021; Haigh et al. 2021).
around Centaurus A by Tully et al. (2015). To this, Müller et al.            NGC 253 is one of the closest spirals behind M 31 and thus
(2018b) added evidence for line-of-sight velocity kinematics be-         the natural place to dig for LSB dwarf galaxies that could pro-
ing consistent with a rotating satellite plane, a finding recently       vide new insights on the presence satellites planes around nearby
confirmed when additional spectroscopic velocity measurements            galaxies outside the LG. At a distance of ∼ 3.7 Mpc, this galaxy
brought the number of kinematically correlated satellites to 21          in the Sculptor group has been explored for satellite galaxies in
out of 28 (Müller et al. 2021a). Some additional hints at similar        the past (Cote et al. 1997; Karachentseva & Karachentsev 1998;
structures exist around other host galaxies such as M 81 (Chi-           Jerjen et al. 1998; Karachentseva & Karachentsev 2000; Jerjen
boucas et al. 2013), as well as in a statistical analysis of satellite   et al. 2000; Sand et al. 2014; Toloba et al. 2016). In this paper, we
galaxy pairs (Ibata et al. 2014). Nevertheless, the cosmological         present the discovery of three LSB dwarf galaxies near NGC 253
challenge posted by the planes of satellite galaxies rests so far on     by a visual inspection of the DES imaging data. Using an up-
only a small number of studied systems. For a better and statisti-       dated census of low-mass systems around this galaxy, we address
cally more reliable understanding, we need to aim for an as com-         for the first time the issue of the existence of a spatially flattened
plete census of satellites around other nearby hosts as possible.        and velocity-correlated dwarf galaxy system around NGC 253.
Systems in the vicinity of the LG are accessible for follow-up
measurements of photometric distances and line-of-sight veloc-
ities of its members. It allows one to understand their the three-       2. SEARCHING STRATEGY AND DATA ANALYSIS
dimensional structure and kinematics. Assembling a more com-             2.1. Searching strategy
plete picture of nearby satellite galaxy systems is thus funda-
mental to confirm some proposed formation scenarios for the ob-          The dwarf galaxy candidates reported in this paper were found
served alignments from an observational perspective, an urgently         by the amateur astronomer Giuseppe Donatiello by visual in-
needed addition to complement the (so far) mostly simulation-            spection of the Dark Energy Camera (DECam: Flaugher et al.
driven debate.                                                           2015) images of the Scuptor group of galaxies available from
     Ultra-deep imaging in wide sky areas with amateur tele-             the DESI Legacy Imaging Surveys (Dey et al. 2019). A total
scopes (Javanmardi et al. 2016; Romanowsky et al. 2016;                  number of 13 candidates were detected in an total explored area
Karachentsev et al. 2020) can also help to complete the census           of 15 × 10 degrees. For this paper, we focus on only three candi-
of these hitherto unknown low surface brightness (LSB) galax-            dates with clear evidence of being partially resolved into stars in
ies. In the last one and half decades, the discoveries of dwarf          the vecinity of NGC 253, as shown in Fig. 1 (left panel).The typ-
satellites in the LG have been made using stellar density maps of        ical angular resolution of these data (estimated from the seeing
resolved stars, counted in selected areas of the color-magnitude         of the images) is ∼ 0.900 . We name them Donatiello II (Do II),
diagrams (CMDs) from large scale surveys such as the Sloan               Donatiello III (Do III) and Donatiello IV (Do IV), which posi-
Digital Sky Survey (SDSS) (e.g., Willman et al. 2005; Zucker             tion coordinates are given in Table 1. These galaxies have not
et al. 2006), Pan-STARRs (e.g., Laevens et al. 2015), Dark En-           been detected in the automatic search of diffuse stellar systems
ergy Survey (DES) (Dark Energy Survey Collaboration et al.               in the DES data undertaking by Tanoglidis et al. (2021).
2016; Bechtol et al. 2015) and, more recently, the DECam Lo-
cal Volume Exploration Survey (DELVE) (Drlica-Wagner et al.
                                                                         2.2. Image cutout data
2021; Mau et al. 2020), Hyper Suprime-Cam Subaru Strategic
Program (HSC-SSP) (Homma et al. 2019) and the DESI Imag-                 The DESI Legacy Imaging Surveys compile optical data in three
ing Legacy surveys (Martinez-Delgado et al. 2021b).                      optical bands (g, r and z) coupled with all-sky infrared imaging
     In the case of the Milky Way, these diffuse systems are usu-        from the Wide-field Infrared Survey Explorer (WISE) (Wright
ally found as over-densities of old stellar populations in cer-          et al. 2010; Meisner et al. 2019) and obtained by three dif-
tain regions of the sky. Contamination by foreground stars and           ferent imaging projects on three different telescopes: The DE-
background galaxies makes this task challenging for diffuse sys-         Cam Legacy Survey (DECaLS), the Beijing-Arizona Sky Sur-
Article number, page 2 of 12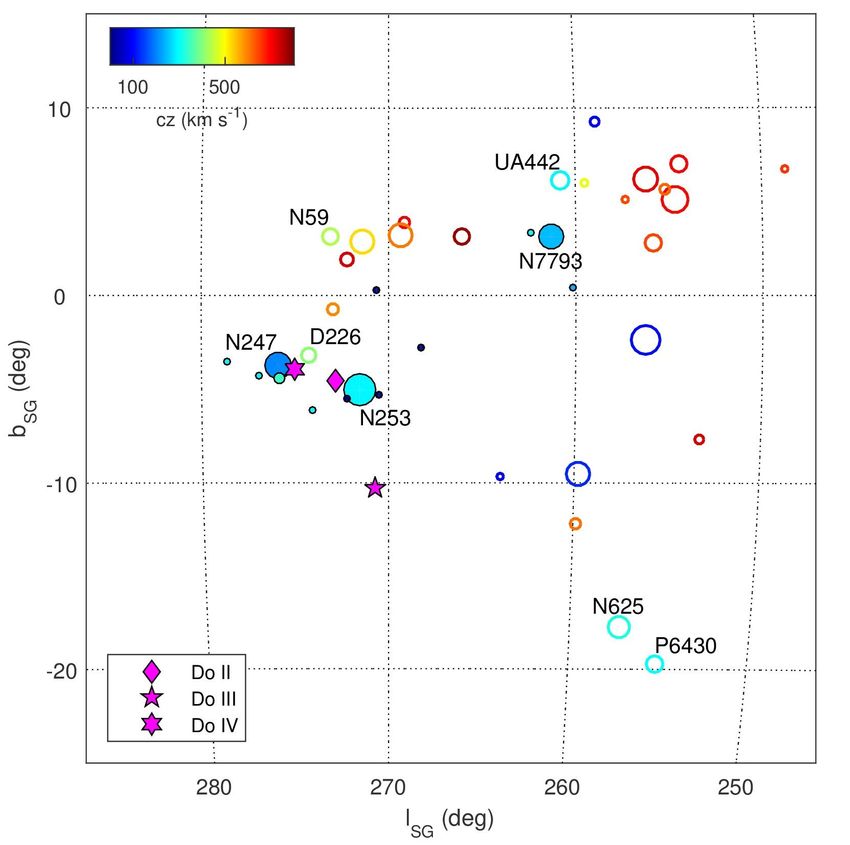
Martínez-Delgado et al.: Discovery of three satellites of NGC 253
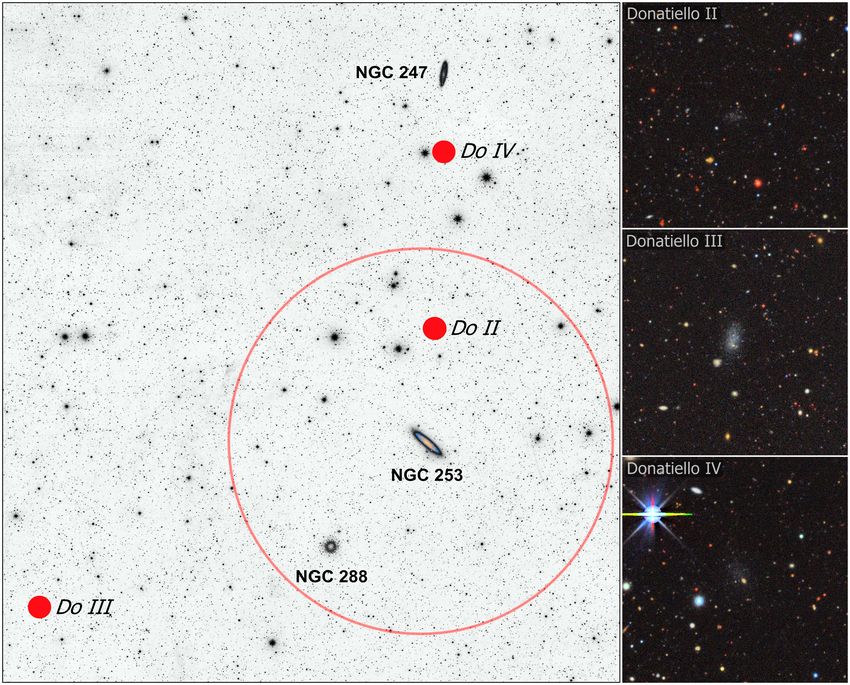
Fig. 1. (Left panel: The position of the three dwarf galaxies (solid red circles) reported in this study with respect to the spiral NGC 253. The red
circular line corresponds to the area explored by the PISCes survey (Toloba et al. 2016) extending up to ∼ 150 kpc from the center of NGC 253.The
total field-of-view of this image is 4500 × 4800 . Left panel: Full color version of the image cutouts obtained with legacypipe for Do II, Do III and
Do IV. North is up and East is left. The field of view of all these image cutouts is 3.30 × 3.30 .
vey (BASS) and the Mayall z-band Legacy Survey (MzLS) (Zou Table 1. The galfit results for the coordinate of the center of the galaxy,
et al. 2019; Dey et al. 2019). The DESI Legacy Imaging Surveys the Sersic index (n), Axis ratio (b/a), Position Angle (PA), and effective
radius (Reff ). The V-band magnitude is estimated adopting the transfor-
data releases also include re-reduced public DECam data from mation equation provided by Jester et al. (2005). The physical parame-
the DES (Abbott et al. 2018). ters are calculated by adopting a distance modulus of 27.84 ± 0.02 mag
(Jacobs et al. 2009) for NGC 253.
Image cutouts centered on each satellite candidate were sub-
Do II Do III Do IV
sequently obtained by coadding images of these systems taken
RA (J2000) 00 47 07.15 01 09 24.55 00 47 02.95
by the DES (Dark Energy Survey Collaboration et al. 2016) us-
Dec (J2000) −23 57 20.9 −27 20 49.6 −21 40 51.6
ing the DECam. These data were reprocessed using the legacyp-
n 0.62 ± 0.12 0.56 ± 0.03 0.85 ± 0.12
ipe software of the DESI Legacy imaging surveys (see, for ex-
b/a 0.61 ± 0.04 0.59 ± 0.01 0.60 ± 0.03
ample, Fig. 2 in Martinez-Delgado et al. 2021a). In short, each
PA (deg) −89.1 ± 5.2 −10.4 ± 1.6 +24.0 ± 3.7
image is astrometrically calibrated to Gaia-DR2 and photometri-
Reff (arcsec) 5.51 ± 0.37 8.46 ± 0.17 10.21 ± 0.65
cally calibrated to the Pan-STARRS PS1 survey, and then resam-
V (mag) 20.85 ± 0.20 18.75 ± 0.09 19.99 ± 0.15
pled to a common pixel grid and summed with inverse-variance
MV (mag) −7.04 ± 0.20 −9.13 ± 0.09 −7.89 ± 0.15
weighting. Fig. 1 (right panel) shows the resulting coadded im-
Reff (pc) 99 ± 7 152 ± 3 183 ± 12
age cutouts of the three dwarf galaxies, which include approxi-
mately 8 exposures in each of g, r, and z-bands. We have calcu-
lated the nominal depths of the images in the NGC 253 region
following the approach by Román et al. (2020), appendix A. The 2.3. Photometry and Structural Properties
calculated surface brightness limits are µ= 29.3, 29.0 and 27.7
mag arcsec−2 for the g, r and z bands respectively measured as We use galfit software (Peng et al. 2002) for determining the
3σ in 10×10 arcsec boxes. photometry and structural properties of dwarf galaxies following
Article number, page 3 of 12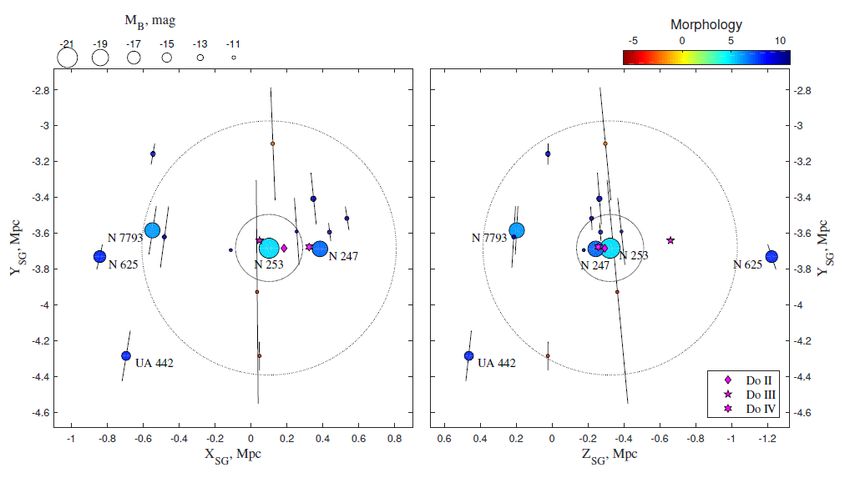
A&A proofs: manuscript no. aanda

a similar approach to that described in Javanmardi et al. (2016).     3.2. The NGC 253 group of galaxies
First, the images of the three g, r, and z-bands are combined to
increase the signal-to-noise and to perform the first galfit mod-     Three new dwarf galaxies have been discovered in the vicinity of
elling. The center of the galaxy, Sersic index, axis ratio, posi-     the bright late-type spiral NGC 253. This galaxy is the brightest
tion angle, and the effective radius are obtained from the com-       member of the Sculptor filament (Jerjen et al. 1998; Karachent-
bined images and the results are listed in Table 1. In the next       sev et al. 2003) located in the Local Supercluster plane almost
step, to stabilize the fitting procedure, these parameters are kept   in the Anti-Virgo direction. The distribution of galaxies over the
fixed to their best values while fitting the individual band im-      sky in the Sculptor filament is shown in the Fig. 5. This region
ages for measuring the magnitude and surface brightness which         has been intensively studied in a number of H i surveys (see
are listed in Table 2. Fig. 2 shows the results of galfit modeling    for instance Bouchard et al. 2005; Westmeier et al. 2017; Ko-
in r-band. The modeling for g and z-bands yields similar visual       ribalski et al. 2018). The systematic searches of dwarf galaxies
results hence are not shown here.                                     (Cote et al. 1997; Karachentseva & Karachentsev 1998; Jerjen
                                                                      et al. 1998; Karachentseva & Karachentsev 2000; Jerjen et al.
    A careful inspection of the residual images (which is the         2000; Sand et al. 2014) have revealed a population of galaxies
result of subtracting the galfit model from the data) shows a         of very low luminosity down to MV ≈ −10 mag. High-precision
number of unresolved sources which could belong to the dwarf          distances using the tip of the red giant branch (TRGB) were mea-
galaxies. Among these unresolved sources, we mark those that          sured in the works by Karachentsev et al. (2003); Cannon et al.
pass the conditions r > 24.0 and 0.4 < g − r < 1.2 by red circles.    (2003); Mouhcine et al. (2005); Davidge (2006); Karachentsev
                                                                      et al. (2006); Mould & Sakai (2008); Jacobs et al. (2009); Dal-
    Using the mTot values and adopting the transformation equa-       canton et al. (2009); Da Costa et al. (2009); Radburn-Smith et al.
tion provided by Jester et al. (2005)1 V = g−0.59×(g−r)−0.01,         (2011); Lianou & Cole (2013); Sand et al. (2014); Toloba et al.
we obtain the V-band magnitudes. These results are also listed        (2016); Karachentsev et al. (2021).
in Table 1. Table 2 shows as the surface brightness of these three        The ‘tidal index’ (Karachentsev & Makarov 1999;
stellar system is lower than 25 mag/arcsec2 ) and thus cannot be      Karachentsev et al. 2013) gives us a good proxy of group
detected in the previous photographic and CCD images from             membership. It characterizes the degree of the tidal impact from
large-scale surveys like the POSS-II or PanSTARRs.                    the main disturber (MD) TI ∝ log(LMD /RMD ) + C, were LMD is a
                                                                      luminosity of the most influential neighbor and RMD is its spatial
                                                                      separation from the galaxy under consideration. The constant C
                                                                      is chosen so that TI = 0 at the ‘zero-velocity surface’ of the main
                                                                      disturber. Thus, TI > 0 indicates that the galaxy is physically
                                                                      bound to its main disturber, while TI < 0 means that the object
3. DISCUSSION                                                         belongs to the field. We summarize information on galaxies in
                                                                      the vicinity of NGC 253 in the Table 3. Morphological type,
3.1. Distances                                                        absolute magnitude, ‘tidal index’ are given according to the
                                                                      current state of the Local Volume database2 (Kaisina et al.
                                                                      2012). Newly found galaxies are marked in bold. The hierarchy
The DESI Legacy surveys images are not deep enough to build           in the group is shown by intent in the galaxy name and the
up a color-magnitude diagram of resolved stellar populations in       galaxies are sorted according to the ‘tidal index’ with respect to
these dwarf galaxies. Thus, it is not possible to determine their     their main disturber. Data sources on velocities and distances
distance from the brightness of the tip of the RGB. Given their       are indicated as footnotes in the table. It is necessary to note that
close angular distance to NGC 253, we assume that the discov-         the velocity of NGC 253, Vh = 261 km s−1 , obtained in the deep
ered galaxies are at the same distance as NGC 253, following          Parkes H i survey (Westmeier et al. 2017) differs significantly
a similar approach to that used in other recent wide-field sur-       from other measurements. For instance, HIPASS Bright Galaxy
veys of dwarf satellite systems in the local volume (Javanmardi       Catalog (Koribalski et al. 2004) gives a systemic velocity
et al. 2016; Carlsten et al. 2020). This is also supported by the     Vh = 243 ± 2 km s−1 . Lucero et al. (2015) measure the velocity
degree of resolution into stars displayed for these new objects       of the kinematical center of the galaxy of Vh = 238 ± 4 km s−1
when it is compared with the images of some confirmed dwarf           using H i radio-interferometric observations with the Karoo
companions of NGC 253 obtained in the same survey (see Fig.           Array Telescope. However, to avoid possible systematic, we
4). In addition, our hypothesis is consistent with the results from   decided to use the value from the deep Parkes H i survey
a standard approach used to establish membership based on the         (Westmeier et al. 2017), because most velocity measurements
comparison of morphological and photometric properties with           around NGC 253 were taken from this survey. Note that the
those from known dwarf galaxies (see for instance Müller et al.       choice of one or another velocity of NGC 253 has practically no
2018a). In Table 1 we list the effective radius (in pc) and abso-     effect on the estimate of the total mass of the group.
lute magnitude, MV (in mag), by assuming a distance modulus               Most galaxies in the Sculptor filament have precise TRGB
of 27.84 ± 0.02 mag (Jacobs et al. 2009) for NGC 253. Fig. 3          distances. It allows us to map the 3D distribution of matter in
shows the distribution of these three dwarf galaxies in the Re        this region. The projections of the spatial distribution of galax-
vs. L, µe vs. Re , and µe vs. MV planes. The known dwarf galax-       ies on the plane of the Local Supercluster and on the perpen-
ies of the Milky Way and Andromeda (McConnachie 2012) are             dicular plane are shown in the Fig. 6. At the moment there are
also shown for comparison. As can be seen, the three candidates       12 confirmed members in the group around NGC 253. Taking
can be characterized by similar properties as those of the LG         into account three new probable members and Sculptor SR for
dwarf galaxies, supporting our assumption that they could be lo-      which there is no velocity or distance measurements the total
cated at a similar distance like that of NGC 253. However, with
the present ground-based data, we cannot completely reject that       1
                                                                        https://www.sdss.org/dr12/algorithms/
some of these new dwarfs may be background galaxies projected         sdssubvritransform
                                                                      2
onto the sky region of the Sculptor group.                              https://www.sao.ru/lv/lvgdb/

Article number, page 4 of 12
Martínez-Delgado et al.: Discovery of three satellites of NGC 253
Table 2. First three rows: The galfit results for the integrated magnitude, mG , the central surface brightness µ0,G and the surface brightness at
effective radius µe,G both in mag arcsec−2 for g, r, and z-bands.
Do II Do III Do IV
g r z g r z g r z
mG 21.01 ± 0.15 20.75 ± 0.15 20.51 ± 0.15 19.13 ± 0.07 18.50 ± 0.05 18.26 ± 0.05 20.37 ± 0.12 19.74 ± 0.10 19.53 ± 0.12
µ0,G 25.66 ± 0.15 25.40 ± 0.15 25.16 ± 0.15 24.76 ± 0.07 24.13 ± 0.05 23.89 ± 0.05 25.97 ± 0.12 25.34 ± 0.10 25.13 ± 0.12
µe,G 26.66 ± 0.15 26.40 ± 0.15 26.16 ± 0.15 25.64 ± 0.07 25.00 ± 0.05 24.77 ± 0.05 27.47 ± 0.12 26.84 ± 0.10 26.64 ± 0.12
Table 3. Galaxies in the vicinity of NGC 253.The columns contain: 1) galaxy name; 2) morphological type; 3) Vh – heliocentric velocity in km s−1
with its error; 4) VLG – radial velocity with respect to the LG centroid (Karachentsev & Makarov 1996); 5) DTRGB – TRGB-distance in Mpc with
a corresponding error; 6) MB – B-band absolute magnitude of the galaxy; 7) TI – ‘tidal index’ indicating the value of the tidal influence from the
main disturber (Karachentsev & Makarov 1999; Karachentsev et al. 2013); 8) ΘN253 – projected separation from NGC 253 in degrees; 9) R⊥ –
projected distance to NGC 253 in kpc; 10) R3D – spatial distance to NGC 253 in kpc.
Name Type Vh VLG DTRGB MB TI ΘN253 R⊥ R3D
km s−1 km s−1 Mpc mag deg kpc
NGC 253 Sc 260.6 ± 5 a 294 3.70 ± 0.03 † −21.15
Do II dSph −6.6 3.2 1.3 86
LV J0055−2310 dIr 249.6 ± 5 a 288 3.62 ± 0.18 ‡ −9.81 2.2 2.7 175 191
Scl–MM–Dw1 dSph 3.94 ± 0.63 [ −9.54 1.8 1.1 71 251
NGC 247 Sd 153.0 ± 5 a 208 3.72 ± 0.03 † −18.56 1.6 4.5 293 294
Do IV dSph −7.1 2.2 3.6 233
ESO540–032 Ir 227.7 ± 0.9 b 285 3.63 ± 0.05 † −11.45 1.4 5.4 349 354
Do III dSph −8.3 1.4 5.3 343
DDO 6 dIr 295.3 ± 5 a 347 3.44 ± 0.15 † −12.45 1.3 4.3 277 373
Sculptor SR dTr −10.26 1.2 4.0 257
KDG 2 dTr 223.5 ± 2.7 b 290 3.56 ± 0.07 † −11.49 1.0 7.2 463 478
Scl–MM–Dw2 dSph 3.12 ± 0.32 ] −11.03 0.7 0.8 53 582
Sc 22 dSph 4.29 ± 0.07 † −10.50 0.5 5.4 350 699
NGC 7793 Sd 223.8 ± 5 a 247 3.63 ± 0.14 † −18.34 0.2 13.1 842 838
PGC704814 Ir 270 ± 89 c 299 3.66 ± 0.18 ‡ −11.61 2.1 12.4 798 795
ESO349–031 dIr 220.3 ± 5 a 229 3.21 ± 0.06 † −11.87 0.2 12.6 802 901
DDO 226 dIr 362.1 ± 5 a 413 4.92 ± 0.29 † −13.63 −0.3 3.2 1243
UGCA 442 Sm 266.7 ± 5 a 299 4.37 ± 0.15 † −14.71 −0.3 15.5 1274
NGC 625 Sm 394.9 ± 5 a 324 4.02 ± 0.07 † −16.50 −0.3 18.9 1307
NGC 59 dEem 367.6 ± 5 a 438 4.90 ± 0.07 † −15.57 −0.4 8.3 1349
PGC 6430 Im 391.7 ± 5 a 306 4.57 ± 0.13 † −15.68 −0.7 21.7 1778
a † [
Westmeier et al. (2017) Jacobs et al. (2009) Sand et al. (2014)
b ‡ ]
Bouchard et al. (2005) Karachentsev et al. (2021) Toloba et al. (2016)
c
Colless et al. (2003)
population consist of 16 galaxies. Only 9 of them have know than the second brightest galaxy NGC 247. It allows us to use
radial velocities, that allows one to estimate the radial velocity the virial theorem and the projected mass estimator in the sim-
dispersion in the NGC 253 group of 43 km s−1 . Most galaxies plest form of the test particles around a massive body (Bahcall &
lie at a projection distance of less than 5.5◦ or about 350 kpc Tremaine 1981). Using the first five satellites of NGC 253 with
from NGC 253. In projection, Do II is the third nearest satel- known velocities (LV J0055−2310 + NGC 247 + ESO 540–032
lite of NGC 253. NGC 247 has high negative peculiar velocity + DDO 6 + KDG 2), we estimate the virial mass of the group to
of −86 km s−1 with respect to NGC 253. In fact, Do IV together be Mvir = 6.4 × 10¹¹ M . The projected mass estimator, assum-
with ESO 540–032 form a subgroup around NGC 247. Do III, ing isotropic orbits distribution he2 i = 21 , gives a similar value
lying at a projected distance of about 340 kpc from NGC 253, is of Mpm = 7.1 × 10¹¹ M . As we noticed before, these values are
one of the peripheral members of the core of the group. Galaxies almost independent of the adopted velocity of NGC 253. In the
NGC 7793 with its companions PGC 704814 and ESO 349–031 case of a heliocentric radial velocity of Vh = 243 ± 2 (Koribal-
are located near the border of the system. Obviously, these galax- ski et al. 2004), the corresponding values are Mvir = 6.2 × 10¹¹
ies are just falling into the group center and, therefore, they can- and Mpm = 6.8 × 10¹¹ M . Taking into account that KDG 2 ly-
not be used for the virial mass estimation. Other galaxies beyond ing at a distance more than 460 kpc is most likely located out-
1 Mpc from NGC 253 participate in a general Hubble expansion, side the virial radius and excluding it from the analysis, for the
which allows Karachentsev et al. (2003) to determine the zero- 4 remaining satellites we obtain Mvir = 7.3 × 10¹¹ and Mpm =
velocity radius of the group to be 0.7 Mpc. 8.8 × 10¹¹ M . So, adopting the total mass of the NGC 253 group
is about 8 × 10¹¹ M , one can estimate the radius of the virialized
Starburst galaxy NGC 253 dominates the group. Its absolute region of R200 = 186 kpc, which corresponds to a sphere whose
magnitude is 2.6 mag less (in other words, 11 times brighter)
Article number, page 5 of 12A&A proofs: manuscript no. aanda
DO II
DO III
DO IV
Fig. 2. From left to right: the dwarf galaxies in r-band, the galfit models, and the residual images after subtracting the model. The image scales
and min max are the same for all the panels. The same procedure is done for modeling the g and z-band images. We mark the position of a few
partially resolved resources in the galaxies that are visible in the residual images with red circles.
density is 200 times greater than the critical one. According to rus A motivates the question: Is there evidence for a similar
an exact analytical solution (Baushev 2019) the corresponding alignment among the satellites of NGC 253?
radius of the zero velocity surface is 706 kpc. This value is in
excellent agreement with the direct measurement of the zero ve- Fig. 7 shows the on-sky distribution of the galaxies listed in
locity radius of 0.7 Mpc by Karachentsev et al. (2003). Table 3, with the galaxies color-coded by their line-of-sight ve-
locity component relative to the NGC 253 velocity. It is apparent
from this figure that most of the known objects in the vicinity of
3.3. A Plane of Satellite Galaxies? NGC 253 align in an extremely narrow structure to the north. Of
the 11 galaxies that potentially are within 600 kpc of NGC 253
The presence of spatially flattened and velocity-correlated satel- (indicated by yellow boxes), only Do III and Sculptor SR are sig-
lite galaxy systems around the Milky Way, M 31, and Centau- nificantly offset from this orientation. Neither of these two have
Article number, page 6 of 12Martínez-Delgado et al.: Discovery of three satellites of NGC 253
Fig. 3. Comparison of the degree of resolution into stars of Do II in the DES images with the data from the same survey for two confirmed satellites
of NGC 253 satellites situated at similar distance (see Table 3): LVJ005−2310 and Scl–MM–Dw1. The field-of-view of these image cutouts are
40 × 40 . North is up and East is left.
measured distances, so they could well be fore- or background Finding a velocity coherence of at least 4 out of 5 happens in
objects outside of the system. 37.5 per cent of all cases. A larger number of galaxies with mea-
This asymmetric distribution of galaxies with respect to the sured velocities will thus be required for a statistically mean-
NGC 253 can not be explained simply by the observational bi- ingful analysis, demonstrating an urgent need for spectroscopic
ases. The group is located near the South Galactic Pole, where follow-up of candidate dwarf galaxies in this region.
the Galactic extinction is insignificant. A simple count of galax- To study the three-dimensional distribution of the known
ies in a 30-degree cone around NGC 253 using the HyperLeda satellites of NGC 253, we employ the common tensor-of-inertia
database (Makarov et al. 2014) shows that the redshift data is (ToI) fitting method (see e.g. Pawlowski et al. 2015). We account
97 per cent complete down to BT = 15.5 and 86 per cent for the uncertainties in the distance measurements by generating
complete down to BT = 16.6 mag. Thus we believe that we 1000 realizations of the observed system, drawing galaxy dis-
know velocities of all possible satellites in the group with MB . tances from normal distributions that are centered on their most-
−12.3 mag. Table 3 confirms this estimate. The only satellites likely value and have a 1σ-width of the errors, as compiled in
without redshift measurements are dSph galaxies fainter than Table 3. We consider all galaxies within 600 kpc, excluding the
MB = −11 mag. The hunt for more faint galaxies of extremely four candidates without measured distances (Do II, III, IV and
low surface brightness without gas is extremely difficult task, Sculptor SR). The results of our plane fits are compiled in Fig. 8.
and our knowledge of the faint end of the galaxy luminosity As expected from the flattened on-sky distribution, we find an
function is highly incomplete below MB ∼ −11 mag. However, extremely narrow spatial alignment: the root-mean-square (rms)
the brighter galaxies also show the similar spatial distribution, height from the best-fit plane is only ∆rms = 31 ± 5 kpc, and
that appears to reflect the real structure of the group. the minor-to-major axis ratio is c/a = 0.14 ± 0.03. These
Of the eleven galaxies possibly within 600 kpc of NGC 253, values are comparable to those of the satellite planes around
eight are in the North and only three are in the South, and the the Milky Way (∆rms = 20 to 30 kpc, c/a ≈ 0.2) and M 31
asymmetry increases to six in the North and only one in the (∆rms < 14.1 kpc, c/a ≈ 0.1). The normal direction to the best-fit
South if the four galaxies without distance measurements are ex- plane is shown in Fig. 9. It points to Supergalactic Coordinates
cluded. The distribution of known galaxies around NGC 253 is (lSG , bSG ) = (12◦ , −73◦ ), and varies by only 4◦ around this direc-
thus strongly lopsided. While the asymmetry appears to be quite tion. The plane has an inclination of i = 85◦ , and is thus seen
extreme in this case, lopsided distributions of galaxies around a very close to edge-on – as is the case for the M 31 and Cen-
host appear to be rather common: they have been found for the taurus A satellite structures. The good alignment with the Su-
distribution of satellite galaxies around M31 (Conn et al. 2013), pergalactic plane could be related to the preference of flattened
in statistical samples of both paired (Libeskind et al. 2016) and satellite galaxy structures in the Local Universe to align with the
isolated galaxies (Brainerd & Samuels 2020), and even in cos- direction of greatest collapse of their surrounding larger-scale
mological simulations (Pawlowski et al. 2017; Wang et al. 2021). structure (Libeskind et al. 2019). This could also explain the
It is intriguing that of the five galaxies with line-of-sight ve- preference to see these structures edge-on (since both the Milky
locities, all of which align along the flattened structure to the Way and the nearby hosts lie in a common sheet-like structure).
North of NGC 253, four are blue- and only one is redshifted rela- Indeed, as Fig. 9 shows the plane normal is closely aligned with
tive to NGC 253. This is well consistent with an interpretation as the e1 -direction, to within (16.6 ± 5.4)◦ , where e1 is the eigen-
a mostly rotating satellite plane like those seen in M 31 and Cen- vectors of the tidal tensor at the position of NGC 253 which cor-
taurus A. In fact, a fraction of 80 per cent correlated velocities responds to the axis along which material in the cosmic web
is very similar to the fractions of correlated velocities reported is compressed fastest. NGC 253 thus further confirms the find-
for M 31 (13 out of 15, or 86 per cent) by Ibata et al. (2013), ing in Libeskind et al. (2018) that some flattened dwarf galaxy
and for Centaurus A (21 out of 28, or 75 per cent) by Müller structures in the Local Universe preferentially align with the e1 -
et al. (2021a). However, due to the small number of objects, the direction at their respective positions, and thus appear to be re-
degree of correlation for the NGC 253 system is not significant. lated to the larger-scale cosmic web.
Article number, page 7 of 12A&A proofs: manuscript no. aanda
DO II
DO III
104 DO IV
Local Group dwarf galaxies
Re [pc]
103
102
101
2 3 4 5 6 7 8 9
log(LV/L )
18
20
[mag/arcsec2]
22
24
Fig. 5. Distribution of galaxies around NGC 253 in a 40◦ × 40◦ field
26 in the supergalactic coordinates. The members of the NGC 253 group
eff
28 are shown by filled colored circles. The background (reddish) and fore-
ground (bluish) galaxies are marked with open circles. The redshift is
color-coded accordingly the color schema. Newly discovered objects
30 are shown by magenta polygons.
2.5 5.0 7.5 10.0 12.5 15.0 17.5
MV [mag]
significant – as expected given the small number of objects –
it is still an intriguing alignment that warrants further study of
18 this system’s phase-space correlation, in particular via distance
measurements of other satellite galaxy candidates to assess their
20
[mag/arcsec2]
association with NGC 253.
22 While a detailed comparison to cosmological expectations is
beyond the scope of the present work, we nevertheless illustrate
24 the expected flattening of satellite galaxy systems in ΛCDM by
comparing to systems in the Illustris TNG-100 hydrodynami-
26 cal cosmological simulation (Springel et al. 2018; Nelson et al.
2019). As analogs, we select host galaxies with virial masses in
e
28 the range of 0.6 to 1.0 × 10¹² M , which are required to be suf-
ficiently isolated by rejecting all hosts that have another galaxy
30 with a virial mass exceeding 0.5 × 10¹² M within 1.2 Mpc. The
101 102 103 galaxies within a volume of 600 kpc around each host are ranked
Re [pc] based on their brightness (if they contain stars), followed by a
ranking by mass (if they are dark). The flattening of the seven
top-ranked galaxies (excluding the host) is measured, and the re-
Fig. 4. Comparison of the photometric and structural parameters of the sulting distribution of absolute plane height, relative axis ratio,
three dwarf galaxies reported in this study with those for the Milky Way
and M 31 companions.
and best-fit plane’s offset from the host are plotted in red in Fig.
8.
As expected, the ΛCDM satellite systems are more flat-
tened than systems drawn from isotropy (especially because the
To assess the significance of the found flattening compared considered volume exceeds the virial volume of the simulated
to completely random, uncorrelated distributions, we repeat the hosts). However, the observed distribution of galaxies around
plane-fitting on randomized systems. These are drawn from an NGC 253 remains on the more flattened tail of the distribution:
isotropic distribution centered on NGC 253, but follow the exact only 10.1+7.2 +6.8
−5.3 and 12.5−4.6 per cent of the simulated systems are
same radial distances from the host as our observed realizations more flattened than the observed system in c/a and ∆rms , respec-
(grey histograms in the figure). The isotropic distributions typ- tively (where the error bars are based on the standard deviations
ically results in much wider plane fits, and the flattening mea- obtained from the Monte-Carlo sampling of the observed dis-
sured for the observed system are off by 2σ for both the absolute tribution). The flattened distribution of the presently confirmed
plane height and the relative axis ratios. Thus, while not highly galaxies in the vicinity of NGC 253 thus does not rise to the same
Article number, page 8 of 12Martínez-Delgado et al.: Discovery of three satellites of NGC 253
Fig. 6. The map of galaxies in the vicinity of NGC 253 in the supergalactic coordinates. The left-hand panel presents the XY-projection on
the supergalactic plane, while the right-hand panel shows the edge-on view of the Local Supercluster ‘pancake’. The size and color of the dots
correspond to the absolute B-band magnitude and morphology of galaxies, according to the schemes. The line segments indicate uncertainties
in the distance estimations. Big circles around NGC 253 mark the virial zone, R200 ≈ 190 kpc, and the zero velocity surface, R0 ≈ 700 kpc. The
magenta symbols indicate the expected position of the discovered galaxies.
degree of tension reported for the better-studied satellite galaxy
planes around the Milky Way, M31, and Centaurus A.
If, however, only one additional satellite would be confirmed,
without changing the overall measured flattening of the system,
7.5◦ ESO540-030 =KDG002 100 then the fractions reported above would already drop by about a
ESO540-032 factor of two, to 5.4+4.9 +5.0
−2.9 and 7.1−3.6 per cent of simulated systems
5◦
ESO540-031 =DDO006
NGC0247
NGC0059
being more flattened in c/a and ∆rms , respectively. This demon-
Do IV 50
IC1574 =DDO226 strated that it will require a more complete census of galaxies
∆vlos in km s−1
2.5◦ LV J0055-2310
Do II around NGC 253 via distance measurements of the current can-
0 ◦
SCLMMDW2 PGC3097727 =Sc22
0
didates, as well as a more complete sample of spectroscopic
η
SCLMMDW1 velocity measurements, to clarify whether the system is indeed
−2.5◦
Do III
SCULPTORSR exceptional, or rather typical, compared to expectations derived
−50 from cosmological simulations.
5◦ If we assume that the galaxies (including our new three
discoveries) for which no distance measurement exist are at
−7.5◦
NGC 253 −100 the distance of NGC 253, with a broad distance uncertainty of
< 600 kpc of NGC 253
on sky flattening ESO349-031
±200 kpc, our plane fits become less extreme. The broad as-
7.5◦ 5◦ 2.5◦ 0◦ −2.5◦ 5◦ −7.5◦
sumed distance uncertainties also introduce a lot of scatter in
ξ the obtained best-fit parameters. While the best-fit orientation
changes only mildly, the plane width are then dominated by the
two spatial outliers Do III and Sculptor SR.
While one can interpret the spatial alignment as a potential
Fig. 7. On-sky distribution of the galaxies listed in Table 3 in equato-
plane of satellite galaxies, its extent of 600 kpc exceeds the virial
rial coordinates relative to the position of NGC 253 (black cross). The
galaxies are color-coded by their line-of-sight velocity component rela- volume of NGC 253. This makes the structure more similar to
tive to the NGC 253 velocity. Galaxies without velocity measurements the larger-scale planes of dwarf galaxies discovered in the LG,
are plotted in black. Galaxies (potentially) within 600 kpc of NGC 253 which have diameters of 1–2 Mpc (Pawlowski et al. 2013). How-
are marked with yellow boxes. The dashed black line indicates the on- ever, even the 6 galaxies (assuming those without distance mea-
sky orientation of the flattening of these objects. surements share the same distance as NGC 253) within 300 kpc
are roughly aligned in the same direction as the objects on larger
Article number, page 9 of 12A&A proofs: manuscript no. aanda
Plane height Plane minor to major axis ratio Plane inclination Plane offset from host
500 250
observed (mean 31.2, std 4.6) 200 observed (mean 0.14, std 0.03) observed (mean 0.08, std 0.07) observed (mean 37.7, std 17.4)
200
isotropic (mean 103.8, std 32.5) isotropic (mean 0.40, std 0.14) isotropic (mean 0.48, std 0.29) isotropic (mean 65.6, std 47.2)
TNG100 (mean 61.6, std 28.6) 175 TNG100 (mean 0.30, std 0.14) 175 TNG100 (mean 42.5, std 39.2)
400 200
150 150
300 125 150 125
N
N
N
N
100 100
200 100
75 75
50 50
100 50
25 25
0 0 0 0
0 50 100 150 200 250 0.0 0.2 0.4 0.6 0.8 1.0 0.0 0.2 0.4 0.6 0.8 1.0 0 50 100 150 200 250
∆rms [kpc] c/a cos(i) dNGC253 [kpc]
Fig. 8. Best-fit parameters for the ToI fits to the spatial distributions of galaxies within 600 kpc of NGC 253. Shown are, from left to right: the
absolute rms plane height ∆rms , the relative minor-to-major axis ratio c/a, the inclination i of the best-fit plane with the line-of-sight to NGC 253,
and the perpendicular offset dNGC 253 of the best-fit plane from the host galaxy NGC 253 (which was not included in the plane fit). Each panel also
gives the mean and standard deviations of the shown distributions. The realizations drawing from the observed galaxy distances (blue) are much
more flattened (by both measures) than the randomized samples (grey) drawn from isotropic distributions around NGC 253’s position but following
the same radial distances. Satellite systems drawn from the Illustris TNG 100 simulation (red) are more flattened than isotropic distributions in
both absolute plane height and axis ratio, but the observed system falls onto the more flattened tail of their distribution.
Plane normal vector in supergalactic coordinates 4. Conclusions
◦
60 e1
In this study we report the discovery of three dwarf spheroidal
galaxies, named Do II, Do III and Do IV, in the vecinity of the
30◦
e2 bright late-type spiral NGC 253 galaxy by means of a visual in-
spection of the images taken by the DES. For our analysis, the
e3
images were processed using the legacypipe software from the
150◦ 120◦ 90◦ 60◦ 30◦ 330◦ 300◦ e3 270◦ 240◦ 210◦
DESI Legacy imaging surveys. We used the galfit software for
−30◦ e2 deriving their photometric and structural properties. The physi-
cal parameters for Do II, Do III and Do IV were calculated by
e1 −60◦ adopting a distance modulus of 27.84 ± 0.02 mag for NGC 253
(Jacobs et al. 2009). The resulting total absolute magnitudes of
the dwarfs transformed to the V-band fall in the range from about
0 Normal vector count 213 −7 to about −9 mag, which are typical for satellite dwarf galax-
ies in the Local Universe. The central surface brightness tend to
be extremely low for all the discovered dwarfs and fall roughly
in the range of 25–26 mag arcsec−2 in g-band.
Fig. 9. Density distribution of the direction of plane-normal vectors (mi-
nor axis of 3D galaxy distribution) of the galaxies with measured dis-
So far there are 12 confirmed members in the group around
tances within 600 kpc around NGC 253, for 1000 realizations drawing NGC 253. Taking into account these three possible new members
from the distance errors. Shown are Supergalactic Coordinates, indicat- and the Sculptor SR dwarf galaxy, the total population consists
ing that the best-fit plane aligns closely with the Supergalactic Plane. of 16 galaxies. The radial velocity dispersion in the NGC 253
The red symbols indicate the eigenvectors of the tidal tensor at the po- group estimated using the nine members with known radial ve-
sition of NGC 253, which describe the principal directions of the sur- locities is 43 km s−1 . Most galaxies lie at a projected distance of
rounding cosmic web. The best-fit plane is well aligned with e1 , the less than 5.5◦ or about 350 kpc from NGC 253. Do II is the third
axis along which material in the cosmic web is compressed fastest. nearest in projection satellite of NGC 253. The late spiral galaxy
NGC 247 has high negative peculiar velocity of −86 km s−1 with
respect to NGC 253. In fact, Do IV together with the dwarf irreg-
ular galaxy ESO 540–032 forms a subgroup around NGC 247.
Do III, lying at a distance of about 340 kpc from NGC 253, is
one of the peripheral members of the core of the group.
scales. Another interpretation of the larger structure is that these We have used the virial theorem and the projected mass es-
galaxies trace a cosmic filament. Preferential accretion of dwarf timator to determine the galaxy group mass. We estimated the
galaxies along filaments was proposed as a possible origin of total mass of the NGC 253 group to be about 8 × 10¹¹ M . There-
flattened satellite galaxy structures (Lovell et al. 2011; Libeskind fore, the respective estimated radius of the virialized region is
et al. 2011). While the alignment of the flattened galaxy dis- R200 = 186 kpc, and the corresponding radius of the zero veloc-
tribution with the direction of fastest collapse of the surround- ity surface is 706 kpc.
ing cosmic web can be seen as support of such an interpreta- We also discuss the issue of the possible existence of a spa-
tion, the observed distribution appears much more narrow than tially flattened and velocity-correlated satellite galaxy system
a typical filament in cosmological simulations, and the resulting around NGC 253. It is apparent from our analysis that most of
satellite galaxy systems in simulations are typically not highly the known objects in the vicinity of NGC 253 are aligned in an
anisotropic (Pawlowski et al. 2012; Shao et al. 2018). However, extremely narrow structure to the North side of the galaxy. Of the
since the effects of accretion along filament on the formation of 12 galaxies that potentially are within 600 kpc from NGC 253,
satellite alignments have thus far mostly been studied in cosmo- only Do III and Sculptor SR are significantly offset from this ori-
logical simulations, NGC 253 promises to be a unique observa- entation.
tional test case of the filamentary accretion scenario: a potential To study the three-dimensional distribution of the known
satellite plane in the making by the cosmic web. satellites of NGC 253, we have employed the common tensor-
Article number, page 10 of 12Martínez-Delgado et al.: Discovery of three satellites of NGC 253
of-inertia fitting method. As expected from a flattened on-sky References
distribution, we have found an extremely narrow spatial align- Abbott, T. M. C., Abdalla, F. B., Allam, S., et al. 2018, ApJS, 239, 18
ment: the root-mean-square (rms) height from the best-fit plane Bahcall, J. N. & Tremaine, S. 1981, ApJ, 244, 805
is only ∆rms = 31 ± 5 kpc, and the minor-to-major axis ratio is Baushev, A. N. 2019, MNRAS, 490, L38
c/a = 0.14 ± 0.03. These values are comparable to those of the Bechtol, K., Drlica-Wagner, A., Balbinot, E., et al. 2015, ApJ, 807, 50
Bennet, P., Sand, D. J., Crnojević, D., et al. 2019, arXiv e-prints,
satellite planes found around the Milky Way and M 31. While arXiv:1906.03230
one can interpret this alignment as a potential plane of satellite Bouchard, A., Jerjen, H., Da Costa, G. S., & Ott, J. 2005, AJ, 130, 2058
galaxies, its extension of 600 kpc exceeds the virial volume of Brainerd, T. G. & Samuels, A. 2020, ApJ, 898, L15
NGC 253. This makes the structure more similar to the larger- Bullock, J. S. & Boylan-Kolchin, M. 2017, ARA&A, 55, 343
Cannon, J. M., Dohm-Palmer, R. C., Skillman, E. D., et al. 2003, AJ, 126, 2806
scale planes of dwarf galaxies discovered in the LG, which have Carlsten, S. G., Greco, J. P., Beaton, R. L., & Greene, J. E. 2020, ApJ, 891, 144
diameters of 1–2 Mpc (Pawlowski et al. 2013). Chiboucas, K., Jacobs, B. A., Tully, R. B., & Karachentsev, I. D. 2013, The
The first results of our survey of dwarf galaxies around Astronomical Journal, 146, 126
Colless, M., Peterson, B. A., Jackson, C., et al. 2003, arXiv e-prints, astro
NGC 253 or the recent discovery of a possible very faint satel- Conn, A. R., Lewis, G. F., Ibata, R. A., et al. 2013, ApJ, 766, 120
lite of M 33 (Martinez-Delgado et al. 2021b) demonstrated the Cote, S., Freeman, K. C., Carignan, C., & Quinn, P. J. 1997, AJ, 114, 1313
suitability of DESI Legacy surveys imaging for discovering dif- Da Costa, G. S., Grebel, E. K., Jerjen, H., Rejkuba, M., & Sharina, M. E. 2009,
fuse satellites of nearby spiral galaxies by means of the visual AJ, 137, 4361
Dalcanton, J. J., Williams, B. F., Seth, A. C., et al. 2009, ApJS, 183, 67
inspection of the images. Because of the low surface bright- Dark Energy Survey Collaboration, Abbott, T., Abdalla, F. B., et al. 2016, MN-
ness of the three dwarf galaxies reported here, their association RAS, 460, 1270
with NGC 253 can be only confirmed with TRGB estimates in Davidge, T. J. 2006, ApJ, 641, 822
CMDs from deeper HST data and ground-based 8-meter tele- Dey, A., Schlegel, D. J., Lang, D., et al. 2019, AJ, 157, 168
Drlica-Wagner, A., Carlin, J. L., Nidever, D. L., et al. 2021, arXiv e-prints,
scopes or, alternatively, radial velocities obtained with state-of- arXiv:2103.07476
the-art spectroscopic instruments (e.g., Müller et al. 2021b). Flaugher, B., Diehl, H. T., Honscheid, K., et al. 2015, AJ, 150, 150
Fritz, T. K., Battaglia, G., Pawlowski, M. S., et al. 2018, A&A, 619, A103
Acknowledgements. We thank the referee for giving constructive comments Grebel, E. K. 2005, in American Institute of Physics Conference Series, Vol. 752,
which substantially helped improving this paper. We also thank Noam Libe- Stellar Astrophysics with the World’s Largest Telescopes, ed. J. Mikolajewska
skind, Martha Haynes and Lister Staveley-Smith for useful comments. DMD & A. Olech, 161–174
acknowledges financial support from the Talentia Senior Program (through the Greco, J. P., Greene, J. E., Strauss, M. A., et al. 2018, ApJ, 857, 104
incentive ASE-136) from Secretaría General de Universidades, Investigación y Haigh, C., Chamba, N., Venhola, A., et al. 2021, A&A, 645, A107
Tecnología, de la Junta de Andalucía. DMD also acknowledges funding from Homma, D., Chiba, M., Komiyama, Y., et al. 2019, PASJ, 71, 94
the State Agency for Research of the Spanish MCIU through the “Center of Ibata, R. A., Ibata, N. G., Lewis, G. F., et al. 2014, ApJ, 784, L6
Excellence Severo Ochoa" award to the Instituto de Astrofísica de Andalucía Ibata, R. A., Lewis, G. F., Conn, A. R., et al. 2013, Nature, 493, 62
(SEV-2017-0709). MSP thanks the Klaus Tschira Stiftung and German Schol- Jacobs, B. A., Rizzi, L., Tully, R. B., et al. 2009, AJ, 138, 332
ars Organization for support via a KT Boost Fund. JR acknowledge financial Javanmardi, B. & Kroupa, P. 2020, MNRAS, 493, L44
support from the grants AYA2015-65973-C3-1-R and RTI2018-096228-B-C31 Javanmardi, B., Martinez-Delgado, D., Kroupa, P., et al. 2016, A&A, 588, A89
(MINECO/FEDER, UE) as well as support from the State Research Agency Jerjen, H., Binggeli, B., & Freeman, K. C. 2000, AJ, 119, 593
(AEI-MCINN) of the Spanish Ministry of Science and Innovation under the Jerjen, H., Freeman, K. C., & Binggeli, B. 1998, AJ, 116, 2873
grant "The structure and evolution of galaxies and their central regions" with Jester, S., Schneider, D. P., Richards, G. T., et al. 2005, AJ, 130, 873
reference PID2019-105602GB-I00/10.13039/501100011033. We acknowledge Kaisina, E. I., Makarov, D. I., Karachentsev, I. D., & Kaisin, S. S. 2012, Astro-
the usage of the HyperLeda database3 (Makarov et al. 2014). This project used physical Bulletin, 67, 115
public archival data from the Dark Energy Survey. Funding for the DES Projects Karachentsev, I. D., Dolphin, A., Tully, R. B., et al. 2006, AJ, 131, 1361
has been provided by the U.S. Department of Energy, the U.S. National Sci- Karachentsev, I. D., Grebel, E. K., Sharina, M. E., et al. 2003, A&A, 404, 93
ence Foundation, the Ministry of Science and Education of Spain, the Science Karachentsev, I. D. & Makarov, D. A. 1996, AJ, 111, 794
and Technology FacilitiesCouncil of the United Kingdom, the Higher Education Karachentsev, I. D. & Makarov, D. I. 1999, in Galaxy Interactions at Low and
Funding Council for England, the National Center for Supercomputing Appli- High Redshift, ed. J. E. Barnes & D. B. Sanders, Vol. 186, 109
cations at the University of Illinois at Urbana-Champaign, the Kavli Institute of Karachentsev, I. D., Makarov, D. I., & Kaisina, E. I. 2013, AJ, 145, 101
Cosmological Physics at the University of Chicago, the Center for Cosmology Karachentsev, I. D., Neyer, F., Späni, R., & Zilch, T. 2020, Astronomische
and Astro-Particle Physics at the Ohio State University, the Mitchell Institute for Nachrichten, 341, 1037
Fundamental Physics and Astronomy at Texas A&M University, Financiadora Karachentsev, I. D., Tully, R. B., Anand, G. S., Rizzi, L., & Shaya, E. J. 2021,
de Estudos e Projetos, Fundação Carlos Chagas Filho de Amparo à Pesquisa do arXiv e-prints, arXiv:2102.11354
Estado do Rio de Janeiro, Conselho Nacional de Desenvolvimento Científico e Karachentseva, V. E. & Karachentsev, I. D. 1998, A&AS, 127, 409
Tecnológico and the Ministério da Ciência, Tecnologia e Inovação, the Deutsche Karachentseva, V. E. & Karachentsev, I. D. 2000, A&AS, 146, 359
Forschungsgemeinschaft, and the Collaborating Institutions in the Dark En- Koribalski, B. S., Staveley-Smith, L., Kilborn, V. A., et al. 2004, AJ, 128, 16
ergy Survey. The Collaborating Institutions are Argonne National Laboratory, Koribalski, B. S., Wang, J., Kamphuis, P., et al. 2018, MNRAS, 478, 1611
the University of California at Santa Cruz, the University of Cambridge, Cen- Kroupa, P., Haghi, H., Javanmardi, B., et al. 2018, Nature, 561, E4
tro de Investigaciones Energéticas, Medioambientales y Tecnológicas-Madrid, Laevens, B. P. M., Martin, N. F., Bernard, E. J., et al. 2015, ApJ, 813, 44
the University of Chicago, University College London, the DES-Brazil Consor- Li, H., Hammer, F., Babusiaux, C., et al. 2021, arXiv e-prints, arXiv:2104.03974
tium, the University of Edinburgh, the Eidgenössische Technische Hochschule Lianou, S. & Cole, A. A. 2013, A&A, 549, A47
(ETH) Zürich, Fermi National Accelerator Laboratory, the University of Illi- Libeskind, N. I., Carlesi, E., Müller, O., et al. 2019, MNRAS, 490, 3786
nois at Urbana-Champaign, the Institut de Ciències de l’Espai (IEEC/CSIC), Libeskind, N. I., Guo, Q., Tempel, E., & Ibata, R. 2016, ApJ, 830, 121
the Institut de Física d’Altes Energies, Lawrence Berkeley National Labora- Libeskind, N. I., Knebe, A., Hoffman, Y., et al. 2011, MNRAS, 411, 1525
tory, the Ludwig-Maximilians Universität München and the associated Excel- Libeskind, N. I., van de Weygaert, R., Cautun, M., et al. 2018, MNRAS, 473,
lence Cluster Universe, the University of Michigan, the National Optical Astron- 1195
omy Observatory, the University of Nottingham, The Ohio State University, the Lovell, M. R., Eke, V. R., Frenk, C. S., & Jenkins, A. 2011, MNRAS, 413, 3013
OzDES Membership Consortium, the University of Pennsylvania, the University Lucero, D. M., Carignan, C., Elson, E. C., et al. 2015, MNRAS, 450, 3935
of Portsmouth, SLAC National Accelerator Laboratory, Stanford University, the Makarov, D., Prugniel, P., Terekhova, N., Courtois, H., & Vauglin, I. 2014, A&A,
University of Sussex, and Texas A&M University. Based in part on observations 570, A13
at Cerro Tololo Inter-American Observatory, National Optical Astronomy Ob- Martinez-Delgado, D., Cooper, A. P., Roman, J., et al. 2021a, arXiv e-prints,
servatory, which is operated by the Association of Universities for Research in arXiv:2104.06071
Astronomy (AURA) under a cooperative agreement with the National Science Martinez-Delgado, D., Karim, N., Boschin, W., et al. 2021b, arXiv e-prints,
Foundation. arXiv:2104.03859
Mau, S., Cerny, W., Pace, A. B., et al. 2020, ApJ, 890, 136
McConnachie, A. W. 2012, AJ, 144, 4
Meisner, A. M., Lang, D., Schlafly, E. F., & Schlegel, D. J. 2019, PASP, 131,
3
http://leda.univ-lyon1.fr 124504
Article number, page 11 of 12You can also read