Spectral observations of the systems with the disturbed spiral arms: Arp 42, Arp 82 and Arp 58
←
→
Page content transcription
If your browser does not render page correctly, please read the page content below
MNRAS 000, 1–15 (2019)                                                  Preprint 8 April 2019              Compiled using MNRAS LATEX style file v3.0

                                              Spectral observations of the systems with the disturbed spiral arms:
                                              Arp 42, Arp 82 and Arp 58

                                              1
                                               Anatoly V. Zasov,1,2? Anna S. Saburova,1 Oleg V. Egorov,1,3 Sergei N. Dodonov 3
                                                  Sternberg Astronomical Institute, Moscow M.V. Lomonosov State University, Universitetskij pr., 13, Moscow, 119234, Russia
                                              2   Faculty of Physics, Moscow M.V. Lomonosov State University, Leninskie gory 1, Moscow, 119991, Russia
                                              3   Special Astrophysical Observatory, Russian Academy of Sciences, Nizhniy Arkhyz, Karachai-Cherkessian Republic, 357147, Russia
arXiv:1904.03150v1 [astro-ph.GA] 5 Apr 2019

                                              8 April 2019

                                                                                      ABSTRACT
                                                                                      We study three Arp’ systems of peculiar galaxies: Arp 42 (NGC 5829), Arp 82 (NGC 2535/36)
                                                                                      and Arp 58 (UGC 4457), using the long-slit spectral observations carried out at the 6m
                                                                                      telescope BTA of Special Astrophysical Observatory. Arp 82 and Arp 58 are the M51-type
                                                                                      systems. In the third system – Arp 42, there are two extremely luminous kpc-sized clumps
                                                                                      observed at the ends of the bifurcated spiral arm, however the source of perturbations remains
                                                                                      unknown. From the emission line measurements we analyzed the distribution of gas line-of-
                                                                                      sight (LOS) velocity, velocity dispersion and gas-phase metallicity along the slits estimated
                                                                                      by different methods. A special attention is paid to the young regions of star formation at
                                                                                      the peripheries of the galaxies and in tidal debris, their connection with gas kinematics and
                                                                                      abundance. All three systems show the signs of velocity disturbances and the presence of
                                                                                      regions of locally enhanced gas velocity dispersion, as well as the regions of diffuse ionized
                                                                                      gas. A distribution of oxygen reveals shallow radial abundance gradients, typical for interacting
                                                                                      systems. A faint spiral-like branches of tidal bridges which are observed in NGC 2535 and
                                                                                      UGC 4457 may represent the remnants of pre-existing "old" mode of spiral waves.
                                                                                      Key words: galaxies: kinematics and dynamics, galaxies: evolution

                                              1    INTRODUCTION                                                               crete scenarios depend on many factors, and they are different
                                                                                                                              for different interacting systems. In addition to the gravitation
                                              Tidal interactions of spatially close gas-rich galaxies affect                  instability of gas in tidal debris, which does not always take
                                              mostly their gas component due to the collisional nature of                     place, a key role in triggering star formation may play such
                                              gas and low dispersion of gas velocities. Some fraction of gas                  events as a supersonic turbulence, ram pressure and interac-
                                              of interacting galaxies loses angular momentum and moves                        tion with the external gas (Renaud et al. 2014; Maji et al.
                                              closer to the center, usually stimulating a burst of star forma-                2017; Smith et al. 2013; Kapferer et al. 2008; Tonnesen &
                                              tion, while some gas and stars may be thrown out of galactic                    Bryan 2012). So, as it was noted earlier by Boquien et al.
                                              discs, often forming tidal streams stretching far away from                     (2009), collisional debris may be considered as laboratories
                                              parent galaxies. At the stage of strong interaction, direct col-                to study star formation.
                                              lisions of gas flows can occur leading to shock-induced star
                                              formation (see e.g. Maji et al. 2017 and references therein).                         It is essential that the galaxies we consider and their tidal
                                              Formation of stars is often observed both in a far periphery of                 structures are in the very unstable phase of evolution when
                                              disc and in tidal debris of galaxies including a formation of                   stellar and gas spatial distributions and their velocities may
                                              gravitationally bound tidal dwarf galaxies, which takes place                   experience a significant change over a characteristic dynamic
                                              under favourable conditions (see the surveys by Weilbacher                      time of about 108 yr which complicates the observed picture.
                                              et al. 2002; Duc & Renaud 2013).                                                Although strong interaction affects all regions of a galaxy, it
                                                   Mechanisms which can promote a formation of the ex-                        manifests itself in different ways at different distances from
                                              tended star-forming regions at the periphery of galaxies and                    the centre: due to gravity torques the gas looses angular mo-
                                              in tidal debris in low gas density conditions, as well as their                 mentum in the inner galaxy and gains it at larger radii (Bour-
                                              subsequent evolution, is the actively debated problem (see                      naud 2011). As a result there is a local increase of gas density
                                              e.g. Wetzstein et al. 2007; Bournaud 2011). Obviously, con-                     and activation of star formation in the circumnuclear region
                                                                                                                              of a galaxy (Noguchi 1988; Hernquist 1989), and a decrease
                                                                                                                              in gas density in other regions, which in turn may cause a
                                              ?   E-mail:zasov@sai.msu.ru                                                     flattening of radial gradient of gas abundance (Kewley et al.

                                              © 2019 The Authors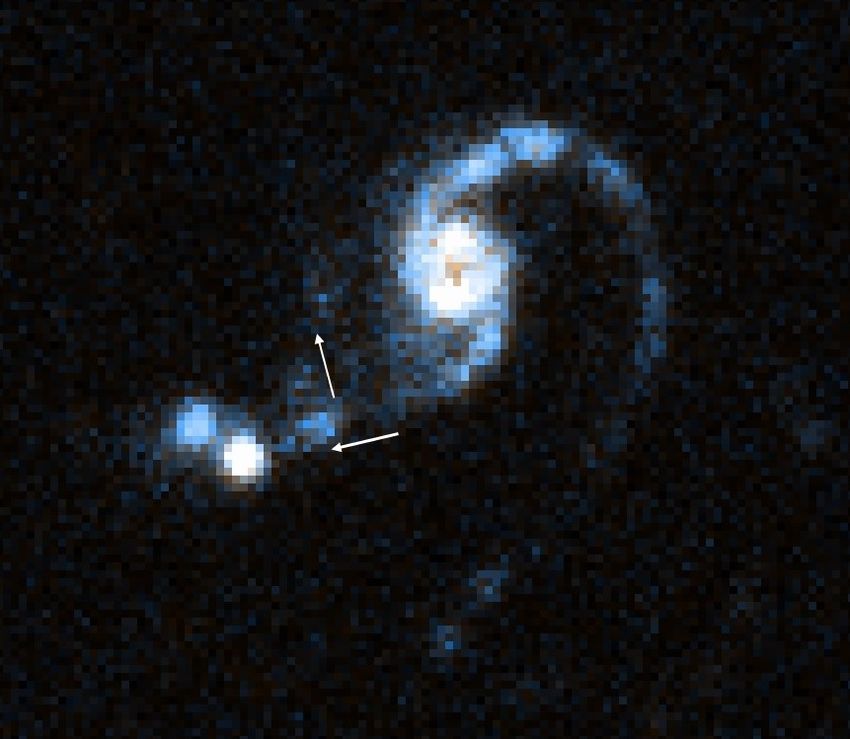
2 Zasov et al.
2006, 2010). Gas and stars ejected from the disc may either NGC 5829 is a Grand Design-type galaxy, its two arms
leave the galaxy or fall backward (see, e.g. Elmegreen et al. look non-identical. The southern spiral arm contains bright
1993), they may form a tidal tail or tidal dwarf galaxies (Duc clumps of H ii . Remarkably, this arm contains two or three
et al. 2000; Duc & Renaud 2013). Measuring gas velocities straight sections (‘rows’). Such features often observed in
and radial gradients of chemical composition in interacting galaxies with the ordered spiral arms may be considered as a
systems allows us to understand better the star formation con- sign of strong large-scale shock waves linked with spiral arms
ditions and the ways of the evolution of galaxies, which have (see Chernin et al. 2001; Butenko & Khoperskov 2017, and
experienced or experienced strong tidal disturbances in the the references therein). In contrast, the opposite (northern)
past. spiral arm looks rather smoothed and badly defined, although
In this paper we continue to describe the results of spec- the extended emission regions are observed along the whole
tral observations at the 6m telescope BTA of Special Astro- arm. Its outer fraction is bifurcated, and both split compo-
physical Observatory of disturbed galaxies with local regions nents contain a similarly looking kpc-sized unusually bright
of star formation in the periphery of discs or in the intergalac- compact emission regions (we’ll call them BER1,2, see Fig.
tic space which we started in Zasov et al. (2015, 2016, 2017, 1), embedded into the area of the enhanced brightness of
2018). Here we focus on the three Arp systems Arp 42, Arp about 6 kpc length, slightly stretched along their parent spi-
82, and Arp 58. The main components of these systems are ral branches.
the late-type star-forming spiral galaxies with peculiar spi-
ral structures (a presence of tidal arms or arm bifurcation),
evidencing their perturbed state. The galaxies are character- 2.2 Arp 82
ized by active star formation, where the numerous local sites Arp 82=VV 009 is the system of M51-type. It consists of
(clumps) of emission gas and young stars are noticeable not a luminous spiral galaxy with the well defined two-armed
only in their central parts, but also at the far disc periphery spiral structure (NGC 2535), one arm of which connects or
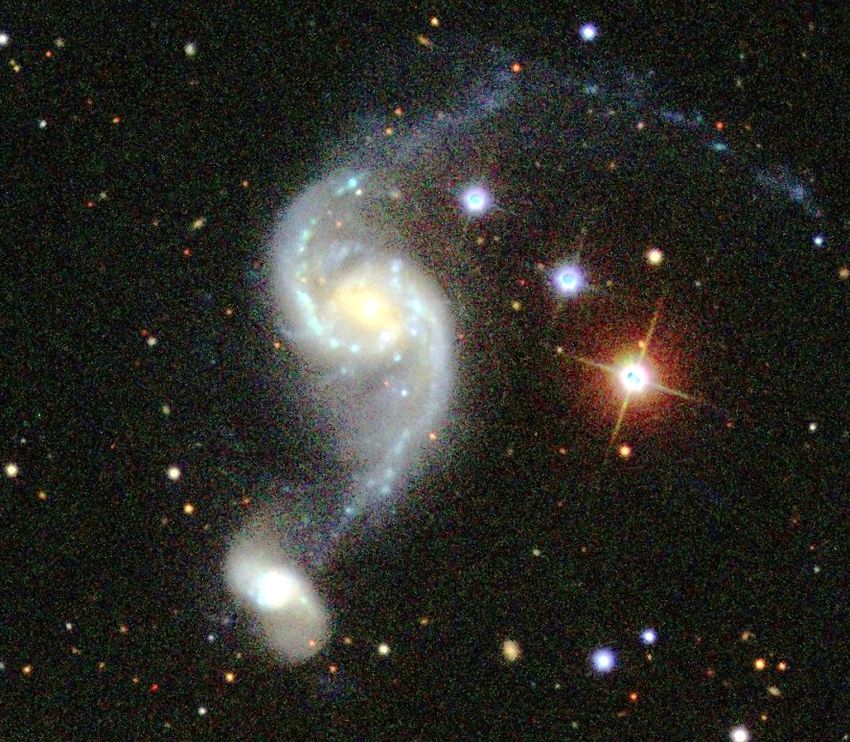
and in tidal debris. Composite SDSS g,r,i- band images of overlaps with the close satellite (NGC 2536). In addition,
the galaxies are shown in Fig. 1. NGC 2535 possesses a long tidal tail as the continuation of
The structure of this paper is as follows. In the next sec- the north spiral arm at the opposite side from the satellite.
tion we give the short information on the considered systems; The systemic velocity of the main galaxy is close to 4000
the observation and data reduction procedures are presented km s−1 , so we adopt the distance 54 Mpc for this system.
in Section 3; it is followed by Section 4 describing the data Both galaxies NGC 2535/36 in the system Arp 82 are
analysis techniques we use; the results of observations are embedded in the large H i envelope evidently associated with
given in Section 5, and their discussion is presented in Sec- the main galaxy. The extended gaseous disc is too large to
tion 6. Section 7 summarizes our conclusions. be the result of the observed interaction, and most probably
it existed before the galaxies became close (Kaufman et al.
1997). For the adopted distance a total mass of H i in the
2 A SHORT INFORMATION ON THE CHOSEN galaxy pair is 2.3 × 10¹⁰ M (in agreement with single dish
GALAXIES observations) where only a small portion of H i (5 × 10⁸ M )
belongs to the satellite (Kaufman et al. 1997), however the
2.1 Arp 42 latter overlaps with the gaseous tidal bridge extending from
Arp 42 is the poorly studied system, consisting of Sc-type NGC 2535, which makes the H i mass estimation model-
galaxy NGC 5829 and the irregular-looking IC4526 observed dependent.
at the projected distance of 2.30, or about three times of its A resolved kinematics of Arp 82 was studied by several
optical radius R25 = 0.70. R-band surface photometry of this authors. 2D velocity map was obtained by Kaufman et al.
system was carried out by Reshetnikov et al. (1993). Cu- (1997) in H i line and by Amram et al. (1989) in Hα line,
riously, the satellite galaxy is most probably a background using a scanning Fabry–Perot interferometer. Klimanov et al.
object in spite of its peculiar asymmetric shape and the ex- (2002) also obtained long-slit velocity measurements for two
tended faint outer arm looking like a tidal tail (see Fig 1). In- slit position angles (59◦ and 163◦ ) for NGC 2535 and its
deed, the systemic velocities VGSR of NGC 5829 and IC 4526 satellite. All authors indicate a strong non-circular gas mo-
are 5759 km s−1 and 13732 km s−1 respectively (HYPER- tions caused by interaction and the distortion of the velocity
LEDA1 , Makarov et al. 2014), evidencing that these galax- field due to the bending of the outer disc of NGC 2535, al-
ies are not interacting ones. Since there are no other objects though the rotation curve of the central disc of this galaxy
of comparable brightness in the vicinity, hereafter we will (within R∼ 20–25 arcsec) is fairly symmetric. The velocity
consider Arp 42 as a single object NGC 5829, assuming field distortion and the uncertainty in evaluation of inclina-
its redshift-based distance to be 78 Mpc. It is a gas-rich tion angles of both galaxies does not allow to obtain a reliable
late-type galaxy. Its total mass of neutral hydrogen is about dynamic estimate of their masses. Kaufman et al. (1997) also
2 × 10¹⁰ M (Hyperleda; see also Casasola et al. 2004). Mass pointed out the enhanced turbulent velocities of H i allover
of stellar population may be found from r-band luminosity the system (about 30 km s−1 along the LOS).
using the model ratio M/Lr ≈ 2.0 (Bell et al. 2003) for Numerical modeling of interacting galaxies with pro-
the color index (g − r) = 0.54 corrected for Galactic ex- grade rotation, whose masses are comparable (Howard et al.
tinction estimated from SDSS images. The resulting value is 1993) or differ by several times (Holincheck et al. 2016; Kauf-
M ≈ 5 × 10¹⁰ M . man et al. 1997) reproduces successfully the main observed
features of Arp 82. Velocity field of gas also well agrees with
the Klaric’ model (see discussion in Kaufman et al. 1997).
1 http://leda.univ-lyon1.fr/ The model of interacting galaxies presented by Hancock et al.
MNRAS 000, 1–15 (2019)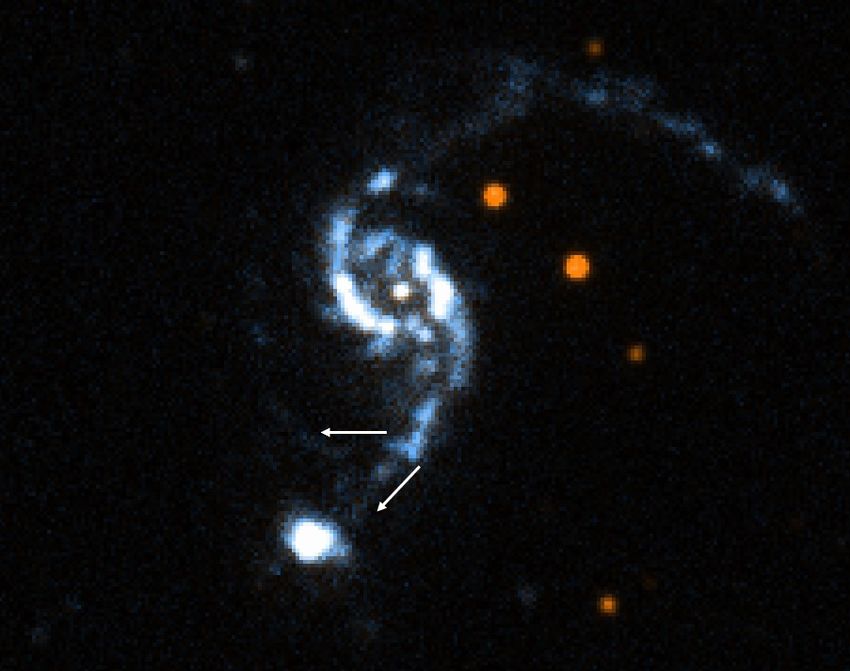
3
(2007) indicates that the galaxies have experienced two close       spectral fitting technique (Chilingarian et al. 2007a,b), which
encounters, and the most recent encounter have caused the           allows to fit the spectrum in a pixel space. In this method the
observed burst of star formation in both galaxies.                  parameters of the stellar populations are derived by nonlinear
                                                                    minimization of the quadratic difference chi-square between
                                                                    the observed and model spectra. We utilized the following
2.3    Arp 58                                                       parameters of SSP: age T (Gyr) and metallicity [Z/H] (dex)
Arp 58 = UGC 4457 = VV 413 also belongs to the M51-type             of stellar population. The line-of-sight velocity distribution
systems. Its main component is the Sc-type two-arm mildly           (LOSVD) of stars was parameterized by Gauss-Hermite se-
inclined galaxy. The satellite is observed at the end of the        ries (see van der Marel & Franx 1993).
SE-spiral arm at a distance of about one optical diameter                 The emission spectra were obtained by subtraction of
D25 ∼1 arcmin. The second spiral arm at the opposite side           model stellar spectra from the observed ones. After that we
from the satellite has a faint extension which forms a thin         fitted the Gaussian profiles to emission lines to estimate the
curved tidal tail. Systemic velocity of the main galaxy is          velocity and velocity dispersion of ionized gas and the fluxes
close to 11000 km s−1 , and the distance adopted in this paper      in the emission lines.
is 147 Mpc.                                                               To increase the signal-to-noise ratio (S/N) of the spectra
     UGC 4457 is very luminous galaxy: its corrected B-             we used the adaptive binning in the fitting. The S/N threshold
magnitude is Btc = 14.24 (HYPERLEDA database), which                levels we specified for Arp 42, Arp 82 and Arp 58 are 15, 30
corresponds to luminosity 6.6×10¹⁰ L for the adopted dis-           and 20 respectively. We used this binning to evaluate kine-
tance. The satellite is a few tens of times fainter than the main   matics. To estimate the emission line fluxes and metallicities
galaxy. This small galaxy is observed at a stage of active star     we utilized binning of 3 pixels for every spectrum. The pixels
formation. Its inner part has an elliptical shape and demon-        with S/N < 3 in emission lines were excluded from further
strates strong emission lines in its spectrum, however the dim      pixel-by-pixel analysis.
outer regions of the companion are of irregular shape being               In addition, we also analyzed the fluxes and intensities
distorted by interaction.                                           from a stacked spectra of several adjoining pixels correspond-
                                                                    ing to single star-forming clumps or to extended regions of
                                                                    fainter emission. A choice of the pixels interval to be stacked
                                                                    was made by eye in order to increase S/N to the values not
3     OBSERVATIONS AND DATA REDUCTION
                                                                    less than 10 for bright emission lines; a typical size of such
The long-slit spectral observations of Arp 42, Arp 82 and           bins is close to the size of bright clumps crossed by slits, or
Arp 58 were performed with the Russian 6-m telescope with           about 10 − 15 arcsec for faint extended regions. The resulting
SCORPIO-2 spectrograph (Afanasiev & Moiseev 2011). We               estimates for these bins (shown by squares in Figures below)
give the log of observations in Table 1. For every galaxy it        are close to those obtained from pixel-by-pixel analysis with
contains a position angle (PA) of the slit; date of observations;   much lower S/N and thus prove the reliability of the latter.
the total exposure time and seeing. We utilized the grism           For illustrative purposes we demonstrate in Fig.2 the exam-
VPHG1200@540, which covers the spectral range 3600–                 ples of spectra of the stacked bins with low and high S/N
7070 Å and has a dispersion of 0.87 Å pixel−1 . The spectral        that we used in our estimates of metallicity (see below). The
resolution is ≈ 5.2 Å estimated as FWHM of night-sky emis-          first one is the spectrum of the region with the coordinate
sion lines. The scale along the slit was 0.36 arcsec pixel−1 ,      R ≈ −80 arcsec in Arp 82 (P A = 342◦ ), and the second one
and the slit width was 1 arcsec. Slit positions are superim-        is for BER1 in Arp 42 (P A = 30◦ ).
posed on the optical images of the galaxies in Fig. 1. Every              To calculate a gas-phase metallicity, we use several meth-
slit was chosen to cross the bright star-forming clumps.            ods of estimation of (O/H) abundances from the relative in-
     A procedure of data processing was described step-by-          tensities of strong emission lines. They are based either on the
step in our earlier papers (Zasov et al. 2015, 2016, 2017,          empirical calibrations by comparison with the oxygen abun-
2018). To process the data we used the idl- based pipeline.         dance values obtained by the Te -method (S-method by Pilyu-
Briefly, the data reduction consisted of the following stages: a    gin & Grebel 2016, O3N2 method by Marino et al. 2013), or
bias subtraction and truncation of overscan regions, flat-field     on the photoionization models of H ii regions (izi by Blanc
correction, the wavelength calibration based on the spec-           et al. 2015 made using Levesque et al. 2010 photoionization
trum of He-Ne-Ar lamp, cosmic ray hit removal, summa-               models). In the most cases the shape of radial profiles of
tion of individual exposures, the night sky subtraction and         12 + log (O/H) obtained by different methods looks rather
flux calibration using the spectrophotometric stellar stan-         similar, although there is a well known discrepancy between
dards BD33d2642, BD28d4211, BD25d4655.                              the theoretical and empirical estimates: theoretical models
                                                                    usually lead to higher values of abundances (see for example
                                                                    Kewley & Ellison 2008).
4     DATA ANALYSIS
                                                                          Note that the regions showing the signs of non-
                                                                    photoionization mechanism of the ionized gas excitation were
In our spectra analysis we took into account the parameters         not used for estimates of the oxygen abundance. The conclu-
of instrumental profile of the spectrograph resulted from the       sion whether a region shows non-photoionization mechanism
fitting of the twilight sky spectrum observed in the same           of excitation was made based on the position on the so-
observation runs. We convolved these parameters with the            called BPT diagnostic diagrams proposed by Baldwin et al.
high-resolution PEGASE.HR (Le Borgne et al. 2004) sim-              (1981) and extended by Veilleux & Osterbrock (1987) for the
ple stellar population models (SSP) and fitted the reduced          [O iii]/Hβ vs [S ii]/Hα case. These diagrams are widely used
spectra of galaxies. We performed it using the nbursts full         to separate the different mechanisms of emission lines exci-

MNRAS 000, 1–15 (2019)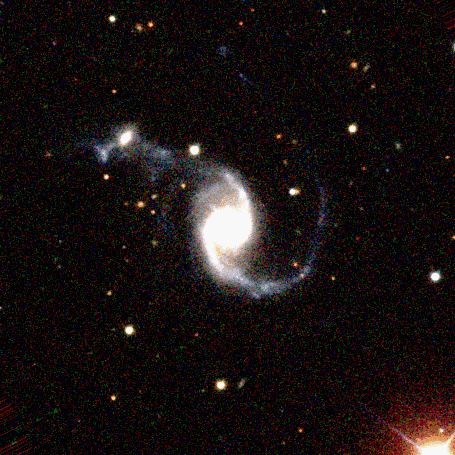
4      Zasov et al.
tation. Additionally, all regions with equivalent width of Hα                                                                               IC4526
line EW(Hα) < 3 (according to Lacerda et al. 2018) were ex-                                                  BER1
                                                                                                                                   Slit #2
cluded as probably related to the diffuse ionized gas (DIG). In                                                                    PA=82o
                                                                      02m43.2s
the mentioned paper the authors claimed that EW(Hα) > 14                                      BER2
Å is typical for pure star-forming region. However applying
another criterion to separate DIG from H ii regions – based
on Hα flux (Zhang et al. 2017) – changes the results negligi-
bly. Moreover, Kumari et al. (2019) showed that estimates of
                                                                                        NGC5829
the metallicity made using O3N2 method doesn’t suffer from
the presence of the DIG. Hence our analysis based on at least      15h02m38.4s

this method should be reliable even if the DIG contribution
in the remaining data is still significant.                                                                                                          N

                                                                                                                         Slit #1
                                                                                                                         PA=30o             E

                                                                                   +23o18m36s       19m12s           19m48s        20m24s          21m00s
5     RESULTS OF OBSERVATIONS

5.1    Arp 42                                                         11m20.0s

For Arp 42 we obtained two spectral cuts for two slit ori-            11m18.4s                  NGC2535
entations. The slit positions are demonstrated in Fig. 1 (top
panel). In the first cut (P A1 = 30◦ ) the slit crosses the cen-
                                                                      11m16.8s
ter of galaxy and BER1. This slit orientation differs at about
12◦ from the optical major axis (MA) (P A)0 ≈ 18◦ (HYPER-
LEDA; Nishiura et al. 2000). In the second cut P A2 = 82◦ the         11m15.2s                             Slit #1
                                                                                                           PA=342o
slit passes along the second branch of the spiral arm crossing
the southern BER2.                                                    11m13.6s
                                                                                                                                         Slit #2
      The results of data processing are illustrated in Fig. 3                                                                           PA=147o
for P A1 = 30◦ (left panel) and P A2 = 82◦ (right panel).             11m12.0s

There we show the slit position overlaid on the composite
SDSS g,r,i- band images (a) and from top to bottom the ra-            11m10.4s
                                                                                                                                                     N
dial variation of: (b) observed emission lines fluxes; (c) LOS
                                                                                              NGC2536
velocities; (d) LOS velocity dispersion for P A = 30◦ (e) flux     08h11m08.8s
                                                                                                                                            E
ratios and (f) oxygen abundance. Circles correspond to the
different emission lines. For convenience we mark the esti-                                   +25o10m48s                      12m00s
mates having large uncertainties relative to other points at a
given plot by pale-colored symbols. Stars in Fig. 3 demon-
strate the stellar kinematical data obtained from the absorp-
tion spectra. Square symbols show the values obtained after           32m02.4s

stacking of several adjoining pixels corresponding to single
                                                                                                                               Slit #1
star-forming clumps or to extended regions of fainter emis-                                                                    PA=130o
sion (see Section 4). For reference we mark the position of           32m00.0s
some morphological features (H ii clumps, galaxies centres
etc.) by vertical dotted lines. Note that for P A = 82◦ we
managed to estimate only the upper limit of LOS velocity
dispersion in all emission lines (50 km s−1 ), so we do not           31m57.6s

reproduce it in the Figure.
      LOS velocity profile along P A1 = 30◦ in general agrees
with that obtained earlier by Nishiura et al. (2000) along            31m55.2s

major axis, although it extends to larger radial distances R and
is more detailed. Its shape in general reflects the shape of the                                                                                     N
rotation curve: it grows in the inner few kpc and then flattens    08h31m52.8s
at larger R. Local non-circular motions with the amplitude up                                                                               E
to several tens of km s−1 are observed where the slit crosses
bright emission regions.                                                         +19o11m24s       12m00s        12m36s          13m12s          13m48s

      Velocity dispersion of emission gas does not exceed 50
km s−1 , which is normal for galaxies with moderate star for-
mation rate (here and below in this paper we provide the                 Figure 1. The positions of the slit used for spectroscopic observations over-
velocity and velocity dispersion estimates only for the re-              plotted on the composite SDSS g,r,i- band images of Arp 42, Arp 82, Arp 58
gions with S/N>15). Stellar velocity dispersion c∗ ∼ 80-100              (from top to bottom). The circles on the images of Arp 42 and Arp 82 mark
km s−1 was measured only for the central part of the galaxy.             the positions of sites of star formation that were considered in the two-
                                                                         coloured diagrams (see below).
This value is quite normal for late-type galaxies of similar lu-

                                                                                                                                         MNRAS 000, 1–15 (2019)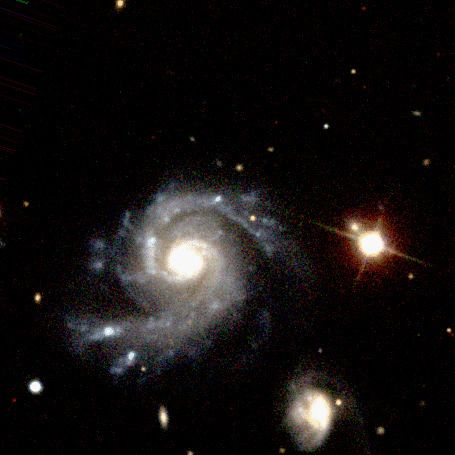
5
1.0
Arp82, PA=342o 5.2 Arp 82
0.8
Rel. Flux
[OIII] 5007
0.6 Hβ 4861 Hα 6563
We fulfilled two spectral cuts of Arp 82 (see Fig.1, central
0.4 [OIII] 4959
[SII] 6717
panel). Slit PA =342◦ passes through the centres of galaxies.
0.2 This orientation is close to (PA)0 ≈ 153◦ of major axis (MA)
0.0
4500 5000 5500 6000 6500 7000 for the outer elliptical optical isophotes of the galaxy as well
Wavelength as for the kinematic MA (Kaufman et al. 1997). The second
slit PA=147◦ runs along the bridge between the galaxies and
1.0
0.8
Arp42, PA=30o cuts the western part of NGC 2536. The slit PA=147◦ also
Rel. Flux
0.6 Hβ 4861
[OIII] 5007
Hα 6563
crosses the region of splitting of the spiral arm of NGC 2535
0.4 [OIII] 4959
about half-way between galaxies, clearly visible in GALEX
[SII] 6717
0.2 image (see Section 6).
0.0 Profiles of LOS velocities, velocity dispersion, line in-
4500 5000 5500 6000 6500 7000
Wavelength
tensities and oxygen abundance are presented for both po-
sitions of the slit in Fig. 5. LOS velocities profile along
PA=342◦ shows that the maximum velocity of rotation of
Figure 2. The examples of stacked spectra of the low (top panel) and high
NGC 2535 corresponding to the flat parts of rotation curve
(bottom panel) S/N bins used for the metallicity estimate at R ≈ −80 arcsec
for Arp 82 and BER1 for Arp 42 respectively.
is Vrot sin i ≈ 70 km s−1 , in a good agreement with Amram
et al. (1989) data, who observed this system in Hα line.
Unlike NGC 2535, velocity profile along the diameter
of its satellite has a peculiar shape: LOS velocity of gas
Table 1. Log of observations grows with radial distance, but at R>5 arcsec (1.4 kpc) its
sign reverses with respect to the centre, so at R>10 arcsec
Slit PA Date Exposure time Seeing the rotation changes its direction to the opposite one at both
(o ) (s) (arcsec) sides from the centre. This result slightly differs from Amram
et al. (1989) data, which also reveal the rapid decrease of
Arp 42 30 07.04.2016 1800 1.5 rotation curve, however the velocity does not cross a zero.
Arp 42 82 24.04.2015 4500 3.3 The kinematical profile of the satellite obtained by Klimanov
Arp 82 342 12.12.2015 7200 4.0 et al. (2002) agrees in general with our data. Such velocity
Arp 82 147 13.12.2015 6300 4.0 profile may be explained by strong bending of the gaseous
disc, so that at R ≈10 arcsec disc inclination passes through
Arp 58 130 12.12.2015 5400 1.4
zero. However most probably it reflects non-circular ordered
gas motions due to stellar bar, clearly visible in the center of
this galaxy. Unlike gas velocities, the stellar LOS velocities
remain constant along the radius. To clarify the gas and stellar
minosities with moderate bulge (e.g. NGC 1084, NGC 4254, motions in this region, 2D velocity field is needed.
see the HYPERLEDA database (Makarov et al. 2014)). Velocity profile along the second slit PA=147◦ confirms
In Fig. 4 we demonstrate the position of the emission re- a very low velocity change along the bridge between the
gions crossed by the slit in the BPT diagnostic diagram, where galaxies (at about 20-30 km s−1 ). When crossing the spiral
the black ‘maximum starburst line’ (Kewley et al. 2001) sep- arm of NGC 2536, a velocity gradient is observed which
arates the photoionized H ii-regions from all other types of may be accounted for galaxy rotation. Stellar velocity profile
gas excitation (AGN, shocks etc.). A composite mechanism slightly disagrees with the gaseous one along the slit: it is
of excitation is expected for points between the black line 20-40 km s−1 higher than the latter in the bridge and remains
and the gray line proposed by Kauffmann et al. (2003) (see less disturbed where the slit crosses the blurred spiral arm of
left panel). One can see that most of the dots for Arp 42 lie the satellite.
in the pure photoionization region of the diagram. Several Velocity dispersion of gas is relatively low for both spec-
points beyond the borderlines for photoionized gas belong tral cuts: judging from Hα data, which give the most precise
to regions of low surface brightness in the strong emission estimates, it does not exceed 50 km s−1 with the exception
lines, evidencing the significant input of non-photoionizing of the central region of both galaxies, where small central
mechanism of gas excitation. bars are observed, and probably of the outer low brightness
Oxygen abundance that we found by different methods regions of the satellite (PA=147◦ ). Between the galaxies as
(see Fig. 3, bottom panels) shows a wide spread of values well as in the low-contrast spiral arm-bridge velocity disper-
along PA=30◦ . The empirical O3N2 and theoretical izi meth- sion of emission gas has the lowest values (about 30 km s−1 ),
ods give higher values for the centre of the galaxy. At the which coincides with the H i velocity dispersion according
same time at the effective radius of the disc re = 10.8 kpc to Kaufman et al. (1997).
our metallicity estimate is close to that found in the CAL- Note that in the main body of NGC 2535 the gas velocity
IFA survey (Sánchez-Menguiano et al. 2016) for NGC 5829 dispersion decreases along the radius parallel with the bright-
(log (O/H) = 8.43 ± 0.05). For the second cut, which crosses ness of emission lines, which suggests that the kinetic energy
the periphery of NGC 5829, the metallicity remains roughly of random gas motion in the emission regions is connected
constant 12 + log (O/H) ≈ 8.4. Oxygen abundance does not with the intensity of local star formation there (see also Moi-
show any change when the slit passes through the BER1 and seev et al. 2015, for similar correlation in other galaxies).
BER2. Of special interest are the areas of low brightness of
MNRAS 000, 1–15 (2019)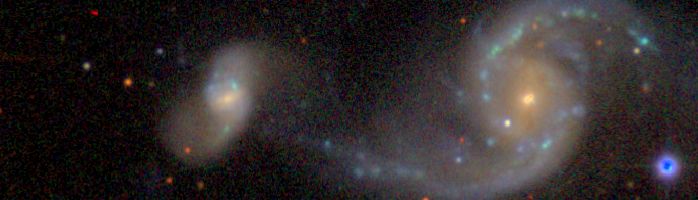
6 Zasov et al.
SW PA = 30 NE SW PA = 82 NE
(a) (a)
10
10
X, 00
0
X, 00
0
10
10
1 log(Flux), erg/s/cm2/arcsec2
H (b)
15 H
(b)
log(Flux), erg/s/cm2/arcsec2
[OIII]5007 H
16 [SII]6717+6731 15 H
[NII]6584 [OIII]5007
17 16 [SII]6717+6731
[NII]6584
18
17
120 H (c)
90 [OIII]
60 H 18
vLOS, km s
30 stars
0 120 H (c)
30 90 [OIII]
60 60 H
1
90 stars
vLOS, km s
120 30
150 0
H (d) 30
stars 60
1
100
km s
90
120
LOS,
50 [OIII]/H /2 (e)
0.9 [SII]/H
[NII]/H
1.5
Flux ratio
[OIII]/H /2 (e) 0.6
1.2 [SII]/H
Flux ratio
[NII]/H
0.9
0.3
0.6
0.3 0.0
8.7 S (f)
0.0
12 + log(O/H), dex
(f) O3N2
12 + log(O/H), dex
8.7 S izi
O3N2
izi 8.4
8.4
8.1 8.1
60 40 20 0 20 40 60 60 40 20 0 20 40
R, arcsec R, arcsec
Figure 3. The radial variation of measured parameters for P A1 = 30◦ (left panel) and P A2 = 82◦ (right panel) for Arp 42. From top to bottom: the slit
positions overlaid on the SDSS gri-images (a); observed emission lines fluxes (b); LOS velocity (c); LOS velocity dispersion (d); flux ratios (e); and oxygen
abundance (f). Circles correspond to the different emission lines. Stars demonstrate the stellar kinematical data. Square symbols show the values obtained after
stacking of several adjoining pixels corresponding to single star-forming clumps or to extended regions of fainter emission (see Section 4). For clarity we mark
the estimates having large uncertainties relative to other points at a given plot by pale-colored symbols.
log(FH ) emission lines crossed by slits. As it follows from the diag-
16.00 15.75 15.50 15.25 15.00 14.75 14.50 14.25 14.00
nostic diagrams, (see Fig.6), both faint and bright emission
1.00 1.00 regions, have a photo-ionization as the main mechanism of
0.75 0.75 excitation. However there are few exceptions where the input
0.50 0.50 of collisional excitation, enhancing the [S ii] vs Hα ratios,
0.25 0.25 may be significant. It is noteworthy that all these cases relate
[OIII]5007/H
0.00 0.00 to faint emission regions with low Hα -flux values.
0.25 0.25
0.50 0.50 An oxygen abundance of gas was found by several dif-
0.75 0.75 ferent methods based on the relative intensities of bright
1.00 1.00 emission lines. The results are shown in Fig 5 (bottom left
1.5 1.0 0.5 0.0 0.5 1.5 1.0 0.5 0.0 0.5
[NII]6548+6584/H [SII]6717+6731/H and right panels). The (O/H) distribution along the line con-
necting the centers of two galaxies (Fig 5, bottom left-hand
Figure 4. BPT-diagrams plotted for individual bins along the slit for Arp 42. panel) reveals a significant negative gradient of (O/H) along
The ‘maximum starburst line’ (Kewley et al. 2001) separating photoionised the slit within the distance ∼ 20 arcsec from the nucleus of
H ii -regions and all other types of gas excitation is shown in black; grey NGC 2535 especially for the izi method. At the same time
line from Kauffmann et al. (2003) separates the regions with composite the profile (O/H) along PA= 147◦ evidences the nearly con-
mechanism of excitation. Colour denotes the Hα -flux. stant abundance along the tidal bridge: (O/H) decreases at
about 0.2 dex within 80 arcsec, or 22 kpc length. In accor-
dance with expectation, gas metallicity in the bridge between
MNRAS 000, 1–15 (2019)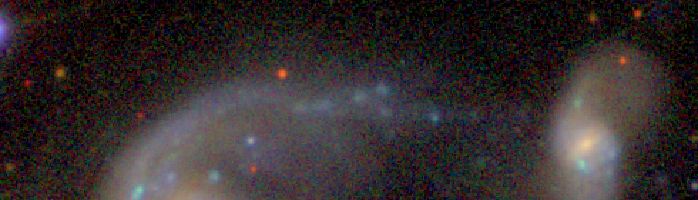
7
S PA = 342 N NW PA = 147 SE
30 (a) 20 (a)
20
10
10
X, 00
X, 00
0 0
10 10
20
30 20
1 log(Flux), erg/s/cm2/arcsec2
1 log(Flux), erg/s/cm2/arcsec2
14 H (b) H (b)
H 15 H
15 [OIII]5007 [OIII]5007
[SII]6717+6731 16 [SII]6717+6731
16 [NII]6584 [NII]6584
17 17
18 18
120 H (c) 120 H (c)
80 [OIII] 80 [OIII]
H 40 H
vLOS, km s
40
vLOS, km s
stars 0 stars
0
40 40
80 80
120 120
150 150
H (d) H (d)
stars stars
1
1
100
km s
100
km s
LOS,
LOS,
50 50
1.8 1.8
[OIII]/H (e) [OIII]/H (e)
1.5 1.5 [SII]/H
[SII]/H
Flux ratio
Flux ratio
1.2 [NII]/H 1.2 [NII]/H
0.9 0.9
0.6 0.6
0.3 0.3
0.0
9.0 0.0
(f) (f)
12 + log(O/H), dex
12 + log(O/H), dex
S S
O3N2 8.7 O3N2
8.7 izi izi
8.4
8.4
8.1
8.1
180 160 140 120 100 80 60 40 20 0 20 40 60 140 120 100 80 60 40 20 0 20
R, arcsec R, arcsec
Figure 5. Same as in Fig. 3, but for Arp 82 P A = 342◦ (left) and P A = 147◦ (right)
.
log(FH ) 5.3 Arp 58
16.00 15.75 15.50 15.25 15.00 14.75 14.50 14.25 14.00
1.00 1.00
For this system we obtained one spectral cut with the slit
0.75 0.75 passing at a distance 2 arcsec (which is close to the seeing)
0.50 0.50 from the center of the satellite (see Fig. 1, bottom panel). The
0.25 0.25 results of the measurements are illustrated in Fig. 7.
[OIII]5007/H
0.00 0.00
0.25 0.25
The difference of systemic velocities of two galaxies in
0.50 0.50
the system is about 60 km s−1 , and the highest LOS velocity
of the main galaxy overlaps with the lowest velocity of its
0.75 0.75
satellite at the side faced to UGC 4457. Nevertheless the
1.00 1.00
1.5 1.0 0.5 0.0 0.5 1.5 1.0 0.5 0.0 0.5 profiles of LOS velocities of both galaxies are different. The
[NII]6548+6584/H [SII]6717+6731/H
main galaxy, unlike its companion, demonstrates a regular
rotation. The measured velocity gradient of stellar population
Figure 6. Same as in Fig. 4, but for Arp 82.
in the central part of the galaxy is a little lower than for
the emission gas, which may be accounted for higher stellar
velocity dispersion in the centre. In contrast, a velocity profile
of the companion is very asymmetrical. It reveals nearly
constant velocity in the NW part of the satellite (towards
the main galaxy), which is close to the stellar velocity in the
galaxies corresponds to metallicity of the outer regions of the centre of galaxy, and a steep velocity gradient on the opposite
main galaxy confirming that it consists of gas expelled from side from the centre. It can indicate the outflow of gas or a
the disc periphery. strong distortion of gaseous layer, which is not unexpected
MNRAS 000, 1–15 (2019)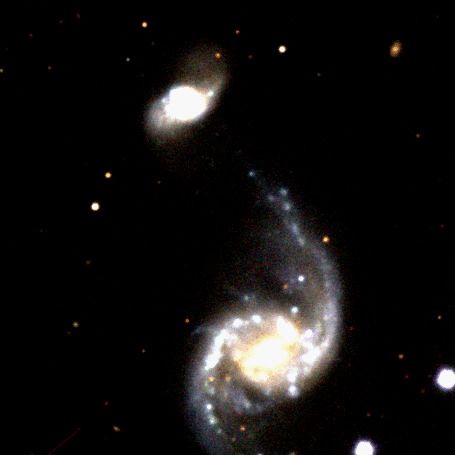
8 Zasov et al.
NW PA = 130 SE strates a decreasing of (O/H) with the distance from the cen-
20 (a)
tre of UGC 4457, however different methods of abundance
10
estimate we used give different absolute values of (O/H) and
X, 00
0 its gradient (see the Discussion below).
10
Fig. 8 compares line ratios for different regions of
Arp 58. Their positions at the BPT diagrams correspond
20
1 log(Flux), erg/s/cm2/arcsec2
14 to the normal H ii regions formed by young stars or to the
H (b)
15 H composite mechanism of excitation. The only outlier point
[OIII]5007 belongs to the center of satellite.
16 [SII]6717+6731
[NII]6584
17
18
150 H (c) 6 DISCUSSION
120
90 [OIII]
60 H
vLOS, km s
30 stars Below we discuss the main results of photometric and spec-
0
30 tral data analysis for three systems in question separately.
60
90
120
150
150
H (d)
stars 6.1 Arp 42
1
100
km s
Dynamic mass of the spiral galaxy NGC 5829 (a compo-
LOS,
50 nent of Arp 42) may be estimated only roughly. Assum-
ing the photometrically defined inclination i ≈ 48◦ given
1.5
[OIII]/H /2 (e) by HYPERLEDA, we obtain the velocity of rotation of the
1.2 [SII]/H
outer disc Vrot of about 110-135 km s−1 . It is in agreement
Flux ratio
[NII]/H
0.9
with HYPERLEDA database, which gives Vrot = 115 ± 3
0.6
km s−1 based on the line width of H i . Total mass within
0.3
0.0
the optical radius may be taken as M(R25 ) = k × Vrot2 R /G
25
(f)
12 + log(O/H), dex
S where k=1 for spherical mass distribution and 0.6 for the flat
9.0 O3N2
izi disc model (Nordsieck 1973). In the former, most expected,
8.7 case M(R25 ) ≈ (6 ± 1) × 1010 M . It agrees with the total
8.4 stellar mass M∗ ≈ 5 × 10¹⁰ M found from photometry of g
and r-band images.
8.1
60 40 20 0 20 40 60 Oxygen abundance in the inner part of the galaxy is
R, arcsec
12 + log (O/H) = 8.4-8.6 for O3N2 and izi methods, and 8.3–
Figure 7. Same as in Fig. 3, but for Arp 58.
8.4 for S method. It is not in conflict with its stellar mass,
at least for O3N2 method (see, e.g., the stellar mass-oxygen
abundance relationship for O3N2 method in Sánchez et al.
log(FH ) 2017), and also agrees with the high relative mass of gas
16.00 15.75 15.50 15.25 15.00 14.75 14.50 14.25 14.00 Mgas
1.00 1.00
(H+He): µ = ≈ 0.35 (see Fig. 10 in Hughes
M∗ + Mgas
0.75 0.75 et al. 2013).
0.50 0.50 Oxygen abundance does not reveal a flattening of radial
0.25 0.25 profile log(O/H) at least up to R25 (see Fig 3), which is often
[OIII]5007/H
0.00 0.00 observed in interacting galaxies (see f.e. Rosa et al. 2014).
0.25 0.25 All methods we used demonstrate a smooth decreasing of
0.50 0.50 O/H along the radius with gradient 0.05-0.1 dex at R25 , see
0.75 0.75 Section 6.4. The directly observable gradient is lower along
1.00 1.00 the slit PA = 82◦ because this slit does not pass through the
1.5 1.0 0.5 0.0 0.5 1.5 1.0 0.5 0.0 0.5
[NII]6548+6584/H [SII]6717+6731/H galactic centre.
As it was noted in the Introduction, the most spectacular
Figure 8. Same as in Fig. 4, but for Arp 58. features of gas-rich spiral galaxy NGC 5829 are two extended
emission regions containing two bright clumps BER1,2, in
the bifurcated northern spiral arm (see Fig.1).
if to take into account the very disturbed appearance of this We estimated colour indices of compact stellar regions
galaxy. BER1,2 from the photometry of SDSS images and corrected
We managed to estimate velocity dispersion of gas and them for Galactic extinction and internal extinction calcu-
stars for the central parts of galaxies only. As in the other two lated from the Hα /Hβ ratio: EB−V ≈ 0.4.Their g-magnitudes
Arp’ systems it does not exceed 50 km s−1 for the emission taken with the surrounding bright emission area of several
gas. Curiously, stellar velocity dispersion for the main galaxy kpc-size, are 17.1m and 17.6m (not corrected for the ex-
is lower than for its satellite evidencing the absence of a tinction), while g-magnitudes of the compact clumps BER1,
significant bulge there. BER2 within the 4 arcsec aperture are 18.2m and 17.8m re-
Oxygen abundance distribution along the slit demon- spectively, which corresponds to luminosities (4-6)×108 L .
MNRAS 000, 1–15 (2019)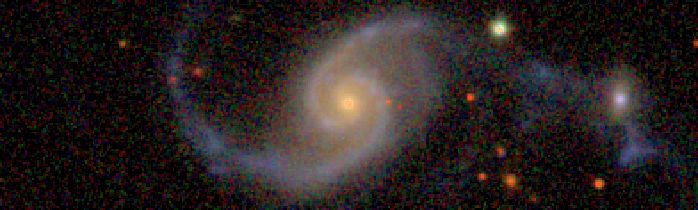
9
Taking into account their blue g-r colours 0.12, 0.16 respec-
tively (corrected for Galactic extinction according to Schlafly
& Finkbeiner (2011)), their stellar masses in the model (Bell                          BER1,2
et al. 2003) are (2-3)×108 M . It exceeds typical masses of                0,6
                                                                                      continuous sf                              2 Gyr

globular clusters, being closer to a a mass of a dwarf galaxy                         instantaneous sf, Kroupa IMF

(for the usually accepted IMF). Accounting for total extinc-                          The brightest SF knots in the N-arm
                                                                           0,4        centre of NGC 5829
tion in g,r-bands has little effect on the determination of the
stellar mass, since it increases the estimate of the luminosity
and about the same decreases the mass to luminosity ratio.                 0,2

                                                                  g-r
     At any rate, BER1,2 are much more luminous than so-                                                               4.4 Gyr
called stellar super-clusters observed in many strongly in-                0,0

teracting or merging galaxies rich of gas, such as Anten-                                          72 Myr 29 Myr
nae where they have properties expected for young massive                 -0,2
                                                                                          14 Myr
globular clusters (Whitmore et al. 2010). The most lumi-                                                     6.6 Myr
                                                                                                         5.8 Myr
nous of the Antennae’ superclusters have absolute magni-
tude MV = −(13 − 14.6), corresponding to luminosity (1-                   -0,4                     5.4 Myr

6)×107 L - that is they are much fainter than BERs! To                             -0,5            0,0        0,5         1,0         1,5          2,0
avoid the conclusion about the enormously big mass of these
stellar clumps one can admit a bottom-light IMF of their                                                       u-g
stellar population.
     Note however, that the Antennae system is at a distance            Figure 9. The (g-r) vs (u-g) diagram for NGC 5829. Open stars show the
of 22 Mpc (against a distance of 78 Mpc for Arp 42), and the            positions of BER1 and BER2. Filled stars and hexagon relate to the bright
mentioned observations (Whitmore et al. 2010) were carried              local sites of star formation in the opposite spiral arm and to the central
out with very high quality (HST). SDSS resolution does not              part of NGC 5829. Black line and gray dashed line follow Starburst99
allow to resolve the images of bright clumps, but they look             model tracks for instantaneous and continuous star formation respectively.
definitely not as point-like sources. The aperture 4 arcsec             We mark the ages of stellar population corresponding to the closest regions
which was applied to the clumps corresponds to the diameter             of the tracks by black and gray printing type for instantaneous and continuous
about 1.5 kpc. Evidently, both BER1,2 are the combination               star formation models correspondingly.
of several bright young stellar complexes (superclusters), sur-
rounded by the extended zone of several kpc size of emission
gas and active star formation.                                          distortion of structure of NGC 5829, the possibility remains
     Extinction-corrected positions of BER1,2 are repre-                that the latter is a result of recent accretion of gas falling
sented as open stars in the two-colour diagram shown in                 onto a northern part of a disc from outside. The accreting gas
Fig.9. They are in satisfactory agreement with Starburst99              could strongly enhance star formation in the regions where
(Leitherer et al. 1999) model tracks for both continuous and            the flow meets the dense native gas concentrations in spiral
instantaneous star formation (for Kroupa IMF Kroupa 2001)               arms. However, the oxygen abundance radial profile does not
and confirm their very young stellar age: t = 5 − 14 Myr.               show any signs of dropping in the region of BERs, which
In turn, the central part of the galaxy (open hexagon), better          in the case of accretion could indicate that either a falling
fits with the model for continuous star formation and evi-              gas is pre-enriched, or the mass of absorbed gas is too small
dently consists of a mixture of stars of different ages, so its         to affect chemistry. More detailed data on the neutral gas
luminosity-weighted age of stellar population is about 4 bil-           dynamics and distribution are needed to verify it.
lions yr. For the comparison we also overplot the position of                The spectra of BER1,2 stand out for their high [O iii]/Hβ
three most luminous clumps of star formation in the oppo-               ratios while having rather moderate [S ii]/Hα and [N ii]/Hα
site spiral arm of NGC 5829 (filled stars), their position is           ratios. It seems that the H ii regions around both stellar
shown by circles in Fig. 1. As one can see, all considered              superclusters containing massive stars are density bound, so
stellar clumps are the regions of current or very recent star           that a significant fraction of ionizing photons is leaking in
formation. At the same time, BER1,2 overwhelm other young               the surrounding gas.
stellar complexes by luminosity and probably by stellar mass                 Curiously, all three emission regions crossed by the slit
significantly.                                                          PA=30◦ , including BER1, reveal velocity gradients within
     What caused a simultaneous burst of star formation in              the range 5–7 arcsec (2–3 kpc), which may be interpreted
two small regions observed at close branches of a bifurcated            as the rotation with respect to the surrounding disc at the
spiral arm, remains a puzzle. It is possible that they are not          same direction as the disc as whole. It is compatible with
unique, we just catch two star-forming regions in the most              the idea that these regions were formed by the compression
luminous phase. These compact regions could not be the                  of rotating gas in the disc. Still it is not evident that the gas
fragments of a dwarf galaxy crossing a disc of the parent               is gravitationally bound at this scale. Note however that if to
galaxy, inspiring a strong shock wave and gas compression,              admit that these regions are close to be virialized, their masses
because BERs seem to be connected with spiral arms, and                 should be an order of a few 108 M , which is compatible with
they do not reveal a significant velocity shift with respect to         the mass estimate of stellar population in BER1.
the adjacent regions. It is worth noting that in the northern                The second spectral cut at PA=82◦ does not demonstrate
half of the galaxy where BERs are observed, a spiral pattern            any significant velocity gradient across the similar-looking
is significantly smoothed or destroyed. As far as we don’t see          emission region BER2. If both young massive stellar com-
any companion which evidently may be responsible for the                plexes – BER1 and 2 – have a similar age and the formation

MNRAS 000, 1–15 (2019)
10 Zasov et al.
mechanism, which seems natural, then their observed kine- brightness bifurcated part of spiral arm NGC2535. The other
matic differences evidence that they do not present a grav- two regions lie in the bridge: one is the closest to NGC2535
itationally coupled systems at kpc-scale. Of course, there and the second relates to the diffuse emission region close
remains a possibility that they are strongly flattened and dy- to NGC 2536. These three areas are better described by the
namically isolated configurations observed at different incli- model with continuous star formation and definitely contain
nation angles (nearly face-on in the case of BER2). not only young, but also the older stars: their colours agree
It is not surprising that the massive stellar complex dis- with constant star formation rate during the last several billion
torts the velocity field around it. Indeed, our observations yr (2-6 Gyr). The same is correct for the central region of
demonstrate the enhanced non-circular gas motions within NGC 2536 which definitely has a large age.
the region of several kpc-size around BER1, however similar As it follows from the abundance profile for
behavior of LOS velocities also takes place in another bright PA=147◦ there is a jump of (O/H) at about 0.2 dex be-
emission region crossed by slit PA 30◦ closer to the centre, tween the bridge and the off-center regions of the main body
in spite of the absence of compact stellar source there. of a small galaxy NGC 2536 (the abundance of gas in the
The second star-forming clump, BER2, does not demon- satellite is higher than in the adjoining regions closer to the
strate any velocity peculiarity. So far as there is no ground main galaxy). It allows to propose that the gaseous bridge
to consider BERs as dynamically detached regions. They be- does not mix with the gas observed in the satellite. The same
long to a disc population and formed recently in the spiral arm conclusion follows from the spectral cut at PA=342◦ : the
branches as the result of some strongly non-stable process. oxygen abundance in the satellite is higher than in the neigh-
bour extended emission "island" located closer to the main
galaxy. This region belongs to the bridge rather than to the
6.2 Arp 82 satellite, because its LOS velocity lays at the continuation
Total luminosity Lr of NGC 2535 is 1.6×10¹⁰ L , and the of the velocity profile of NGC 2535, and differs at about 80
stellar mass M∗ corresponding to its colour (g-r), obtained km s−1 from the central velocity of the satellite. The oxygen
from SDSS image, is 5.6×10¹⁰ M for Bell et al. (2003) abundance of this region coincides with that observed in the
model of stellar population. Similarly found stellar mass for bridge (see Fig.5).
NGC 2536 is 8.7×10⁹ M . Based on the mass-metallicity The absence of clear signs of gas exchange between
relation described in Sánchez et al. 2017 for the O3N2 galaxies agrees with Klaric’ dynamic model of the interacting
calibrator, these mass values agree with the oxygen abun- system, which shows that the bridge intersects NGC 2536
dances of galaxies (8.5 - 8.6 for NGC 2535 and about 8.4 for only in projection, so the satellite is a little closer to us (see
NGC 2536). Kaufman et al. 1997). In this case the enhanced star formation
Our observations confirm the regular rotation of NGC in the satellite is not a result of collision with the gas flowing
2535 and a smooth velocity distribution along the bridge, along the bridge, but rather is caused by internal processes
connecting two galaxies. In contrast, there is a strong non- triggered by tidal disc disturbance.
circular gas motion in the satellite galaxy – both in the central The other interesting feature of NGC 2535 is the faint
part and in the spiral arm adjacent to the bridge. At the same trace of the third spiral arm, which branches off the bright
time the velocity dispersion of emission gas, estimated from arm running to the satellite. First it was noted by Hancock
the linewidths, remains low along the bridge, evidencing the et al. (2007). A faint branch is easily visible at the SDSS and
laminar flow of gas, being a little shifted by velocity from the GALEX images in Fig.11, where the direction of branching
stellar component of the bridge. spiral arms are marked by arrows. This narrow arm pos-
To find out the age of stellar population in the starforming sesses blue color and looks symmetric with respect to oppo-
sites of Arp 82, in Fig.10 we show the position of selected site, northern arm. It seems that we see the residual arm of
emission regions crossed by the slits between the main body symmetric (in the past) spiral structure of the galaxy, existed
of NGC2535 and its satellite, as well as for the central part of before the encounter happened. Most probably, a tidal force
NGC2536 (identified with circles in Fig. 1) at the (g-r) vs (u- imposed a new mode of the density wave in the disc, which
g) diagram. Colours were estimated from the photometry of gave rise to the arm-bridge, while the previous mode had not
SDSS images and corrected for extinction calculated from the yet time to die totally out. Note in advance that similar feature
Hα /Hβ ratio: EB−V ≈ 0.15. The local sites of star formation is also noticeable in Arp 58 (see the next subsection).
in the spiral arm (bridge) are shown by stars, the hexagone
gives the position of the satellite. Open star corresponds to 6.3 Arp 58
the diffuse region between galaxies where the bridge spiral
arm seems to be splitting (see below). In many respects this system is similar to Arp 82, described
Evolution tracks in the Fig. 10 are shown for two models: in the previous section, although it is less studied, and the
instantaneous star formation (black line) and constant star masses ratio of the main galaxy and the satellite in Arp 58 is
formation rate (gray dashed line). Colours of the regions significantly higher than in the former case. In both systems
encircling blue stellar clumps and diffuse emission in the we have a long tidal tail of the main galaxy and a bluish
spiral arm (bridge) marked by stars are in good agreement bridge-like spiral arm, connecting two galaxies. Most prob-
with the model track for instantaneous star formation and ably, this arm does not end on the satellite galaxy, but rather
correspond to the prevailing input of the light of young stars, pass a little further projecting onto it. For Arp 82 a similar
so their luminosity-weighted age is less than 10 Myr (most proposal was argued above, and in the case of Arp 58 such
probably, in the range 7.5-8 Myr). possibility is based on the colour image of the system, espe-
The situation is different for the other emission regions. cially in UV light (see the combined FUV and NUV GALEX
One of them, denoted by open star, is situated in the low image in Fig.12), where the blue spiral arm looks projecting
MNRAS 000, 1–15 (2019)11
spiral arm
continuous sf
0,6 2 Gyr
instantaneous sf, Kroupa IMF
the split region of spiral arm
NGC 2536
0,4
6 Gyr
0,2
g-r
7.8 Myr
0,0 2 Gyr
1 Gyr
0.2 Gyr
-0,2
-0,4
5.5 Myr
-0,5 0,0 0,5 1,0 1,5 2,0
u-g
Figure 10. The (g-r) vs (u-g) diagram. Filled stars show the position of star
forming sites in the spiral arm of NGC 2535. Open star relates to the diffuse
region of the spiral bridge. Open hexagon gives the position of the small
companion galaxy NGC 2536. Black and gray lines demonstrate Starburst99
model tracks for instantaneous and continuous star formation respectively.
We mark the ages of stellar population corresponding to the closest regions
of the track by black and gray printing type for instantaneous and continuous
star formation models correspondingly.
on the satellite galaxy. In this case a blue ejection-like feature
emanating from the body of a satellite may be considered as
the continuation of UV bridge-arm of the main galaxy. A
noticeable dark gap between this feature and the satellite is
especially prominent in the UV GALEX image, which, if it
is accounted for the dust extinction in the satellite, evidences
that the bridge arm is behind the satellite.
Another curious detail that is evident from the UV-image Figure 11. Combined GALEX FUV and NUV-bands with overplotted ar-
is the faint offshoot of the spiral arm-bridge at about a half- rows showing the position of bifurcated spiral arms (top) and SDSS images
way between the centers of the galaxies. This thin arc-like of Arp 82 (bottom).
spur looks symmetric with respect to the opposite arm of the
main galaxy, similarly to that in Arp 82.
A symmetric gas velocity profile of UGC 4457 allows image which gives a slightly lower mass value. Indeed, we
to restore its rotation velocity curve. It is presented in Fig 13 found the total luminosity of galaxy Lr ≈ 3.2 × 10¹⁰ L and
for the adopted inclination angle i = 65◦ and position angle the observed g − r = 0.68 (corrected for Galactic extinction),
(P A)0 = 164.4◦ taken from HYPERLEDA. The curve grows corresponding to M∗ /Lr ∼2.8 solar units according to the
slowly, reaching maximum or flat region of the curve at about model of Bell et al. (2003), which gives M∗ ≈ 9 × 10¹⁰ M .
11–12 arcsec, although the presence of non-circular gas mo- Here the internal extinction is ignored; taking it into account
tion is evident at larger distances. The ‘knee’ (a change of will reduce the mass estimate due to the lower colour index
gradient of gaseous velocity curve) at R∼ 3–6 arcsec most and M∗ /Lr ratio, however it will be compensated by the de-
probably does not reflect a mass distribution: at these dis- creasing of Lr . Note that the estimation of dynamical mass is
tances the slit crosses the bright spiral arm where radial also very preliminary. The additional velocity measurements
non-circular velocities are quite expected. are needed to clarify (P A)0 of major axis and the inclination
The main galaxy in Arp 58 does not possess a noticeable angle of the disc.
bulge, so the upper limit of mass of stellar population of the The emission regions between two galaxies, crossed by
disc may be estimated if to admit that its circular velocity does the slit, keep their LOS velocity close to those observed in the
not exceed the maximal measured velocity of rotation, reach- adjacent part of UGC 4457. Unlike UGC 4457, the satellite
ing Vmax ∼ 230 km s−1 at R=Rmax ≈ 12 arcsec. For a disc with does not reveal a regular rotation: its half faced to the main
exponential mass distribution it corresponds to the dynamic galaxy demonstrate a zero LOS velocity gradient which is
max /G = 1.26×10 M . Accounting
mass Mdisc12 Zasov et al.
R/R25
0.0 0.5 1.0 1.5 2.0 2.5
9.0
izi: (O/H)=-0.0037±0.0003 dex/kpc
S: (O/H)=-0.0060±0.0004 dex/kpc
8.8 O3N2: (O/H)=-0.0028±0.0008 dex/kpc
12+log(O/H)
8.6
8.4
8.2
Arp42
8.0
0 5 10 15 20 25 30 35 40 45
R, kpc
R/R25
0 1 2 3 4
9.0
izi: (O/H)=-0.0102±0.0007 dex/kpc
S: (O/H)=-0.0065±0.0010 dex/kpc
8.8 O3N2: (O/H)=-0.0047±0.0005 dex/kpc
12+log(O/H)
8.6
Figure 12. Combined GALEX FUV and NUV-bands image of Arp 58 with 8.4
overplotted arrows showing the position of bifurcated spiral arms.
8.2
Arp82
300 8.0
0 10 20 30 40 50
250 R, kpc
Velocity, km s-1
200 R/R25
0 2 4 6 8 10
150 9.0
izi: (O/H)=-0.0072±0.0022 dex/kpc
100 S: (O/H)=-0.0038±0.0011 dex/kpc
50 8.8 O3N2: (O/H)=-0.0026±0.0013 dex/kpc
0
12+log(O/H)
-50 8.6
0 10 20 30 40
R, arcsec 8.4
Figure 13. The Hα rotation curve of Arp 58.
8.2
Arp58
M∗ ≈ 8.5×10⁸ M
and M/Lr = 0.71 solar units (not corrected 8.0
0 20 40 60 80 100 120 140
for inner absorption). R, kpc
Line intensity ratios at the BPT diagrams show that the
emission regions in Arp 58 correspond to H ii-spectra of Figure 14. From top to bottom: the radial profiles of oxygen abundance of
photoionized gas and – in some regions – to the composite Arp 42, Arp 82 and Arp 58 (reduced to the disc plane of the main galaxy).
spectra. A special case is the single outlier at the diagrams The gradients were estimated by robust least-square fitting of the values for
in Fig.8 for Arp 58, revealing the highest ratios of ion-to-Hα a disc of the main galaxy. The points related to the satellites are denoted by
diamonds (assuming that they lay in the disc plane).
lines intensities. It belongs to the extended emission region
in the center of the satellite galaxy, and may be considered
as the indirect evidence of the moderate AGN-activity. In all three cased the gradients are shallow, not exceeding
-0.01 dex kpc−1 . It agrees with the lower abundance gradi-
6.4 Oxygen abundance gradients
ents usually found for galaxies in close pairs (Kewley et al.
2010; Rosa et al. 2014) and for interacting or merging galax-
Fig. 14 shows the profiles of oxygen abundance as a func- ies (Rupke et al. 2010; Rich et al. 2012) in comparison with
tion of the inclination-corrected distance from the centre of single galaxies, which may be accounted for the radial mixing
the main galaxy (reduced to its disc plane for the adopted of gas inspired by interaction. It is interesting, that at large ra-
inclination angle) and their linear fits for all three galaxies. dial distances the flattening of gradient is often observed even
This figure excludes all points with the suspected significant for non-interacting galaxies (Sánchez et al. 2014; Sánchez-
contribution of non-photoionization mechanism of excitation Menguiano et al. 2016, 2018), that is the mean abundance
according to their positions at the diagnostic diagrams. Here gradient decreases when the outskirts of galaxies are taken
we remind the reader that all regions with the suspected DIG into consideration. Two of the studied systems reveal simi-
contribution having EW(Hα) < 3 have also been excluded lar behaviour. The abundance gradients we estimated were
from the analysis. In order to rely on the high S/N data we measured along the radial coordinate (corrected for the disc
use the estimates obtained for stacked spectra only (squares inclination), including the regions of tidal bridges in Arp 82
in Figs. 3, 7, 5) for estimating the metallicity gradients. and Arp 58. Taken separately, these outer regions do not re-
MNRAS 000, 1–15 (2019)You can also read