Next chapter: Balanced CFs. Higher shareholders returns - GAZPROM INVESTOR DAY 2020

Page created by Sergio Hodges
 
CONTINUE READING
Next chapter: Balanced CFs. Higher shareholders returns - GAZPROM INVESTOR DAY 2020
Next chapter: Balanced CFs.   GAZPROM
                                             INVESTOR DAY
               Higher shareholders returns   2020

0 | STRATEGY
Next chapter: Balanced CFs. Higher shareholders returns - GAZPROM INVESTOR DAY 2020
DISCLAIMER
This presentation, including a hard copy of these slides, the information communicated during any delivery of the presentation, both oral and written, and any question and answer session and any document or material
distributed at or in connection with the presentation and all information contained therein including any information provided by or obtained from third parties (together, "Presentation") has been prepared by PJSC
Gazprom and its consolidated subsidiaries (together, the "Company") solely for the purpose of presenting information about the Company to a number of parties who have expressed an interest in obtaining information
about the Company. By attending the presentation, you agree to be bound by the following terms. This Presentation may not be reproduced, retransmitted or further distributed to the press or any other person or
published, in whole or in part, for any purpose. Failure to comply with this restriction may constitute a violation of the applicable securities laws. This Presentation does not constitute or form part of any offer or
invitation to sell or issue, or any solicitation of any offer to purchase or subscribe for, any shares or other securities representing shares in the Company, nor shall it, any part of it or the fact of its Presentation or
distribution form the basis of, or be relied on in connection with, any contract or investment decision. No reliance may be placed for any purposes whatsoever on the information or opinions contained in this
Presentation, or any other material discussed at the presentation or on its completeness, accuracy or fairness. The information in this Presentation should not be treated as giving investment advice. To the extent
available, the industry, market and competitive position data contained in this Presentation come from official or third party sources. Care has been taken to ensure that the facts stated in this Presentation are accurate,
and that the opinions expressed are fair and reasonable. However, the contents of this Presentation have not been verified by the Company. To the extent third party industry publications, studies and surveys generally
state that the data contained therein have been obtained from sources believed to be reliable, but that there is no guarantee of the accuracy or completeness of such data. Accordingly, undue reliance should not be
placed on any of the industry, market or competitive position data contained in this presentation. The information contained herein is subject to change without notice. None of the Company or any of its managers or
directors are under an obligation to update or keep current the information contained in this Presentation. Accordingly, no representations or warranties of any kind are made by any person as to the accuracy of such
statements, estimates or projections, or that any of the events expressed or implied in any such statements, estimates, opinions or projections will actually occur. The Company is not under any obligation, and expressly
disclaims any intention, to update or revise any such statements, estimates or projections. No statement in the Presentation is intended as a profit forecast or a profit estimate. Neither the Company, any third party, nor
any of their respective directors, officers, partners, employees, agents, affiliates, representatives or advisors, accept any duty or responsibility to you, whether in contract or in tort (including without limitation,
negligence and breach of statutory duty), misrepresentation, restitution or otherwise (in each case whether caused by negligence or otherwise) and shall, to the fullest extent permissible by law, not be liable in respect
of any loss, damage or expense of whatsoever nature, howsoever caused, whether by any use you may choose to make of the Presentation or any reliance placed upon the Presentation or its contents or which is
otherwise consequent upon the provision of the Presentation to you.

This presentation includes "forward-looking statements," which include all statements other than statements of historical facts, including, without limitation, any statements that are preceded by, followed by or include
the words "targets," "believes," "expects," "aims," "intends," "will," "may," "anticipates," "would," "plans," "could" or similar expressions or the negative thereof. Such forward-looking statements involve known and
unknown risks, uncertainties and other important factors beyond the Company's control that could cause the actual results, performance or achievements of the Company to be materially different from future results,
performance or achievements expressed or implied by such forward-looking statements. Such forward looking statements are based on numerous assumptions regarding the Company's present and future business
strategies and the environment in which the Company will operate in the future. By their nature, forward-looking statements involve risks and uncertainties because they relate to events and depend on circumstances
that may or may not occur in the future. Accordingly, any reliance you place on such forward-looking statements will be at your sole risk. These forward-looking statements speak only as at the date as of which they are
made, and neither the Company or any of its respective agents, employees or advisors intends or has any duty or obligation to supplement, amend, update or revise any of the forward-looking statements contained
herein to reflect any change in the Company's expectations with regard thereto or any change in events, conditions or circumstances on which any such statements are based. In addition, even if the Company's results of
operations, financial condition and liquidity and the development of the industry in which the Company operates are consistent with the forward-looking statements contained in this Presentation, those results or
developments may not be indicative of results or developments in future periods. The information and opinions contained in this Presentation are provided as at the date of this Presentation and are subject to change
without notice. No person is under any obligation to update or keep current the information contained herein.

1 |
Next chapter: Balanced CFs. Higher shareholders returns - GAZPROM INVESTOR DAY 2020
MR KIRIL POLOUS
Head of Directorate, Gazprom

    2 | STRATEGY
Next chapter: Balanced CFs. Higher shareholders returns - GAZPROM INVESTOR DAY 2020
GAZPROM INVESTOR DAY 2020

  NATURAL GAS IS THE FUEL OF THE FUTURE

  SHARE OF NATURAL GAS IN THE ENERGY MIX                                                                     GLOBAL NATURAL GAS SUPPLY VIA PIPELINE / LNG

     0%          5%    10%   15%     20%      25%      30%      35%      40%        45%     50%     55%             0%                    20%    40%               60%           80%          100%

        World                       2018        2030

        Russia                                                                                                                                         89%                              11%
                                                                                                             2018
        North America
        Central and
        South America
        Europe

        Africa
                                                                                                                                                       84%                              16%
        Asia Pacific

        China
                                   “The G20 energy ministers recognize the key
                                   role that natural gas currently plays for many
                                                                                              G20            2030

                                                                                         MEETING
                                   G20 countries and its potential to expand
        India                                                                          ON ENERGY                                                        Pipeline         LNG*
                                   significantly over the coming decades…”
                                                                                      COMMUNIQUÉ
                                                                                                                    *Excluding small-scale LNG
   Source: IEA                                                                                                      Source: IHS Markit
                                                                                          JUNE 2019, JAPAN

THE ROLE OF NATURAL GAS IS EXPECTED TO STRENGTHEN, WHILE PIPELINE WILL BE THE BACKBONE OF ITS TRANSPORTATION

3 | STRATEGY
Next chapter: Balanced CFs. Higher shareholders returns - GAZPROM INVESTOR DAY 2020
GAZPROM INVESTOR DAY 2020

  GAZPROM’S ENVIRONMENTAL PERFORMANCE
   NEARLY “ZERO” METHANE EMISSIONS ACROSS SUPPLY CHAIN                                                            BEST AMONG PEERS IN TERMS OF CARBON INTENSITY
                                                                                                                    400

                                                                                                     kgCO2e/boe
                       0.02%                                           0.26%                0.03%                   350

     PRODUCTION                                       TRANSPORT                        STORAGE
                                                                                                                    300
                                                                                                                               Gazprom Peer 1
                                                                                                                               Gazprom                        Peer 2        Peer 3         Peer 4         Peer 5         Peer 6     Peer 7    Peer 8
   Verified by: KPMG                                                                                              Source: CDP; Peers in alphabetical order: BP, Chevron, Eni, Equinor, Petrobras, Repsol, Shell, Total

   EMISSIONS REDUCTION ROADMAP                                                                                    GAZPROM’S CLEAN ENERGY: FUTURE VISION*
    100%                                                                                                                            PHASE 1                                     PHASE 2                                    PHASE 3
                                                                                       Min.: Max.:
     90%                                                                               -16% -23%
                                                                                                                                        methane                                                                                   hydrogen
                                                                                                                                                                                       CH4 + H2                                     H2
     80%                                                                                                                                  CH4
     70%
                   2014 (base year)                     2020                    2025      2030
    Source: Roadmap on specific GHG emission reduction in Gazprom (2020-2030)                                                     * «PJSC Gazprom Pathways to 2050: Opportunities for the EU, 2018» (initiative submitted to the European Comission)

GAZPROM IS ALREADY THE LEADER OF THE OIL & GAS SECTOR IN TERMS OF CARBON INTENSITY;
ADDITIONAL EFFORTS ARE MADE IN ORDER TO DIMINISH CARBON FOOTPRINT AND PROMOTE SUSTAINABLE DEVELOPMENT
4 | STRATEGY
Next chapter: Balanced CFs. Higher shareholders returns - GAZPROM INVESTOR DAY 2020
GAZPROM INVESTOR DAY 2020

   2019 RESULTS

                                 NATURAL GAS             SUPPLIES TO               SUPPLIES TO                         EASTERN SIBERIA:
                                                                                                                                                         YAMAL:
                                  RESERVES*               EUROPE*                     FSU*                              Chayandinskoye
                                                                                                                                                  Kharasaveyskoye
                                  35 TCM                199 BCM                    38 BCM                               started production,
                                                                                                                      supplies of natural gas
                                                                                                                                                full scale development
                                                                                                                                                        launched
                            1243 tcf (16% of global)       19.3 bcf/d                3.7 bcf/d                                and oil

                  MARKET CAP                                      DOMESTIC SUPPLIES                     DOMESTIC MARKET                                       GAS PROCESSING
                 GROWTH IN 2019
                                             UNIQUE                   RUSSIA*                           3.7 bcm 0.4 bcf/d regas    ACHIEVE-                 Ust-Luga: start of project
                        +87%
            (END 2019 TO END 2018 IN USD)   POSITION                238 BCM                             capacity in Kaliningrad
                                                                                                           1700 km of new           MENTS
                                                                                                                                                                 implementation
                                                                                                                                                                Amur GPP: >50%
                                                                        23 bcf/d                               pipelines                                          completed

                                 NATURAL GAS             SHARE OF NON-                  POWER OF SIBERIA
                                 PRODUCTION*           SHALE PRODUCTION                                                  TURKSTREAM             TRANSIT AGREEMENT
                                                                                         Chayanda to China part
                                500 BCM                   100%                          launched in 2019, start of
                                                                                        pipeline exports to China
                                                                                                                     Construction completed,
                                                                                                                        launched in 2020
                                                                                                                                                   WITH UKRAINE
                                                                                                                                                     REACHED
                            48 bcf/d (12% of global)
 *Figures are rounded
 and can be revised

GAZPROM STRENGTHENS ITS LEADING POSITION AMONG GLOBAL ENERGY COMPANIES

5 | STRATEGY
Next chapter: Balanced CFs. Higher shareholders returns - GAZPROM INVESTOR DAY 2020
GAZPROM INVESTOR DAY 2020

  PERSPECTIVE COMMISSIONINGS
                   2019                                         2020–2025                                                                2026–2030

                                                                                                                                            Kruzenshternskoye
                                                                               Kamennomysskoye-more       Bovanenkovskoye
                                                                                                          (Neocomian-Jurassic)
                                        Gryazovets – Slavyanskaya CS                Kharasaveyskoye
                                                                Urengoyskoye        (Cenoman-Aptian)                                                      Tambeyskoye
                                              Kovyktinskoye                        Yuzhno-Kirinskoye
               Chayandinskoye                                   (Achimov deposits)
                                                                                                                       Severo-Kamennomysskoye
                                        TurkStream Sakhalin–Khabarovsk–Vladivostok expansion
           Power of Siberia                               Power of Siberia            Ukhta–Torzhok–3
                                        Nord Stream 2     (Kovykta–Chayanda)                                                     Other fields
           (Chayanda to China border)
                                                                                   Bovanenkovo–Ukhta–3                                             Kharasaveyskoye
                                        Portovaya LNG        Amur GPP                                                                              (Neocomian-Jurassic)
                                                                                    Ust-Luga GPP + LNG

                                                                                    Commissioning dates subject to negotiations results

 Field Pipeline Processing / LNG                                         Far Eastern Route      Sakhalin 2 LNG 3rd train              Power of Siberia – 2

PERSPECTIVE DEVELOPMENT IS LINKED TO NEW PROJECTS ALONG THE ENTIRE SUPPLY CHAIN,
INCLUDING UPSTREAM, TRANSPORTATION, PROCESSING AND LIQUEFACTION
6 | STRATEGY
Next chapter: Balanced CFs. Higher shareholders returns - GAZPROM INVESTOR DAY 2020
GAZPROM INVESTOR DAY 2020

  GAZPROM’S STRATEGY: TARGETS

  PRODUCTION                                PROCESSING                                   RUSSIAN GAS MARKET

  TARGET: ENSURE SUSTAINABLE                TARGET: DIVERSIFY REVENUE SOURCES            TARGET: ENHANCE ENERGY SECURITY
  COST-COMPETITIVE PRODUCTION               AND FULLY MONETISE “RICH” GAS

  EXPORTS TO EUROPE                         EXPORTS TO CHINA                             ECONOMICS

  TARGET: STRENGTHEN THE POSITION           TARGET: FURTHER DIVERSIFY EXPORT MARKETS &   TARGET: ENSURE CONSTANT ECONOMIC
  OF THE LEADING SUPPLIER TO THE EUROPEAN   SIGNIFICANTLY INCREASE EXPORT VOLUMES        PERFORMANCE IMPROVEMENT AND DIVIDEND
  MARKET                                                                                 GROWTH

7 | STRATEGY
Next chapter: Balanced CFs. Higher shareholders returns - GAZPROM INVESTOR DAY 2020
GAZPROM INVESTOR DAY 2020

    PRODUCTION
MAIN GAS PRODUCTION CENTERS, FIELDS TO BE DEVELOPED AND SEND-OUT TRUNK PIPELINES TO BE LAUNCHED BY 2030
(FIELDS ANNUAL PROJECT CAPACITY)

                              YAMAL PENINSULA                                                   EASTERN SIBERIA &
                               PRODUCTION FIELDS
                                                                                               THE RUSSIAN FAR EAST
 Bovanenkovo                             140 bcm/year (13.5 bcf/d)
     Cenomanian-Aptian deposits*              115 bcm/year (11.2 bcf/d)                             PRODUCTION FIELDS
     *Launched in 2018
     Neocomian-Jurassic deposits              25 bcm/year (2.4 bcf/d)
                                                                                        Chayandinskoye         25 bcm/year (2.4 bcf/d)
 Kharasaveyskoye                         50 bcm/year (4.8 bcf/d)
     Cenomanian-Aptian deposits               32 bcm/year (3 bcf/d)                     Kovyktinskoye          25 bcm/year (2.4 bcf/d)
     Neocomian-Jurassic deposits              18 bcm/year (1.8 bcf/d)                            SEND-OUT TRUNK PIPELINES
 Kruzenshternskoye                       33 bcm/year (3.2 bcf/d)                        Kovykta–Chayanda (Power of Siberia)
                         SEND-OUT TRUNK PIPELINES                         R U S S I A
 Bovanenkovo-Ukhta-3, Ukhta-Torzhok-3

  OB and TAZ BAYS & NADYM-PUR-TAZ area
                               PRODUCTION FIELDS                                                   SEA OF OKHOTSK
 Kamennomysskoye-more            15.1 bcm/year (1.5 bcf/d)                                          PRODUCTION FIELDS
 Severo-Kamennomysskoye 14.5 bcm/year (1.4 bcf/d)                                       Kirinskoye            5.5 bcm/year (0.5 bcf/d)
 Urengoyskoye (Achimov deposits) 37.5 bcm/year (3.6 bcf/d)                              Yuzhno-Kirinskoye     21 bcm/year (2 bcf/d)
     Blocks 1-2*                              22 bcm/year (2.1 bcf/d)
     *Launched in 2008-2009                                                                      SEND-OUT TRUNK PIPELINES
     Blocks 4-5                               15.5 bcm/year (1.5 bcf/d)
          LEGACY PRODUCTION CENTER, NO NEW TRUNK PIPELINES NEEDED
                                                                                        Sakhalin–Khabarovsk–Vladivostok expansion

 PLANS UP TO 2030 INCLUDE DEVELOPMENT OF WORLD-CLASS GAS PRODUCTION CENTERS AND MEGAFIELDS
 ONSHORE AND OFFSHORE, WHICH WILL ENSURE SUSTAINABLE COST-COMPETITIVE PRODUCTION FOR DECADES
8 | STRATEGY
Next chapter: Balanced CFs. Higher shareholders returns - GAZPROM INVESTOR DAY 2020
GAZPROM INVESTOR DAY 2020

   PROCESSING
13 mmt
LNG                                                                                     AMUR GAS PROCESSING PLANT
                                       UST-LUGA GPP
                                                                                       STATUS                                     >50% completed
                           Ust-Luga
                                                                                       COMMISSIONING                                     2021
                          19 bcm                                                       DESIGN CAPACITY                                   2025
2.4 mmt
LPG                       METHANE                  RUSGAZDOBYCHA GCF                   GAS FOR PROCESSING                              42 bcm
                                      3.8 mmt
                                      ETHANE                                           FINANCING                                project finance (70%)

                                                              RUSSIAN FEDERATION
         COMPLEX FOR PROCESSING “RICH” GAS
         AND LNG PRODUCTION IN LENINGRAD REGION                                                       SIBUR GCF
                                                                                        2 mmt                                     GPP - Gas Processing Plant
                                               FEED                                     ETHANE                     ~ 1.5 mmt      GCF - Gas Chemical Facility
     STATUS                                                                                                          LPG
                                               2023
     COMMISSIONING                                                                   AMUR GPP
     DESIGN CAPACITY
                                               2024
                                                                                        Blagoveshchensk
                                              45 bcm
     GAS FOR PROCESSING
                                      JV with RusGazDobycha
     FINANCING
                                         +project finance
                                                                                                                                             60 mmcm
                                                                              38 bcm CHINA                Vladivostok
                                                                                                                                             HELIUM
                                                                              METHANE

PROCESSING IS A PRACTICAL REALISATION OF THE NEW ECONOMIC MODEL FOR THE COMPREHENSIVE MONETISATION
OF HYDROCARBON RESOURCES
9 | STRATEGY
RUSSIAN GAS MARKET
             RUSSIAN GAS CONSUMPTION                                     SHARE OF APARTMENTS AND HOUSEHOLDS                RUSSIAN GAS PRODUCTION
                                                                         SUPPLIED WITH NATURAL GAS
                                                                                                                     950                        924
      550                                                       53                                                                                    88
                                                                                                                     900
                                                                                                                                                      83
                                                                                                                     850
                                                                                                                                      821
                                                      520                                                            800                              78
                                     510                        50
                                                                                                                                                      73
                                                                                                                     750     728

                                                                                                                                                           bcf/d
                                                                                                               bcm
                                                               bcf/day
bcm

      500        494                                                                                                 700                              68
                                                                                                 69%                                                  63
                                                                                                                     650
                                                                47                                     75%
                                                                                                                     600                              58
                                                                                          2018
                                                                                                                     550                              53

      450                                                                                 2024           83%
                                                                44                                                   500                              48
                 2018
                 2018                2024
                                    2024               2035
                                                      2035                                                                  2018
                                                                                                                             2018     2024
                                                                                                                                      2024     2035
                                                                                          2035
        Source: Ministry of Energy of the Russian Federation

        RUSSIAN MARKET HAS POTENTIAL FOR FURTHER GROWTH,
        GAZPROM WILL REMAIN THE KEY PLAYER WITH STABLE SHARE IN PRODUCTION AND SUPPLIES IN LONG-TERM OUTLOOK
       10 | STRATEGY
GAZPROM INVESTOR DAY 2020

  LEGAL FRAMEWORK IN RUSSIA

  ENERGY SECURITY DOCTRINE              PROVISIONS OF THE ENERGY SECURITY DOCTRINE OF THE RUSSIAN FEDERATION:
  SIGNED BY THE PRESIDENT OF RUSSIA
                                                TECHNOLOGICAL UNITY, RELIABILITY, SECURITY OF UNIFIED GAS SYSTEM

                                          «     Technological unity, reliability, manageability, continuous operations and safety of Unified
                                                gas supply system, Unified energy system, Unified system of trunk pipelines for
                                                transportation of oil and oil products
                                                                                                                                               »
                                                ELIMINATION OF THE COMPETITION IN EXPORT MARKETS BETWEEN RUSSIAN
                                                SUPPLIERS OF ENERGY RESOURCES

  Source: kremlin.ru

  CREATES STABLE LEGAL FRAMEWORK
  FOR RUSSIAN ENERGY SECTOR
                                          «     Development of competition in fuel and energy complex in the domestic market while
                                                eliminating such competition between various energy resources from Russia in international
                                                energy markets that contradicts economics interests of the Russian Federation                  »
THE ENERGY SECURITY DOCTRINE OF THE RUSSIAN FEDERATION SUPPORTS THE EXCLUSIVE POSITION OF GAZPROM
IN ТНЕ RUSSIAN GAS INDUSTRY
11 | STRATEGY
GAZPROM INVESTOR DAY 2020

   EXPORTS
                                                                                     2019                                                                                                      2030
                                                              West                  existing            East                                                     West                       perspective             East
    Major export routes, projects

                                             Nord Stream                                                                               Nord Stream 2 **
                                                                                                                                                   Portovaya LNG**
                                                                                                                                                  Ust-Luga project
                                                                   Yamal-Europe                                                                                                                                      Sakhalin 2 LNG
                                                                                  RUSSIA                       Sakhalin 2                                                                   RUSSIA                   3rd train***
                                                                   Via Ukraine                                                                                                                       Power of
                                                  TurkStream*                                                                                                                                        Siberia-2***    Far Eastern
                                                                                          Power of Siberia
                                                                                                                                                                                                                     Route***
                                                            Blue Stream

       Exports
                                                                                         >95%                                                                                                      70%                       30%

                                                                                                                       East 95%                                                                                                       90%

                                                                                                                       LNG
GAZPROM INVESTOR DAY 2020

   EXPORTS TO EUROPEAN MARKET

        RUSSIAN PIPELINE GAS EXPORT                                            POTENTIAL RUSSIAN PIPELINE GAS                                                                        LONG-TERM PROJECTIONS OF
                                                                               SEND-OUT CAPACITIES                                                                                   EXPORT VOLUMES TO EUROPE
             250                  Export capacity potential                               250
                     Supplies arranged through                                                                                                                 via
                     Electronic Trading Platform
                                                              20
                                                                                                                                                             Ukraine
                                                                                                                                                                       20            202    199
             200                                                                          200
                                                                                                                                                     via
                                                                                                                                                   Belarus
                                                                                                                                                                                     bcm
                                                                                                                                                                                            bcm                 ~200    bcm / year
                                                                                                                                      to Finland
             150                                              15                                                                                                       15
                                                                                          150                                 Turk
  bcm/year

                                                                               bcm/year
                                                                                                                             Stream

                                                                   bcf/day

                                                                                                                                                                           bcf/day
                                                                                                                     Blue
                                                                                                                    Stream
             100                                              10                          100                                                                          10
                                                                                                           Nord
                                                                                                         Stream 2

             50                                               5                           50                                                                           5
                                                                                                 Nord
                                                                                                Stream                                                                                                 Local
                                                                                                                                                                                                          Local     Climate
                                                                                                                                                                                                                       Climate      Coal
                                                                                                                                                                                                                                   Coal      Nuclear
                                                                                                                                                                                                                                            Nuclear
                                                                                                                                                                                                   supply decline    goals
                                                                                                                                                                                                      supply decline goals       phase-out Phase-out
                                                                                                                                                                                                                                 phase-out  Phase-out
              0                                               0                            0                                                                           0
                   2018                     2019                                                                                                                                     2018   2019                                              2030
    Source: Gazprom Export                                                   *Far abroad countries, not including Latvia, Lithuania and Estonia

GAZPROM IN THE EUROPEAN MARKET IS BUYER-ORIENTED, PROVIDING OPPORTUNITIES TO USE FLEXIBLE MARKET MECHANISMS AND
ENSURING SECURE DELIVERIES VIA NEW EFFICIENT PIPELINES
13 | STRATEGY
GAZPROM INVESTOR DAY 2020

  EXPORTS TO CHINA
  SUPPLY ROUTE                       COST+ ESTIMATES IN THE TARGET                                               POWER OF SIBERIA’S SHARE IN
                                     CHINESE REGIONS BY WOOD MACKENZIE*                                          CHINA’S INCREMENTAL GAS SUPPLY**
                                                                                                                                             (to 2019 base year***)
                                       NORTH-EAST
                                                                                                                                 Power of Siberia (lhs)
                                                                                                                                 Other supply (lhs)
                                                                n/a
                                                                                                                                 Power of Siberia’s share in China’s
                                        Power
                                         Power of
                                               of Siberia
                                                  Siberia   Central Asia        LNG                LNG                           incremental supply to 2019 (rhs)
                                                                           (new contracts)    (old contracts)                                                                      40%
                                                                                                                    427

                Beijing                NORTH
                                                                                                                                                                                   30%

                                                                                                                    387

                                                                                                                                                                                   20%
                                        Power
                                        Power of Siberia
                                                 Siberia    Central Asia        LNG                LNG
                                                                           (new contracts)    (old contracts)
                                                                                                                    347
                                                                                                                                                                                   10%
                                       EAST

                                                                                                                    307                                                            0%
                                                                                                                              2020       2021       2022      2023   2024   2025
                          Shanghai
                                        Power
                                         Power of
                                               of Siberia
                                                  Siberia   Central Asia         LNG                LNG           *December 2019 Wood Mackenzie estimations
                                                                            (new contracts)    (old contracts)    **Based on IНS Markit, Gazprom estimations, 2019
                                                                                                                  ***NDRC 2020

COMPETITIVE GAS SUPPLY VIA POWER OF SIBERIA TO PAVE WAY FOR NEW PROSPECTIVE PROJECTS
14 | STRATEGY
PERFORMANCE INDICATORS OUTLOOK
   INVESTMENTS              PRODUCTION      PIPELINE EXPORTS   INCREMENTAL EBITDA FROM MAJOR NEW PROJECTS*
   TRLN RUB., REAL 2019     BCM                                TRLN RUB., REAL 2019
   (INCLUDING VAT)
                                            FAR ABROAD, BCM
                                                     +34%
                                    +21%

      1.3 -11%              500               199
                                                                                        Total
                                                                                      2020–2030

                                                                                      3.7
                                                                                                  * Power of Siberia
                                                                                                    TurkStream
                                                                                                    Nord Stream 2
                                                                                                   Amur GPP
      2019 2020–2030         2019    2030     2019    2030
         (annual average)                                                                           Ust-Luga GPP+LNG

GAZPROM’S NEW AND PERSPECTIVE PROJECTS WILL ENSURE STABLE GROWTH OF EBITDA

15 | STRATEGY
GAZPROM INVESTOR DAY 2020

  GAZPROM’S STRATEGY: WAYS TO ACHIEVE THE TARGETS

  PRODUCTION                                       PROCESSING                                   RUSSIAN GAS MARKET
  TARGET: ENSURE SUSTAINABLE                       TARGET: DIVERSIFY REVENUE SOURCES            TARGET: ENHANCE ENERGY SECURITY
  COST-COMPETITIVE PRODUCTION                      AND FULLY MONETISE “RICH” GAS

  WAYS: BY DEVELOPING EMERGING GAS PRODUCTION      WAYS: BY BUILDING WORLD CLASS FACILITIES     WAYS: BY EXPANDING UNIFIED GAS SUPPLY SYSTEM
  CENTERS AND MEGAFIELDS                           TARGETING BOTH EUROPEAN AND ASIAN MARKETS    AND PROVIDING RELIABLE SUPPLIES

  EXPORTS TO EUROPE                                EXPORTS TO CHINA                             ECONOMICS
  TARGET: STRENGTHEN THE POSITION                  TARGET: FURTHER DIVERSIFY EXPORT MARKETS &   TARGET: ENSURE CONSTANT ECONOMIC
  OF THE LEADING SUPPLIER TO THE EUROPEAN MARKET   SIGNIFICANTLY INCREASE EXPORT VOLUMES        PERFORMANCE IMPROVEMENT AND DIVIDEND GROWTH

  WAYS: BY USING FLEXIBLE MARKET MECHANISMS &      WAYS: BY PROVIDING COMPETITIVE GAS SUPPLY    WAYS: BY OPTIMISING CAPEX
  SUPPLYING LOW-CARBON GAS VIA NEW EFFICIENT       THROUGH POWER OF SIBERIA AND NEW ROUTES      AND INCREASING FREE CASH FLOW
  PIPELINES

16 | STRATEGY
ELENA BURMISTROVA
 Deputy Chairman of the Gazprom Management Committee,
 Director General of Gazprom Export
17 | STRATEGY
GAZPROM INVESTOR DAY 2020

  GAS MARKETS: NEW REALITIES

 Record high storage build up in Europe      Inventory levels may normalise in Q2 2020 given
                                             accelerating storage withdrawals which began in January

                                             Largely offset by strong demand response to low
 Abnormally mild winter
                                             gas prices

                                             Resilience to price slump due to diversified portfolio
 Sharp decline in European gas spot prices
                                             of export contracts

 Growth of US LNG supply to Europe           A lesser issue, as China is expected to take the bulk of US
                                             LNG volumes under Phase One of the US – China Trade Deal

 EU decarbonization policies                 Coal-to-gas switch, natural gas as back-up for renewables

18 | EXPORT
     STRATEGY
GAZPROM INVESTOR DAY 2020

  RESILIENCE TO MARKET TURMOIL

 1      RETAINING STRONG
                                    2      ENTRY TO NEW GAS MARKETS            3      EXTENDED PRODUCT OFFER
        MARKET POSITIONS IN
                                           AND DIVERSIFICATION OF EXPORT
        EUROPE
                                           ROUTES
                                                                                   • Variety of pricing mechanisms
     • Secure gas market share in       • Growth of gas exports to China via       • LNG sales
       Europe: over 35%                   new pipeline Power of Siberia            • Electronic sales platform
     • Low production costs             • Two new gas pipelines to Europe
                                          (TurkStream, Nord Stream 2
                                          in progress)
                                        • New five year gas transit
                                          agreement with Ukraine

19 | EXPORT
     STRATEGY
1.

     Retaining strong
     market positions
     in Europe
GAZPROM INVESTOR DAY 2020

   GAZPROM’S STRATEGY: WAYS TO ACHIEVE THE TARGETS
 GAS DELIVERIES TO EUROPE, % OF ACTUAL CONSUMPTION*

                                                                              10%                                    8%      Other Imports
 10%                                  9%
 10%                                  11%                                     13%                                 21%        LNG                     • Gazprom retained its front-runner role
                                                                                                                                                       on the European natural gas market.
 33%                                 34%                                      37%                                                                      The Company successfully defended
                                                                                                                  36%        Gazprom’s export
                                                                                                                                                       its market share despite the bearish
                                                                                                                                                       fundamentals and European energy
 48%                                 46%                                      46%                                 42%                                  policy emphasising diversification of
                                                                                                                             Indigenous production     gas imports
 2016                                 2017                                     2018                                  2019E                           • In 2019, European demand for
                                                                                                                                                       natural gas increased by 10 bcm to
                                                                                                             change                  change
                                                            2018                      2019
                                                                                                              (bcm)                    (%)             560 bcm, driven primarily by coal-to-
 Total gas consumption                                     548.9                      559.0                   10.1                    1.8%             gas switch. Demand in the
 Power production sector                                   169.1                      177.2                    8.1                    4.8%             commercial and residential sector
 Commercial and residential sectors                        207.9                      206.9                    -1.0                  -0.5%             was unaffected by unfavourable
 Industrial sector                                         148.7                      151.5                    2.8                    0.9%             weather conditions.
 Other sectors                                              23.2                      23.4                     0.2                    0.5%
 * Total shares exceed 100% due to the gas imports used for UGS injections, reverse and LNG-export deliveries; figures are rounded
   Sources: PJSC Gazprom, Eurostat, National Statistics, IEA, IHS Markit

21 | EXPORT
     STRATEGY
GAZPROM INVESTOR DAY 2020

     GAZPROM’S STRONG PERFORMANCE IN 2019
MAJOR GAS SUPPLIERS TO EUROPE IN 2019, BCM
    -1.4%
 201.9 199
                                                       Key exporters                                                                     Domestic producers
                         2018                                                                                           2018                                                2018
                         2019                                                                                           2019                                                2019   • Gazprom gas pipeline exports to
                                                                                                                                                                                     Europe remained robust, near record
                                                                                                                                       -5.9%                                         high of 2018 (199 bcm)
                                                                                                                                     131.1
                                                                                                                                             123.3
                                                                                                                                                                                   • This was achieved despite a more
                                                                                                                                                                                     than 47 bcm increase in LNG
                                                                                                                                                                                     supplies to Europe in 2019
                         -20.0%
                                                                                                                                                                                   • Other major suppliers of pipeline gas
                                                                                                            1
                                                                                                                                                      -2.8%
                       48.5                    +37.8%                                                                                                               -8.3%
                                                                                                                  +32.6%
                               38.8                                  +201.9%               +395.9%
                                                                                                                                                     43.6 42.4                       decreased their deliveries to Europe
                                                     32.1                                                                                                          35.0 32.1
                                             23.3                          20.5                                  21.2
                                                                                                                        28.1                                                         by 21 bcm
                                                                                                 18.3
                                                                    6.8                   3.7

  PJSC                 ALGERIA             QATAR LNG             RUSSIA LNG               US LNG                  OTHER              NORWAY**         UNITED     NETHERLANDS
GAZPROM*             (INCL. LNG)                                                                                IMPORT LNG                           KINGDOM

* Including financial instruments
** Including domestic consumption, pipeline and LNG deliveries from Norway to the European market, but not LNG to Asia and America
  Sources: PJSC Gazprom, Eurostat, National Statistics, IEA

22 | EXPORT
     STRATEGY
Entry to new gas
1.

     markets and
     diversification
     of export routes
GAZPROM INVESTOR DAY 2020

  DIVERSIFICATION OF GAS PIPELINE EXPORT ROUTES

 Supported
 by major European companies                                                                                                      • The new 5-year transit agreement with
                                                                                                                                    Ukraine confirms that Gazprom is a reliable
                                                                                                                                    partner and enhances overall security of
 by national governments      “[Germany] considers extraterritorial sanctions to be unsuitable and that’s why we continue to        gas deliveries to Europe
                              support this project […] Despite the sanctions it will be possible to complete Nord Stream 2 […]
                              There is a certain delay but it will be completed”.
                                                                                  Angela Merkel, Federal Chancellor of Germany
                                                                                                                                  • Diversification of gas supply routes to
                                                                                                                11 January 2020     Europe with the launch of new pipelines,
                                                                                                                                    namely TurkStream and Nord Stream 2
                                                                                                                                    (in progress) increases Gazprom’s export
                                                                                                                                    potential and allows for a greater flexibility

Already delivers gas to
The second string expansion further to Europe:               – additional capacities to be available in 2020
                                                             – to be fully operational in December 2020
                                                             – open season has started. Full capacity is
                                                               planned to be reached by October 2022
24 | EXPORT
     STRATEGY
GAZPROM INVESTOR DAY 2020

  POWER OF SIBERIA: EXPANDING PORTFOLIO OF ROUTES
  SUPPLY ROUTE                       COST+ ESTIMATES IN THE TARGET                                               POWER OF SIBERIA’S SHARE IN
                                     CHINESE REGIONS BY WOOD MACKENZIE*                                          CHINA’S INCREMENTAL GAS SUPPLY**
                                       NORTH-EAST                                                                               (to 2019 base year***)

                                                                                                                                      Power of Siberia (lhs)
                                                                                                                                      Other supply (lhs)
                                                                n/a
                                                                                                                                      Power of Siberia’s share in China’s
                                        Power
                                         Power of
                                               of Siberia
                                                  Siberia   Central Asia        LNG                LNG                                incremental supply to 2019 (rhs)
                                                                           (new contracts)    (old contracts)                                                                           40%
                                                                                                                         427

                Beijing                NORTH
                                                                                                                                                                                        30%

                                                                                                                         387

                                                                                                                 bcm
                                                                                                                                                                                        20%
                                        Power
                                        Power of Siberia
                                                 Siberia    Central Asia        LNG                LNG
                                                                           (new contracts)    (old contracts)
                                                                                                                         347
                                                                                                                                                                                        10%
                                       EAST

                                                                                                                         307                                                            0%
                                                                                                                                   2020       2021       2022      2023   2024   2025
                          Shanghai
                                        Power
                                         Power of
                                               of Siberia
                                                  Siberia   Central Asia         LNG                LNG                *December 2019 Wood Mackenzie estimations
                                                                            (new contracts)    (old contracts)         **Based on IНS Markit, Gazprom estimations, 2019
                                                                                                                       ***NDRC 2020

COMPETITIVE GAS SUPPLY VIA POWER OF SIBERIA TO PAVE WAY FOR NEW PROSPECTIVE PROJECTS
25 | EXPORT
     STRATEGY
Extended
product offer
GAZPROM INVESTOR DAY 2020

  GAZPROM EXPORT SALES BY PRICING MECHANISM

16.5%                                           • In Q1–Q3 2019, legacy oil and
                                                  contemporary quasi-oil indexation
                                                  represented almost one third
                                                  of Gazprom’s price formation pattern
15.5%
                                                • More than half of the volumes
                                                  delivered were sold under LTCs with
                                                  a direct link to different trading hub
11.3%                                             indices, including spot and forward
                                                  markets

56.7%                                           • Another important segment of 11.3%
                                                  is covered by trading operations and
   Oil indexation                                 sales via the electronic platform.
   Quasi-oil indexation                           This share rapidly increased by
   Trading and ESP
                                                  8.5 p.p. compared to 2018, its first
   Hub indexation
                                                  year of operation

27 | EXPORT
     STRATEGY
                          88.6%         88.6%
GAZPROM INVESTOR DAY 2020

      GAZPROM’S PORTFOLIO DEMONSTRATED RESILIENCE
                                                                                                                                       • In 2019, futures prices of different
           300
                                                                                                                                         longevity moved in a discorded
                 279                                                                                                                     manner. While day-ahead and month-
                                  271                                                                               2018
                                                         252                                                                             ahead prices responded to LNG glut
                                                                                    246                             2019
           250
                                                                      -16%
                                                                                                                                         by dropping off, forward prices with
                                                                                                 -17%
                                   95.1%
                                                               210                                                                       other duration showed a strong
                                                                                             203                                         resilience to market oversupply
           200             -44%                  -38%
                                           168   69.5%                                                                                 • In the past, deviations of futures prices
                  68.1%
                          156
 USD/mcm

                                                                                                                                         of different longevity within the ‘family’
           150
                                                                                                                4                        of these prices were modest
                                                                                                        49.7%

                                                                                                                                       • Linkages in Gazprom’s contract
           100                                                                 3
                                                                       33.5%                                                             portfolio to month-ahead plus products
                                                                                                                                         and price formation on the basis
            50                                                                                                                           of historic forwards and oil indices
                                                                                                                                         translated into a premium of
                                                                                                                                         $1/MMBtu in relation to month-ahead
             0
                   Day-Ahead      Month-Ahead            Year-Ahead                Gazprom Portfolio                                     prices

                                                                                            Sources: Bloomberg, PJSC Gazprom
                                                                                                                               88.6%
28 | EXPORT
     STRATEGY
GAZPROM INVESTOR DAY 2020

                   LOW COST ADVANTAGE
          EUROPEAN GAS PRICES DYNAMICS AND FULL COST* OF US LNG SUPPLIES TO EUROPE                                                                                                                • Imported pipeline gas and LNG are set
                                                                                                                                                                                                    to cover the emerging supply/demand gap
          350                                                                                                                                                                   10.0                in Europe

                                                                                                                                                                                                  • With global prices at their 10-year low
          300                                                                                                                                                                   8.5
                                                                                                                                                                                                    in winter season LNG prices for deliveries
                                                                                                                                                                                                    from the Atlantic coast do not cover even
          250                                                                                                                                                                   7.1
                                                                                                                                                                                                    the short-run marginal costs
          200                                                                                                                                                                   5.7               • In 2020, LNG projects are most likely to

                                                                                                                                                                                      USD/mmbtu
USD/mcm

                                                                                                                                                                                                    experience delays justified by unfavourable
          150                                                                                                                                                                   4.3                 economic conditions and the share of un-
                                                                                                                                                                                                    utilised liquefaction capacity is expected
          100                                                                                                                                                                   2.8                 to increase

           50                 US LNG breakeven prices (full cycle costs)                                                 US LNG short-run marginal costs (excl. tolling fees)   1.4               • There is a strong consensus that a cycle
                                                                                                                                                                                                    of low prices will persist for the next couple
                              TTF Month Ahead and Futures (20 Jan, 2020)                                                 Germany border price (BAFA)
             0                                                                                                                                                                  0.0                 of years. Low breakeven costs provide
                                                                                                                                                                                                    Gazprom with a strong competitive
                                                                                                                                                                                                    advantage over spot LNG deliveries
          *Calculated on the basis of Henry Hub Futures prices, P = HH * 115% + X, where X – liquefaction costs, shipping to Europe, regasification.
          Range of liquefaction costs by IRR from 5% to 8%.
          Sources: Bloomberg, IHS

          29 | EXPORT
               STRATEGY
GAZPROM INVESTOR DAY 2020

    GAZPROM’S LNG BUSINESS: CAPTURING NEW CUSTOMERS
GAZPROM LNG SUPPLIES PORTFOLIO                                                             GAZPROM LNG PROJECTS

mmt                                                                                        SAKHALIN 2 (T1,2)                 IN OPERATION
5
                                                                                           PORTOVAYA LNG                     UNDER CONSTRUCTION                   • Gazprom builds a diversified LNG
                                                                                           +1.5 mmtpa*                    start up in 2020
                                                                             CHINA - 23%                                                                            trading portfolio to expand LNG sales
                                                               4.0
4
                                                 3.7                  3.8
                                                                                           UST-LUGA                          UNDER CONSTRUCTION                     and solidify its presence in this vibrant
                                          3.6
                                   3.4                  3.3                                +13 mmtpa*                      commissioning in 2023-2024               growing market
3
                                                                             INDIA - 22%   SAKHALIN 2 T3                         PROSPECTIVE                      • In 2019, Gazprom Group delivered
            2.3                                                                            +5.4 mmtpa*                    commissioning in mid. 2020s               54 cargoes to customers in 7 countries
2    1.9
                                                                                                                                                                    throughout the world
                                                                             FOB - 13%
                     1.4    1.5
                                                                                           GAZPROM LNG PORTFOLIO OVERVIEW                                         • Gazprom develops LNG production
                                                                                                            LT LNG Purchase Agreements
                                                                                                                                                                    projects to form a substantial part of its
                                                                                           PURCHASE
1                                                                            UK - 12%
                                                                                                                                                     MT/ST/spot
                                                                                                                                                                    sales portfolio
                                                                                                             SEIC
                                                                             KOREA - 11%              1.0 mmtpa/20y   1.2 mmtpa/8y   2.9 mmtpa/20y                • LNG sales share in Gazprom’s export
                                                                                                                                                                    portfolio will reach 10%
     2010

            2011

                     2012

                            2013

                                   2014

                                          2015

                                                 2016

                                                        2017

                                                               2018

                                                                      2019

                                                                             JAPAN - 11%
                                                                                                       LT LNG Sale Agreements
                                                                                           SALES

                                                                             SPAIN - 6%
                                                                             TAIWAN – 2%                         2.9 mmtpa/20y                  MT/ST/spot
* Nominal capacity

30 | EXPORT
     STRATEGY
GAZPROM INVESTOR DAY 2020

  ELECTRONIC SALES PLATFORM: EFFECTIVE SUPPLEMENT TO LTCs
GAZPROM SALES ON ESP IN 2019,                           GAZPROM EXPORT SALES ON ESP IN 2019
BY COUNTRY
                                                                3000                                                      2789                 Volume, mmcm                           300

             7%                                                                                                                                ESPGazEX Index, euro/mcm
        6%        12%          Austria                          2500                                                                                                                  250
   1%                          Germany
                                                                2000                                                                                                                  200
                               Italy

                                                                                                                                                                                            Index, euro/mcm
 17%

                                                 Volume, mmcm
                               Slovakia                                                                                          1539
                                                                1500                                        1370                           1389       1309       1363                 150
                               Hungary                                                                             1276
                                                                                                    1099
  2%                           The Netherlands
                                                                1000                        886                                                                              788      100
                        55%    Czech Republic                           644
                                                                                  482
                                                                 500                                                                                                                  50

                                                                  0                                                                                                                   0
GAZPROM SALES ON ESP IN 2019,                                          January   February   March   April   May    June   July   August   September   October   November   December
BY INSTRUMENT
                                                      KEY POINTS
    38%                 16%    Day ahead                    •      ESP allows to optimise sales in periods of down-nominations of LTCs
                               Weekend                      •      ESP allows to compete for sales outside the LTCs and increase capacity utilisation ratios
                          7%   BOM
                                                            •      In just 15 months of ESP operation over 16.5 bcm (1.6 bcfd) of natural gas was sold through it
                          4%   Quarter
                                                            •      Germany is the main consumer of natural gas on ESP with a 55% share
                               Month
       35%                                                  •      New instruments added on ESP in 2019: Within Day, Balance of Month, Quarterly, Seasonal and Yearly futures
31 | EXPORT
     STRATEGY
Summary
GAZPROM INVESTOR DAY 2020

    GAZPROM’S INHERENT ADVANTAGES

                COMPETITIVE COST              LOW PRODUCTION
                                              AND MARKETING COSTS

                DIVERSIFIED TRADE             CONTRACT PORTFOLIO ADJUSTED
                INSTRUMENTS                   TO MARKET REALITIES

                FORWARD-LOOKING APPROACH TO   LONG-TERM TRACK RECORD
                INFRASTRUCTURE DEVELOPMENT    OF RELIABLE SUPPLIES

33 | EXPORT
     STRATEGY
MR ALEXEY YANKEVICH
 Member of the Management Board and CFO, Gazprom Neft

34 | STRATEGY
GAZPROM INVESTOR DAY 2020

   DISCLAIMER
THIS PRESENTATION CONTAINS FORWARD-LOOKING STATEMENTS CONCERNING THE FINANCIAL CONDITION,
RESULTS OF OPERATIONS AND BUSINESSES OF GAZPROM NEFT AND ITS CONSOLIDATED SUBSIDIARIES
                                                                                   There are a number of factors that could affect the future operations of Gazprom Neft and could cause
                                                                                   those results to differ materially from those expressed in the forward-looking statements included in this
   All statements other than statements of historical fact
                                                                                   presentation, inclusively (without limitation):
   are, or may be deemed to be, forward-looking statements.
   Forward-looking statements are statements of future                             (a) price fluctuations in crude oil and oil products;
   expectations that are based on management’s current                             (b) changes in demand for the Company’s products;
   expectations and assumptions and involve known and                              (c) currency fluctuations;
   unknown risks and uncertainties that could cause actual
                                                                                   (d) drilling and production results;
   results, performance or events to differ materially from
   those expressed or implied in these statements.                                 (e) reserve estimates;
                                                                                   (f) loss of market and industry competition;
   Forward-looking statements include, among other things,
   statements concerning the potential exposure of Gazprom                         (g) environmental and physical risks;
   Neft to market risks and statements expressing                                  (h) risks associated with the identification of suitable potential acquisition properties and targets, and successful
   management’s expectations, beliefs, estimates, forecasts,                       negotiation and completion of such transactions;
   projections and assumptions. These forward-looking                              (i) economic and financial market conditions in various countries and regions;
   statements are identified by their use of terms and phrases
                                                                                   (j) political risks, project delay or advancement, approvals and cost estimates; and
   such as ‘‘anticipate’’, ‘‘believe’’, ‘‘could’’, ‘‘estimate’’, ‘‘expect’’,
   ‘‘intend’’, ‘‘may’’, ‘‘plan’’, ‘‘objectives’’, ‘‘outlook’’, ‘‘probably’’,       (k) changes in trading conditions.
   ‘‘project’’, ‘‘will’’, ‘‘seek’’, ‘‘target’’, ‘‘risks’’, ‘‘goals’’, ‘‘should’’
                                                                                   All forward-looking statements contained in this presentation are expressly qualified in their entirety by the cautionary statements contained or
   and similar terms and phrases.                                                  referred to in this section. Readers should not place undue reliance on these forward-looking statements.
                                                                                   Each forward-looking statement speaks only as of the date of this presentation. Neither Gazprom Neft nor any of its subsidiaries undertake any
                                                                                   obligation to publicly update or revise any forward-looking statement as a result of new information, future events or other information.

35 | OIL
GAZPROM INVESTOR DAY 2020

   2019 KEY EVENTS
  UPSTREAM
  • Hydrocarbon production up 3.5% y-o-y
  • Access to 32 new license blocks
  • Development of Achimov deposits at the Yamburgskoye and Vostochno-Messoyakhskoye fields initiated
  • Active development of oil-rim and Neocomian-Jurassic deposits at gas and gas-condensate fields initiated
    (under risk-based operatorship agreements with Gazprom)
  • Russia’s first integrated Field Development Centre launched
  • Developing partnerships in YANAO, Gydan and KHMAO as part of a new approach to project-portfolio
    management

                                                                               DOWNSTREAM
                                                                               • The refinery modernisation programme remains ongoing, and the implementation of
                                                                                 various environmental initiatives continues
                                                                               • Increasing the Company’s interest in the Poliom LLC* polypropylene plant in Omsk
                                                                               • New innovative fuel terminal – “Gladkoye” – commissioned (the starting point for the
                                                                                 company’s terminal reconstruction programme)
                                                                               • Construction of Russia’s first high-tech catalyst production facility initiated in Omsk
                                                                               • Sales of new environmentally friendly (hybrid low-sulphur) marine fuel initiated
                                                                               • The world’s first digital logistics management system is launched in the Arctic

                                                                                                                                          * A joint venture between Gazprom Neft (50%) and SIBUR (50%).
36 | OIL
GAZPROM INVESTOR DAY 2020

   2019 HIGHLIGHTS
   OPERATIONAL HIGHLIGHTS                     FINANCIAL HIGHLIGHTS

                      89.8   92.9    96.1                                                   Brent crude, $/bbl
                                                                 24              71.2                                       80
                 90
                                                                                                    64.3
                 80
                                                                 18
                                                                          54.1
                 70
                 60                                                              12.7                12.3
   HYDROCARBON                                ADJUSTED EBITDA,   12                                                         40

   PRODUCTION,
                 50
                 40
                                              US $ BN                     9.4
   MTOE          30                                               6
                 20
                 10
                                                                  0                                                         0
                  0                                                        1      2                      3
                      2017    2018    2019F                               2017   2018               2019F

                      40.1   42.9    41.5                                        6.0                 6.2
                                                                      6
                 40
                 35                                                   5   4.3
                 30
                                                                      4
                 25
                 20                                                   3
  REFINING       15                           NET INCOME*,            2
  THROUGHPUT,    10                           US $ BN
                                                                      1
                  5
   MT
                  0                                                   0
                      2017   2018    2019F                                2017   2018               2019F

                                                                                                 * attributable to GPN shareholders
37 | OIL
GAZPROM INVESTOR DAY 2020

   STRATEGY 2030
LEADERSHIP – KEY AREAS OF FOCUS

                                                             Maximising the added value of every
                                                             barrel, under any scenario impacting
                                                             the development of the oil market

                                                EFFICIENCY                       Creating technologies for future development:
           “Target zero” – zero harm
           to people, the environment,                                           •   Developing multi-phase fields and
           or property in our operations                                             low-permeability reservoirs
                                                                                 •   Working under the ice-bound conditions
                                                                                     of the Russian Arctic Shelf
                                                     TECHNOLOGICAL               •   Cat-cracking and hydrotreatment
                                           SAFETY     PERFORMANCE                    processes

38 | OIL
Technological
Focus
GAZPROM INVESTOR DAY 2020

   PROJECT PORTFOLIO – OUTLOOK FOR THE FUTURE
IMPLEMENTING THE ACCESS STRATEGY: ACCESS TO 32 LICENSE BLOCKS SECURED IN 2019                   UNCONVENTIONAL RESERVES

           Current projects: 2019 - 2023      SOUTHERN YAMAL    YENISEI    MERETOYAKHA
                                                                                           Bazhenov
                                                                                           Domanic
                                                                                                                                            550
           Medium-term projects: 2024- 2026       101 MTOE      306 MTOE      332 MTOE     Palaeozoic                                          MTOE
           Long-term projects: 2027+
                                                                                                         OIL – RIM DEPOSITS*
                                                                                           Pestsovoye
SOUTHERN ORENBURG                                                                          En-Yakhinskoye
           36 MTOE
                                                                                           West Tarkosalinskoye                           145
                                                                                           Orenburg                                          MTOE
                                                                                           Chayandinskoye

                                                                                            NEOCOMIAN- JURASSIC DEPOSITS*
     TOLEDO
      47 MTOE                                                                              Harasavey                                      766
                                                                                           Bovanenkovo                                      MTOE

                                                                                                         ACHIMOV DEPOSITS*
                                     THE OTDALENNAYA GROUP OF
                       ZIMA                 FIELDS (OGF)        CHONA       SAKHALIN
                                                                                            Urengoy
                                                                                            Yamburg
                                                                                                                                           787
                      60 MTOE                  20 MTOE          60 MTOE      115 MTOE                                                      MTOE

                                                                                               Recoverable reserves (p50).
40 | OIL                                                                                 * under risk - based operatorship agreements with Gazprom.
GAZPROM INVESTOR DAY 2020

      AN INTEGRATED APPROACH TO CHOOSING                                                                                                                                                  EFFICIENCY

      TECHNOLOGICAL SOLUTIONS AND TOOLS                                                                                                                                          SAFETY         TECHNOLOGICAL
                                                                                                                                                                                                 PERFORMANCE

                                                                    111                                                                                           151
                             2019                                              ACTIVE                                 2020-2022                                                 ACTIVE
                           PORTFOLIO                                           PROJECTS                                                                                         PROJECTS
                                                                                                                     PORTFOLIO

                         Technological breakthrough                    Radical improvements                             Quick wins                                   Exploratory research
Level of technological
development
                                                                                                                                                                   EMV
 1                                                                                                                                                              (RUB bn)   5+
                                                                                  DRILLING EXTENDED-REACH                                                                       3-5
                                                                                                                                                                                          1-3
GAZPROM INVESTOR DAY 2020

        DOWNSTREAM                                                                                                                                                                                    EFFICIENCY

        MEETING THE HIGHEST INTERNATIONAL STANDARDS IN TECHNOLOGICAL DEVELOPMENT (COMPLEXITY)                                                                                                SAFETY        TECHNOLOGICAL
                                                                                                                                                                                                            PERFORMANCE

                                   THE MOSCOW REFINERY                                               THE OMSK REFINERY                                                           NIS
                                                                                     CDU/VDU UNIT                                                    DELAYED COKING UNIT (DCU)
                   EURO+ COMBINED REFINING UNIT
                                                                                     •  Operational availability: 4Q 2020
                                                                                     •  Separate refining of crude oil and gas condensate                Completion of pre-commissioning works:
                   •   Completion of pre-commissioning works: 1-2Q 2020                                                                              •
                   •   Greater throughput, reaching up to 12 mt                                                                                          2Q 2020
                                                                                     DEEP PROCESSING UNIT (DPU)
                   •   Higher light product yields                                                                                                   •   A conversion factor (refining depth) of
                                                                                     •  Operational availability: 4Q 2020
                   •   Transition to four-year run-life                                                                                                  up to 96.9%
                                                                                     •  A conversion factor (refining depth) of 97.4%
                   •   Better energy efficiency and lower environmental
                                                                                        (together with the DCU)                                      •   Optimising existing capacity and infrastructure
                       impacts
                                                                                     •  Production of raw materials for Group 2 and Group 3              at the Pančevo refinery
                                                                                        base oils                                                        Capacity for 2,000 tonnes per day
                   DEEP PROCESSING UNIT (DPU)                                                                                                        •
 West European                                                                                                                                           (raw materials)
refinery average                                                                     DELAYED COKING UNIT (DCU)
                   •    Sulphur regeneration unit – operational availability:
                                                                                     •  Operational availability: 4Q 2020
                        4Q 2022
                                                                                     •  A conversion rate of
                        Operational availability: 4Q 2024
   NCI
                   •
                                                                                     •  up to 97.4% (together
                        o   Hydrocracker
                                                                                        with the DPU)
   10.0                 o
                        o
                            HGU*
                            DCU
                                                                                     •  Increased production
                                                                                        of Anode-grade coke
                   •    A conversion factor
                   (refining depth) of                                        NCI                                                             NCI                                                              NCI
                   up to 98%
                                                                              10.5                                                            10.4                                                             9.6
                                                                        7.7                                                             8.8                                                            8.5
                         *Hydrogenation unit (HGU).

  42 | OIL
GAZPROM INVESTOR DAY 2020

   MOVING INTO A NEW BUSINESS SECTOR –                                                                                    EFFICIENCY

   HIGH-TECH CATALYST MARKET                                                                                     SAFETY        TECHNOLOGICAL
                                                                                                                                PERFORMANCE

 2018                                                                                                                                  2021
                                             Plant construction                                                  Commissioning

28%                                                                                                100%
Russian previous
                                                                                                   Russian new-generation
generation catalysts
                                                                                                   catalysts

72%     Imports

                                                                                                                  Target production
                                                                                                                  capacity:
                       Russian catalyst   Competitive quality –           “National
                       production         matching the leading            Project”
                                                                                      300                         21,000
                       technologies       international catalyst brands   status      high-tech jobs
                                                                                                                  tonnes per year

43 | OIL
Operational
Efficiency
GAZPROM INVESTOR DAY 2020

   OPERATIONAL EXCELLENCE
                                                                                                                                                         EFFICIENCY

                                                                                                                                                SAFETY        TECHNOLOGICAL
                                                                                                                                                               PERFORMANCE

                                        1. EVALUATION OF POTENTIAL AGAINST BEST-IN-CLASS BENCHMARKS
           BENCHMARKING ANALYSIS:                    PERFORMANCE ANALYSIS          TECHNICAL LIMIT:                    VALUE STREAM
           • Intra-company comparison                AGAINST OPTIMUM               modelling                           MAPPING
           • Peer comparison

                  2. MEDIUM-TERM IMPROVEMENT PLAN                                                         3. CONTINUOUS IMPROVEMENT
                          ACHIEVABLE
                             level
                                                                                 > 49,000 IDEAS                          > 3,400 MANAGERS
                                                                                 generated by employees                  trained in regular
                                                                                 in 2017–2019                            management practices
  POTENTIAL
                                                                   Long term
                                                                  POTENTIAL
                                                                                 OPERATIONAL SUCCESS STORIES –      LEAN PROJECTS
                                                                                 SHARING EXPERIENCE

                                  THREE-YEAR                    SEARCH FOR NEW
  BENCHMARK GAP                   IMPROVEMENT PLAN              OPPORTUNITIES

45 | OIL
GAZPROM INVESTOR DAY 2020

                     UPSTREAM                                                                                                                                                                                  EFFICIENCY

                     IMPLEMENTING EFFICIENCY-ENHANCEMENT TOOLS                                                                                                                                        SAFETY        TECHNOLOGICAL
                                                                                                                                                                                                                     PERFORMANCE

IDENTIFYING POTENTIAL                                                                                                           INITIATION AND VERIFICATION                            IMPLEMENTATION

  GPN Internal benchmarking
                                                                                                                                                       Integrated

                                                                                           A single, integrated collection of
  •                            ‘Top-down’ determination of goals and potential
                                                                                                                                                       processes
  Process capacity assessment
  • Value Stream Mapping (VSM)

                                                                                                        initiatives
  • Calculating and coordinating potential in line with VSM outcomes
  • Undertaking optimisation initiatives
                                                                                                                                            Digital
  The LEAN Programme                                                                                                                       product              IT/digital
  Proposals and initiatives developed by company employees                                                                                                      instruments
  Proposals and initiatives considered by the project team for inclusion
  in the Efficiency Improvement Programme
                                                                                                                                 A cross-functional team
                                                                                           CASE STUDY OF GAZPROMNEFT - NOYABRSK FIELDS

                                                                                                                                         activities
                                      field 1                                                                                                                           Uncovered potential gives rise to a pool
   Economic effect, ‘000 RUB

                                                field 2                                                                                                                 of tasks/objects for R&D or the search
                                                                 field 3
                                                                                 7.7 RUB BN                                                                             for technologies at the Gazprom Neft Science
                                                                                                                                                                        and Technology Centre
                                                                                 FCF growth potential

46 | OIL
GAZPROM INVESTOR DAY 2020

           PROACTIVE MANAGEMENT OF THE ASSET PORTFOLIO –                                                                                                                                                      EFFICIENCY

           THE MAIN TOOL IN INCREASING PORTFOLIO PROFITABILITY                                                                                                                                       SAFETY        TECHNOLOGICAL
                                                                                                                                                                                                                    PERFORMANCE

                                                                      Asset 1

                                                                Asset M               Asset 2
                       Asset lifecycle
                       (indicative)

                                                                            Asset 9                                                                                      ASSET LIFECYCLE
ROACE, %

                                                                                          Asset 4    Asset 3

                                                                                                               Asset 5                                                   Third and fourth development
                                                                                                                         Asset 6          Asset 7
                                                                                                                                                    Asset K              phases: lower ROACE due to
                                            Asset 10
                                                                                                                                                                         naturally lower oil production in
                                                  Asset 11
                                 Asset 12
                                                                                                                                         Asset 8
                                                                                                                                                                         the light of unchanged lifting and
                       Asset N                                                                                                                                           maintenance infrastructure costs
                                                       Implementation – early
                  Exploration                                                                                  Exploitation – later stages
                                                       operational stages

                            ROACE management and portfolio efficiency optimised through optimum balancing of projects at different stages
                                                                                                                                                                                                                     EBITDA
                                                                                                                                                                           IMPROVING PROJECTS’ OPERATIONAL
           IMPROVING EFFICIENCY IN FIELD                                  PROACTIVE PROJECTS IN PORTFOLIO                          SECURING AN ASSET PORTFOLIO             EFFICIENCY
           DEVELOPMENT                                                    MANAGEMENT                                               BALANCED AGAINST VARIOUS STAGES
                                                                                                                                                                           by increasing revenue from sales
           •   integrated assessment of potential                         Partnerships/divestments in respect of:                  OF FIELD DEVELOPMENT
                                                                                                                                                                           (i.e. geological and technical initiatives,
           •   the “Asset of the Future” programme                        •  early-stage high-risk options                         Ensuring full early-stage portfolio
                                                                                                                                                                           gas monetisation, etc.), cutting OPEX
           •   benchmarking                                               •  mature low-performing fields                          integration for all new projects
                                                                                                                                                                           and securing tax concessions

47 | OIL
Safety and
Environment
GAZPROM INVESTOR DAY 2020

                                                                                                                                                                                           EFFICIENCY

    A RISK-BASED SAFETY MANAGEMENT CYCLE                                                                                                                                          SAFETY        TECHNOLOGICAL
                                                                                                                                                                                                 PERFORMANCE

  OBJECTIVES
• Creating effective barriers to prevent incidents
  that could have disastrous consequences
                                                                                      0           FATALITIES*
                                                                                      FAR** – at or below
                                                                                                                                 0           TECHNOLOGICAL ACCIDENTS****
                                                                                                                                 TIER 1**** – at or below
                                                                                      reference-group standards***               reference-group standards***

                                                                                       GOALS                                     15                                        16
                                                                                   • Defining events and scenarios with          Personal safety –                         Technogenic safety –
                                                                                     potentially disastrous consequences         accident scenarios                        incident scenarios

                                                                                                                                                                           Safety framework –
                                                                                       SAFETY FRAMEWORK
                                                                                   • Priority barriers selection
                                                                                                                                 ~13,600                                   initiatives required
                                                                                                                                                                           for implementation
                                                                                   • Implementation and updating/adjustment of
                                                                                     actions and initiatives

                                                                                      CERTIFICATION, INSPECTION
                                                                                                                                                 ~105                      Established safety
                                                                                                                                                                           framework barriers

                                                                                      AND INVESTIGATION                                         FULL-SCALE IMPLEMENTATION THROUGHOUT
1 Defining “disastrous” scenarios and incidents   4 Certification and inspection                                                                        COMPANY SUBSIDIARIES

2 Determining priority barriers
                                                                                   • Monitoring of barrier integrity
                                                  5 Analysis and adjustment
3 Implementation                                                                      * Including health-related incidents.       *** Reference group of HSE industry leaders.
                                                                                                                                 **** A process safety event under international classification (API).
                                                                                     ** Deaths per 100 million hours worked.

49 | OIL
GAZPROM INVESTOR DAY 2020

   HELPING COMBAT CLIMATE CHANGE
                                                                                                                                                                     EFFICIENCY

                                                                                                                                                            SAFETY        TECHNOLOGICAL
                                                                                                                                                                           PERFORMANCE

                                                           KEY COMPANY OBJECTIVE: A 20% REDUCTION* IN GROSS GHG EMISSIONS BY 2021

• Gazprom Neft supports the implementation of the Paris Climate Agreement, and the Russian government’s “Concept to Form a System of
  Monitoring, Reporting, and Verifying Greenhouse Gas Emission Volumes in Russia”
• The company adheres to national legislation on reducing greenhouse gas emissions (GHGs) and takes steps to measure the volume of GHGs it
  produces

   APG PRODUCTION AND USAGE**, BCM                                                                             • APG utilisation across company subsidiaries in Russia
                                                                                             16.62
                                                                                                                 reached 89%*** in 2019
                                                                                14.40
                                                                   11.43                                       • APG utilisation at mature assets with developed gas
                                                                                             14.81               infrastructure has reached 92–99% since 2016
                                                9.44                             11.28
               8.13
                                                                                                               • The higher volumes of APG-flaring since 2016 are the
                                                                    8.71
                                                 7.58                                                            result of new projects under development where APG-
  Usage         6.50
                                                                                                                 utilisation infrastructure is still under construction
                                                                                                      -41.8%
                                                                    2.73         3.11
  Flaring       1.64                             1.85                                         1.81             • Gas injection in enhanced oil recovery (EOR): this
               2015                              2016               2017         2018        2019F               technology increases the oil recovery factor (ORF) and
   * At mature fields and own refineries.
                                                                                                                 optimises the use of associated petroleum gas (APG)
  ** Noyabrskneftegaz, Khantos, Vostok, Orenburg, Yamal.
  *** Forecast.

50 | OIL
GAZPROM INVESTOR DAY 2020

   USING “GREEN” ENERGY SOURCES
                                                                                                                                                                                    EFFICIENCY

                                                                                                                                                                           SAFETY        TECHNOLOGICAL
                                                                                                                                                                                          PERFORMANCE

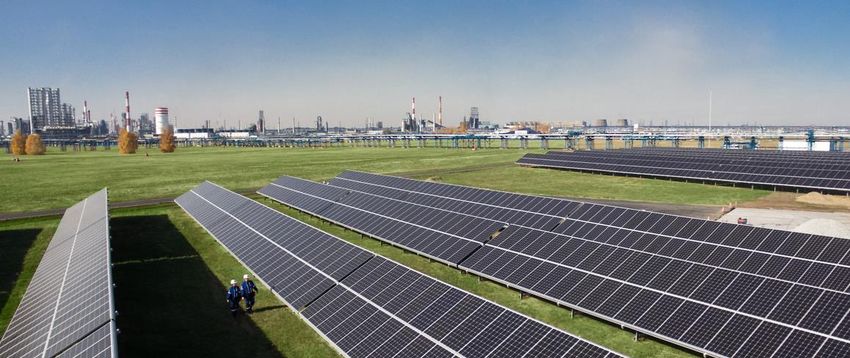
THE OMSK REFINERY: CONSTRUCTION OF THE OMSK OBLAST’S FIRST (1 MW) SOLAR-POWERED ELECTRICITY STATION COMPLETED             NIS: FOCUSSING ON CLEAN ENERGY

                                                                               •   A source of environmentally
                                                                                   friendly energy created, directly
                                                                                   within the plant’s grounds

2,500 UNITS                                                                    •   This pilot facility covers the full
                                                                                   energy requirements for all
SOLAR                 90
                                                                                   administrative buildings at the
                                                                                   Omsk Refinery, including a
PANELS            RUB MLN                                                          standalone residential complex
              INVESTMENTS                                                          for 2,600 employees                      • Initiated in 2012 to diversify business portfolio and to offset
                                                                               •   The agreement signed on                    GHG emissions from core operations
             1   MW                                                                building this pilot station will now
                                                                                   determine parameters and lead-
                                                                                                                            • Located in Serbia’s most promising location in terms
           CAPACITY                                                                                                           of wind-power potential
                                                                                   times for the construction of
                                                                                   Gazprom Neft’s future industrial         • The station’s installed capacity, comprising 34 wind-
                                                                                   solar-power plants
                                                                                                                              powered generators, will be equal to 102 MW

The initial agreement to build the power station was signed between Gazprom Neft PJSC and market-leading
solar company Hevel Energy Group at the 2019 St Petersburg International Economic Forum

       Investment project: construction of a 20 MW-capacity industrial solar-powered electricity station

51 | OIL
Dividend
and Debt Policy,
Investment Outlook
GAZPROM INVESTOR DAY 2020

     INVESTMENT PORTFOLIO
                               7.0                                                                2019F,                           7.3                                                           2020F,
                                                                                                  US$ BN                                                                                         US$ BN
                                            UPSTREAM
                                            • Greater drilling and well intervention at new clusters                               2.4
                                                                                                                                          UPSTREAM

                                                                                                               MAINTENANCE
                 MAINTENANCE

                               2.4            at mature assets                                                               3.4
                                            • Developing new geological prospecting projects                                              • Development in line with the 2025 Strategy
                                            • Developing infrastructure on the Yamal Peninsula                                     0.9
                                                                                                                                          • Improving efficiency and cutting costs
                               1.0            and in the Nadym-Pur-Tazovsky district                                                      • Exploiting new technologies

                                                                                                                                   2.2
                               1.9           DOWNSTREAM

                                                                                                               DEVELOPMENT
                 DEVELOPMENT

                                             • Implementing deep-conversion refinery projects                                             DOWNSTREAM
                                                                                                                                          • Refinery modernisation
                               1.4                                                                                                 1.6

                               0.3           OTHER                                                                                 0.2

                                                                                                                                         Core portfolio:
    ADDITIONAL OPPORTUNITIES:
                                                                                                                                         Base: sustainable projects under all development scenarios
                                                                                                                                         Strategic bets: eliminating uncertainty in key parts of new projects,
•   Development of oil-rim and Neocomian-Jurassic deposits at gas and gas-condensate fields initiated                                    leading to FID
•   Development of Achimov deposits at the Yamburgskoye and Vostochno-Messoyakhskoye fields initiated        CORE                        Open options:
                                                                                                           PORTFOLIO
•   Developments in domestic (Russian) catalyst production                                                                               New oil- and gas-industry projects dependent on external
                                                                                                                                         environment
* Under risk-based operatorship agreements with Gazprom.

53 | OIL
GAZPROM INVESTOR DAY 2020

   CONSISTENTLY HIGH CREDITWORTHINESS

   NET DEBT/ EBITDA               DEBT PORTFOLIO

    1.19                                           •   November 2019 – successful completion of a RUB25-billion five-year 6.85% p.a.
                                                       coupon bond placement
                                                   •   December 2019 – successful completion of a RUB20-billion 10-year 7.15% p.a.
                                                       coupon bond placement
              0.73                                 •   The coupon rates have become the lowest in the history of the Russian market*
                        0.70
                                  CREDIT RATINGS

                                                   •   The company’s rating was upgraded by Moody’s in February 2019,
                                                       to Baa2 (outlook stable)
                                                   •   The company’s rating was upgraded by Fitch in August 2019,
                                                       to BBB (outlook stable)
     YE2017   YE2018   F YE2019
                                                   •   Credit ratings for Gazprom Neft were all at investment grade or higher as of
                                                       December 2019
                                                                                                            * For similar maturities among corporate placements.

54 | OIL
GAZPROM INVESTOR DAY 2020

   ON COURSE FOR INCREASING THE DIVIDEND PAYOUT RATIO TO 50%

   DIVIDENDS, RUB PER SHARE                                                         TOTAL SHAREHOLDER RETURN *

                                                           Dividend
                                                           payout ratio                        32
                                                                                                                            30
                                  30.00                    50%
             Three-year   68%
               CAGR                                                        Capital gain        22                                                         20
                                                                                                                             23                            4
                          15.00           18.14
     10.68                                         40%                                                                                                                                 12
                                                                                                                                                                                         6
                                                                                                                                                          16
                                                                          Dividend yield       10
                                                                                                                              7                                                          6

      2016                 2017    2018   F2019   6M2019                               Gazprom Neft                   Company 1                     Company 2                    Company 3

                                                                                   Source: Reuters.
                                                                                   Companies: Rosneft, Lukoil, Tatneft.
                                                                                   * TSR calculated on the basis of dividends as announced in FY2019 and stock-price changes as at 30 December 2019

                                                                                   against 3 January 2019. For equivalent-comparison purposes only dividends paid by Gazprom Neft have been calculated
                                                                                   on the basis of dividends for 4Q18+6M19+3Q19 (a payout ratio of 40%).

55 | OIL
MR FAMIL SADYGOV
       Deputy Chairman of the Management Committee, CFO, Gazprom

56 | STRATEGY
KEY DEVELOPMENTS OF 2019
                                        NEW DIVIDEND                                                 SALE OF QUASI-                                           ORGANISATIONAL
                                          POLICY                                                    TREASURY SHARES                                       STRUCTURE IMPROVEMENT
                                          New methodology                                           Elimination of market overhang                                  Centralisation of expertise
                                    Increased dividend payout ratio                                       Additional liquidity                   Restructuring of the investment and construction business unit

      LAUNCH OF KEY                                                   STRONGER FOCUS ON                                     SIGNING OF A TRANSIT
   INVESTMENT PROJECTS                                                  FCF GENERATION                                     CONTRACT WITH UKRAINE
  Commissioning of the Power of Siberia                               Also as a way to secure dividend                               Confirmed reputation as
              and TurkStream*                                                    payments                                               a reliable partner
(with Nord Stream 2 at its completion stage)

57 | FINANCE
     STRATEGY                                                                                                                                                               * Gas supplies started on 1 January 2020
DESPITE EXTERNAL CHALLENGES...

                                                AVERAGE SPOT PRICE IN EUROPE
    LOWER SPOT PRICES FOR GAS
                                                IN 2019 VS 2018
                                -44%
                                            WINTER
                                Q1 2019:   2019/2020:
                                                         INCREASE IN AVERAGE WINTER
    UNUSUALLY WARM WINTER
                                +2–4 +3–6
                                 DEGREES   DEGREES
                                                         TEMPERATURE VS CLIMATE NORMAL
                                                         IN SOME EUROPEAN COUNTRIES
                                 CELCIUS   CELCIUS

    PRESSURE ON NORD STREAM 2                     DELAYS IN SECURING PERMIT FROM DENMARK
                                                  AND RESTRICTIONS ON CONTRACTORS

58 | FINANCE
     STRATEGY
...THE GROUP DELIVERED SOLID FINANCIAL PERFORMANCE

     GAS SUPPLIES TO EUROPE                                             REVENUE                                NET PROFIT

   bcm    Export deliveries      Average export price (RHS)   USD/mcm                           IFRS, USD bn                                     IFRS, USD bn

   250                                                            400
         349

   200
                                                                  300                    132                                           23.3               21.4
                                                                                                     126
                   246                                                            112
                                                246                       91                                    14.0   12.2
   150
                                       200                203
                              176                                 200
                                                                          2016    2017   2018       2019E       2016   2017            2018               2019E
   100                                 194       202      199
                              179
                   159
         147
                                                                  100
    50

                                                                                                 POSITIVE FREE
     0                                                            0                               CASH FLOW*
         2014     2015        2016    2017      2018     2019E
                                                                                                    IN 2019
                                                                                                                              * Adjusted for changes in ST bank deposits
59 | FINANCE
     STRATEGY
STRONG MARKET PERFORMANCE IN 2019
         GAZPROM GDR PRICE EVOLUTION IN 2019
                                                                                                                                Gazprom
                                                                                                                                  +87%
  190%

  160%

  130%                                                                                                                          RTS Index
                                                                                                                                 +45%
  100%

         January    February    March       April       May      June      July     August    September    October   November   December

   • Impressive share price growth for the year: +87%     • Trading volume expanded 2.5-fold on the London Stock Exchange and
   • No. 1 by market cap among Russian companies*           more than tripled on the Moscow Exchange
   • New institutional investors in equity                • Higher free float applied by the Moscow Exchange

                                                                                                                                 * As at the end of 2019
60 | FINANCE
     STRATEGY
New
                dividend
                policy
61 | STRATEGY
NEW DIVIDEND POLICY

                                                                                  GAZPROM’S DIVIDEND PAYOUT RATIO
   • Harmonising interests of the Company,
     government and minority shareholders
                                                                                                                                          ≥50%
   • New dividend policy principles:
                                                                                                                            ≥40%
      Transparent methodology
      Dividends based on IFRS net profit                                   31%                                ≥30%
                                                                                      29%
                                                                                            27%        27%
      Adjustments for non-cash items                                                               23%
                                                                               20%
      Payout ratio increase from at least 30% to at least 50%
       within a three-year period
   • Dividends financed primarily from free cash flow
   • Dividend payout ratio for subsidiaries of at least 50% starting 2020
                                                                             2016        2017         2018      2019E
                                                                                                              2019E         2020E
                                                                                                                          2020E          2021E
                                                                                                                                           2021E
   • The new payout targets only apply if Net Debt / EBITDA remains below
     2.5х (currently, 1.1х)
                                                                              % of adjusted IFRS net profit       % of IFRS net profit

62 | FINANCE
     STRATEGY
Sustainable FCF
                and internal
                growth drivers
63 | STRATEGY
STRATEGIC FOCUS ON COST MANAGEMENT
  OPEX OPTIMISATION                                                               CAPEX EFFICIENCY IMPROVEMENTS
  • Corporate structure improvements: new management team and removal of          • Development of an effective control framework to monitor projects throughout the investment
    overlapping functions                                                            and construction cycle
  • Centralisation of processes employed to plan budgets and approve investment     • Integration of strategic and investment planning, investment and construction workstreams
    programmes for subsidiaries                                                   • Internal efficiency control
  • Introduction of tax monitoring to reduce fiscal pressure                        • Transition to a central contractor based model
  • 9 KPIs for management focusing on cost reduction                                • Wider use of EPC contracts
  • Identification and Group-wide rollout of the most efficient processes         • External control
                                                                                    • Increase in the share of project financing from 15% to 30% of total investments
                                                                                    • Independent audit of the Long-Term Development Programme

         REDUCTION
       OF CONTROLLED                                                                           POSITIVE FCF
     OPERATING EXPENSES                                                                        GENERATION
       BY 2% PER YEAR

64 | FINANCE
     STRATEGY
INVESTMENT PROJECTS TO DRIVE FUTURE FCF GROWTH
  • CAPEX flexibility and consideration of budget constraints in the prioritisation process             GAS BUSINESS INVESTMENT
  • Investment projects prioritised based on strategic fit and efficiency metrics:                      PROGRAMME
     IRR of at least 12% for gas transportation projects and 15% for other projects                                     RUB bn, financing, including VAT

     Project’s contribution to the Company’s financials (revenue, EBITDA, FCF) under various
      macroeconomic assumptions, gas price and demand scenarios
      Projects to be consistent with Gazprom's strategy                                                    1,339          1,080
  • Gazprom’s extensive expertise in managing major strategic projects
  • More efficient investment programme driven by broader use of project financing                          2019             2020

  • Increased efficiency of projects facilitated by banking support

KEY INVESTMENT PROJECTS
                             Power of Siberia           TurkStream          Nord Stream 2       Amur GPP            LNG/GPP in Ust-Luga
Launch                       December 2019             January 2020          End of 2020         2021                      2023

Annual design capacity           38 bcm                    31.5 bcm            55 bcm            42 bcm                   45 bcm

                                          Additional EBITDA of USD 9 bn per annum at full capacity utilisation*                           * In real terms
65 | FINANCE
     STRATEGY
DEBT MANAGEMENT, GROWING IMPORTANCE OF PROJECT FINANCING

   EFFICIENT DEBT MANAGEMENT                                                            NET DEBT* EVOLUTION (USD BN)
                                                                                     100                                                                                                                                  1.5

   • Comfortable level of Net Debt / EBITDA: not higher than 2.0x                                           1.4х
                                                                                      80                                                                                                           1.1х
   • Alignment of borrowing cycles with the financial needs of the                                                                                                                                                        1.0
                                                                                                                                                          0.8х
      Company/projects                                                                60

                                                                                                                                                                                                  21.0
   • The Company’s liquidity cushion (USD 21 bn) sufficient to cover debt             40
                                                                                                               20.8                                         23.7
      repayments for a period of more than two years                                                                                                                                              38.3
                                                                                                                                                                                                                          0.5

                                                                                      20                       35.9                                         31.9

                                                                                        0                                                                                                                                 0.0

   GROWING IMPORTANCE OF PROJECT FINANCING                                                                    2017                                          2018                                Q3 2019
                                                                                                  Adjusted Net Debt                 Cash and cash equivalents (incl. bank deposits)              Adj. Net Debt / EBITDA

   • Significant leverage and diversification of financing sources compared
      to classic loans (D/E = 70/30)                                                        DEBT REPAYMENT SCHEDULE **
   • Project efficiency confirmed by financial investors highly exposed to
      investment risks
   • Strong project transparency                                                                                                                                          46%
                                                                                                            14%                            16%                                                    24%
                                                                                                                                                            3Q2019
                                                                                                       Less than 1 year                     1–2 years                   2–5 years            More than 5 years

                                                                              * Net debt is adjusted for bank deposits (reflect as part of other current and non-current assets)      ** As at the end of 3Q2019

66 | FINANCE
     STRATEGY
You can also read