TD Bank Group Investor Presentation - Q4 2019
←
→
Page content transcription
If your browser does not render page correctly, please read the page content below
TD Bank Group
Investor Presentation
Q4 2019
Caution Regarding
Forward-Looking Statements
From time to time, the Bank (as defined in this document) makes written and/or oral forward-looking statements, including in this document, in other filings with Canadian
regulators or the United States (U.S.) Securities and Exchange Commission (SEC), and in other communications. In addition, representatives of the Bank may make forward-
looking statements orally to analysts, investors, the media and others. All such statements are made pursuant to the "safe harbour" provisions of, and are intended to be
forward-looking statements under, applicable Canadian and U.S. securities legislation, including the U.S. Private Securities Litigation Reform Act of 1995. Forward-looking
statements include, but are not limited to, statements made in this document, the Management's Discussion and Analysis ("2019 MD&A") in the Bank's 2019 Annual Report
under the heading "Economic Summary and Outlook", for the Canadian Retail, U.S. Retail, and Wholesale Banking segments under headings "Business Outlook and Focus
for 2020", and for the Corporate segment, "Focus for 2020", and in other statements regarding the Bank's objectives and priorities for 2020 and beyond and strategies to
achieve them, the regulatory environment in which the Bank operates, and the Bank's anticipated financial performance. Forward-looking statements are typically identified by
words such as "will", "would", "should", "believe", "expect", "anticipate", "intend", "estimate", "plan", "goal", "target", "may", and "could".

By their very nature, these forward-looking statements require the Bank to make assumptions and are subject to inherent risks and uncertainties, general and specific.
Especially in light of the uncertainty related to the physical, financial, economic, political, and regulatory environments, such risks and uncertainties – many of which are
beyond the Bank's control and the effects of which can be difficult to predict – may cause actual results to differ materially from the expectations expressed in the forward-
looking statements. Risk factors that could cause, individually or in the aggregate, such differences include: credit, market (including equity, commodity, foreign exchange,
interest rate, and credit spreads), liquidity, operational (including technology and infrastructure), model, reputational, insurance, strategic, regulatory, legal, environmental,
capital adequacy, and other risks. Examples of such risk factors include the general business and economic conditions in the regions in which the Bank operates; geopolitical
risk; the ability of the Bank to execute on long-term strategies and shorter-term key strategic priorities, including the successful completion of acquisitions and dispositions,
business retention plans, and strategic plans; the ability of the Bank to attract, develop, and retain key executives; disruptions in or attacks (including cyber-attacks) on the
Bank's information technology, internet, network access or other voice or data communications systems or services; fraud or other criminal activity to which the Bank is
exposed; the failure of third parties to comply with their obligations to the Bank or its affiliates, including relating to the care and control of information; the impact of new and
changes to, or application of, current laws and regulations, including without limitation tax laws, capital guidelines and liquidity regulatory guidance and the bank
recapitalization "bail-in" regime; exposure related to significant litigation and regulatory matters; increased competition from incumbents and non-traditional competitors,
including Fintech and big technology competitors; changes to the Bank's credit ratings; changes in currency and interest rates (including the possibility of negative interest
rates); increased funding costs and market volatility due to market illiquidity and competition for funding; Interbank Offered Rate (IBOR) transition risk; critical accounting
estimates and changes to accounting standards, policies, and methods used by the Bank; existing and potential international debt crises; environmental and social risk; and
the occurrence of natural and unnatural catastrophic events and claims resulting from such events. The Bank cautions that the preceding list is not exhaustive of all possible
risk factors and other factors could also adversely affect the Bank's results. For more detailed information, please refer to the "Risk Factors and Management" section of the
2019 MD&A, as may be updated in subsequently filed quarterly reports to shareholders and news releases (as applicable) related to any events or transactions discussed
under the headings "Significant and Subsequent Events in 2019, and Pending Transactions" in the relevant MD&A, which applicable releases may be found on www.td.com.
All such factors should be considered carefully, as well as other uncertainties and potential events, and the inherent uncertainty of forward-looking statements, when making
decisions with respect to the Bank and the Bank cautions readers not to place undue reliance on the Bank's forward-looking statements.

Material economic assumptions underlying the forward-looking statements contained in this document are set out in the 2019 MD&A under the headings "Economic Summary
and Outlook", for the Canadian Retail, U.S. Retail, and Wholesale Banking segments, "Business Outlook and Focus for 2020", and for the Corporate segment, "Focus for
2020", each as may be updated in subsequently filed quarterly reports to shareholders.

Any forward-looking statements contained in this document represent the views of management only as of the date hereof and are presented for the purpose of assisting the
Bank's shareholders and analysts in understanding the Bank's financial position, objectives and priorities and anticipated financial performance as at and for the periods
ended on the dates presented, and may not be appropriate for other purposes. The Bank does not undertake to update any forward-looking statements, whether written or
oral, that may be made from time to time by or on its behalf, except as required under applicable securities legislation.
                                                                                                                                                                                         2
TD Bank Group – Key Themes

                                                                           6th largest N.A. bank
                                                                             by Total Assets1
               1               Top 10 North American Bank                  6th largest N.A. bank
                                                                              by Market Cap1

                                                                                Delivering

               2               Proven Performance                          top tier long term
                                                                           shareholder returns2

                                                                            Highly rated
               3               Strong Balance Sheet and Capital Position   by major credit rating
                                                                                agencies

                                                                            Targeting 7-10%

               4               Focus on Growth Opportunities               adjusted EPS growth
                                                                             over the medium
                                                                                   term3

1. See slide 8.
2. See slide 16.                                                                                    3
3. See slide 8, footnote 1, for definition of adjusted results.
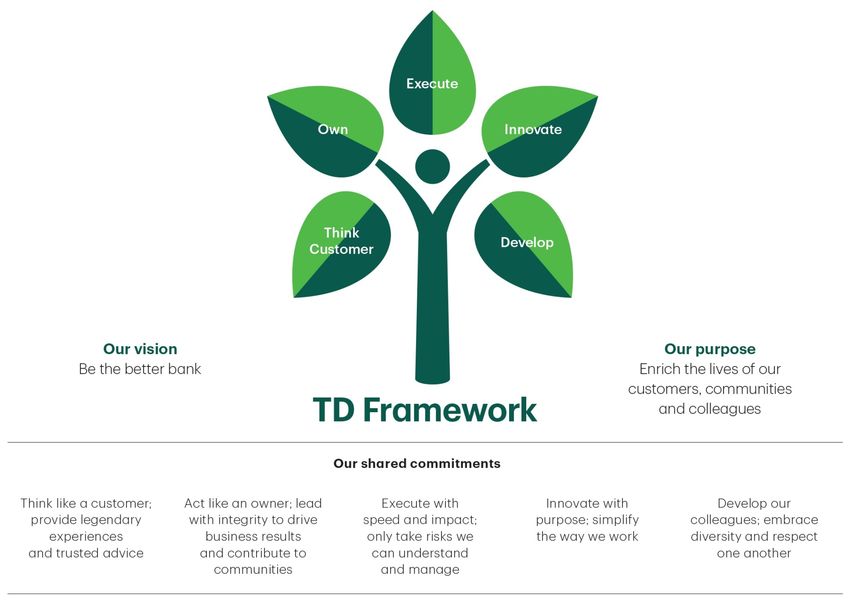
Own the future
Our Strategy

TD aims to stand out from its peers by having a differentiated brand – anchored in
our proven business model, and rooted in a desire to give our customers, communities
and colleagues the confidence to thrive in a changing world.

     Proven business model              Purpose-driven               Forward-focused

    Deliver consistent earnings    Centre everything we do on         Shape the future
     growth, underpinned by         our vision, purpose, and          of banking in the
        a strong risk culture        shared commitments                   digital age

•     Diversification and scale         •   Customers            •   Omni-channel
•     Balance sheet strength            •   Communities          •   Modernized operations
•     Safety, security and trust        •   Colleagues           •   Innovation

    This is brought to life by the TD Framework, which shapes our culture and guides our
    behaviour as we execute our strategy of being a premier Canadian retail bank, a top U.S.
    retail bank, and a leading Wholesale business aligned with our retail franchise.
                                                                                               4
Own the future
TD Framework

                                5
TD Snapshot
Our Businesses
Canadian Retail
Personal banking, credit cards and auto
finance
Small business and commercial banking
Direct investing, advice-based wealth
businesses, and asset management Q4 20191 Canadian U.S.
Property, casualty, life and health (C$) Retail Retail
insurance Financial Strength
U.S. Retail Deposits2 $344B $360B
2,332
Personal banking, credit cards and auto Loans3 $434B $214B
retail locations
finance AUA $422B $28B in North America
Small business and commercial banking
Corporate and specialty banking AUM $353B $58B
Wealth private client services Earnings4 $6.9B $5.0B
Strategic relationship with TD Ameritrade
Network Highlights
Wholesale Banking Employees5 41,650 26,513
Research, investment banking and capital Customers >15MM >9MM
market services Branches 1,091 1,241
Global transaction banking
Presence in key global financial centres ATMs 3,509 2,786 15
including New York, London and Singapore Mobile Users 5.3MM 3.3MM TD Securities
1. Q4/19 is the quarter comprising the period from August 1, 2019, to October 31, 2019.
offices worldwide
2. Total Deposits based on total of average personal and business deposits during the quarter. U.S. Retail deposits include TD Ameritrade Insured Deposit Accounts (IDAs),
Canadian Retail deposits include personal, business and wealth deposits.
3. Total Loans based on total of average personal and business loans during the quarter.
4. For trailing four quarters. 6
5. Average number of full-time equivalent staff in these segments during the quarter.Competing in Attractive Markets
Country Statistics Country Statistics
10th largest economy World’s largest economy
Real GDP of C$2.1 trillion Real GDP of US$19 trillion
Population of 37 million Population of 332 million
Canadian Banking System U.S. Banking System
One of the soundest banking systems in the world1 Over 5,400 banks with market leadership position held
Market leadership position held by the “Big 5” by a few large banks5
Canadian Banks The 5 largest banks have assets of nearly 40% of the
Canadian chartered banks account for more than 74% U.S. economy5
of the residential mortgage market2 Mortgage lenders have limited recourse in most
Mortgage lenders have recourse to both borrower and jurisdictions
property in most provinces
TD's Canadian Businesses TD's U.S. Businesses
Network of 1,091 branches and 3,509 ATMs3 Network of 1,241 stores and 2,786 ATMs3
Composite market share of 21% Operations in 4 of the top 10 metropolitan statistical
Ranked #1 or #2 in market share for most areas and 7 of the 10 wealthiest states6
retail products4 Operating in a US$4.2 trillion deposits market5
Comprehensive wealth offering with significant Access to nearly 110 million people within TD’s footprint7
opportunity to deepen customer relationships Expanding U.S. Wholesale business with presence in
Top two investment dealer status in Canada New York and Houston
1. World Economic Forum, Global Competitiveness Reports 2008-2019.
2. Includes securitizations. As per Canada Mortgage and Housing Corporation (CMHC).
3. Total ATMs includes branch / store, remote, mobile and TD Branded ATMs.
4. See slide 24, footnote 1.
5. FDIC Institution Directory and 2018 FDIC Summary of Deposits (deposits capped at $500MM in every county within TD’s U.S. banking footprint).
6. State wealth based on Market Median Household Income. 7
7. Aggregate market population in each of the metropolitan statistical areas within TD’s U.S. banking footprint.Top 10 North American Bank
North
Q4 2019 Canadian
American
C$ except otherwise noted Ranking4
Ranking5
Total assets $1,415B 2nd 6th
Total deposits $887B 1st 5th
Market capitalization $136.3B 2nd 6th
Reported net income (trailing four quarters) $11.7B 2nd 6th
Adjusted net income1 (trailing four quarters) $12.5B n/a n/a
Average number of full-time equivalent staff 90,049 2nd 6th
Common Equity Tier 1 capital ratio2 12.1% 2nd 3rd
Moody's long-term deposits/counterparty rating3 Aa1 n/a n/a
1. The Toronto-Dominion Bank ("TD" or the "Bank") prepares its Consolidated Financial Statements in accordance with International Financial Reporting Standards (IFRS), the current Generally Accepted Accounting Principles (GAAP), and refers to results
prepared in accordance with IFRS as the "reported" results. The Bank also utilizes non-GAAP financial measures to arrive at "adjusted" results to assess each of its businesses and to measure overall Bank performance. To arrive at adjusted results, the
Bank removes "items of note", from reported results. Refer to the "Financial Results Overview" in 2019 Management's Discussion and Analysis (MD&A) for further explanation, a list of the items of note, and a reconciliation of non-GAAP financial measures.
Trailing four quarter items of note: Charges related to the long-term loyalty agreement with Air Canada of $446 million after-tax, Charges related with the acquisition of Greystone of $112 million after-tax, and amortization of intangibles of $259 million after
tax.
2. See slide 30, footnote 1.
3. As of October 31, 2019. Credit ratings are not recommendations to purchase, sell, or hold a financial obligation inasmuch as they do not comment on market price or suitability for a particular investor. Ratings are subject to revision or withdrawal at any time
by the rating organization.
4. Canadian Peers – defined as other 4 big banks (RY, BMO, BNS and CM). All Peers are based on Q4/19 results ended October 31, 2019.
5. North American Peers – defined as Canadian Peers and U.S. Peers. U.S. Peers – defined as Money Center Banks (C, BAC, JPM) and Top 3 Super-Regional Banks (WFC, PNC, USB), based on Q3/19 results ended September 30, 2019. 8Diversified Business Mix
Fiscal 2019 Reported Earnings Mix1
Three key business lines
Canadian Retail robust retail
banking platform in Canada
with proven performance
U.S. Retail2
Canadian Retail 31%
U.S. Retail top 10 bank4 in 55%
the U.S. with significant
organic growth opportunities
Wholesale Banking North
American dealer focused on
client-driven businesses TD AMTD3
9%
Wholesale
5%
1. For the purpose of calculating contribution by each business segment, earnings from the Corporate segment are excluded.
2. For financial reporting purposes, TD Ameritrade is part of the U.S. Retail business segment, but it is shown separately here for illustrative purposes.
3. TD had a reported investment in TD Ameritrade of 43.19% as at October 31, 2019. 9
4. Based on total deposits as of November 26, 2019. Source: SNL Financial, Largest Banks and Thrifts in the U.S.Growing platform / North American scale…
Increasing Retail Focus
Acquired Became
Completed Announced
Acquired Target credit primary issuer
TD acquisition of Layer ownership stake
Chrysler card portfolio & of Aeroplan Completed
Acquired Waterhouse Acquired Acquired Completed 6 and Greystone, in Schwab to
Privatized Financial Epoch; and Visa; acquired strategic credit
51% of USA / Commerce Riverside acquisition of and entered into Air follow Schwab's
TD Banknorth and MBNA announced ~50% of card relationship
Banknorth Ameritrade Bank & TSFG Scottrade Bank Canada Credit Card acquisition of TD
credit card agreement with CIBC’s with Nordstrom
transaction Loyalty Program Ameritrade
portfolio Aimia and Aeroplan
Agreement
CIBC portfolio
● ● ● ● ● ● ● ● ● ● ● ● ● ● ●
2005 2006 2007 2008 2009 2010 2011 2012 2013 2014 2015 2016 2017 2018 2019
Partnering with Achieved Primary Expanded Acquired Maintained
TD Bank, America's Dealer status in the product Albert Fried & top-two dealer
Most Convenient U.S.1 offering to U.S. Company, a status in
Bank to expand ------------------------ clients and New York- Canada3
U.S. presence Participated in grew our based broker-
Exited select businesses
largest Canadian energy sector dealer
(structured products, non-franchise
IPO in 14 years presence in
credit, proprietary trading)
and one of the Houston
largest bond
placements in
Canadian history2
From Traditional Dealer To Client-Focused Dealer
1. Primary dealers serve as trading counterparties of the New York Fed in its implementation of monetary policy. For more information please visit https://www.newyorkfed.org/
2. Nalcor Energy Muskrat Falls Project (C$5 billion bond placement) and PrairieSky Royalty (C$1.7 billion initial public offering). Please see "Business Highlights" in the Wholesale Banking Business Segment Analysis of the Bank's 2014 Annual Report. 10
3. See slide 32, footnote 1.Connected Experiences
Consistent Strategy Q4 2019 Highlights
How we compete
13.4
Enabling seamless interactions MILLION
5.3 MILLION 3.3 MILLION
CANADIAN MOBILE
between customers and the ACTIVE DIGITAL U.S. MOBILE USERS
USERS
entire organization CUSTOMERS
Leveraging industry leading
Experience Design Center of
Excellence to create rich
experiences for our customers Digital Enhancements
and colleagues
TD For Me (U.S.) Card Controls (Canada)
A new personalization Canadian TD credit card
Empowering colleagues with
experience that will provide holders can control and
digital capabilities to create relevant activity-based manage their credit cards
enterprise value and interact content to U.S. mobile using their TD Canada mobile
confidently with customers consumers, increasing digital app to temporarily block in-
adoption and engagement. person international credit
Modernizing platforms that card purchases or all
enable us to be more agile in transactions.
exceeding our customers'
expectations TD Wheels App (Canada) Card Controls (U.S.)
Prospective car buyers can A new self-service function for
estimate monthly payments customers who have
and approximate trade-in misplaced their card to
value, and will soon be able Lock/Unlock their debit card
to obtain prequalification for through their TD Bank Online
vehicle financing. Banking Account.
11The Better Bank
The Ready Commitment: Targeting $1 billion in community giving by 2030
The Ready Commitment targets
Financial Security
$ 1 billion by 2030
Opening doors Vibrant Planet
for a more inclusive and
sustainable tomorrow
Connected Communities
Better Health
Q4 Highlights:
TD announced that it's expanding TD announced the 10 recipients of
its Patents for Startups program to the 2nd annual TD Ready Challenge.
help early stage cleantech companies Each organization will receive a C$1
protect and patent their applications – million grant to bolster their innovative
a first of its kind in North America. health solutions and deliver support to
TD will work with Accelerator Waterloo underserved and remote communities
to support companies going through across Canada and the United States.
the TD Sustainable Future Lab.
12ESG Performance
ENVIRONMENT:
Highlights
TD's low carbon commitment targets $100B, in total,
towards initiatives in low-carbon lending, financing, asset
management and internal corporate programs by 2030.
TD is the only financial institution globally to participate $30.3B TD has been carbon neutral Insurance discount
in all three of the United Nations Environment Programme Towards low-carbon since 2010. incentives offered for
Finance Initiative (UNEP FI) Task Force on Climate-related initiatives in 2017/8 Hybrids and EVs
Financial Disclosures (TCFD) pilots on lending, investment
SOCIAL:
and insurance.
Issued a US$1B green bond in 2017, one of the largest
green bonds ever issued by a bank. TD Securities has
participated in underwriting over $21B in green bonds since
2010.
89% of employees agreed that TD is doing the right things to
Recognized as the Best $91.7MM 173,000+
make a positive impact on the communities in which it does
Bank for Seniors U.S. Invested in hours volunteered by
business.
by Money magazine employee training TD employees
Recognized by external ratings organizations, including the
Bloomberg Gender Equality Index, Great Place to Work GOVERNANCE:
Institute, and DiversityInc.
High performer in sustainability indices, including the Dow
Jones Sustainability Index, FTSE4Good, Sustainalytics and
CDP.
Risk management is embedded in TD's culture and
strategy; we only take risks we can understand and manage. 36% Gender-Pay Equity First Canadian Bank
Women on Board Women earned more than 99 to join the Canadian
On December 3, TD announced the 10 recipients of the cents for every dollar earned Institute for
second annual TD Ready Challenge, each receiving C$1
by men1 Cybersecurity
million to bolster innovative health solutions and support
underserved and remote communities.
1. In base salary and total compensation, adjusted for factors such as level, geography and role.
For further information, please visit www.td.com/responsibility/. 13TD Bank Group – Key Themes
6th largest N.A. bank
by Total Assets1
1 Top 10 North American Bank 6th largest N.A. bank
by Market Cap1
Delivering
2 Proven Performance top tier long term
shareholder returns2
Highly rated
3 Strong Balance Sheet and Capital Position by major credit rating
agencies
Targeting 7-10%
4 Focus on Growth Opportunities adjusted EPS growth
over the medium
term3
1. See slide 8.
2. See slide 16. 14
3. See slide 8, footnote 1, for definition of adjusted results.Consistent Earnings Growth
Targeting 7-10% adjusted EPS growth over the medium term4
$11,686
Reported Earnings1 $11,334
(C$MM)
$10,517
Wholesale Banking
$8,936
$8,024
U.S. Retail
$7,883
Canadian Retail
2014 2015 2016 2017 2018 2019
1. For the purpose of calculating contribution by each business segment, earnings from the Corporate segment are excluded.
2. Compound annual growth rate for the five-year period ended October 31, 2019.
3. See slide 8 footnote 1 for definition of adjusted results. 15Strong, Consistent Dividend History
$2.89
Dividends Per Share
(C$)
Q1/19:
Announced $0.07
dividend increase1
Dividend yield:
4.0%2
$0.33
Target payout
range: 40%-50%3
1999 2000 2001 2002 2003 2004 2005 2006 2007 2008 2009 2010 2011 2012 2013 2014 2015 2016 2017 2018 2019 4
1. For the quarter ended April 30, 2019.
2. As of Q4/19. Dividend yield is calculated as the dividend per common share divided by the average daily closing stock price in the relevant period. Dividend per common share is derived by annualizing the
dividend per common share paid during the quarter.
3. Annualized based on declared dividend for the quarter ending April 30, 2019. 16Solid Total Shareholder Returns
Top tier total shareholder returns in 5 and 10 year periods1
Canadian North American
Ranking2 Ranking3
1-Year 7.1% 3rd 6th
3-Year 11.3% 2nd 3rd
5-Year 10.3% 1st 4th
10-Year 13.3% 1st 3rd
1. Total shareholder return (TSR) calculated based on share price movement and dividends reinvested over the trailing one-, three-, five-, and ten-year periods as of October 31, 2019. Source: Bloomberg.
2. Canadian Peer Ranking based on other 4 big banks (RY, BMO, BNS and CM). 17
3. North American Peer Ranking based on Canadian Peers and U.S. Peers. U.S. Peers – defined as Money Center Banks (C, BAC, JPM) and Top 3 Super-Regional Banks (WFC, PNC, USB).High Quality Loan Portfolio
Balances ($B unless otherwise noted)
Q3/19 Q4/19
Canadian Retail Portfolio $429.5 $434.1
Personal $349.6 $353.5
Residential Mortgages 197.5 200.0
Home Equity Lines of Credit (HELOC) 90.0 91.0
Indirect Auto 25.2 25.7
Credit Cards 18.5 18.5
Other Personal 18.4 18.3
Unsecured Lines of Credit 10.5 10.7
Commercial Banking (including Small Business Banking) $79.9 $80.6
U.S. Retail Portfolio (all amounts in US$) US$ 160.4 US$ 161.6
Personal US$ 72.4 US$ 74.2
Residential Mortgages 25.0 26.2
Home Equity Lines of Credit (HELOC)1 8.9 8.8
Indirect Auto 23.9 24.6
Credit Cards 13.8 13.8
Other Personal 0.8 0.8
Commercial Banking US$ 88.0 US$ 87.4
Non-residential Real Estate 17.8 17.6
Residential Real Estate 6.4 6.6
Commercial & Industrial (C&I) 63.8 63.2
FX on U.S. Personal & Commercial Portfolio 51.4 51.2
U.S. Retail Portfolio ($) $211.8 $212.8
Wholesale Portfolio2 $55.2 $57.5
Other3 $0.3 $0.3
Total4 $696.8 $704.7
1. U.S. HELOC includes Home Equity Lines of Credit and Home Equity Loans.
2. Wholesale portfolio includes corporate lending, other Wholesale gross loans and acceptances and loans booked in the corporate segment.
3. Other includes acquired credit impaired loans. 18
4. Includes loans measured at fair value through other comprehensive income.Strong Credit Quality
GIL and PCL Ratios (bps)
83
81
78
66
63
61 60
58 58
56
50 49
47
50 45
43
41
39 38 39
37 37 45
34 34
31
1
2007 2008 2009 2010 2011 2012 2013 2014 2015 2016 2017 2018 2019
2
IFRS IFRS 9
Gross Impaired Loans / Gross Loans and Acceptances (bps)
Provision for Credit Losses / Average Net Loans and Acceptances (bps)
1. Effective Q1/09 ratios exclude Debt Securities Classified as Loans and Acquired Credit Impaired.
2. Effective November 1, 2017, the Bank adopted IFRS 9, which replaces the guidance in IAS 39. The Bank has made the decision not to restate comparative period financial information and has recognized any
measurement differences between the previous carrying amount and the new carrying amount on November 1, 2017 through an adjustment to opening retained earnings. As such, fiscal 2018 and 2019 results reflect 19
the adoption of IFRS 9, while prior periods reflect results under IAS 39.Q4 2019 Highlights
Total Bank Reported Results (YoY) Financial Highlights $MM
Reported Q4/19 Q3/19 Q4/18
EPS down 3%
Revenue 10,340 10,499 10,136
Adjusted1 EPS down 2%
PCL 891 655 670
Revenue up 2% Expenses 5,543 5,374 5,366
Net Income 2,856 3,248 2,960
Expenses up 3% Diluted EPS ($) 1.54 1.74 1.58
Includes restructuring charges of $154MM3
($0.06/share) Adjusted1 Q4/19 Q3/19 Q4/18
Net Income 2,946 3,338 3,048
PCL up 36% QoQ Diluted EPS ($) 1.59 1.79 1.63
Segment Earnings $MM
Segment Reported Earnings (YoY)
Q4/19 Reported Adjusted1
Canadian Retail flat (up 2% adj.)1 Retail2 2,936 2,964
Canadian Retail 1,745 1,773
U.S. Retail up 7% (up 5% adj.)1
U.S. Retail 1,191 1,191
Wholesale down 44% Wholesale 160 160
Corporate (178) (178)
1. See slide 8, footnote 1.
2. "Retail” comprises the Canadian Retail and U.S. Retail segments. See the Bank’s Fourth Quarter 2019 Earnings News Release and 2019 MD&A.
3. By segment, the restructuring charges in the fourth quarter of this year are as follows: $68 million in U.S. Retail, $51 million in Corporate, $23 million in Wholesale, and $12 million in Canadian Retail.
20F'2019 Segment Highlights
Net income was $6.7B, down 4% (+3% adj.), reflecting charges related to the agreement with Air
Canada and the acquisition of Greystone, higher non-interest expenses, insurance claims, and PCL,
partially offset by revenue growth.
Canadian PCL increased 27% QoQ with growth in impaired (+15%, or $42mm) and performing (+$42mm) PCL.
Retail Expenses increased 13% (+6% adj.) reflecting charges related to the agreement with Air Canada and
the acquisition of Greystone, higher spend supporting business growth, and investment in strategic
initiatives. Expenses also included a $12MM restructuring charge.
In $USD, U.S. Retail net income increased 15% YoY (10% adjusted1).
PCL increased 17% QoQ, with PCL – impaired increasing (US$65MM, or 47%) on seasonal trends in
the auto and credit card portfolios, and PCL – performing decreased by US$33MM, primarily reflecting
U.S. Retail prior quarter parameter updates in the consumer lending portfolios.
Expenses increased US$87MM, or 2% (adj. +2%), primarily reflecting higher investments in business
initiatives and volume growth, higher employee-related costs, and restructuring charges (US$52MM)
partially offset by productivity savings.
Net income was $608MM, a decrease of $446M, or 42%, reflecting lower revenue, higher non-interest
expenses, and higher PCL.
Wholesale Non interest expenses increased $268MM, or 13%, reflecting restructuring charges of $23MM, a
favourable revaluation of certain liabilities for post-retirement benefits recognized in the prior year,
Banking continued investments supporting the global expansion of Wholesale Banking's U.S. dollar strategy,
higher initiative spend, and the impact of foreign exchange translation, partially offset by lower variable
compensation.
21
1. See slide 8, footnote 1, for definition of adjusted results.TD Bank Group – Key Themes
6th largest N.A. bank
by Total Assets1
1 Top 10 North American Bank 6th largest N.A. bank
by Market Cap1
Delivering
2 Proven Performance top tier long term
shareholder returns2
Highly rated
3 Strong Balance Sheet and Capital Position by major credit rating
agencies
Targeting 7-10%
4 Focus on Growth Opportunities adjusted EPS growth
over the medium
term3
1. See slide 8.
2. See slide 16. 22
3. See slide 8, footnote 1, for definition of adjusted results.Canadian Retail
Consistent Strategy Reported Net Income
(C$MM)
$7,183 $6,863
$6,525
$5,988
How we compete $5,938
Legendary personal connected
customer service
Focus on underrepresented
products and markets
$5,490 $5,938 $6,525 $7,183 $7,421 Adjusted1
The power of One TD
2015 2016 2017 2018 2019
Winning culture and team
Q4 2019 Highlights
Total Deposits2 C$344B Employees4 41,650
Total Loans2 C$434B Customers >15MM
Assets Under Administration C$422B Mobile Users5 5.3MM
Assets Under Management C$353B Branches 1,091
Gross Insurance Premiums3 C$4.5B ATMs5 3,509
Highest in Customer Highest in Dealer Satisfaction
Satisfaction among the Big among Non-Captive Lenders Earnings3 C$6.9B
Five Retail Banks with Retail Credit
J.D. Power 2019 Canada Retail J.D. Power 2019 Canada Dealer
Banking Satisfaction Study Finance Study
1. See slide 8, footnote 1 for definition of adjusted results.
2. Total Deposits based on total of average personal, business and wealth deposits during Q4/19. Total Loans based on total of average personal and business loans during Q3/19.
3. For trailing four quarters ending Q4/19.
4. Average number of full-time equivalent staff during Q4/19. 23
5. Active mobile users defined as TD customers who have logged in using the Canadian mobile or tablet apps (applications) within the last 90 days. Total ATMs include branch, remote, mobile and TD Branded ATMs.Canadian Retail
Personal Banking Credit Cards
#1 or #2 market share in most retail products1 #1 card issuer in Canada measured by outstanding card loan balances1
On average, 38% longer branch hours than peers2 with 346 branches Dual card issuer of high value brands, including TD First Class Visa and
offering Sunday banking TD Aeroplan Visa, and MBNA World Elite Mastercard
Digital banking leadership in Canada with the highest average monthly North American operational scale and professional expertise
number of digital unique visitors and the most digital views, visits and
minutes reflecting greater engagement3 Wealth
#1 in Customer Satisfaction4 among the Big Five Retail Banks5 Largest money manager in Canada (with the acquisition of Greystone,
which closed on November 1, 2018)6
Business Banking Market leadership in Direct Investing by asset, trades, and revenue1
#2 in Business Banking deposit and loan market share1 #1 Online Brokerage7
Customized Commercial Banking financing solutions with dedicated #1 Pension Fund Manager for the 9th consecutive year8
specialty groups in Real Estate, Agriculture, Automotive and Equipment
Finance Insurance
More than 500 dedicated Small Business Bankers in Retail branches Personal lines products in Canada, including Home & Auto, Life & Health,
In Auto Finance, rated #1 in Dealer Satisfaction among Non-Captive Creditor and Travel insurance
Lenders with Retail Credit by J.D. Power Largest direct distribution insurer9 and leader in the affinity market9
1. Market share ranking is based on most current data available from OSFI for personal deposits and loans as at Aug 2019, from The Nilson Report for credit cards as at December 2018, from the Canadian Bankers Association for Real Estate Secured
Lending as at May 2019, from the Canadian Bankers Association for business deposits and loans as at March 2019, and from Strategic Insight for Direct Investing asset, trades, and revenue metrics as at June 2019.
2. Canadian Peers are defined as RY, BNS, BMO and CM.
3. Source: Comscore MMX® Multi-Platform, Financial Services – Banking, Total Audience, 2-month average ending September 2019, Canada
4. JD Power 2019 Canada Retail Banking Satisfaction Study Award is a syndicated benchmarking study profiling the experiences of customers from the largest financial institutions in Canada. Data was collected in two waves of three weeks (June 2018
– July 2018 and January 2019) for a total of 15,175 completes. To measure customer satisfaction, critical-to-customer experience factors are examined using an index model. The study measures overall customer satisfaction based on performance in
six factors (in alphabetical order): Account Opening; Channel Activities; Communication; Convenience; Problem Resolution; and Products & Fees. The financial institution with the highest overall index score and at least 100 completed surveys in their
segment receives the award for that segment. For J.D. Power 2019 award information, visit jdpower.com/awards
5. Big 5 Canadian Retail Banks include Bank of Montreal, Canadian Imperial Bank of Commerce, Royal Bank of Canada, Scotiabank, and Toronto-Dominion Bank.
6. Strategic Insight Managed Money Advisory Service – Canada (Spring 2019 report, AUM effective December 2018), Benefits Canada 2019 Top 40 Money Managers report (May 2019 report, AUM effective December 2018); Assets under management
as of December 31, 2018 for Greystone.
7. Source: Globe and Mail online brokerage ranking on February 9, 2019.
8. Based on assets as of December 2018 (Source: 2011-2019 Top 40 Money Managers Report by Benefits Canada).
9. Based on Gross Written Premiums for Property and Casualty business. Ranks based on data available from OSFI, Insurers, Insurance Bureau of Canada, and Provincial Regulators as at December 31, 2018. 24U.S. Retail
Reported Net Income
Consistent Strategy (US$MM)
$3,750
How we compete $3,253
Legendary service and convenience $2,536
$2,234
$2,007
Grow and deepen customer
relationships
Differentiated brand as the “human”
bank $2,053 $2,234 $2,565 $3,401 $3,750 Adjusted1
Productivity initiatives that enhance
2015 2016 2017 2018 2019
both the employee and customer
experience
Q4 2019 Highlights
Conservative risk appetite C$ US$
Unique employee culture Total Deposits2 $360B $272B Employees4 26,513
Total Loans2 $214B $162B Customers >9MM
Assets Under Administration $28B $21B Mobile Users5 3.3MM
Assets Under Management $58B $44B Stores 1,241
Reported Earnings3 $5.0B $3.7B ATMs5 2,786
Highest in Customer
Highest in Small Business
Satisfaction with Retail
Banking in the South Region
Banking in Southeast J.D. Power 2019 U.S. Retail
J.D. Power 2019 U.S. Retail
Banking Satisfaction Study
Banking Satisfaction Study
1. See slide 8, footnote 1 for definition of adjusted results.
2. Total Deposits based on total of average personal deposits, business deposits and TD Ameritrade Insured Deposit Accounts (IDAs) during Q4/19. Total Loans based on total of average personal and business loans
during Q4/19.
3. For trailing four quarters ending Q4/19.
4. Average number of full-time equivalent staff during Q4/19. 25
5. Active mobile users defined as TD customers who have logged in using the U.S. mobile application within the last 90 days. Total ATMs includes store, remote, mobile and TD Branded ATMs.U.S. Retail
Personal & Commercial Banking Wealth
Rated #1 in Customer Satisfaction for Retail Banking in the Southeast Building U.S. wealth capability in the high net worth and private banking
by J.D. Power¹ space
Ranked Highest in Customer Satisfaction with Small Business Banking Acquired in 2013, Epoch Investment Partners expands overall product
in the South Region by J.D. Power2 capabilities in the U.S. and Canada
Top 10 bank3 with over 9MM customers, operating retail stores in 15
states and the District of Columbia TD Ameritrade
Open longer than the competition, including Sunday banking in most
TD Ameritrade is a leading US brokerage firm with nearly 12 million
markets
funded client accounts that total more than $1.3 trillion in assets5
#3 market share in NYC4 and targeting top 5 market share in all of our
Strategic relationship drives mutually beneficial customer referrals and
major markets, with significant opportunity to target key customer
growth
segments and deepen customer relationships
Market leadership in trading in the U.S.6
Credit Cards TD Ameritrade ranked fourth in Barron’s 2019 ranking, receiving a total
of four stars. In the 2019 review, TD Ameritrade was commended for
Private label and co-brand credit card offering for U.S. customers of adding flexibility to its platform, expanding its educational offering, and
regional and nationwide retail partners, including Target and Nordstrom leading in the integration of messaging apps7
Issuer of TD branded credit cards for retail and small business customers TD Ameritrade was awarded #1 Overall Broker in the 2019 Online
North American operational scale and professional expertise Broker Review conducted by Stockbrokers.com and was also named
the #1 broker for several “Best in Class” awards including: Trading
Auto Lending Platforms and Tools, Customer Service, Education, and Beginners. The
firm also received industry awards for Broker Innovation, Trader App
Prime indirect retail lending through dealers across the country
(Mobile Trader), Desktop Platform (thinkorswim), Trader Community
Comprehensive solutions for our dealers, including floor plan,
and New Tool (Apple Business Chat)8
commercial banking and wealth management
TD to have ownership stake in The Charles Schwab Corporation
Focused on strategic dealer partnerships where our value proposition
following Schwab's acquisition of TD Ameritrade9
best aligns with dealers’ needs and priorities
1. TD Bank received the highest score in the Southeast region of the J.D. Power 2019 U.S. Retail Banking Satisfaction Study of customers’ satisfaction with their own retail bank. For J.D. Power 2019 award information, visit jdpower.com/awards
2. J.D. Power Small Business Satisfaction Study ranking results based off of responses from 2,554 small business owners or financial decision makers in the South
3. Based on total deposits as of November 26, 2019. Source: SNL Financial, Top 50 Banks and Thrifts in the U.S..
4. Ranked 3rd based on both deposits capped at $500MM and active branch count in New York City’s five boroughs, as of October 10, 2019 (Source: FDIC SOD).
5. As of September 30, 2019.
6. Internally estimated daily average revenue client trades (DARTS) based on last twelve months publicly available reports for E*TRADE Financial and Charles Schwab as of September 30, 2019.
7. TD Ameritrade was evaluated against 13 other firms in Barron’s 24th annual Best Online Broker ranking. Barron’s did not include “best for” awards in this year’s review). Barron’s is a trademark of Dow Jones. L.P. All rights reserved.
8. TD Ameritrade was ranked #1 overall out of 16 online brokers evaluated in the StockBrokers.com 2019 Online Broker Review. TD Ameritrade has been rated #1 or Best in Class (within top 5) for two years or more in multiple categories, including:
“Platforms & Tools” (8th year in a row), “Customer Service” (9th year in a row), “Education” (8th year in a row)”, “Mobile Trading” (7th year in a row), “Research” (8th year in a row), “Offering of Investments” (5th year in a row), “Ease of Use” (3rd year
in a row), “Active Trading” (9th year in a row), “Options Trading” (9th year in a row) and “Beginners” (7th year in a row). TD Ameritrade also received awards spanning consecutive years for #1 Desktop Platform (thinkorswim) (4th year in a row) and
#1 Trader Community (5th year in a row). 26
9. For more details, see: http://td.mediaroom.com/2019-11-25-TD-to-have-ownership-stake-in-The-Charles-Schwab-Corporation-following-Schwabs-acquisition-of-TD-AmeritradeWholesale Banking
Consistent Strategy Net Income
(C$MM)
$1,039 $1,054
How we compete $920
$873
Continue to build an integrated North American
$608
dealer franchise with global execution capabilities.
In Canada, we will be the top-ranked investment
dealer.
In the U.S., we will grow client relationships by
consistently delivering value and trusted advice
in sectors where we are competitively positioned. 2015 2016 2017 2018 2019
We will continue to grow with and support our TD
partners.
Invest in an efficient and agile infrastructure,
innovation and data capabilities, to support growth
and adapt to industry and regulatory changes. Q4 2019 Highlights
Be an extraordinary and inclusive place to work by Gross Drawn1 C$24B
attracting, developing, and retaining the best talent.
Trading-related revenue (TEB)2 C$1,573MM
Top ranked dealer 4
Earnings2 C$608MM
TD Securities continued to build on Employees3 4,570
its leadership position in the
Canadian market and now occupies
the #1 or #2 spot in key domestic
rankings
1. Includes gross loans and bankers' acceptances, excluding letters of credit, cash collateral, credit default swaps, and allowance for credit losses relating to the corporate lending business.
2. For trailing four quarters ending Q4/19.
3. Average number of full-time equivalent staff during Q4/19. 27
4. See slide 32, footnote 1.Wholesale Banking
Positioned for Growth
Maintain top market shares in our Canadian franchise
− #1 or #2 ranking in key domestic categories, including fixed income trading, equity options block trading, corporate and government debt
underwriting, syndicated loans, and M&A announced and M&A completed1
− Awarded the most StarMine Analyst Awards from Refinitiv of any Canadian Broker, the fifth time within the last six years.
− Financial advisor for the $5.2 billion re-capitalization of Garda World Security, the largest ever completed for a privately-owned Canadian company.
Grow our U.S. dollar business, adding new clients and deepening our relationship value by maturing our product and advice offerings
− We onboarded over 60 new corporate clients and 9 new TD Prime Services clients, our prime brokerage business based in New York.
− Executed 13 new securitization programs and actively led 72 U.S. Investment Grade Corporate bonds, up 29% year-over-year.
− Joint book-runners on over 20 asset-backed securities (ABS) transactions, more than double the number in the prior year.
Strong Operating Model
Drive innovation and build data and analytical capabilities to improve end-to-end process efficiency and enhance client value
Permanently lower our cost structure to reflect the reduced margins and volumes in parts of our business
Maintain our focus on managing risk, capital, balance sheet, and liquidity
Investing in Our People
Continue to be an extraordinary place to work with a focus on inclusion and diversity
1. Rankings reflect TD Securities' position among Canadian peers in Canadian product markets. Equity options block trading: block trades by number of contracts on the Montreal Stock Exchange, Source:
Montreal Exchange. Syndicated loans: deal volume awarded equally between the book-runners, Source: Bloomberg. M&A announced and completed: Canadian targets, Source: Thomson Reuters.
Government and corporate debt underwriting: excludes self-led domestic bank deals and credit card deals, bonus credit to lead, Source: Bloomberg. All rankings are for calendar year-to-date October 31,
2019 unless otherwise noted. Rankings reflect TD Securities' position among Canadian peers in Canadian product markets. 28TD Bank Group – Key Themes
6th largest N.A. bank
by Total Assets1
1 Top 10 North American Bank 6th largest N.A. bank
by Market Cap1
Delivering
2 Proven Performance top tier long term
shareholder returns2
Highly rated
3 Strong Balance Sheet and Capital Position by major credit rating
agencies
Targeting 7-10%
4 Focus on Growth Opportunities adjusted EPS growth
over the medium
term3
1. See slide 8.
2. See slide 16. 29
3. See slide 8, footnote 1, for definition of adjusted results.Strong Capital & Liquidity Positions
Common Equity Tier 11
Highlights
Common Equity Tier 1 ratio of 12.1% Q3 2019 CET1 Ratio 12.0%
Internal capital generation 32
Leverage ratio of 4.0% Organic RWA increase and other (4)
Actuarial losses on employee pension plans (5)
Liquidity coverage ratio of 133%
Repurchase of common shares (14)
Repurchased 8.75 million common Q4 2019 CET1 Ratio 12.1%
shares in the quarter, and 30 million
common shares for the full year
Total Capital Ratio1
16.2% 15.9% 15.8% 16.1% 16.3%
2.5% 2.4% 2.3% 2.7% 2.7%
1.7% 1.5% 1.5% 1.5% 1.5%
12.0% 12.0% 12.0% 12.0% 12.1%
Q4/18 Q1/19 Q2/19 Q3/19 Q4/19
CET1 T1 T2
1. Amounts are calculated in accordance with the Basel III regulatory framework, and are presented based on the "all-in" methodology. The CVA capital charge was fully phased in as of the first quarter of 2019. For
fiscal 2018, the scalars for inclusion of CVA for CET1, Tier 1, and Total Capital RWA were 80%, 83%, and 86%, respectively.
30TD TLAC Requirements
TD Regulatory Capital Ratios1,3
Canadian D-SIBs will be required to meet their Notional
TLAC: 27.5%
regulatory TLAC requirements by the
November 1, 2021 implementation date.
OSFI has stipulated that D-SIBs will be
subject to 2 supervisory ratios: Minimum risk-based TLAC ratio: 23.5%
7.6%
1. Minimum risk based TLAC ratio: 23.50%
(21.50% + 2.00% Domestic Stability Risk-based TLAC Ratio: 19.9%
Buffer)
3.6%
2. TLAC leverage ratio: 6.75%
2.7%
TD expects to meet the TLAC supervisory
1.5%
ratios by the implementation date in the 23.5%
normal course without altering its business as
usual funding practices.
Unlike other jurisdictions, Canadian D-SIBs 12.1%
cannot elect to issue non bail-in unsecured
senior debt.
2
CET1 Additional Tier 2 Senior Total TLAC Legacy
Tier 1 Debt Required Senior
Debt
1. Converted at FX rate as of October 31, 2019.
2. Includes senior unsecured debt outstanding with an original term to maturity of 400 or more days and a remaining term to maturity greater than 1 year (not adjusted for carrying value).
3. Sums may not add up precisely due to rounding. 31Industry-Leading Credit Ratings
Issuer Ratings1
Rating Agencies Senior Debt Ratings2 Outlook / Trend
Moody's Aa3 Stable
S&P A Stable
DBRS AA Stable
Ratings vs. Peer Group1
Moody’s Senior Debt2 / HoldCo5 Rating S&P Senior Debt2 / HoldCo5 Rating
Aa1 AA-
Aa2 A+
Aa3
A
A1
A-
A2
A3 BBB+
Baa1 BBB
TD Canadian Peers U.S. Peers TD Canadian Peers U.S. Peers
TD Canadian Peers3 U.S. Peers4 TD Canadian Peers3 U.S. Peers4
1. As of October 31, 2019. Credit ratings are not recommendations to purchase, sell, or hold a financial obligation inasmuch as they do not comment on market price or suitability for a particular investor. Ratings are
subject to revision or withdrawal at any time by the rating organization.
2. Subject to conversion under the bank recapitalization "bail-in" regime
3. Canadian peers defined as RY, BNS, BMO and CM
4. U.S. peers defined as BAC, BBT, C, JPM, PNC, USB and WFC
5. Ratings reflect holding company senior unsecured ratings
32Leading Non-Common Equity Capital Ratings
Industry leading ratings1 for Additional Tier 1 and Tier 2 capital instruments
NVCC Tier 2 Subordinated Debt Ratings
Moody’s S&P
12
A2 12
A-
10
A3 A-
10
Baa18 8
BBB+
Baa26 6
BBB-
Baa34 4
BBB-
2
Ba1 2
BB+
a
0 a
0
TD
TD Canadian
Peer Group 1 Peers2 TD
TD Canadian
Peer Group 12
Peers
Additional Tier 1 NVCC Preferred Share Ratings
Moody’s S&P
12
A-
12
A2
10
A-
A3
10
8
BBB+
8
Baa1
6
BBB-
6
Baa2
4
BBB-
4
Baa3
2
BB+
2
Ba1 a
0
a 0 TD
TD Peer Group
Canadian 12
Peers
TD
TD
TD Canadian Peers
Peer Group
Canadian Peers
2
2 1
1. Subordinated Debt and Preferred Share ratings are as at October 31, 2019. Credit ratings are not recommendations to purchase, sell, or hold a financial obligation inasmuch as they do not comment on
market price or suitability for a particular investor. Ratings are subject to revision or withdrawal at any time by the rating organization. 33
2. In the context of subordinated debt and preferred share ratings, Canadian peers defined as RY, BNS, BMO and CM.Robust Liquidity Management
Liquidity Risk Management Framework High Quality Liquid Assets (HQLA)
TD holds a variety of liquid assets
Target a 90-day survival horizon under a combined
commensurate with liquidity needs in the
Bank-specific and market-wide stress scenario, and a
organization.
minimum buffer over regulatory requirements prescribed
by the OSFI Liquidity Adequacy Requirements (LAR)
The average eligible HQLA of the Bank for
guideline.
the purpose of LCR reporting for quarter
ended October 31, 2019, was $228.9 billion
Manage structural liquidity exposure by match funding to
(July 31, 2019 – $220.6 billion), with Level 1
asset term or market depth.
assets representing 81% (July 31, 2019 –
82%).
We maintain a comprehensive contingency funding plan
to enhance preparedness for recovery from potential Level 1 Cash &
liquidity stress events. Central Bank
Reserve
Level 1
Sovereign
Liquidity Coverage Ratio (LCR) Issued/
81%
Guaranteed Level 2A Sovereign
Level 1 MDBs, Issued/Guaranteed
PSEs, Level 2A PSEs,
140% 131% 135% 132% 133% Corp bonds,
Provincials
Municipals
120% Level 2B Equities,
19% Sovereigns, RMBS
100%
80% Q4'19 Average HQLA (CAD $B)
60%
Q1'19 Q2'19 Q3'19 Q4'19
Liquidity Coverage Ratio (LCR) Prudent liquidity management commensurate
Regulatory Minimum with risk appetite
34Deposit Overview
Domestic Leader in Deposits
Large base of personal and business deposits4 that make up 70% of the Bank's total funding
TD Canada Trust (TDCT) ranked #1 in Total Personal Deposits1
Canadian Retail competes with legendary personal connected customer service and the power of One TD to drive growth
TD U.S. Retail bank ranked in the top 102 with over 9MM customers, operating in retail stores in 15 states and the District of Columbia
Personal and Business deposits continue to show strong growth
Personal deposits have grown at 8% CAGR3 over the last 5 years
Business deposits have grown at 7% CAGR3 over the last 5 years
Deposits raised through personal and business banking channels remain the primary source of long-term funding for the Bank's non-
trading assets
Deposits enable the bank to manage its funding activities through wholesale funding markets in various channels, currencies, and tenors
PERSONAL DEPOSITS ($BN) BUSINESS & GOVERNMENT ($BN)
600
300
500 250
400 200
300 150 7% CAGR
8% CAGR
200 100
100 50
- -
1. Market share ranking is based on internally produced reports.
2. Based on total deposits as of November 26, 2019. Source: SNL Financial, Top 50 US banks & thrifts.
3. CAGR over the last 5 years is the compound annual growth rate calculated from Q4 2014 to Q4 2019 on a reported basis. 35
4. Business deposits exclude wholesale fundingLow Risk, Deposit Rich Balance Sheet1
Large base of stable retail and commercial deposits Maturity Profile6,7 (To first par redemption date) (C$B)
50
Personal and commercial deposits are TD's Issuance Maturity
primary sources of funds 40
Customer service business model delivers
30
stable base of “sticky” and franchise deposits
20
Wholesale funding profile reflects a balanced
secured and unsecured funding mix 10
Maturity profile is manageable and well balanced 0
2016 2017 2018 2019 2020 2021 2022 2023
8
MBS Covered Bond Senior Debt ABS Tier 1 Subordinated Debt
Funding Mix2 Trading
Wholesale Term Debt
P&C
Deposits5
Deposits
3%
70%
Personal Wholesale Senior
Non-Term Term Debt Unsecured MTN
Term Asset 47%
Deposits 13% Backed
40% Securities
4%
Mortgage Covered Bonds
Securitization
27%
10%
Personal Term Capital9
Other Deposits3 Short Term
Deposits 12%
25% Liabilities4
5%
14%
1. As of October 31, 2019.
2. Excludes certain liabilities which do not create funding which are: acceptances, trading derivatives, other liabilities, wholesale 6. For wholesale term debt that has bullet maturities. Subordinated debt includes certain private placement notes.
mortgage aggregation business, non-controlling interest and certain equity capital: common equity and other capital instruments. 7. Based on first par redemption date. The timing of an actual redemption is subject to management’s view at the time as well as
3. Bank, Business & Government Deposits less covered bonds and senior MTN notes.
4. Obligations related to securities sold short and sold under repurchase agreements.
applicable regulatory and corporate governance approvals.
8. Includes Preferred Shares and Innovative T1 36
5. Consists primarily of bearer deposit notes, certificates of deposit and commercial paper 9. Includes Preferred Shares, Innovative T1, and Subordinated DebtWholesale Term Debt Composition1
Funding Strategy
Wholesale term funding through diversified sources across domestic and international markets
Well-established C$55 billion Legislative Covered Bond Program is an important pillar in global funding strategy
Programmatic issuance for the established ABS program, backed by Canadian credit card receivables, in the U.S. market
Broadening of investor base through currencies, tenor and structure diversification
Recent transactions:
USD$1.25BN 1.5-year Senior Debt USD$427MM 3-year Evergreen Credit Card ABS
USD$1.50BN Long 3-year Senior Debt USD$535MM 2-year Evergreen Credit Card ABS
By Currency 2,3 By Term 2,3 Wholesale Term Debt
GBP 6%
$8B
EUR 18% Term Asset Senior
$27B Backed Unsecured MTN
AUD 3% Securities
4 to 5 Year 47%
$5B 4%
$72B 49%
6 to 7 Year
USD 34% $23B 15%
$51B
Mortgage Covered Bonds
Securitization 27%
CAD 39% 10%
$57B < 4 Year Capital4
$37B 25% 12%
> 7 Year
$16B 11%
1. As of October 31, 2019.
2. Excludes certain private placement notes.
3. In Canadian dollars equivalent. 37
4. Includes Preferred Shares, Innovative T1, and Subordinated Debt. Subordinated debt includes certain private placement notes.Canadian Registered Covered Bond Program
Key Highlights
■ Canadian residential real estate property with no more than 4 residential units
Covered Bond Collateral
■ Uninsured conventional first lien assets with original loan to value ratio that is 80% or less
■ Latest property valuation shall be adjusted at least quarterly to account for subsequent price adjustments
Housing Market Risks
using the Indexation Methodology
■ Asset Coverage Test ■ Asset Percentage
Tests and ■ Amortization Test ■ Reserve Fund
Credit Enhancements ■ Valuation Calculation ■ Prematurity Liquidity
■ Level of Overcollateralization ■ OSFI limit1
■ No less than two Rating Agencies must at all times have current ratings assigned to bonds outstanding
■ All Ratings Triggers must be set for:
Required Ratings and • Replacement of other Counterparties
Ratings Triggers • Establishment of the Reserve Fund
• Pre-maturity ratings
• Permitted cash commingling period
■ Management of interest rate and currency risk:
Interest Rate and Currency
• Interest rate swap
Risk
• Covered bond swaps
Ongoing Disclosure ■ Monthly investor reports shall be posted on the program website
Requirements ■ Plain disclosure of material facts in the Public Offering Document
■ Annual specified auditing procedures performed by a qualified cover pool monitor
Audit and Compliance
■ Deliver an Annual Compliance Certificate to the Canada Mortgage and Housing Corporation (CMHC)
1. As announced by OSFI on May 23, 2019, effective August 1, 2019, the OSFI limit equals (total assets pledged for covered bonds) / (total on-balance sheet assets) ≤ 5.5%
38TD Global Legislative Covered Bond Program
TD Covered Bond Programme Highlights Cover Pool as at Oct 31, 2019
TD has a C$55B legislative covered bond program High quality, conventional first lien Canadian Residential
mortgages originated by TD
Covered bonds issuance for Canadian issuers governed by
CMHC-administered guidelines All loans have original LTVs of 80% or lower. Current weighted
average LTV is 56%3
Only uninsured Canadian residential real estate assets are
eligible, no foreign assets in the pool The weighted average of non-zero credit scores is 773
Covered pool is composed of 100% amortizing mortgages
18%
Current LTV
Strong credit ratings; Aaa / AAA1
TD has ~C$39.8B aggregate principal amount of covered 13%
bonds outstanding and the total assets pledged for covered 10% 10% 10%
11% 10%
bonds is ~C$41.9B. TD's total on balance sheet assets are 9%
~C$1,405.4B, for a covered bond ratio of ~2.98%. Ample room
for future issuance 5%
2%
Effective January 2017, TD joined the Covered Bond Label2 1%
and commenced reporting using the Harmonized
Transparency Template
Provincial Distribution
Issuances Provincial Distribution Interest Rate Type
AUD Atlantic, 2% Credit Score
3% CAD 36% 37%
9% Quebec
9%
GBP Variable
12% British 24%
EUR Columbia,
15%
44% 20%
Ontario,
55% Fixed
7%
76%
USD Prairies, 2%
2%
32% 14%
1. Ratings by Moody’s and DBRS, respectively. For the Covered Bond program, as at October 31, 2019. Credit ratings are not recommendations to purchase, sell, or hold a financial obligation inasmuch as they do not comment on market price or
suitability for a particular investor. Ratings are subject to revision or withdrawal at any time by the rating organization.
2. The Covered Bond Label Foundation and its affiliates are not associated with and do not approve or endorse TD's covered bond products.
3. Current Loan to Value is calculated with the Teranet-National Bank House Price Index and weighted by balance.
39You can also read