2020 Half Year Results and Equity Raising - Charter Hall Retail REIT 20 February 2020 - HotCopper
←
→
Page content transcription
If your browser does not render page correctly, please read the page content below
Charter Hall Retail REIT

                                                  2020 Half Year
                                                  Results and Equity
                                                  Raising
                                                  20 February 2020

                                                  Not for release to US wire services or distribution in
                                                  the United States

Charter Hall Retail REIT 2020 Half Year Results
Important Notice

     This presentation ("Presentation") has been prepared by and is the sole responsibility of Charter Hall Retail Management                  This presentation and the information contained in it is provided for information purposes only and is not an offer or invitation or
     Limited (ABN 46 069 709 468, Australian Financial Services Licence Number 246 996) (“CHRML”) as the responsible entity                    recommendation to subscribe for, acquire or buy any securities in CQR, including the CQR Units, or any other financial products or securities in
     for Charter Hall Retail REIT (ARSN 093 143 965) (“CQR” or “the REIT”). It is a presentation of general background information             any jurisdiction. To avoid any doubt, this presentation is not a prospectus, product disclosure statement or other disclosure or offer document
     and CQR’s activities as at 31 December 2019 unless otherwise stated. It is a summary and does not purport to be complete. It              under the Corporations Act 2001 (Cth) ("Corporations Act") or other offering document under any other Australian law, or any law of any other
     is not intended to be relied upon as advice to investors or potential investors and does not take into account the investment             jurisdiction. Accordingly, this presentation does not contain all the information that would be required to be included in a prospectus, product
     objectives, financial situation or needs of any particular investor. A reader should, before making any decisions in relation to          disclosure statement or other disclosure or offer document prepared in accordance with the requirements of the Corporations Act and has not
     their investment or potential investment in CQR, seek their own professional advice. This presentation is not an offer or                 been lodged with the Australian Securities and Investments Commission ("ASIC") or any other financial services or securities regulator.
     invitation for subscription or purchase of securities or other financial products. Indications of, and guidance on, future earnings
     and financial position and performance are “forward-looking statements”. Due care and attention has been used in the
     preparation of forward looking statements. Such forward-looking statements are not guarantees of future performance and                   This presentation does not constitute an offer to sell, or the solicitation of an offer to buy, any securities in the United States. The CQR Units
     involve known and unknown risks, uncertainties, and other factors, many of which are beyond the control of CQR, that may                  have not been, and will not be, registered under the US Securities Act of 1933, as amended ("US Securities Act") or the securities laws of any
     cause actual results to differ materially from those expressed or implied in such statements. There can be no assurance that              State or other jurisdiction of the United States. Accordingly, the CQR Units may not be offered or sold, directly or indirectly, in the United States
     actual outcomes will not differ materially from those expressed or implied in such statements. All information herein is current          or to any person in the United States unless they have been registered under the US Securities Act (which CQR has no obligation to do or
     as at 31 December 2019 unless otherwise stated, and all references to dollars ($) or A$ are Australian Dollars unless otherwise           procure) or are offered and sold in a transaction exempt from, or not subject to, the registration requirements of the US Securities Act and any
     stated.                                                                                                                                   other applicable state securities laws.

     (A) UBS AG, Australia Branch and J.P Morgan Securities Australia Limited and their respective affiliates and related entities,
     their directors, employees, officers, agents and advisers ( “JLMs”), who are acting as advisers to CHRML, (B) Charter Hall                The distribution of this presentation (including an electronic copy) in the United States and other jurisdictions outside Australia may also be
     Limited, its respective affiliates and related entities (including CHRML), their directors, consultants, agents, employees, officers      restricted by law and any such restrictions should be observed. Persons who come into possession of this presentation who are not in
     and advisers (“Charter Hall Group”) (together with the JLMs, the “Limited Parties”) accept no responsibility or liability (whether        Australia should seek advice on and observe any such restrictions. Any non-compliance with such restrictions may contravene applicable
     direct or indirect, arising in negligence or otherwise) for the contents of this presentation (including any omission) . No               securities laws. Please refer to the section of this presentation headed Annexure 12 for more information.
     representation or warranty, express or implied, is made as to the accuracy, adequacy, reliability or completeness of any
     statements, estimates, opinions or other information contained in this presentation, any of which may change without notice.
     This includes, without limitation, any historical financial information and any estimates and projections and other financial
     information derived from them (including any forward-looking statement). Nothing contained in this presentation is, or may be             All information contained herein is current as at 31 December 2019 unless otherwise stated. All references to dollars ($) are to Australian dollars,
     relied upon, as a promise or representation, whether as to the past or the future. To the maximum extent permitted by law,                unless otherwise stated. The pro-forma financial information included in this presentation is for illustrative purposes and does not purport to be
     each Limited Party disclaims and excludes all liability for any direct or indirect loss or damage suffered or incurred by any             in compliance with Article 11 of Regulation S-X of the rules and regulations of the US Securities and Exchange Commission. Investors should be
     person as a result of their reliance on the information contained in this presentation or any errors in or omissions from this            aware that financial data in this presentation includes "non-IFRS financial information" under ASIC Regulatory Guide 230 "Disclosing non-IFRS
     presentation, or otherwise arising in connection with it, including, without limitation, any liability arising from fault or negligence   financial information" published by ASIC and also "non-GAAP financial measures" within the meaning of Regulation G under the US Securities
     on the part of any of them.                                                                                                               Exchange Act of 1934. Non-IFRS/non-GAAP measures in this presentation include the pro-forma financial information. CQR believes this non-
                                                                                                                                               IFRS/non-GAAP financial information provides useful information to users in measuring the financial position and conditions of CQR. The non-
                                                                                                                                               IFRS/non-GAAP financial information do not have a standardised meaning prescribed by Australian Accounting Standards and, therefore, may
     This presentation contains information as to past performance of CQR. Such information is given for illustrative purposes only,           not be comparable to similarly titled measures presented by other entities, nor should they be construed as an alternative to other financial
     and is not – and should not be relied upon as – an indication of future performance of CQR. The historical information in this            measures determined in accordance with Australian Accounting Standards. Investors are cautioned, therefore, not to place undue reliance on
     presentation is, or is based upon, information contained in previous announcements made by CQR to the market. These                       any non-IFRS/non-GAAP financial information included in this presentation.
     announcements are available at www.asx.com.au. This presentation contains certain “forward looking statements”. Forward
     looking words such as “expect”, “should”, “could”, “may”, “will”, “believe”, “forecast”, “estimate” and other similar expressions
     are intended to identify forward-looking statements. Such statements are subject to various known and unknown risks,
     uncertainties and other factors that are in some cases beyond CHRML and CQR's control. These risks, uncertainties and
     factors may cause actual results, performance or achievements to differ materially from those expressed or implied by the
     forward-looking statements and from past results, performance or achievements. Neither CHRML nor CQR can give any
     assurance or guarantee that the assumptions upon which management based its forward-looking statements will prove to
     be correct or exhaustive beyond the date of its making, or that CQR's business and operations will not be affected by other
     factors not currently foreseeable by management or beyond its control. Such forward-looking statements only speak as at
     the date of this announcement and neither CHRML nor CQR assumes any obligation to update such information.

Charter Hall Retail REIT 2020 Half Year Results
                                                                                                                                                                                                                                                                                                       2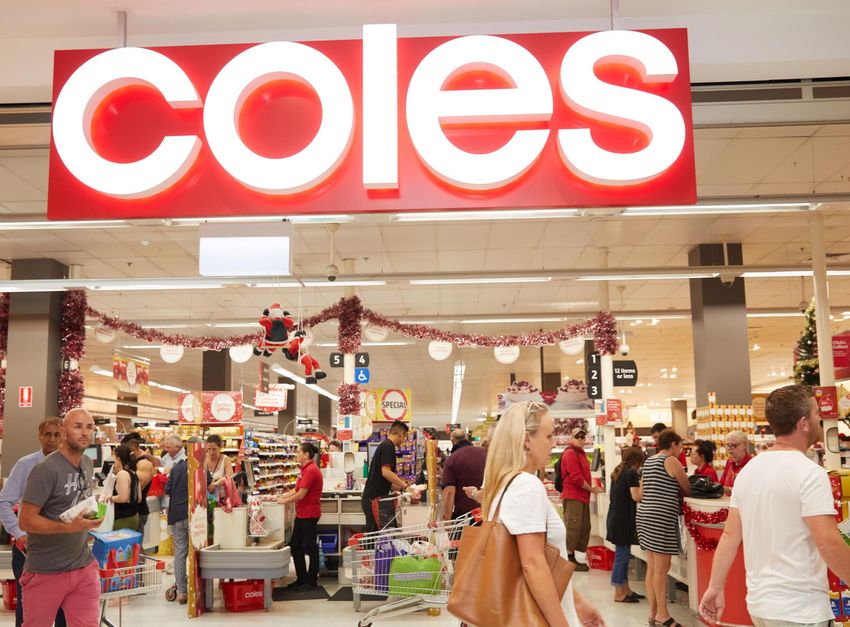
1 Highlights and Strategy
                                                           2 Financial Performance
                                                           3 Operational Performance

                                                  Agenda   4 Equity Raising
                                                           5 Outlook
                                                           6 Annexures

                                                             Greg Chubb                Christine Kelly
                                                             Retail CEO and            Head of Retail Finance and
                                                             Executive Director        Deputy Fund Manager

Charter Hall Retail REIT 2020 Half Year Results
                                                                                                                    3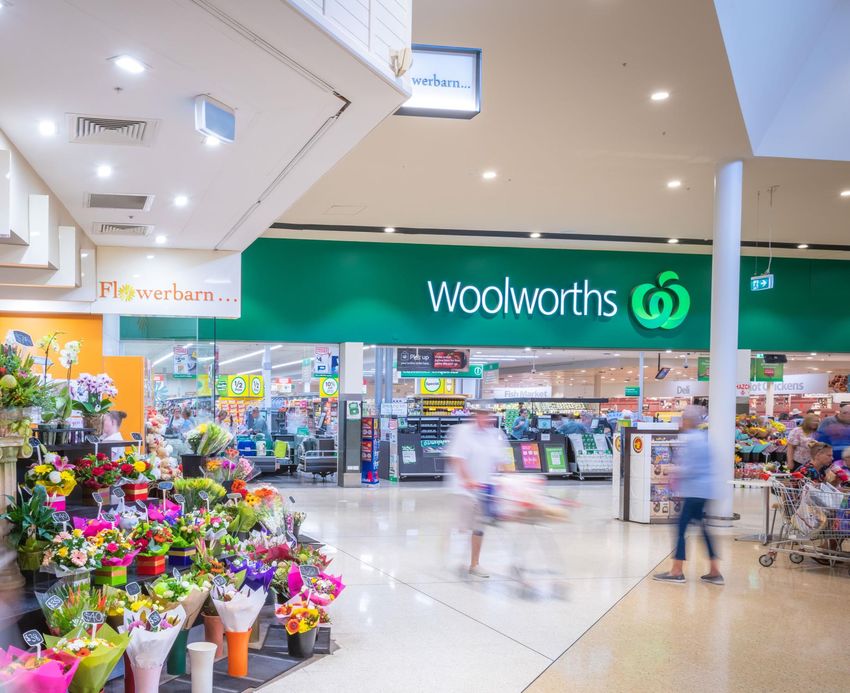
Highlights
and Strategy

Campbellfield Plaza, Vic

Charter Hall Retail REIT 2020 Half Year Results   Pacific Square, NSW
Highlights and Strategy

Key Achievements
Execution of strategy delivering growth

                                                                                      4.1%
                                                                                                                                                                        Key metrics                           1H 19        1H 20       Movement

2.2%
NPI    Growth1                                                                        Leasing spreads2
                                                                                                                                                                        Operating earnings                 $62.8m        $70.2m               11.8%

                                                                                                                                                                        Operating earnings per unit     15.61 cents   15.88 cents              1.7%

4.5%                                                                                  3.6%
                                                                                                                                                                        Distributions per unit          14.28 cents   14.52 cents              1.7%

                                                                                                                                                                        Property portfolio value         $2,982m        $3,228m               8.2%
Supermarket MAT                growth3                                                Total MAT growth4

Majors WALE increased to                                                              Operating earnings per unit

11.1yrs                                                                               1.7%
                                                                                       Growth over 1H19

                                                                                                                                                                                                                              Asquith, Sydney, NSW

                                                                                                                                                                        Addition of BP as a new anchor tenant to CQR’s convenience portfolio
1. Like-for-like
2. Specialty renewals and new leases
3. Comparable sales for stores in turnover, noting some major tenants reported a 53 week year for CY19 (estimated to be approximately 2.7% when adjusted to 52 weeks)
4. Comparable sales, noting some major tenants reported a 53 week year for CY19 (estimated to be approximately 2.3% when adjusted to 52 weeks)

Charter Hall Retail REIT 2020 Half Year Results
                                                                                                                                                                                                                                                      5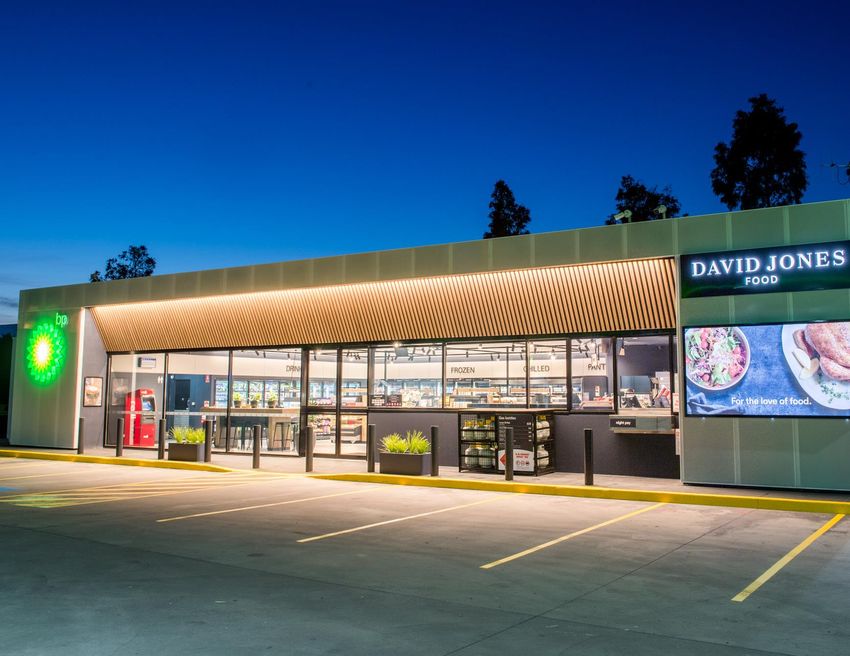
Highlights and Strategy

CQR Convenience Strategy
Providing a resilient and growing income stream for our investors

                                                       The leading owner and
                                                  manager of convenience based retail

                                                               Key Drivers

            Enhance portfolio                          Active asset                             Prudent capital
            quality                                    management                               management
            • Active portfolio curation                • Maintain strong tenant relationships   • Strong and flexible balance sheet

            • Aligning investment with major           • Enhance the customer experience        • Sustainable gearing
              tenant partners
                                                       • Optimise the tenancy mix through       • Extending capital partnerships
            • Extending WALE with quality major          proactive leasing
              tenants

Charter Hall Retail REIT 2020 Half Year Results
                                                                                                                                      6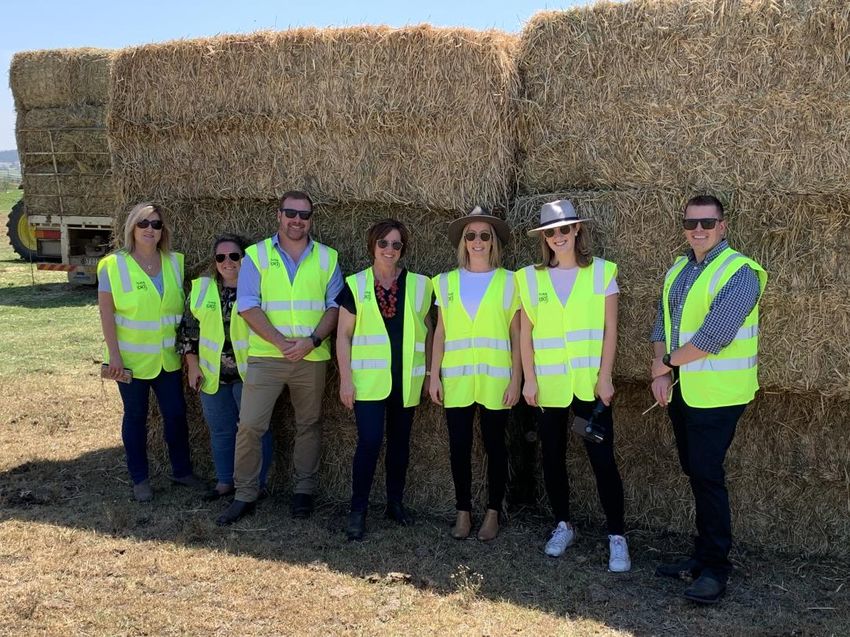
Highlights and Strategy

Delivery of CQR Convenience Strategy
Providing a resilient and growing income stream for our investors

    Enhance portfolio                                                                                            Active asset                                       Prudent capital
    quality                                                                                                      management                                         management
• Portfolio cap rate of 6.11% reflects stable                                                                     • Stable occupancy at 98.1%                      • Weighted average debt maturity of 4.4 years3
  shopping centre valuation and introduction of
  BP portfolio                                                                                                    • NPI growth2 of 2.2%                            • Balance sheet gearing of 33.3%4

• Acquired an interest in Pacific Square, NSW                                                                     • 123 renewals and 99 new leases delivering      • Increased $50 million of debt facilities
  and Bass Hill Plaza, NSW in September 2019                                                                        positive specialty leasing spread of 4.1%
                                                                                                                                                                   • No debt maturing until FY22
• Acquired 14.7% interest in BP portfolio1 in                                                                     • Lease extensions of three supermarkets
  December 2019                                                                                                                                                    • Moody’s affirmed the Baa1 issuer rating and
                                                                                                                  • Portfolio WALE of 6.9 years                      senior unsecured rating with a stable outlook
• Divested five assets totalling $106.8 million
                                                                                                                  • Solar installation complete at 9 assets with
• Contracted divestments totalling $70.6 million                                                                    scheduled installations under power
  to be settled in 2H 20                                                                                            purchase agreements now increased to
                                                                                                                    27 assets
1   CQR acquired a 30% interest in a new Charter Hall managed partnership, which acquired a 49% interest in the BP portfolio
2   Like-for-like
3   Look-through
4   Pro-forma, adjusted for contracted divestments: Carnarvon, WA, Erindale, ACT (settled in January 2020) and impacts from DRP
Charter Hall Retail REIT 2020 Half Year Results
                                                                                                                                                                                                                     7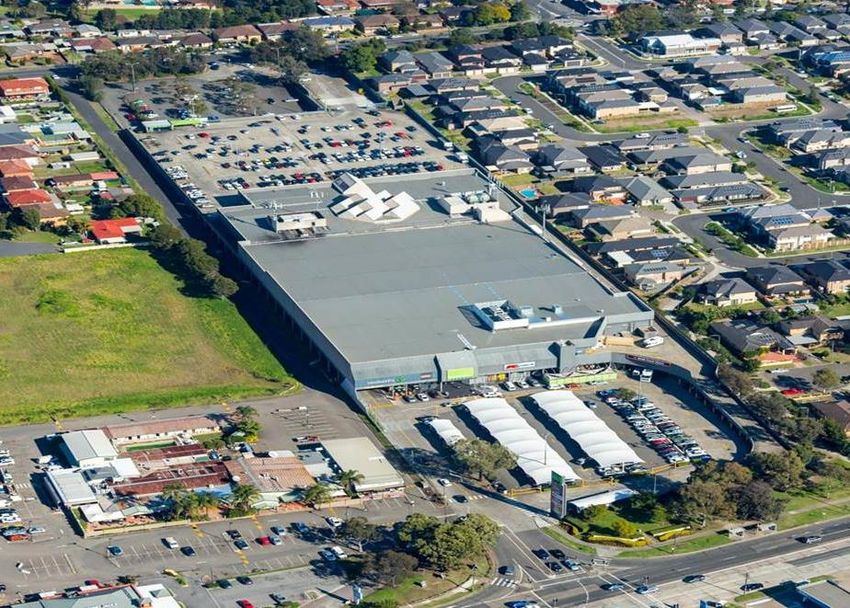
Highlights and Strategy

BP Long WALE Convenience Portfolio Acquisition
• CQR acquired 30% of a new Charter Hall managed partnership, alongside CLW1 and
  CHC1, which acquired a 49% interest in the BP Portfolio. BP Australia Pty Ltd retains a 51%
  interest
• High quality portfolio of 225 long WALE convenience retail properties that are an important
  part of the BP fuel and convenience retail distribution network
• Geographically diversified across seven Australian states and territories with 80%2 of
  properties on the eastern seaboard and 87%2 in major metro locations
• Triple net lease structure with the tenant being responsible for all outgoings, repairs,
  maintenance and capital expenditure
                                                                                                         Kingsway, VIC
• Long leases of between 18-22 years to BP Australia Pty Ltd, with an average lease term of
  20 years and annual uncapped CPI-linked rental escalations
  Portfolio details (as at December 2019)
  Properties                                                                                      225
  Property type                                                         Long WALE Convenience Retail
  Ownership interest                                                             14.7% (look through)
  Co-owners                                                                   CLW (50%), CHC (20%)
  GAV (CQR 30% interest)                                                                       $258m
  WACR                                                                                           5.5%
  Annual rent review                                                                               CPI
  Tenant                                                                          BP Australia Pty Ltd
  WALE                                                                                       20 years
  Options                                                                                 3 x 10 years
  Total portfolio site area (100% basis)                                               1,955,179 sqm      Ringwood, VIC

1 Charter Hall Long WALE REIT (CLW), Charter Hall Group (CHC)
2 Weighted by property value
Charter Hall Retail REIT 2020 Half Year Results
                                                                                                                          8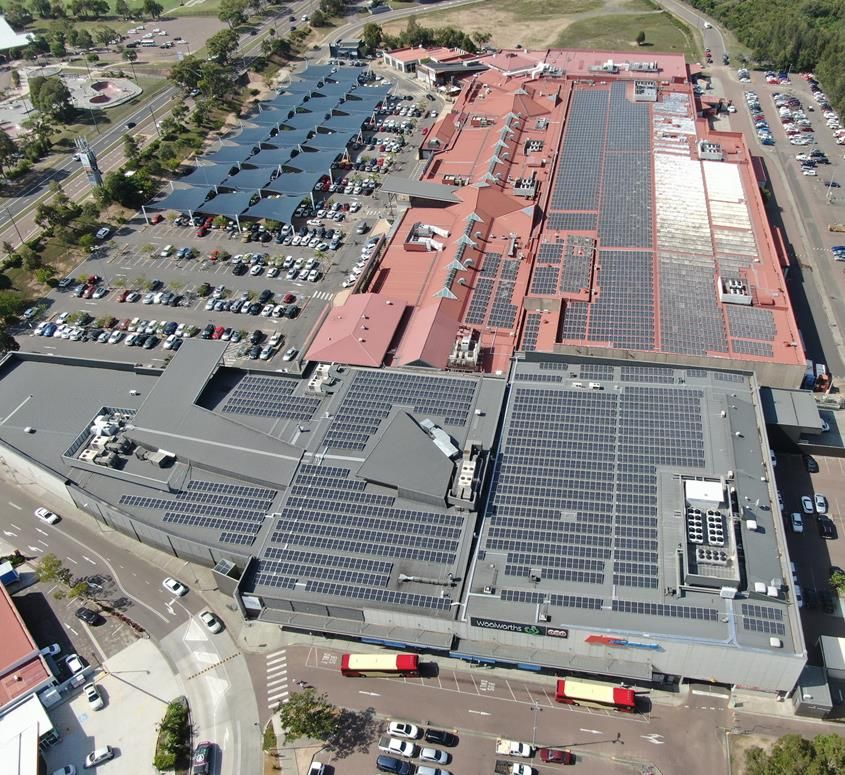
Highlights and Strategy

Pacific Square Maroubra and Bass Hill Plaza Acquisition

• CQR acquired 20% interest in Pacific Square Maroubra, NSW and Bass Hill Plaza, NSW with
  existing investor Mercer1 retaining 80%
• Both centres are well established and strong trading Sydney metropolitan convenience plus
  shopping centres and are ranked in the Top 20 SCN Mini Guns2
• Pacific Square is anchored by Coles and Aldi. Both majors recently expanded and refurbished
  their stores and perform significantly above industry benchmarks
• Bass Hill Plaza is anchored by Woolworths, Aldi and Kmart. During FY20 the centre will be
  refurbished including significant specialty tenancy remix, upgrade of amenities and expansion
  of Aldi at a cost of $11m                                                                                                                            Pacific Square, NSW

     Portfolio details
     Properties                                                                                                                            2
     Property type                                                                                                      Convenience plus
     Ownership interest                                                                                                                 20%
     Co-owners                                                                                                               Mercer (80%)
     GAV (CQR 20% interest)                                                                                                            $57m
     WACR                                                                                                                             5.67%
     Major Tenant/s                                                                                       Woolworths, Coles, 2 x Aldi, Kmart
     Major WALE                                                                                                                    8.8 years
     Total WALE                                                                                                                    5.4 years
     MAT growth                                                                                                                         3.9%
     Specialty Productivity                                                                                                      $11,621psm
     Specialty Occupancy Cost                                                                                                          13.0%
                                                                                                                                                       Bass Hill Plaza, NSW
                                                                                                                                               Ringwood, VIC
1 A global consultancy with USD304 billion in assets under delegated management as at 30 September 2019
2 Shopping Centre News Mini Guns 2019 based on Moving Annual Turnover (MAT)
Charter Hall Retail REIT 2020 Half Year Results
                                                                                                                                                                              9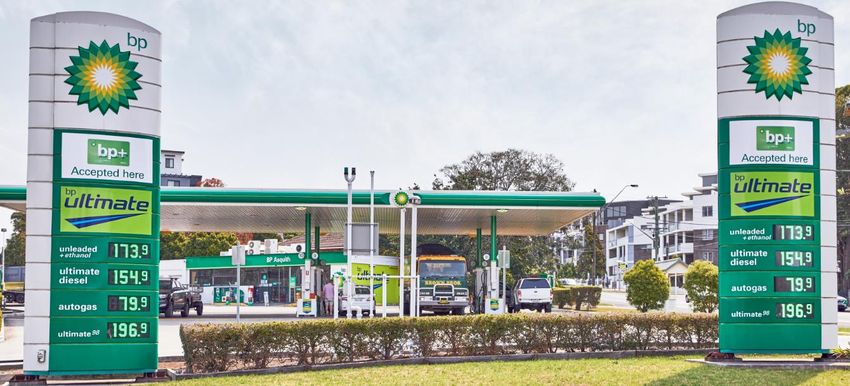
Financial
Performance

Campbellfield Plaza, Vic

Charter Hall Retail REIT 2020 Half Year Results   Bateau Bay Square, NSW
Financial Performance

Operating Earnings and Distributions

• 1H 20 operating earnings and distribution growth per unit of 1.7%        $m                                                     1H 19    1H 20

  in line with market guidance
                                                                           Net property income                                     73.4     76.0

• Total net income growth delivered by:                                    Net income from property joint ventures & associates     11.2    13.9

     – Same property NPI growth of 2.2%                                    Total net income                                        84.6     89.9
     – timing of portfolio curation
                                                                           Net finance costs                                      (15.6)    (13.1)
     – increase of $178                          million1 of   JV assets
                                                                           Other expenses                                          (6.2)    (6.6)
• Net finance costs and other expenses impacted by the timing of asset
  acquisitions and divestments and the low interest rate environment       Operating earnings                                      62.8     70.2

• Statutory profit increase on pcp due to increased investment property    Statutory Profit                                        55.5     66.7
  and valuation uplift2
                                                                           Operating earnings per unit (cents)                     15.61   15.88

                                                                           Distribution per unit (cents)                          14.28    14.52

                                                                           Payout ratio                                           91.5%    91.4%

1 Pacific Square, Bass Hill and BP portfolio investments
2 Reconciliation in Annexure 2

Charter Hall Retail REIT 2020 Half Year Results
                                                                                                                                                     11
Financial Performance
Balance Sheet
• Total property portfolio value increased by $247 million over the 6 $m Jun 19 Dec 19
month period due to:
Cash 5 11
– acquisitions exceeding divestments by $217 million
Investment properties1 2,449 2,370
– valuation movement totalling $30 million
Investment in property joint ventures & associates2 383 561
• Investment in property joint ventures has increased following
Other assets 72 74
recent shopping centre and BP portfolio acquisitions
Total assets 2,909 3,016
• Net borrowings have increased in the short-term due to timing of
acquisitions and contracted divestments Borrowings (946) (1,036)
Other liabilities3 (162) (170)
Total liabilities (1,108) (1,206)
NTA 1,801 1,810
Units on issue (million) 440.9 442.5
NTA per unit ($) 4.08 4.09
1 Includes assets held for sale
2 Dec 19 is comprised of $859 million of investment properties less $298 million of liabilities, for further details refer to Annexure 4
3 Other liabilities include derivative movements
Charter Hall Retail REIT 2020 Half Year Results
12Financial Performance
Property Valuations
• 53% portfolio1 was externally revalued at 31 December 2019
• Portfolio composition changes have led to portfolio cap rate
compression
• Like for like shopping centre portfolio cap rate remains
stable
$m Total
30 June 2019 portfolio value 2,982
Net acquisitions 217
Valuation movement 30
31 December 2019 portfolio value 3,228
June 2019 weighted average cap rate 6.18%
December 2019 shopping centre weighted average cap rate 6.16%
Bateau Bay Square, NSW
December 2019 weighted average portfolio cap rate2 6.11%
1 By value excluding assets held for sale and BP portfolio
2 Includes BP portfolio
Charter Hall Retail REIT 2020 Half Year Results
13Financial Performance
Capital Management
• No debt maturing until FY22 Key metrics Jun 19 Dec 19
Weighted average cost of debt1 3.0% 2.7%
• Established new $50 million of bank debt facilities with existing
Weighted average debt maturity 5.0 years 4.4 years
bank
Weighted average hedge maturity 3.9 years 3.4 years
• Significant undrawn facilities available to fund transactions and Interest rate hedging2 75% 78%
capital investment Interest cover ratio 4.6x 5.1x
• Moody’s affirmed the Baa1 issuer rating and senior unsecured Gearing
rating with a stable outlook Balance sheet2 32.9% 33.3%
Shopping centre portfolio look through2 35.9% 36.6%
• FY20 WACD will be approximately 2.9%
BP portfolio n/a 50.0%
Portfolio look through gearing2 35.9% 39.1%
Debt maturity profile
$350m Undrawn debt capacity $142m $114m
$300m
$250m
$200m
$150m
$100m
$50m
$0
FY19 FY20 FY21 FY22 FY23 FY24 FY25 FY26 FY27 FY28+
Drawn bank Non-recouse JV USPP's Undrawn
debt facilities drawn bank debt
1 Includes line fee (including cost of undrawn debt) and usage fee and excludes amortisation of upfront debt costs
2 Pro-forma, Dec 19 is adjusted for contracted divestments: Carnarvon, WA, Erindale, ACT (settled in January 2020) and impacts from DRP
Note: all metrics are on a look through basis
Charter Hall Retail REIT 2020 Half Year Results
14Operational Performance Campbellfield Plaza, Vic Charter Hall Retail REIT 2020 Half Year Results Pacific Square, NSW
Operational Performance
Portfolio Summary Portfolio value by state
SA TAS
ACT 0%
• Acquired interest in a convenience based retail portfolio of 225 4% 4%
assets leased to BP with 20 year WALE VIC
13%
• Acquired interest in two high quality Sydney metro assets
NSW
• Portfolio WALE increased to 6.9 years following acquisitions during 49%
WA
the period 15%
• Total MAT growth of 3.6% driven by supermarkets 3.9%,
discount department stores 4.3%, and retail services 4.4%
QLD
• NPI growth3 resilient at 2.2% 15%
Portfolio snapshot Jun 19 Dec 19
Portfolio and majors WALE
Number of shopping centres 58 55
12
Number of BP sites - 225 11
Value ($m) 2,982 3,228 10
Weighted average cap rate 6.18% 6.11% 9
GLA (‘000sqm)1 644 652 8
7
Occupancy1 98.1% 98.1%
6
Total MAT growth2 2.8% 3.6%
5
NPI growth3 2.1% 2.2% 4
WALE – total 6.5 years 6.9 years Dec-15 Jun-16 Dec-16 Jun-17 Dec-17 Jun-18 Dec-18 Jun-19 Dec-19
WALE – majors 10.4 years 11.1 years Total Majors
1 Shopping centre portfolio
2 Comparable sales, noting some major tenants reported a 53 week year for 2019 (total MAT, supermarket MAT, and DDS MAT are estimated to be approximately 2.3%, 2.3% and 2.5% respectively when adjusted to 52 weeks)
3 Like-for-like
Charter Hall Retail REIT 2020 Half Year Results
16Operational Performance
Portfolio Tenant Composition
• Major tenants Woolworths, Coles, Wesfarmers, Aldi and BP Top 10 tenant customer groups1
businesses represent 49% of rental income
• BP is now the fourth largest tenant customer at 6.1% of rental Woolworths Group 19.0%
income
Coles Group 15.0%
• Aldi is the sixth largest tenant customer with representation
increasing from nine to eleven stores Wesfarmers Ltd 7.4%
• Recent portfolio acquisitions further increase weighting to
BP 6.1%
convenience based, non-discretionary retail categories
Australian Pharmaceutical Industries 1.9%
Aldi 1.7%
The Reject Shop 1.7%
Mosaic Brands Limited 1.6%
Commonwealth Bank of Aust 0.9%
Westpac Banking Corp 0.9%
1 Calculated by rental income as at Dec 19
Charter Hall Retail REIT 2020 Half Year Results
17Operational Performance
Supermarkets Supermarkets in turnover2 MAT growth1
• Supermarkets in turnover delivered 4.5% MAT growth1 58% 4.5%
• Aldi representation increased from nine to eleven stores
Supermarket performance Jun 19 Dec 19
• Completed three supermarket lease extensions
MAT growth1 – supermarkets in turnover 4.0% 4.5%
• Coles and Woolworths refurbished three stores over the period
• Click and Collect roll out continues across the portfolio MAT growth3 3.7% 3.9%
Supermarkets in turnover2 56% 58%
Supermarkets within 10% of turnover 17% 15%
74 supermarket stores in portfolio Supermarkets in turnover
IGA
1
Aldi
11
Coles
31 72.0% 72.0% 73.0% 73.0%
70.0%
63.0%
59.0% 56.0% 17% 17% 15%
52.0% 19% 19%
22%
Woolworths 28% 21% 14%
31
51% 53% 55% 56% 58%
41% 35% 38%
31%
31-Dec-15 30-Jun-16 31-Dec-16 30-Jun-17 31-Dec-17 30-Jun-18 31-Dec-18 30-Jun-19 31-Dec-19
In turnover Within 10%
1 Comparable sales for stores in turnover, noting some major tenants reported a 53 week year for FY19 (estimated to be approximately 2.7% when adjusted to 52 weeks)
2 Includes supermarkets with fixed rent reviews
3 Comparable sales, noting some major tenants reported a 53 week year for FY19 (estimated to be approximately 2.3% when adjusted to 52 weeks)
Charter Hall Retail REIT 2020 Half Year Results
18Operational Performance
Specialty Tenants
• 222 specialty leases were completed in the period Specialty performance Jun 19 Dec 19
MAT growth2 +0.7% +2.1%
• Leasing spreads improved over the period to +4.1%
Sales productivity (per sqm) $9,672 $9,817
• 99 new leases (+4.6% leasing spread) Average gross rent (per sqm) $1,054 $1,104
• 123 renewals (+3.8% leasing spread) Specialty occupancy cost 10.9% 11.2%
Average rental increase pa 4.2% 4.2%
Retention rate 82% 77%
Rental income by tenant type1 Specialty MAT by category
Mini-majors
Non sales reporting 11%
19%
Food and food General retail
catering 22%
37%
Retail services
12%
Sales reporting specialties Homewares
70% 1% Apparel
Jewellery 10%
4% Leisure Mobile phones
6% 8%
1 Specialty tenants under SCCA guidelines (tenants who do not report sales include banks and medical etc)
2 Like-for-like
Charter Hall Retail REIT 2020 Half Year Results
19Singleton, NSW
Operational Performance
Sustainability
Environment
• 6.7MW solar installations completed at nine assets with the solar
roll-out program under PPA now increased to 27 assets
• Solar roll-out program will deliver 35% of CQR’s energy needs
• 8.3MWh batteries currently being constructed for installation at
an initial four assets to increase on-site solar utilisation and to
reduce grid demand costs1
• Charter Hall targeting net zero carbon emissions2 by 2030
• Climate change adaptation planning underway for all shopping
centres
Governance Social
• TCFD alignment underway commencing with a review of climate • Raised $196,000 to donate 27 semi-trailer loads of large bales of
governance and strategy hay and 50 truckloads of water (via Rural Aid) across 20 drought
• Charter Hall supply chain invited to participate in pilot of Property affected farming and rural communities in which we operate
Council pre-qualification supplier platform to address human • Continued partnership with The Two Good Co as part of Two
rights issues and modern slavery risks across shared operations Good’s “In Good Hands” community campaign. Distributed 6,800
and supply chains cookbooks to shoppers across 23 centres increasing awareness
of domestic violence
• Charter Hall is a signatory to the United Nations Global Compact
• Charter Hall employees volunteered 2,000 hours as part of the
Two Good Co campaign
1 CleanPeak Energy build, own and operate the batteries under a solar PV Power Purchase Agreement (PPA)
2 Scope 1 and Scope 2 emissions in Charter Hall operational control
Charter Hall Retail REIT 2020 Half Year Results
20Equity Raising
Bayside, VIC
Mosman, NSW
Campbellfield Plaza, Vic
Charter Hall Retail REIT 2020 Half Year Results Secret Harbour Bayside, VIC
Square, WAEquity raising and acquisition
Equity raising overview
• CQR has entered into an agreement to acquire a further 17.5%1 interest in a Charter Hall managed Partnership
which owns a 49% interest in a national portfolio of 225 long WALE convenience retail properties leased to BP
Australia Pty Ltd ("BP Portfolio") ("Acquisition")
Acquisition
– The purchase price is approximately $77 million
– the Acquisition is being acquired from Charter Hall Group for the same price paid when the Partnership was
first formed in December 2019, and takes CQR's total interest in the Partnership to 47.5%
• The REIT will undertake a fully underwritten institutional placement to raise $90 million ("Placement") at an issue
price of $4.81 per unit to fund the Acquisition
Equity raising • The REIT will also undertake a non-underwritten unit purchase plan ("UPP") capped at $10 million2
– Eligible unitholders in Australia and New Zealand will be invited to subscribe for up to $15,000 in additional
units, free of any brokerage or transaction costs, at the same issue price as investors in the Placement
• The REIT's pro-forma gearing will be reduced following the Acquisition and Placement, providing financial
flexibility to pursue future opportunities which are consistent with CQR's strategy
Gearing impact – Balance sheet gearing is forecast to be 32.1%
Gearing impact
– Look-through shopping centre portfolio gearing is forecast to be 36.3%
– Look-through gearing is forecast to be 37.0%
• Any proceeds under the UPP will be used to reduce debt
1 Charter Hall Group to retain 2.5%
2 Any proceeds under the non-underwritten UPP which is capped at $10m will be utilised to reduce debt. CQR may, in its absolute discretion, scale back applications over this amount or apply a higher cap to the UPP and scale back applications over the higher cap
Charter Hall Retail REIT 2020 Half Year Results
22Equity raising and acquisition
Equity raising overview (continued)
• Fixed issue price of $4.81 per unit, representing a:
– 4.8% discount to the last close price of $5.05 on 19 February 2020
Pricing
– 3.5% discount to the 5 day VWAP of $4.98 on 19 February 2020
– 6.6% FY20 forecast operating EPU yield
• Units issued under the Placement and the UPP will rank equally with existing CQR units and will be fully entitled to
Ranking
the distribution for the half year ending 30 June 2020
Sources and uses
Sources of funds $m
Placement 90
Total Sources 90
Uses of funds $m
Acquisition equity commitment 77
Transaction costs 3
Deleverage 10
Total Uses 90
Marsden Park, NSW
Charter Hall Retail REIT 2020 Half Year Results
23Equity raising and acquisition
Portfolio impact
Top 10 tenant customer groups1,3 (post acquisition)
Portfolio snapshot Dec-19 Post-Acquisition1
Major tenants Woolworths, Coles, BP, Wesfarmers and Aldi businesses to
represent in excess of 51% of rental income
Portfolio value ($m) 3,228 3,251
Woolworths Group 17.9%
Ownership interest (BPP2) 30% 47.5%
Coles Group 14.8%
Ownership interest (BP Portfolio) 14.7% 23.3%
BP 9.5%
% of Portfolio assets 8.0% 10.3%
Wesfarmers Ltd 7.3%
Majors WALE 11.1yrs 11.7yrs
Australian Pharmaceutical Industries 1.9%
Total WALE 6.9yrs 7.4yrs
BP Income as a % of the portfolio Aldi 1.7%
6.1% 9.5%
The Reject Shop 1.7%
Mosaic Brands 1.6%
Commonwealth Bank of Aust 0.9%
Westpac Banking Corp 0.8%
1 Pro-forma, Dec 19 is adjusted for contracted divestments: Carnarvon, WA, Erindale, ACT (settled in January 2020) and the acquisition of 17.5% interest in BP partnership
2 Charter Hall BP partnership
3 Calculated by rental income
Charter Hall Retail REIT 2020 Half Year Results
24Equity raising and acquisition
Indicative timetable
Event Date (2020)
Record date for UPP 7:00pm, Wednesday, 19 February
Trading halt and announcement of the transaction Thursday, 20 February
Placement bookbuild Thursday, 20 February
Trading of units recommences on the ASX Friday, 21 February
Settlement of units under the Placement Tuesday, 25 February
Allotment and normal trading of units issued under the Placement Wednesday, 26 February
UPP offer opens and booklet is dispatched Friday, 28 February
UPP offer closes Friday, 20 March
UPP allotment date Friday, 27 March
Dispatch of holding statements and normal trading of new units issued under the UPP Monday, 30 March
All dates and times are indicative only and subject to change. Unless otherwise specified, all times and dates refer to Sydney time.
Charter Hall Retail REIT 2020 Half Year Results
25Balance sheet – 31 December 2019 with pro forma impact of transactions
Pro forma as at 31-Dec-19 Pro forma as at 31-Dec-19
Post balance date Acquisition and
$m Actual as at 31-Dec-19 (pre Acquisition and (post Acquisition and
adjustments1 Placement
Placement) Placement)
Cash 11 11 11
Investment properties 2,299 2,299 2,299
Investment in JVs 561 561 78 639
Assets held for sale 71 (55) 16 16
Other assets 74 74 74
Total assets 3,016 (55) 2,961 78 3,039
Borrowings 1,036 (3) 1,033 (10) 1,023
Other liabilities 170 (64) 106 106
Total liabilities 1,206 (67) 1,139 (10) 1,128
Net tangible assets 1,810 12 1,822 88 1,910
Units on issue (millions) 442.5 2.7 445.2 18.7 463.9
NTA per unit ($) 4.09 4.09 4.12
Balance sheet gearing 34.6% 33.3% 32.1%
Look through gearing 40.2% 39.1% 37.0%
1 Includes disposal of Carnarvon, WA and Erindale, ACT and impacts from DRP
Note: Numbers may not add due to rounding
Charter Hall Retail REIT 2020 Half Year Results
26Outlook Charter Hall Retail REIT 2020 Half Year Results Bateau Bay Square, NSW
Outlook

Summary and outlook
Resilience of portfolio focused on convenience retail

• Supermarket sales continue to grow, underpinning customer visitation and financial performance
• Focus on portfolio quality through continuation of the acquisition and divestment strategy
• Strategy remains focused on non-discretionary convenience retail and every day needs
• Aligning our investment decisions with our major tenant customers

  Barring unforeseen events, subject to timing of divestments and including the impact
  of the Acquisition and Placement, CQR's FY20 guidance is for operating earnings to
                                 grow by 2.3% over FY19
   Distribution payout ratio range is expected to be 90% - 95% of operating earnings

Charter Hall Retail REIT 2020 Half Year Results
                                                                                                   28
Annexures
Gateway Plaza, Vic
Campbellfield Plaza, Vic
Charter Hall Retail REIT 2020 Half Year Results Salamander Bay Square, NSWAnnexures
01 FY20 earnings bridge
08 Property valuations
02 Reconciliation of statutory profit to
operating earnings (FFO) and AFFO 09 Specialty sales performance
03 NTA per unit reconciliation
10 Shopping centre portfolio historical performance
04 Investment in property joint ventures
and associates
11 BP portfolio overview
05 12
Debt maturities and covenants Key risks, selling restrictions and underwriting
agreement associated with the equity raise
06 13
Convenience focused portfolio Glossary
07 Lease expiry profile
Charter Hall Retail REIT 2020 Half Year Results
30Annexure 1
FY20 earnings bridge (cpu)
1.1 (2.7)
0.4 (0.1)
2.0
31.80
31.53 31.8
or
31.1 2.3%
growth
per
annum
29.54
FY19 EPU NPI Divestments FY19 & FY20 Acquisitions Finance Costs Divestments FY20 EPU
(contracted & settled) (incl. equity raises) (forecast)
The earnings guidance of 2.3% cpu growth per annum is due to the timing of potential further divestments over FY20
• NPI reflecting same property NPI growth of 2.2% and stabilisation of Lake Macquarie Square NSW redevelopment
• NPI on divestments of $177m contracted and settled divestments over FY20
• Impact of acquisitions in FY19 (including equity raise) and 1H20 of RP6 and BP Portfolio (1H20 and 2H20 including equity raise)
• Impact of the Acquisition and Placement
• Reduction in finance costs is driven by lower forecast rates offset by reduction in capitalised interest
• Impact of potential further $100 million in divestments
Note: Numbers may not add due to rounding
Charter Hall Retail REIT 2020 Half Year Results
31Annexure 2
Reconciliation of statutory profit to operating earnings (FFO) and AFFO
$m 1H 20 ($m)
Statutory profit 66.7
Revaluations (net)1 (5.1)
Net loss on derivative financial instruments 1.5
Divestment costs 2.5
Other 4.6
Operating earnings (FFO) 70.2
Less: capital expenditure (5.9)
Adjusted Funds From Operations (AFFO) 64.3
Distribution 64.3
1 Includes revaluation of straight-lining and incentives amortisation
Note: Numbers may not add due to rounding
Charter Hall Retail REIT 2020 Half Year Results
32Annexure 3
NTA per unit reconciliation
$0.01 ($0.01)
$0.01 $4.09
$4.08
Jun-19 NTA Operating earnings Valuation uplift Other 1 Dec-19 NTA
(net of distribution)
1 Includes derivative movements and disposal costs
Charter Hall Retail REIT 2020 Half Year Results
33Annexure 4
Investment in property joint ventures and associates– balance sheet breakdown
$m Jun 19 Dec 19 Movement
Shopping Centre investment properties 533 601 68
BP Portfolio investment properties nil 258 258
Borrowings (141) (290) (149)
Net other (9) (8) 1
Investment in property joint ventures & associates 383 561 178
Marsden Park, NSW Salamander Bay Square, NSW Gateway Plaza, VIC
Charter Hall Retail REIT 2020 Half Year Results
34Annexure 5
Debt maturities and covenants
Debt facility (ownership interest) Limit Drawn Rate Maturity
($m) ($m)
JV debt – CHRP1 110 96 Floating Jun-22
JV debt – CHRP2 55 50 Floating Aug-24
JV debt – CHRP6 21 20 Floating Dec-22
JV debt – BP Portfolio 135 124 Floating Dec-24
$50m Nov-21
$175m Jun-22
$150m Jul-22
Bank debt facilities 710 607 Floating $40m Nov-22
$75m Jul-23
$50m Aug-23
$95m Nov-23
$75m Nov-23
USPP – May 2016 177 177 Floating May-26
USPP – July 2015 252 252 Floating Jul-27
Grand total 1,460 1,326
Charter Hall Retail REIT 2020 Half Year Results
35Annexure 6
Convenience focused portfolio generating 150 million shopper visits annually
22 Convenience assets
Convenience Convenience
• Single supermarket and complementary convenience specialty compared to Plus compared to
neighbourhood1 sub-regional1
• Specialty productivity across the convenience portfolio outperforms
the Urbis neighbourhood benchmark1 Supermarket productivity Greater than 12% Greater than 12%
• Supermarkets across the convenience portfolio outperform the Urbis Specialty productivity Greater than 20% Greater than 0%
neighbourhood benchmark in terms of both sales volumes and
Size variance Less than 18% Less than 37%
productivity1
Supermarket floorspace representation Greater than 9% Greater than 31%
23 Convenience Plus assets Discretionary specialty floorspace Less than 42% Less than 50%
• Multiple supermarkets and/or supermarket and a discount department
store with complementary convenience specialty and retail services
• Significantly smaller than the 29,502sqm Urbis sub-regional benchmark1
• Greater supermarket space allocation than the Urbis sub-regional
benchmark1
• Half the discretionary specialty retail compared to the Urbis sub-regional
benchmark1
1 Source: Urbis Shopping Centre Benchmarks 2019; Urbis
Charter Hall Retail REIT 2020 Half Year Results
36Annexure 7
Lease expiry profile as at 31 December 2019
Major tenant expiry profile (by income)
11.1 years 100%
87.5%
Major tenant WALE 80%
60%
6.9 years 40%
Portfolio WALE 20%
0.8% 2.0% 2.4% 2.3% 3.6% 1.4%
0.0%
0%
FY20 FY21 FY22 FY23 FY24 FY25 FY26 FY27+
3.2 years
Specialty and mini-major tenant WALE Specialty and mini-major tenant expiry profile (by income)
25%
19.6%
20%
16.9%
14.6%
15% 13.3%
10.7% 11.0%
10% 8.6%
5.3%
5%
0%
FY20 FY21 FY22 FY23 FY24 FY25 FY26 FY27+
Charter Hall Retail REIT 2020 Half Year Results
37Annexure 8
Property valuations as at 31 December 2019
State Property Location Ownership interest (%) Book Value ($m) Cap Rate
ACT Dickson Woolworths Dickson 100.0% 19.7 6.00%
Manuka Terrace Manuka 100.0% 58.7 6.00%
ACT Total 78.4
NSW Bass Hill Plaza Bass Hill 20.0% 18.9 6.00%
Bateau Bay Square Bateau Bay 49.9% 115.8 6.00%
Carnes Hill Marketplace Horningsea Park 50.0% 70.0 5.50%
Cootamundra Woolworths Cootamundra 100.0% 14.9 6.50%
Dubbo Square Dubbo 100.0% 51.5 7.00%
Gordon Village Centre Gordon 100.0% 142.0 5.07%
Goulburn Square Goulburn 100.0% 83.0 6.25%
Highlands Marketplace Mittagong 50.0% 41.8 6.00%
Jerrabomberra Village Jerrabomberra 100.0% 29.6 6.00%
Kings Langley Shopping Centre Kings Langley 100.0% 46.0 6.00%
Lake Macquarie Square Mount Hutton 100.0% 141.5 6.00%
Morisset Shopping Centre Morisset 100.0% 43.9 6.75%
Mudgee Metroplaza Mudgee 100.0% 28.6 6.25%
Orange Central Square Orange 100.0% 55.0 6.25%
Pacific Square Maroubra 20.0% 38.2 5.50%
Parkes Metroplaza Parkes 100.0% 23.3 6.50%
Pemulwuy Marketplace Greystanes 50.0% 17.8 5.50%
Rockdale Plaza Rockdale 100.0% 151.0 5.75%
Charter Hall Retail REIT 2020 Half Year Results
38Annexure 8
Property valuations as at 31 December 2019
State Property Location Ownership interest (%) Book Value ($m) Cap Rate
NSW (cont.) Rutherford Marketplace Rutherford 50.0% 20.5 6.13%
Salamander Bay Square Salamander Bay 50.5% 89.1 6.00%
Singleton Square Singleton 100.0% 121.1 6.62%
Sunnyside Mall Murwillumbah 100.0% 50.0 6.50%
Tamworth Square Tamworth 100.0% 54.5 6.75%
Tumut Coles Tumut 100.0% 11.2 6.00%
West Ryde Marketplace West Ryde 50.0% 28.5 5.25%
NSW Total 1,487.7
QLD Allenstown Square Rockhampton 100.0% 51.5 7.00%
Arana Hills Shopping Centre Arana Hills 100.0% 67.5 6.00%
Atherton Square Atherton 100.0% 39.4 6.25%
Bay Plaza Hervey Bay 100.0% 26.5 6.50%
Bribie Island Shopping Centre Bribie Island 100.0% 65.5 6.00%
Currimundi Markets Currimundi 100.0% 45.0 5.75%
Gatton Square Gatton 100.0% 25.8 6.00%
Highfields Village Highfields 100.0% 42.5 6.00%
Mareeba Square Mareeba 100.0% 21.0 6.50%
Sydney Street Markets Mackay 100.0% 38.4 6.75%
QLD Total 423.1
SA Brickworks Marketplace Torrensville 50.0% 34.3 6.50%
Southgate Square Morphett Vale 100.0% 80.0 6.25%
SA Total 114.3
Charter Hall Retail REIT 2020 Half Year Results
39Annexure 8
Property valuations as at 31 December 2019
State Property Location Ownership interest (%) Book Value ($m) Cap Rate
VIC Campbellfield Plaza Campbellfield 100.0% 76.8 6.00%
Gateway Plaza Leopold 50.0% 65.5 6.00%
Lansell Square Kangaroo Flat 100.0% 95.0 6.75%
Rosebud Plaza Rosebud 100.0% 128.1 6.00%
VIC Total 365.4
WA Albany Plaza Albany 100.0% 63.9 6.56%
Esperance Boulevard Esperance 100.0% 34.0 6.50%
Kalgoorlie Central Kalgoorlie 100.0% 44.8 6.75%
Maylands Coles Maylands 100.0% 17.6 5.25%
Narrogin Coles Narrogin 100.0% 13.0 5.75%
Secret Harbour Square Secret Harbour 100.0% 99.7 6.25%
South Hedland Square South Hedland 100.0% 76.5 7.25%
Swan View Shopping Centre Swan View 100.0% 21.3 6.00%
Wanneroo Central Wanneroo 50.0% 61.0 6.25%
WA Total 431.7
Assets held for sale 70.6
CQR shopping centre portfolio 2,971.2
BP portfolio 14.7% 257.5 5.50%
Total CQR portfolio 3,228
Charter Hall Retail REIT 2020 Half Year Results
40Annexure 9
Specialty sales performance
Specialty sales Proportion of Specialty sales Proportion of
MAT growth1 MAT growth1
by state specialty sales by category specialty sales
NSW & ACT 61% 1.7% Food and food catering 37% 2.1%
WA 10% 4.8% General retail 22% 3.7%
VIC 10% 1.2% Retail services 12% 4.4%
SA 4% 0.6% Clothing and apparel 10% (1.6%)
QLD 15% 2.7% Leisure 6% (4.8%)
Total 100% 2.1% Mobile phones 8% 10.0%
Jewellery 4% (3.0%)
Homewares 1% (3.0%)
Total 100% 2.1%
1 Like-for-like
Charter Hall Retail REIT 2020 Half Year Results
41Annexure 10
Shopping centre portfolio historical performance
Dec-14 Jun-15 Dec-15 Jun-16 Dec-16 Jun-17 Dec-17 Jun-18 Dec-18 Jun 19 Dec 19
Number of properties 78 73 76 74 72 71 66 58 58 58 55
Occupancy 98.5% 98.4% 98.4% 98.0% 98.0% 98.0% 97.8% 98.1% 98.1% 98.1% 98.1%
Same property NPI growth1, 2 3.4% 2.4% 2.4% 2.2% 2.4% 1.0% 1.3% 1.8% 2.1% 2.1% 2.2%
3 3
Major tenant MAT growth 2.2% 1.0% 1.2% 1.7% 2.8% 4.0% 2.8% 2.7% 1.8% 3.4% 4.0%
Specialty leasing spread2 2.0% 1.5% 1.4% 1.4% 1.2% 0.2% 0.8% 1.3% 1.9% 0.8% 4.1%
Renewals2 1.8% 1.9% 0.4% 1.0% 0.5% 0.0% 0.2% 1.5% 2.4% 0.0% 3.8%
New leases2 2.6% 0.1% 4.3% 3.0% 2.9% 0.7% 2.1% 0.9% 0.9% 2.4% 4.6%
Number of leasing transactions 138 169 151 162 181 212 192 208 172 194 222
Average specialty gross rent psm $895 $905 $942 $973 $982 $989 $994 $1,006 $1,030 $1,054 $1,104
Average specialty sales psm $8,983 $9,009 $9,151 $9,302 $9,360 $9,186 $9,439 $9,536 $9,583 $9,672 $9,817
Average specialty occupancy cost 10.0% 10.0% 10.3% 10.5% 10.5% 10.8% 10.5% 10.5% 10.7% 10.9%% 11.2%
1 Like-for-like
2 Financial year to date
3 Comparable sales, noting some major tenants reported a 53 week year for FY19 (estimated to be approximately 2.3% when adjusted to 52 weeks)
Charter Hall Retail REIT 2020 Half Year Results
42Annexure 11
BP portfolio overview
Geographically diversified portfolio of 225 properties with 87% 1 located in metropolitan locations
QLD
62 properties
Metro 35
WA Commuter metro 10
44 properties Non-metro 17
Metro 34
Commuter metro 2 NT NSW
Non-metro 8
QLD 77 properties
28% Metro 50
WA
SA 16%
Commuter metro 10
Non-metro 17
2 properties
SA
Metro
Non-metro
1
1
1%
NSW ACT
35% 5 properties
Metro 5
TAS ACT
2%
5 properties VIC
Metro 5 17%
VIC
30 properties
TAS Metro 22
1% Commuter metro 3
Non-metro 5
1 Weighted by property value
Charter Hall Retail REIT 2020 Half Year Results
43Annexure 12
Key risks, selling restrictions and underwriting agreement associated with equity raise
Investors should carefully consider the risks factors described below. Additional risk factors and uncertainties that are not known to the Responsible Entity, Charter Hall Retail Management Limited (CHRML) at the time of this Offer or which are considered
immaterial, may in the future materially impact CQR assets, financial condition or operations and may have an adverse effect on an investment in CQR. More information on CHRML’s approach to Corporate Governance and risk management can be found
in the “About Us” section of the CQR website charterhall.com.au/cqr
Transaction specific risks
Co-ownership risk
The REIT holds a number of interests in its portfolios with its partners through joint co-ownership arrangements. Although in many cases, the REIT has control over or significant influence on the decision-making of these joint co-ownership arrangements,
certain decisions require approval of all the directors or security holders of entities the REIT does not control. The co-operation among the partners of such entities on existing and future business decisions is an important factor for the sound operation and
financial success of such businesses. The partners in these investments may have objectives different from those of the REIT, or be unable or unwilling to fulfil their obligations under the relevant joint co-ownership agreement. In order to minimise the risks
associated with the development and operation of its joint co-ownership arrangements, the REIT seeks to enter into joint co-ownership arrangements with partners whom the REIT considers to be reputable, creditworthy and reliable and on terms
favourable to the REIT. Although to date CQR has not experienced any significant disputes with its partners, disputes among co-ownership partners over co-ownership obligations or otherwise could have an adverse effect of the financial conditions or
results of operations of these businesses.
CQR will not be able to exercise its full discretion in its decision making with respect to the BP Portfolio, as CQR will be a co-owner (49.9%) of the trust (“Trust”) that holds a 49% interest in the BP Portfolio, a BP majority board will manage the governance of
the new managed partnership. There are also co-ownership arrangements in place in terms of the Trust between CQR, CHC and CLW.
Unrealised capital gains
The BP Portfolio Trust will inherit the existing cost base of the BP Portfolio which is below the implied purchase price. The impact of any capital gains would be to reduce the tax deferred component of the REIT’s distributions. A capital gain in the Charter Hall
managed Partnership is only triggered through individual asset divestitures which are not anticipated to occur at scale during the lease term. However, if all properties were sold as individual asset divestures at the implied purchase price, the CGT liability
would be approximately 42% of CQR’s purchase price. If CQR sold units of the Charter Hall managed Partnership that owns the 49% interest in the BP Portfolio, the cost base would be the purchase price of those units.
Risks relating to CQR
Acquisition risk
Whilst CQR expects the Acquisition to proceed as advised in this presentation, if the Acquisition in fact fails to complete or completion is delayed, the expected financial performance of CQR could be adversely affected. If the Acquisition does not complete
and CQR has raised funds under this Offer, CQR will need to consider alternative uses for, or ways to return, those funds.
Reliance on information provided
CQR undertook a due diligence process in respect of the Acquisition. CQR has not been able to verify the accuracy, reliability or completeness of all the information which was provided to it against independent data. Similarly, CQR has prepared (and made
assumptions in the preparation of) the financial information relating to the Acquisition included in this presentation in reliance on limited financial information and other information provided by the vendor. If any of the data or information provided to and
relied upon by CQR in its due diligence process and its preparation of this presentation proves to be incomplete, incorrect, inaccurate or misleading, there is a risk that the actual financial position and performance of CQR may be materially different to the
financial position and performance expected by CQR and reflected in this presentation. Investors should also note that there is no assurance that all material issues and risks in respect of the Acquisition have been identified. Therefore, there is a risk that
unforeseen issues and risks may arise, which may also have a material impact on CQR.
Underwriting
CQR has entered into an underwriting agreement under which the underwriter of the Offer has agreed to fully underwrite the Offer, subject to the terms and conditions of the underwriting agreement between CQR and the underwriters (‘Underwriting
Agreement’). The underwriter’s obligation to underwrite the Offer is conditional on certain customary matters. Further, if certain events occur, the underwriter may terminate the Underwriting Agreement. Termination of the Underwriting Agreement is likely to
have an adverse impact on the amount of proceeds raised under the Offer, and CQR's ability to complete the Acquisitions as currently planned and fund transaction costs, and could materially adversely affect CQR's business, cash flow, financial
performance, financial conditions and share price.
Unrealised capital gains
As CQR is already established, there is a risk that unrealised capital gains exist within the portfolio. As such, the disposal of an existing property may crystalise a capital gain that will be distributed to investors and will need to be included in the calculation of
the investor’s taxable income. The impact of this will depend on a number of factors including the price and timing of the sale and the profile of the investor.
Charter Hall Retail REIT 2020 Half Year Results
44Annexure 12
Key risks, selling restrictions and underwriting agreement associated with equity raise
Rental Income
Distributions made by CQR are largely dependent on the rents received from tenants across the portfolio and expenses incurred during operations, which may be affected by a number of factors, including:
• overall economic conditions;
• the financial circumstances of tenants (on the date the units are allotted under the Offer in accordance with the Timetable, and in the future);
• the ability to negotiate lease extensions or replace outgoing tenants with new tenants;
• the occurrence of rental arrears or any vacancy periods;
• reliance on a tenant which leases a material portion of CQR's portfolio;
• an increase in unrecoverable outgoings; and
• supply and demand in the property market.
Any negative impact on rental income (including as a result of a failure of existing tenants to perform existing leases in accordance with their terms) has the potential to decrease the value of CQR and have an adverse impact on distributions or the value of
units or both.
Re-leasing and vacancy risk
CQR's portfolio’s leases will come up for renewal on a periodic basis. There is a risk that CQR may not be able to negotiate suitable lease renewals with existing tenants, maintain existing lease terms, or replace outgoing tenants with new tenants. This may
result in a reduction in CQR's Operating Earnings and distributions and a reduction in the value of the assets of CQR.
Operator risk
While the REIT is not an operator of any of the retail properties in the REIT’s portfolio, the valuation and yield of these assets could be materially adversely affected by a number of operational risks of the tenants of those properties, including competition and
regulation of operators. In particular, the REIT may be affected in the case of the BP Portfolio, by increased competition in the fuel retailing industry, changes in legislation and government policies that regulate fuel and retailing, and changes in the nature of
vehicle transport including the uptake of electric and autonomous vehicles.
A deterioration in an operator’s financial strength and stability or a deterioration of in the operator’s business or in the prospects of the operator’s industry generally could materially impact the REIT’s results of operations, the value of its properties and its
stapled securities.
Funding
The Responsible Entity may fund future refinancing, capital expenditure and acquisitions from either debt or equity markets. CQR's ability to raise funds from either market on favourable terms is dependent on a number of factors including:
• the general economic and political climate;
• the state of debt and equity capital markets;
• the performance, reputation and financial strength of CQR; and
• the value of the properties.
Changes to any of these or other factors could lead to an increased cost of funding, limited access to capital, increased refinancing risk for CQR and / or an inability to expand operations or purchase assets in a manner that may benefit CQR and its
unitholders.
Extension and refinancing
CQR's ability to refinance or repay its debts as they fall due will be impacted by market conditions, the financial status of CQR, the value of CQR’s properties, and prevailing economic conditions, including interest rates, at the time of maturity or refinancing.
There is a risk that CQR may not be able to extend or refinance its debts before maturity. Possible increases in the interest rate, the cost of interest rate hedges and the level of financial covenants required by lenders may also adversely impact the
operating and financial performance of CQR, the distributions of CQR and CQR's ability to raise equity and / or enter into new debt facilities.
In these circumstances, CQR may need to raise further equity, dispose of assets for a lower market value than could otherwise have been realised, or enter into new debt facilities on less favourable terms. There is also a risk that CQR may be unable to
hedge future borrowings to mitigate future interest rate risk, or that the terms of such hedging are less favourable than the existing terms.
Debt facility undertakings and covenants
CQR is subject to a number of undertakings and covenants under existing debt facilities, including in relation to gearing ratio and interest cover ratios. An event of default would occur if CQR fails to maintain these financial covenants. This may be caused by
amongst other factors, unfavourable movements in interest rates (to that extent interest rates are not hedged) or deterioration in the income or the value of CQR's portfolio. In the event that an event of default occurs, the lender may require immediate
repayment of a debt facility. CQR may need to dispose of some or all of its properties for less than their book value, raise additional equity, or reduce or suspend distributions in order to repay a debt facility.
Gearing
The level of gearing exposes CQR to any changes in interest rates and increases CQR's exposure to movements in the value of CQR's portfolio or performance measures. Higher gearing will increase the effect. If the level of gearing increases over the term
of CQR's debt financing, this may create refinancing risk on CQR's debts as it approaches expiry.
Charter Hall Retail REIT 2020 Half Year Results
45Annexure 12
Key risks, selling restrictions and underwriting agreement associated with equity raise
Property valuation risk
The value of each property held by CQR, and those it may hold in the future, may fluctuate due to a number of factors affecting both the property market generally or CQR's properties in particular. These factors include, but are not limited to:
• changes in market rental rates;
• changes in property yields;
• fluctuating occupancy levels;
• tenants defaulting;
• supply and demand in the relevant property market;
• increased competition from new or existing properties;
• a downturn in the property market generally;
• pricing or competition policies of any competing properties or tenants; and
• general economic conditions, such as interest rates.
These factors may change for a variety of reasons including those set out above in respect of these particular risks. A reduction in the value of any property may adversely affect the value of units in CQR. It may also impact CQR’s financing arrangements
(refer to Funding risk). Property values may fall if the underlying assumptions on which the property valuations outlined in this Presentation are based, change in the future. As changes in valuations of investment properties are recorded in the statutory
income statement, any decreases in value will have a negative impact on the statutory income of CQR. As property values fluctuate, so too may returns from property assets. Rental and occupancy levels may change as a result of changes in the property
market and this may affect the distributions paid by CQR and the market price of units. CQR will have its properties independently revalued regularly in accordance with its valuation policy. The independent valuations of the properties are the best estimates
of the independent valuers at the time of undertaking the valuation and may not reflect the actual price a property would realise if sold. The independent valuations are subject to a number of assumptions which may prove to be inaccurate.
Property liquidity
By their nature, investments in real property assets are illiquid investments, and there is a risk that should CQR be required to realise property assets, it may not be able to do so in a short period of time, or may not be able to realise a property asset for the
amount at which it has been valued. This may adversely affect CQR's net tangible assets and the value of units in CQR.
Development risk
CQR will focus on sustainable income returns and minimising development risk. CQR will not undertake speculative development. Any development risk will be substantially mitigated through fixed price construction contracts, and undertaking pre-leasing
activities relating to the development, both prior to and during, construction. CQR will endeavour to achieve a level of pre-commitment appropriate to the project prior to commencing development activities.
No guarantee of distribution or capital return
No guarantee can be given as to the amount of any income or capital return from the units or the performance of CQR, nor can the repayment of capital from CQR be guaranteed.
Management performance
CQR will be reliant on the expertise, experience, and strategies of its executive directors and management of Charter Hall Group. As a result, the loss or unavailability of key personnel at Charter Hall Group could have an adverse impact on the management
and financial performance of CQR and therefore returns to unitholders.
Capital expenditure
CQR will be responsible for capital expenditure that may arise. There is a risk that the actual required capital expenditure may exceed currently expected expenditure which could lead to increased funding costs and impact distributions. Additionally, any
requirement for unforeseen material capital expenditure on the properties could impact the performance of CQR.
Acquisitions
In addition to acquiring the assets in connection with this Acquisition, CQR will continue to identify new investment opportunities for potential acquisition. CQR will endeavour to conduct all reasonable and appropriate due diligence on potential investment
opportunities. There is a risk that CQR will be unable to identify suitable investment opportunities that meet CQR's investment objectives. Even if such opportunities are identified, they may not be able to be secured on appropriate terms. These factors may
restrict CQR’s ability to add investments to its portfolio and this may adversely impact growth and returns to unitholders.
Reliance on third parties
The Responsible Entity may engage third party service providers in respect of a part or the whole of CQR's portfolio, being Charter Hall Group entities or third parties outside the Charter Hall Group. These services will be subject to contractual arrangements
between the Responsible Entity and the relevant third parties.
A failure of third parties to discharge their agreed responsibilities may adversely affect the management and financial performance of CQR and therefore also adversely impact returns to investors.
Conflicts
CQR may engage Charter Hall Holdings Pty Limited, a wholly owned subsidiary of Charter Hall Limited, to provide property management and facilities management services in respect of various properties in CQR. The Responsible Entity and Charter Hall
Holdings Pty Limited also have two common Executive Directors. This may create a conflict of interest. Related party transactions also carry a risk that they could be assessed and monitored less rigorously than transactions with unrelated third parties. CQR
will mitigate these risks through the conflicts of interest and related party policy that governs the way CQR manages such conflicts or transactions.
Charter Hall Retail REIT 2020 Half Year Results
46You can also read