Royal Bank of Canada Investor Presentation - About RBC

Page created by Jared Carr
 
CONTINUE READING
Royal Bank of Canada Investor Presentation - About RBC
Royal Bank of Canada
Investor Presentation
Q2/2020

All amounts are in Canadian dollars unless otherwise indicated and are based on financial statements prepared
in compliance with International Accounting Standard 34 Interim Financial Reporting, unless otherwise noted.
Our Q2 2020 Report to Shareholders and Supplementary Financial Information are available on our website at:
http://www.rbc.com/investorrelations.
Royal Bank of Canada Investor Presentation - About RBC
Caution regarding forward-looking statements

From time to time, we make written or oral forward-looking statements within the meaning of certain securities laws, including the “safe harbour” provisions of the
United States Private Securities Litigation Reform Act of 1995 and any applicable Canadian securities legislation. We may make forward-looking statements in this
presentation, in other filings with Canadian regulators or the SEC, in reports to shareholders, and in other communications, including statements by our President
and Chief Executive Officer. Forward-looking statements in this presentation include, but are not limited to, statements relating to our financial performance
objectives, vision and strategic goals, investment activity in the oil & gas sector, and the potential continued impacts of the coronavirus (COVID-19) pandemic on our
business operations, financial results and financial condition, and on the global economy and financial market conditions, including projected economic indicators for
2020 with respect to Canada, the United States and the Euro Area. The forward-looking information contained in this presentation is presented for the purpose of
assisting the holders of our securities and financial analysts in understanding our financial position and results of operations as at and for the periods ended on the
dates presented, as well as our financial performance objectives, vision and strategic goals, and may not be appropriate for other purposes. Forward-looking
statements are typically identified by words such as “believe”, “expect”, “foresee”, “forecast”, “anticipate”, “intend”, “estimate”, “goal”, “plan” and “project” and similar
expressions of future or conditional verbs such as “will”, “may”, “should”, “could” or “would”.
By their very nature, forward-looking statements require us to make assumptions and are subject to inherent risks and uncertainties, which give rise to the possibility
that our predictions, forecasts, projections, expectations or conclusions will not prove to be accurate, that our assumptions may not be correct and that our financial
performance objectives, vision and strategic goals will not be achieved. We caution readers not to place undue reliance on these statements as a number of risk
factors could cause our actual results to differ materially from the expectations expressed in such forward-looking statements. These factors – many of which are
beyond our control and the effects of which can be difficult to predict – include: credit, market, liquidity and funding, insurance, operational, regulatory compliance,
strategic, reputation, legal and regulatory environment, competitive and systemic risks and other risks discussed in the risk sections of our 2019 Annual Report and
the Risk management and Significant Developments: COVID-19 sections of our Q2 2020 Report to Shareholders; including information technology and cyber risk,
privacy, data and third party related risks, geopolitical uncertainty, Canadian housing and household indebtedness, regulatory changes, digital disruption and
innovation, climate change, the business and economic conditions in the geographic regions in which we operate, the effects of changes in government fiscal,
monetary and other policies, tax risk and transparency, environmental and social risk and the emergence of widespread health emergencies or public health crises
such as pandemics and epidemics, including the COVID-19 pandemic and its impact on the global economy and financial market conditions and our business
operations, financial results and financial condition.
We caution that the foregoing list of risk factors is not exhaustive and other factors could also adversely affect our results. When relying on our forward-looking
statements to make decisions with respect to us, investors and others should carefully consider the foregoing factors and other uncertainties and potential events.
Material economic assumptions underlying the forward looking-statements contained in this presentation are set out in the Economic, market and regulatory review
and outlook section and for each business segment under the Strategic priorities and Outlook headings in our 2019 Annual Report, as updated by the Economic,
market and regulatory review and outlook and Significant Developments: COVID-19 sections of our Q2 2020 Report to Shareholders. Except as required by law, we
do not undertake to update any forward-looking statement, whether written or oral, that may be made from time to time by us or on our behalf.
Additional information about these and other factors can be found in the risk sections of our 2019 Annual Report and the Risk management section of our Q2 2020
Report to Shareholders.
Information contained in or otherwise accessible through the websites mentioned does not form part of this presentation. All references in this presentation to
websites are inactive textual references and are for your information only.

1                                                                                                                                                                       RBC
Royal Bank of Canada Investor Presentation - About RBC
About RBC
The RBC story

                                Well-diversified across businesses, geographies and client segments
          Diversified business
                                Able to capitalize on opportunities created by changing market dynamics and economic conditions
          model with leading
          client franchises     Wide breadth of products and capabilities to meet our clients’ financial needs and build deep, long-term
                                 relationships

          Market leader with a  Market leader in Canada and one of the largest financial institutions globally(1)
          focused growth
                                Clear strategy for continued long-term growth in Canada, the U.S. and select global markets
          strategy

          Financial strength                                Track record of earnings and dividend growth while maintaining a disciplined approach to risk and cost
          underpinned by                                     management
          prudent risk and                                  Credit ratings amongst the highest globally
          cost management                                   Strong capital position and a high-quality liquid balance sheet

                                                            Long history of innovation and proven ability to adapt to industry trends
          Innovation is in our                              Investments in technology allow us to drive efficiencies and deliver an exceptional client experience
          DNA                                               Focused on simplifying, digitizing and personalizing our products to make it easier for clients and
                                                             employees to do business, and to lower costs

                                                            Committed to accelerating clean economic growth – contributed $25.9 billion(2) of our $100 billion
                                                             sustainable financing target by 2025 to help support a transition to a low-carbon economy
                                                            Through RBC Tech for Nature, we are providing $9.2 million in donations to 119 partners to develop
                                                             technology based solutions to solve pressing environmental challenges
          Leading corporate                                 Released RBC’s inaugural 2019 Enterprise D&I(3) Report, first stand-alone TCFD(4) Report, 2019 ESG
          citizen                                            Report and SASB(5) Index, as well as, an enhanced Modern Slavery Act Statement
                                                            Donated $130 million in FY2019 to nearly 5,000 charitable organizations globally
                                                            Launched RBC Future Launch at Home – a new, online resource hub that provides access to virtual
                                                             programming and learning opportunities for youth across Canada. This hub will deliver utility for youth
                                                             and help them navigate and exit the COVID-19 pandemic better prepared for the future of work

(1) Based on market capitalization as of April 30, 2020. (2) 2019 ESG (Environment, Social and Governance) Report. (3) Diversity & Inclusion. (4) Task Force on Climate-related Financial Disclosures. (5) Sustainability Accounting Standards Board.

3     | ABOUT RBC                                                                                                                                                                                                                                       RBC
Market leader with a focused strategy for growth

       Largest in Canada(1)                                Top 15 Globally(1)                   17 Million Clients
       A market leader across all key                      One of the 15 largest global banks   Served by 84,000+ employees
       businesses                                          by market capitalization with        worldwide
                                                           operations in 36 countries

        Purpose
        Help clients thrive and communities prosper

        Vision
        To be among the world’s most trusted and successful financial institutions
        Strategic Goals

                               In Canada: To be the undisputed leader in financial services

                               In the United States: To be the preferred partner to corporate, institutional and high
                               net worth clients and their businesses

                               In Select Global Financial Centres: To be a leading financial services partner
                               valued for our expertise

(1) Based on market capitalization as at April 30, 2020.

4    | ABOUT RBC                                                                                                              RBC
Diversified business and geographic model with client-leading franchises

Earnings by Business Segment(1)                                                                                 Revenue by Geography(1)
Latest twelve months ended April 30, 2020                                                                       Latest twelve months ended April 30, 2020

                     Investor &
                      Treasury
                      Services
                         5%
                                Insurance
                                   7%
                                                                                                                                           International
                                                                                                                                                16%
                                                                Personal &
                                                                Commercial
                     Capital                                     Banking
                     Markets                                        Personal &
                      19%                                              Commercial                                                      U.S.
                                                                        Banking
                                 Capital                                  48%                                                       U.S.                            Canada
                                                                                                                                    23%                             Canada
                                 Markets                                                                                                                             61%

                                  Wealth
                                Management
                                   21%

(1) Amounts exclude Corporate Support. These are non-GAAP measures. For more information, refer to Results by business segment section of our 2019 Annual Report.

5   | ABOUT RBC                                                                                                                                                              RBC
Strong financial profile
                                                  Maintaining a strong capital position with a disciplined approach to risk

Resilient Earnings                                                                                                   Premium Return on Equity(1)
Net income ($ billions)

                                           12.9
                         12.4
      11.5                                                                                                                                   17.6%
                                                                                                                          17.0%                                 16.8%                                17.1%

                                                                                                                                                                                                                        12.5%
                                                                                 6.4
                                                                                                    5.0

      2017              2018               2019                              YTD 2019           YTD 2020                   2017               2018              2019                               YTD 2019           YTD 2020

Strong Capital Position                                                                                              Strong Leverage and Liquidity Ratios
                                                                                                                               Leverage Ratio                                                                       4.5%
       14.8%                 15.0%                  15.2%                  14.9%                 14.6%                         Liquidity Coverage Ratio                                                             130%

       11.8%                 11.9%                  12.1%                  12.0%                 11.7%               Credit Ratings Amongst the Highest Globally

                                                                                                                                                           Moody’s                S&P               DBRS                Fitch
                                                                                                                        Legacy senior
                                                                                                                                                               Aa2                AA-            AA (high)               AA+
                                                                                                                        long-term debt(2)
                                                                                                                        Senior long-term
                                                                                                                                                               A2                   A                 AA                  AA
                                                                                                                        debt(3)
       Q2/19                  Q3/19                 Q4/19                  Q1/20                 Q2/20                  Outlook                              Stable             Stable              Stable            Negative
                      Total Capital                    Common Equity Tier 1 (CET1)

(1) Return on Equity (ROE). This measure does not have a standardized meaning under GAAP. For further information, refer to the Key performance and non-GAAP measures section of Q2 2020 Report to Shareholders. (2) Ratings
(as at May 26, 2020) for senior long-term debt issued prior to September 23, 2018 and senior long-term debt issued on or after September 23, 2018, which is excluded from the Canadian Bank Recapitalization (Bail-in) regime. (3)
Ratings (as at May 26, 2020) for senior long-term debt issued on or after September 23, 2018 which is subject to conversion under the Bail-in regime.

6    | ABOUT RBC                                                                                                                                                                                                               RBC
Prudent risk management
                                                              A disciplined approach and diversification have underpinned credit quality

Loan Book Diversified by Portfolio(1)                                                                                                                     PCL Ratio on Impaired Loans(2) (bps)

                                Credit Cards                                           Small
                                    2%                                                Business                                                                  45
                                                                                        1%
                                                                                                                                                                40                                                                                                                             37
                                                                                                                                                                                                                                                  Average historical actual
                                                                                                                                                                35
                                                                                                                                                                                                                                                  loss rate(3) = 32 bps
                                                                                                                                                                30                                                   28            29
                                                                                                                                                                                                                                                    25            27
                                                                             Residential                                                                        25          22
                                                                             Mortgages                                                                                                                                                                                          21
                                       Wholesale                                                                                                                                                         20
                                         38%                                    46%                                                                             20                         17

                                                                                                                                                                15        PCL ratio on
                                                                                                                                                                          impaired loans
                                                                                                                                                                10
                                                          Personal                                                                                                      Q2/2018        Q3/2018       Q4/2018       Q1/2019        Q2/2019       Q3/2019       Q4/2019        Q1/2020       Q2/2020
                                                           Loans
                                                            13%

Breakdown by Region of Total Loans and Acceptances(1)                                                                                                     Breakdown of Canadian Total Loans and Acceptances(1)
                                    Other                                                                                                                                                                                               Atlantic
                                International                                                                                                                                                                                             5%
                                                                                                                                                                                  Manitoba/
                                     4%
                                                                                                                                                                                   Sask.
                                           U.S.                                                                                                                                     6%
                                           16%
                                                                                                                                                                                                   Quebec
                                                                                                                                                                                                    11%

                                                                                                                                                                                                                                        Ontario
                                                                                                                                                                                                 Alberta                                 49%
                                                                           Canada                                                                                                                 13%
                                                                            80%
                                                                                                                                                                                                         B.C. and
                                                                                                                                                                                                        Territories
                                                                                                                                                                                                           16%

(1) Loans and acceptances outstanding as at April 30, 2020. Does not include letters of credit or guarantees. (2) Effective November 1, 2017, we adopted IFRS 9, which introduced a three-stage expected credit loss impairment model that differs significantly from the incurred loss model under IAS 39.
Stage 3 allowances are held against impaired loans and effectively replace the allowance for impaired loans under IAS 39. Provision for Credit Losses (PCL) ratio is PCL as a percentage of average net loans & acceptances (annualized). (3) Average annual actual loss rate from fiscal 2003 through to
the most recent full year. The information is updated on an annual basis and is based on consolidated results. The Average historical actual loss rate on a continuing operations basis is 0.32%.

7     | ABOUT RBC                                                                                                                                                                                                                                                                                    RBC
Track-record of delivering value to our shareholders
           Financial performance objectives measure our performance against our goal of maximizing total shareholder returns

 Medium-Term Financial Performance Objectives (3-5 years)

    Diluted EPS Growth(1)                                                                                                                                                                           7%+

    Return on Equity(2)                                                                                                                                                                            16%+

    Capital Ratios (CET1)                                                                                                                                                                         Strong

    Dividend Payout Ratio                                                                                                                                                                     40% - 50%

Achieved Solid TSR(3) Performance                                                                                    Strong Dividend Growth(4)

                                           RBC                             Peer Average                                                                                                                                                                   $4.07
                                                                                                                                                                                                                                              $3.77
                                                                                                                                                                                                                                 $3.48
    3 Year                                  1%                                       (3)%                                                                                                                            $3.24
                                                                                                                                                                                                         $3.08
                                                                                                                                                                                            $2.84
                                                                                                                                                                                $2.53
    5 Year                                  5%                                        2%                                                                            $2.28
                                                                                                                               $2.00 $2.00 $2.08

    10 Year                                 7%                                        6%

                                                                                                                               2009        2010         2011        2012        2013         2014        2015        2016         2017        2018        2019

(1) Compound annual growth rate. (2) Average. (3) Annualized TSR is calculated based on the TSX common share price appreciation plus reinvested dividend income. Source: Bloomberg, as at April 30, 2020. RBC is compared to our global peer group. The peer group
average excludes RBC for the list of peers, please refer to our 2019 Annual Report. Peer average includes Power Financial Corporation, common shares of which were delisted from the TSX effective as of the close of business on February 18, 2020. (4) Dividends declared
per common share. Our current quarterly dividend is $1.08.

8    | ABOUT RBC                                                                                                                                                                                                                                                    RBC
Business Segments
Personal & Commercial Banking
 The financial services leader in Canada                                                                            Q2/2020 Highlights
      #1 or #2 market share in all key product categories
                                                                                                                     Clients (MM)                                                     14.0+
      Most branches and one of the largest mobile sales networks
       across Canada                                                                                                 Branches                                                         1,257

      Superior cross-sell ability                                                                                   ATMs                                                             4,491
 In 16 countries and territories in the Caribbean                                                                   Active Digital (Online and Mobile) Users(2) (MM)                   7.5
      3rd largest bank by assets(1) in English Caribbean                                                            Employees (FTE)                                                35,000+
 Innovative direct banking to U.S. cross-border clients                                                             Net Loans & Acceptances(1) ($BN)                                 471.3
 Ongoing investments to digitize our banking channels                                                               Deposits(1) ($BN)                                                428.7
                                                                                                                     AUA(1) ($BN)                                                     275.7

Net Income ($ millions)                                                                                              Revenue by Business Line(3)
                                          6,402
                         6,028                                                                                                     Canadian
         5,755                                     234
                                  168                                                                                              Banking
                  184                                                                                                                95%
                                         6,168
                         5,860
        5,571
                                                                                                                                              Personal
                                                                                                                                              Banking
                                                                                                                                                71%              Business
                                                                          3,120                                                                                  Banking
                                                                                   116                                                                             24%
                                                                                                  Carib & U.S.
                                                                                          2,218 Banking
                                                                          3,004                  (55)

                                                                                          2,273
                                                                                                                                                                        Caribbean
                                                                                                                                                                          & U.S.
                                                                                                                                                                         Banking
        2017           2018      2019                            YTD 2019 YTD 2020                                                                                         5%
                    Canadian Banking                  Caribbean & U.S. Banking

(1) Based on average balances. (2) This figure represents the 90-day active customers in Canadian Banking only. (3) For the quarter ended April 30, 2020.

10 | BUSINESS SEGMENTS                                                                                                                                                                  RBC
Personal & Commercial Banking – Canadian Banking
Strategic Priorities – Building A Digitally-Enabled Relationship Bank™
                                                 Make it easier for clients to access products and services digitally
 Transform How We
                                                 Create capacity and capability to focus on advice, complex servicing and sales, and problem resolution
 Serve Our Clients
                                                 Focus on innovating our branch network

                                                 Grow commercial market share through industry-specific credit strategies
 Accelerate Client                               Target high-growth retirement segment and business succession planning
 Growth                                          Continue to increase client acquisitions including key segments: high net worth, newcomers and students
                                                  and young adults while deepening existing client relationships

                                                 Continue to deliver leading digital capabilities and functionality through our award-winning mobile app
 Rapidly Deliver Digital
                                                 Create partnerships to innovate, making it easier to bank with RBC
 Solutions
                                                 Invest in research and development to understand and meet rapidly changing client expectations

 Innovate to Become                              Accelerate investments to simplify, digitize and automate for clients and employees
 a More Agile and                                Change or eliminate products and processes that do not add economic or client value
 Efficient Bank                                  Invest in employees to enhance digital, agile and change capabilities

Recent Awards

   North American Retail                            Highest in Customer                              Stevie Award for                         For the second year in a row,     Awarded ‘Celent Model
   Bank of the year for the                       Satisfaction Among the                         Innovation of the Year for                    RBC is an award winner for      Bank of the Year 2020’ in
   2nd consecutive year(1)                        Big Five Retail Banks, a                           RBC Rewards(3)                           all 11 Ipsos Financial Service     recognition of RBC's
    and Best Loyalty and                           position RBC has now                                                                        Excellence Awards among            digital strategy and
     Rewards Strategy(1)                          held for 4 out of the past                                                                   the Big 5 Banks, including      capabilities; it is the top
                                                          5 years(2)                                                                                 Customer Service           global award bestowed
                                                                                                                                                       Excellence(4)                  by Celent(5)
(1) Retail Banker International, 2019. (2) J.D. Power, 2020. (3) The International Business Awards, 2019. (4) Ipsos, 2019. (5) Celent Model Bank, 2020.

11 | BUSINESS SEGMENTS                                                                                                                                                                                RBC
Personal & Commercial Banking – Canadian Banking
Solid Volume Growth ($ millions)(1)                                                                                                    Superior Cross-Sell Ability
                                                                                                                                         Percent of clients with transaction accounts, investments and
                                                                                                                                         borrowing products(2)

                                                                                                                410                                                       19%
                                                     375                                    370
                                  343
              326

                                                                                                                                                                                                                                12%

                                  417                440                                    435                 464
              393

             2017               2018                2019                                  Q2/19              Q2/20
                                                                                                                                                                          RBC                                          Peer Average
                                Loans and Acceptances                                   Deposits
#1 or #2 Market Share in All Key Categories(3)                                                                                         Continue to Improve Our Efficiency Ratio(9)

                                                                                         Market
    Product                                                                                                       Rank
                                                                                         share
    Personal Lending(4)                                                                   24.1%                       1
                                                                                                                                                                                                                                                        Peer
    Personal Core Deposits + GICs                                                         19.7%                       2                                                                                   47.7%                                       Average(10)
                                                                                                                                                     46.9%                     46.4%
    Credit       Cards(5)                                                                 28.2%                       1

    Long-Term Mutual Funds(6)                                                             32.1%                       1                              43.2%
                                                                                                                                                                                42.5%
                                                                                                                                                                                                          41.8%                      42.0%
    Business Loans                  ($0-$25MM)(7)                                         27.0%                       1

    Business Deposits(8)                                                                  25.2%                       1                               2017                       2018                       2019                  YTD 2020
(1) Based on average balances. (2) Canadian Financial Monitor by Ipsos – 18,000 Canadian individuals – data based on Financial Group results for the 12-month period ending April 2020; Cross-sell calculation methodology has been updated from previous quarters since
Q2/19.TFSA is considered an Investment. Peers include BMO, BNS, CIBC and TD. (3) Market share is calculated using most current data available from OSFI (M4), Investment Funds Institute of Canada (IFIC) and Canadian Bankers Association (CBA), and is at January
2020 and November 2019 except where noted. Market share is of total Chartered Banks except where noted. (4) Personal Lending market share of 6 banks (RBC, BMO, BNS, CIBC, TD and NA) and includes residential mortgages (excl. acquired portfolios) and personal
loans as at November 2019, excludes Credit Cards. (5) Credit cards market share is based on 6 banks (RBC, BMO, BNS, CIBC, TD and NA) as at November 2019. (6) Long-term mutual fund market share is compared to 7 banks (RBC, BMO, BNS, CIBC, TD, NA, and
HSBC) and is at January 2020. (7) Business Loans market share is of 6 Chartered Banks (RBC, BMO, BNS, CIBC, TD and NA) on a quarterly basis and is as of September 2019. (8) Business Deposits market share excludes Fixed Term, Government and Deposit Taking
Institution balances. (9) Effective Q4/2017, service fees and other costs incurred in association with certain commissions and fees earned are presented on a gross basis in non-interest expense. Comparative amounts have been reclassified to conform with this
presentation. (10) Peers include BMO, BNS, CIBC and TD; 2017 through 2019 reflects annual numbers.

12 | BUSINESS SEGMENTS                                                                                                                                                                                                                                             RBC
Wealth Management
Strategic Priorities                                                                                                                        Recent Awards
 Global Asset Management: Deliver investment performance and                                                                                Best Private Bank for Innovative Client Solution
  extend leadership position in Canada, while continuing to build and                                                                        (Family Wealth Report Awards, 2020)
  grow in the U.S. and other key global markets
                                                                                                                                             #1 in Investor Satisfaction with U.S. Full-Service Brokerage Firms
 Canadian Wealth Management: Continue to deepen client
                                                                                                                                             (J.D. Power, 2020)
  relationships and deliver a differentiated client experience that is
  increasingly digitally-enabled and supported by data-driven insights                                                                       Outstanding Global Private Bank – North America
 U.S. Wealth Management: Leverage the combined strengths of                                                                                 (Private Banker International Global Wealth Awards, 2019)
  City National Bank, RBC Wealth Management U.S. and Capital
  Markets to accelerate growth in the U.S.                                                                                                   Best Private Bank in Canada
                                                                                                                                             (PWM/The Banker Global Private Banking Awards, 2019)
 International Wealth Management: In the British Isles, accelerate
  organic market share growth to be a top-tier wealth manager,                                                                               Best Private Bank for Digitally Empowering Relationship
  providing solutions and insight to successful wealth creators. In                                                                          Managers, North America
  Asia, continue to drive growth in Asia’s global families by                                                                                (PWM Wealth Tech Awards, 2019)
  leveraging the global strengths and capabilities of RBC

Net Income ($ millions)(1)                                                                                                                  Cash Earnings ($ millions)(2)

                                                                                                                                                                                               2,735
                                                    2,550                                                                                                                   2,458
                                 2,265
                                                                                                                                                         2,017
              1,838

                                                                                           1,182                                                                                                                                     1,282
                                                                                                              1,047                                                                                                                                     1,133

               2017               2018               2019                              YTD 2019 YTD 2020                                                 2017               2018               2019                              YTD 2019 YTD 2020

(1) 2019 net income includes the gain on sale of the private debt business of BlueBay ($134 million after-tax). (2) Cash earnings exclude the after-tax effect of amortization of intangibles. This is a non-GAAP measure. For more information see slide 56.

13 | BUSINESS SEGMENTS                                                                                                                                                                                                                                          RBC
Wealth Management – Global Asset Management
                                                        Building a high-performing global asset management business
  Driving top-tier profitability in our largest Wealth Management business
    $484.5BN in client assets
    Investor asset mix of 49% Retail / 51% Institutional client assets
  Extending our lead in Canada
    Largest retail fund company in Canada, ranked #1 in market share capturing 32.3% amongst banks and 16.1% all-in(1)
    Strategic alliance between RBC Global Asset Management and BlackRock Canada connects clients to the largest and broadest
     ETF lineup in Canada
    3rd largest institutional pension asset manager in Canada(2)
  Delivering strong investment capabilities to support growth
    Top performing investment firm with ~61% of AUM outperforming the benchmark on a 3-year basis(3)
    Continued growth of investment capabilities and innovative solutions for both institutional clients and retail investors

Canadian Retail AUM ($ billions)                                                                                     Diversified Asset Mix

       15.1%      15.1%        15.4%        15.5%        15.6%         15.8%        15.8%        16.1%                         Q2/2020 AUM by Client Segment ($ billions)(4)
 320

 300                                                                                                         15.0%

                                                                       250.3        258.1
                                                          244.2
 280

 260

       228.8      230.6                     237.1                                                 232.5
 240                           218.8                                                                         12.0%

                                                                                                                                        16%
 220

 200
                                                                                                                                                                                  Canadian Retail
 180                                                                                                         9.0%

 160

 140
                                                                                                                               14%                                                Canadian Institutional
                                                                                                                                                                 49%
 120                                                                                                         6.0%

                                                                                                                                           $484.5BN
 100

 80
                                                                                                                                                                                  U.S. Institutional
 60                                                                                                          3.0%

 40
                                                                                                                                                                                  International Institutional
 20
                                                                                                                                      21%
   0                                                                                                         0.0%

       Jun-18     Sep-18      Dec-18       Mar-19        Jun-19       Sep-19       Dec-19        Mar-20

                Canadian Mutual Fund Balance(1)                      All-In Market Share(1)

(1) Investment Funds Institute of Canada (IFIC) as at March 2020 and RBC reporting. Comprised of long-term funds and money market funds. (2) Benefits Canada as at May 2019. (3) As at March 2020, gross of fees. (4) RBC GAM,
based on period-end spot balances.

14 | BUSINESS SEGMENTS                                                                                                                                                                                                     RBC
Wealth Management
Canadian Wealth Management                                                                                                                      Fee-based Assets per Advisor(1)
                                                                                                                                                          ($ millions)
   Maintain profitable growth with strong pre-tax margin
   #1 High Net Worth and Ultra High Net Worth market share in Canada(1)                                                                                    1.7x the Peer
   Canadian leader in fee-based assets per                    advisor(1)                                                                                     Average
   Consistently driving revenue per advisor of over $1.6MM per year, 30% above
    Canadian industry average(1)                                                                                                                 120
   Strong asset growth complemented by favourable market conditions                                                                                                        69
   Leveraging enterprise linkages to extend market share gains

                                                                                                                                                 RBC               Cdn Peer Average
U.S. Wealth Management (including City National)
 RBC Wealth Management U.S.
  7th largest full-service wealth advisory firm in the U.S. as measured by number of financial advisors and 6th largest by assets under
   administration(2)
  Enhancing the client-advisor experience through a digitally-enabled, goals-based planning approach, and strengthening the range of advisory
   solutions and product offerings
  Continuing to attract and onboard new advisors and clearing relationships while improving advisory productivity and operational efficiency
 City National
  A premier U.S. private and commercial bank that creates a platform for long-term growth in the U.S.
  Operates with a high-touch, branch-light client service model in selected high-growth markets, including: Los Angeles, the San Francisco Bay
   area, Orange County, San Diego, New York, Boston, and Washington DC
  Expanding the CNB business model to selected high-growth markets

International Wealth Management
  Growing market share in target markets
  Enhancing “One RBC” cross-platform connectivity
  Focusing on client service excellence
  Increasing business effectiveness and talent capabilities

(1) Strategic Insight (formerly Investor Economics), January 2020. (2) Source: U.S. wealth advisory firms quarterly earnings releases (10-Q).

15 | BUSINESS SEGMENTS                                                                                                                                                                RBC
Insurance
Strategic Priorities                                                                                               Highlights
 Improve Distribution Effectiveness and Efficiency: By                                                             Among the largest Canadian bank-owned insurance organizations, serving
  enhancing our proprietary distribution channels, and focusing on                                                  more than five million clients globally
  the delivery of technology and operational solutions
                                                                                                                    #1 in individual disability sales with 37%(1) market share
 Deepen Client Relationships: By continuing to be an innovative,                                                   RBC term insurance business continues to grow faster than the market,
  client-focused provider of a full suite of insurance solutions for                                                ranked #5 with 9% market share, and 26% YoY growth in CY2019(1)
  mass underserved, mass affluent and high net worth clients
                                                                                                                    #2 in Segregated fund net sales(2)
 Simplify. Agile. Innovate.: By accelerating our digital initiatives’
                                                                                                                    RBC Guaranteed Investment Funds continue to be one of the fastest
  time-to-market, improving quality and cost effectiveness
                                                                                                                    growing segregated fund providers in Canada with a YoY growth of
 Pursue Select International Opportunities: By continuing to                                                       24.7%(2)
  grow our core reinsurance business within our risk tolerance                                                      #2 best performing segregated fund family for CY2019(3)

                                                                                                                    #3 in sales in the Canadian group annuity market in Jan-Mar 2020(4)

Net Income ($ millions)                                                                                            Premiums and Deposits

                                       806                                                                                       4,546           4,647          4,604
                       775
       726

                                                                                                                                2,050           2,063           2,189
                                                                                                                                                                                                                2,690
                                                                                                                                                                                                2,420
                                                                                      361                                                                                                        1,090           1,252
                                                                      320
                                                                                                                                2,496           2,584           2,415
                                                                                                                                                                                                 1,330           1,438

      2017            2018            2019                        YTD 2019 YTD 2020                                              2017            2018     2019                             YTD 2019 YTD 2020
                                                                                                                                                     Canadian                       International

(1) LIMRA Canadian Insurance Survey, 4th Quarter, 2019. (2) Strategic Insights, Insurance Advisory Service Report, April 2020. (3) Investment Executive, April 2020 Edition. (4) LIMRA Canadian Pension Market Survey, Q1 2020.

16 | BUSINESS SEGMENTS                                                                                                                                                                                                        RBC
Investor & Treasury Services
   Specialist provider of asset services, a leader                               Strategic Priorities
    in Canadian cash management and
    transaction banking services, and a provider                                    Grow income and market share among Canadian asset managers, investment counsellors,
    of treasury services to institutional clients                                   pension funds, insurance companies, and transaction banking clients
    worldwide
                                                                                    Compete in segments and markets which offer the highest risk-adjusted returns
       Ranked #1 Transfer Agent of the Year(1)
       Ranked #1 Asset Servicer in North
                                                                                    Provide our clients seamless digital journeys and secure, robust and continuous service
        America(2)
       Named Best Trade Finance Bank in
                                                                                    Design and re-engineer our services to improve client satisfaction, efficiency and risk controls
        Canada for the eighth consecutive year(3)
   Short-term funding and liquidity management
                                                                                    Use technology and data insights to solve our clients’ current and future challenges
    for RBC

Net Income ($ millions)                                                                                             Efficiency Ratio

                                                                                                                                                      74%
      741              741

                                        475                                                                                             62%                             61%
                                                                                                                                 60%
                                                                                            369
                                                                           312

     2017             2018              2019                          YTD 2019 YTD 2020                                          2017   2018          2019            YTD 2020

(1) Global Investor ISF, Investment Excellence Awards, 2019. (2) R&M Investor Services Survey, 2019. (3) Global Finance, 2020.

17 | BUSINESS SEGMENTS                                                                                                                                                           RBC
Capital Markets
 A premier global investment bank with core operations across Canada, the U.S., the U.K./Europe, and APAC
     9th largest global investment bank by fees(1)

 Strategically positioned in the largest financial centres, focused on the world’s largest and most mature capital markets encompassing ~80% of the
  global investment banking fee pool(1)

 RBC Capital Markets is recognized by the most significant corporations, institutional investors, asset managers, private equity firms, and
  governments around the globe as an innovative, trusted partner with an in-depth expertise in capital markets, banking and finance

Revenue by Business ($ millions)(2)                                     Revenue by Geography(3)                                         Net Income ($ millions)

                                                                                                                                                      2,777
                                                                                                                                                              2,666
                                                                                                                                             2,525
   1,084       1,136       1,166

   1,129       1,238       1,347
                                                                                                     7%
   1,860       2,006                                                                                                                                                            1,429
                           2,120                               637                          15%
                                                   695         913
   2,140                                           650                                                                47%                                                                 987
               2,107       1,672                              1,096
                                                  1,054
                                                               767
                                                   842
   2,253       2,122       2,150                                                               31%
                                                  1,117       1,594

    2017       2018        2019                 YTD 2019 YTD 2020                                                                            2017     2018     2019              YTD      YTD
                                                                                                                                                                                 2019     2020
      FICC                            Investment Banking
                                                                             U.S.     Canada      U.K. & Europe    Australia, Asia & Other
      Lending & Other                 Repo & Secured Financing
      Global Equities

(1) Dealogic – Fiscal 2020 Q2. (2) Global Markets segment revenue has been restated to align select portfolios previously disclosed in Repo and Secured Financing to FICC and Global Equities. Revenue
by business only includes Corporate & Investment Banking and Global Markets, excluding CM Other. (3) For three months ended April 30, 2020

18 | BUSINESS SEGMENTS                                                                                                                                                                            RBC
Capital Markets
 Strategic Priorities

 To be among the world’s                          Maintain our leadership position in Canada
 most successful investment
                                                  A leader in the U.S., our largest market with the best opportunity for growth
 banks by serving clients in
 the most attractive markets                      A leader in the U.K., Europe and Asia-Pacific in targeted areas aligned with our global expertise

                                                  Support our clients by partnering with them to understand their strategic objectives and delivering solutions to
                                                   achieve their goals
 Deepen client relationships                      Continue to grow and strengthen our senior coverage teams
 as an innovative, trusted
                                                  Focus on long-term client relationships aligned with our global capabilities
 partner
                                                  Continue to drive technology innovations through our data strategy, electronification and artificial intelligence
                                                   initiatives

 Drive collaboration, simplify                    Collaborate to deliver clients our full suite of global products and services
 our business and optimize                        Continue to focus on deepening client relationships by driving cross business collaboration with U.S. Wealth
 capital use to earn high risk-                    Management (incl. City National)
 adjusted returns on assets                       Continue disciplined approach to managing costs and risk, maintain a balance between investment banking
 and equity                                        and trading revenue, and align our resources around top client opportunities

Recent Awards                                                                                            Recent Big Deals

                                                                                                           RBC Capital Markets acts     RBC Capital Markets acts
                                                                                                           as Bookrunner and Joint            as Joint Active
                                                                                                            Lead Arranger on $23         Bookrunner on the $2.2
     Best Investment Bank in              Share and Quality Leader                  Top 10 in the All-                                     billion Initial Public
           Canada - 12th                  in Canadian Equities and                 American Research         billion of financing to
                                                                                                                back T-Mobile’s         Offering of GFL - ranked
       consecutive year(1)                     Fixed Income(2)                         Survey(3)                                          as one of the largest
                                                                                                             acquisition of Sprint
                                                                                                                                        Canadian IPOs of all time
 (1) Euromoney, 2019. (2) Greenwich Associates, 2019. (3) Institutional Investor, 2019.

19 | BUSINESS SEGMENTS                                                                                                                                           RBC
Capital Markets
Capital Markets Total Average Assets                                                                                 Geographic Diversification Across Loan Book
($ billions)                                                                                                         Average Loans Outstanding by Region ($ billions)(1)

                                                                                                                                                                                                                     1,017
                                                                                                                                 25                    56                   78                   79

                                                                                                                                                                                                                       100
                                                                                               821
                                                                                                                                 87                    86                   83                    83
                                                                         716                                                                                                                                           18
                             677                   696
       649                                                                                                                       14                    14                   14                    16
                                                                                                                                                                                                                       52
                                                                                                                                 45                    45                   42                    41

                                                                                                                                 28                    27                   27                    26                   30

                                                                                                                             Q2/2019              Q3/2019               Q4/2019              Q1/2020        Q2/2020
   Q2/2019               Q3/2019                Q4/2019               Q1/2020               Q2/2020                                                                                             Provision for Credit
                                                                                                                              Canada            U.S.         Other International
                                                                                                                                                                                                Losses
                                                                                                                     Earnings Volatility vs. Canadian and U.S. Peers (Standard
Risk-Weighted Assets, Spot ($ billions)                                                                              Deviation / Avg Earnings)(2)

                                                                                                                                                                                                              19.3%
                                                                                                                                                                         16.4%
                                                                                              225
       208                   204                                        205                                                          12.5%
                                                  202

   Q2/2019               Q3/2019               Q4/2019               Q1/2020               Q2/2020                                    RBC                            CDA Peers                             US Peers
(1) Average loans outstanding includes wholesale loans, acceptances, and off balance sheet letters of credit and guarantees for our Capital Markets portfolio, on single name basis. Excludes mortgage investments, securitized
mortgages and other non-core items. This chart has been restated to exclude certain intergroup exposures that are not part of the corporate lending business. This is a non-GAAP measure. For more information see slide 56. (2)
Canadian peers include BMO, TD, CIBC, BNS and NA, US peers include JPM, GS, BAC and MS.

20 | BUSINESS SEGMENTS                                                                                                                                                                                                             RBC
Risk Review
Elevated provisioning to withstand uncertain macroeconomic environment
Movement in Allowance for Credit Losses on Loans ($ billions)                                                  Our approach
                                                                                             0.84%              Top-down model driven analysis
                                                                                          ACL to L&A
                                                                      ($0.3)                                    Bottom-up analysis by client and
                                                   $0.6
                                                                                                                 sector
                                                                                                                Forward looking assumptions
        0.53%                  $2.1               Includes                                                       including potential impacts of
                                               $196MM of oil &                                                   COVID-19 pandemic
     ACL to L&A                                                                                $5.9
                                                 gas PCL on
                                               Impaired Loans                                                   Benefits of support programs
          $3.5                                                                                                  Additional management judgement
                                                                                                                Refer to slide 24 for allocation of
   Allowance for Credit   PCL on Performing    PCL on Impaired   Net write-offs, FX &   Allowance for Credit
      Losses (Q1/20)           Loans               Loans         Other movements           Losses (Q2/20)        ACL by product type

PCL on Performing Loans (Stage 1 & 2) – Segment and Loan Breakdown
                                                                                                                ~75% of the increase in ACL on
                                                                                                                 performing loans came from
                                                 $2.1BN                                                          unfavourable changes in
              Canadian                                                                                           macroeconomic assumptions,
              Banking                         Caribbean & U.S.                                                   including scenario weight changes
                                                                                             Retail
                55%                           Banking
                                                                                             34%
                                              9%                                                                  Refer to slide 23 for
                                              Wealth
                                                                      Wholesale
                                                                                                                   macroeconomic scenario
                                              Management                                                           assumptions
                                                                        66%
                                              3%
                     Capital Markets
                          32%
                                                                                                                Remainder from portfolio
                                                                                                                 composition (renewals, drawdowns,
      Other                                                                                                      downgrades) and volume growth
       1%

22 | RISK REVIEW                                                                                                                                       RBC
IFRS 9 range of macroeconomic scenario assumptions (as of April 30)
  Canada Real GDP ($ Trillions)(1)                                                                                        Canada Unemployment Rate (%)(3)
                                                                                                                      18
2.4
                                                                                                                      16
2.3                                                                                                                   14
2.2                                                                                                                   12

2.1                                                                                                                   10
                                                                                                                       8
2.0
                                                                                                                       6
1.9
                                                                                                                       4
1.8                                                                                         (2                         2
1.7                                                                                         )

                                Range of alternative scenarios (April 30, 2020)                                                                         Range of alternative scenarios (April 30, 2020)
                                Base case (April 30, 2020)                                                                                              Base case (April 30, 2020)
                                Base case (October 31, 2019)                                                                                            Base case (October 31, 2019)

  U.S. Real GDP (US$ Trillions)(2)                                                                                        U.S. Unemployment Rate (%)(3)
22.0                                                                                                                 16

21.0                                                                                                                 14

                                                                                                                     12
20.0
                                                                                                                     10
19.0
                                                                                                                      8
18.0
                                                                                                                      6
17.0
                                                                                                                      4
16.0                                                                                                                  2
15.0                                                                                                                  0

                                   Range of alternative scenarios (April 30, 2020)                                                                    Range of alternative scenarios (April 30, 2020)
                                   Base case (April 30, 2020)                                                                                         Base case (April 30, 2020)
                                   Base case (October 31, 2019)                                                                                       Base case (October 31, 2019)

For further details, refer to Note 5 of our Q2 2020 Report to Shareholders. (1) Represents the seasonally-adjusted annual rate indexed to 2012 Canadian dollars. (2) Represents the seasonally-adjusted annual rate indexed to 2012 U.S.
dollars. (3) Represents the average quarterly unemployment level over the period.

23 | RISK REVIEW                                                                                                                                                                                                                  RBC
Allocation of ACL by product type: Mortgages a large part of our balance sheet

                                                                                      Q1 / 2020                                                           Q2 / 2020

                                                                      % of Loans & Acceptances                                            % of Loans & Acceptances

                                   Product                     Stage 1 & 2             Stage 3                Total                Stage 1 & 2             Stage 3    Total
                      Residential mortgages                          0.1%                22.1%               0.12%                       0.1%               21.9%     0.15%
                      Other Retail                                   1.5%                46.1%               1.61%                       2.0%               46.5%     2.19%
                            Personal                                 0.9%                46.9%               1.03%                       1.2%               47.7%     1.39%
                            Credit cards                             4.3%                    -               4.35%                       6.6%                    -    6.58%
                            Small business                           0.7%                41.9%               1.19%                       1.4%               41.1%     1.87%
                      Retail                                         0.4%               30.6%                0.52%                       0.6%               31.2%     0.68%
                      Wholesale                                      0.4%               26.1%                0.58%                       0.9%               30.0%     1.15%
                      Total ACL                                      0.4%               27.8%                0.53%                       0.7%               30.4%     0.84%

(1) Items not subject to impairment are loans held at FVTPL: Residential mortgages (Q2/20: $405MM, Q1/20: $534MM); Wholesale (Q2/20: $10.1BN, Q1/20: $10.7BN).

24 | RISK REVIEW                                                                                                                                                              RBC
Exposure to wholesale sectors most vulnerable to COVID-19 impacts
RBC’s Total Loans & Acceptances
As of Q2/2020

   Vulnerable exposure

                                                                                         Consumer
                                                  Other Wholesale                    Discretionary 2.4%
                                  Other                 31%
                                  Retail
                                   10%

                                                                                      Commercial Real
                                                               Vulnerable Exposure   Estate (Retail) 1.6%
                                                                  Wholesale 7%

                                                                                       Oil & Gas 1.3%
                                             Residential
                                           Mortgages (incl.
                                            HELOC) 52%                                 Transportation
                                                                                           1.1%

                                                                                         Media 0.3%

  While the impact of COVID-19 had, and will likely continue to have, a broad impact on the economy, some sectors are more
   vulnerable due to business closures, social distancing measures and other government restrictions
  Our most vulnerable wholesale sectors represents 7% of total loans & acceptances outstanding
  Credit performance will depend on the length of continued business closures, the speed and extent of recovery, and the mitigating
   impact of government support
  Q2/2020 wholesale ACL represents 1.1% of wholesale loans & acceptances outstanding, nearly twice the level in Q1/2020

25 | RISK REVIEW                                                                                                                   RBC
Limited oil & gas exposure and robust risk management
Oil & Gas Exposure
($ billions; % of total loans and acceptances outstanding)                         2.0%
                                                                                          Portfolio Characteristics
  14.0

  12.0
                                                                                            12% exposure to drilling & services; nearly all secured
                                                      1.3%               1.3%      1.5%

                                                                                             (equipment or guarantees)
  10.0

           1.0%         1.0%                1.0%                                            73% of our oil & gas sector is to exploration & production
   8.0

                                                                         9.4       1.0%

                                                                                             (E&P) companies
                                                       8.1
                                                                                              Lending to E&P companies is predominantly through
   6.0

                         5.6                6.1                                                borrowing base lending structures
   4.0

           5.3                                                                     0.5%

   2.0

                                                                                            26% of our outstanding exposure to the oil & gas sector is to
    -                                                                              0.0%
                                                                                             investment grade clients (57% based on exposure at default)
           2016          2017               2018       2019          Q2/2020
                                                                                            ~50% of our oil & gas exposure is most sensitive to oil prices
   QoQ growth driven by higher draws on existing and new
    facilities to provide liquidity to existing investment grade
    clients

Oil & Gas Exposure by Industry Segment &
Geography
(Loans and acceptances outstanding as of Q2/2020)                                         Q2/2020 Credit Performance
         Vulnerable exposure                                                                59% of PCL on impaired wholesale loans (Stage 3) related
                                                                             Other
                               Int.                                      International       to our oil & gas exposure
                                                       U.S.
                               4%                                             3%
                                                       25%                                  27% of wholesale GIL related to oil & gas sector
                                RM&D                                                        ACL coverage ratio: 4% of oil & gas loans & acceptances
                                 11%
          E&P                                                                                outstanding
          73%     $9.4BN                              $9.4BN                                  ACL is slightly above cumulative provisions taken during
                                      D&S
                                      12%                                                      the last oil & gas downturn (FY2015-FY2017)

                                                          Canada
                                                           72%

E&P: Exploration & Production Int.: Integrated
D&S: Drilling & Services      RM&D: Refining, Marketing & Distribution
26 | RISK REVIEW                                                                                                                                          RBC
Overview of wholesale sectors most vulnerable to COVID-19

Commercial Real Estate                                                  Consumer Discretionary
(Loans & acceptances outstanding as of Q2/2020)                         (Loans & acceptances outstanding as of Q2/2020)

                                                  Vulnerable exposure                                                             Vulnerable exposure
                         Other                                                                Recreation
                                 Industrial &
                         10%                                                                     11%
                                 Warehouse
                Multi               25%                                                   Hotels
               Family                                                                      8%                       Restaurants
                16%                                                                                                    29%
                                                                              Durable
                         $57.3BN                                             Consumer            $20.2BN
                                                                              Goods
                                     Office                                    17%
                Retail
                20%                  24%
                                                                                                           Retail
                                                                                 Textiles &                32%
                                                                                  Apparel
                     High Rise Condo                                                3%
                           5%

  Our overall commercial real estate (CRE) exposure is well              Our vulnerable exposure to the consumer discretionary sector
   diversified by industry segment and region                              represents 2.4% of total loans & acceptances outstanding
  Our vulnerable exposure to CRE is retail-related and                   83% of the sector is impacted by COVID-19 closures and other
   represents 20% of our CRE exposure and 1.6% of total                    government restrictions
   loans & acceptances outstanding                                          Majority of our exposure is secured by assets or guarantees
  CRE-retail related exposures are most impacted by COVID-
   19 closures
    A significant portion of our portfolio comprises of Class-A
     malls and grocery-anchored retail
    Low LTVs, guarantees and debt service coverage built to
     withstand high vacancy rates serve as mitigants

27 | RISK REVIEW                                                                                                                                 RBC
Overview of wholesale sectors most vulnerable to COVID-19

Transportation                                                          Telecommunication & Media
Loans & acceptances outstanding as of Q2/2020                           Loans & acceptances outstanding as of Q2/2020

                                                Vulnerable exposure                                                         Vulnerable exposure
                                      Air
                                     55%
                                                                                                            Media
            Rail                                                                                            30%
            3%

                   Marine    $8.5BN                                                              $7.5BN
                    10%
                                                                                     Telecom &
                                                                                       Cable                        Publishing
                                                                                        66%                            4%
                            Ground
                             32%

  Our vulnerable exposure to the transportation sector                Our vulnerable exposure to the telecommunication & media
   represents 1.1% of total loans & acceptances outstanding             sector represents 0.3% of total loans & acceptances
  87% of the sector is impacted by COVID-19, particularly              outstanding
   airlines and aircraft companies                                     Our media exposure is impacted by COVID-19, particularly
    Airlines and aircraft companies represent 37% of our               theatres, movie production and movie distribution companies
      exposure to the transportation sector

28 | RISK REVIEW                                                                                                                           RBC
Strong underlying credit quality in Canadian Banking
Canadian Banking Outstanding Lending Exposure(1)                                                                   Canadian Banking FICO Score Distribution – Retail
(Average balances as of Q2/2020; $ billions)                                                                       (As of Q2/2020)

                                                                                      Q2/2020         Q1/2020                                            720
                                                                                                                                                         76%
                                2                  84
             Commercial
                                                   82

                                     PCL on Impaired Loans ($MM)                       PCL on Impaired Loans (bps)(1)                90+ Days Past Due (bps)        Average FICO Score

                                        Q2/19           Q1/20          Q2/20              Q2/19            Q1/20    Q2/20       Q2/19        Q1/20      Q2/20                Q2/20

   Residential Mortgages                 $6             $10              $9                  1              1         1              18        18        17                  783

   Personal Lending                     $116            $129           $138                  59             64        70             31        33        36                  769

   Credit Cards                         $122            $137           $139                 269            274       307             73        81        96                  719

   Small Business                        $9             $12             $14                  76             88       102             95       111        128

   Commercial(2)                        $110            $12             $39                  58             6         19             67        64        57

                                        $363            $300           $339                  34             26        30

(1) Calculated using average net of allowance on impaired loans. (2) Commercial excludes Small Business.

29 | RISK REVIEW                                                                                                                                                                         RBC
Canadian residential portfolio has strong underlying credit quality
                                                                                                                                           Canadian Banking Residential Lending Portfolio(2)
Q2/2020 Highlights                                                                                                                         As at Q2/2020
 Strong underlying quality of uninsured residential mortgage                                                                                                                                       Total ($312BN)                       Uninsured ($234BN)
  portfolio(2)                                                                                                                             Mortgage                                                     $274.0BN                                  $196.2BN
      49% of uninsured portfolio have a FICO score >800                                                                                   HELOC                                                         $37.7BN                                  $37.7BN
 Greater Toronto Area and Greater Vancouver Area average                                                                                  LTV (2)                                                          53%                                       52%
  FICO scores remain above the Canadian average                                                                                                 GVA                                                          47%                                      46%
 Only 3% of our residential lending portfolio has an LTV >80%                                                                                   GTA                                                         49%                                      49%
  and FICO score of 720 or lower, and is predominantly all                                                                                 Average FICO Score(2)                                             794                                      800
  insured
                                                                                                                                           90+ Days Past Due(2)(3)                                        20 bps                                    16 bps
                                                                                                                                                 GVA                                                       12 bps                                   11 bps
                                                                                                                                                 GTA                                                        8 bps                                    8 bps

 Canadian Residential Mortgage Portfolio(1)                                                                                                Canadian Banking Residential Lending Portfolio(2)
 As at Q2/2020 ($ billions)                                                                                                                As at Q2/2020
                                                            LTV(2)                                                                                LTV (2)                                                                                    FICO Scores
          51%                  48%                 63%                  56%                 57%                  57%                                                            6%
                                                                                                                                                  >80%                                                                                             >720
      $135.7
                                                     Insured           Uninsured                                                                                                                                                                   681-720
                                                     $102.7              $196.2                                                                                                                                      20%
                                                     (34%)               (66%)                                                             65%-80%                                                                                                 620-680
         72%
Client relief programs: Supporting our clients through the pandemic
Since the onset of the pandemic, RBC has approved over 492,500 clients globally to participate in its various
payment deferral programs
 Providing up to six months payment deferrals in Canada, with more than 60% of deferment requests for multiple months
 Providing up to 90-days payment relief for CNB clients
 Pace of deferral requests has decelerated in recent weeks
 Delinquencies and consequent losses will be suppressed for the next few quarters, given high volumes of deferment

Payment Deferral Programs by Product in Canadian Banking and CNB
(As at Q2/2020)
                                                                 % of                Balances                  % of
                                                              Accounts               Approved               Balances
                                                                                                                                                                      Deferral Details (3)
                                                              Approved              for Deferral            Approved
                                                             for Deferral              ($BN)               for Deferral
Consumer Loan Deferrals
Canadian Banking
                                                                                                                                 Mortgages account for 45% of all Canadian Banking consumer
Residential mortgages(1)                                           14%                   $47.2                   18%
                                                                                                                                 deferrals but over 90% of consumer balances
      Insured                                                      15%                   $14.0                   18%             Avg. LTV: 66%; Avg. FICO: 723
      Uninsured                                                    14%                   $33.2                   18%             Avg. LTV: 58%; Avg. FICO: 754
Credit cards                                                        2%                    $1.3                    7%             Avg. FICO: 670
Personal loans(2)                                                   1%                    $2.7                    4%             Avg. FICO: 689
CNB Residential mortgages                                           5%                  US$1.1                    8%             Avg. LTV: 61%; Avg. FICO: 743
Commercial Loan Deferrals
Canadian Banking Commercial &                                                                                                    Top industry concentrations: Commercial Real Estate, Other
                                                                    5%                   $15.3                   17%
Small business loans(1)                                                                                                          Services and Consumer Discretionary
                                                                                                                                 Top industry concentrations: Consumer Discretionary and
CNB Commercial loans                                                3%                  US$1.8                    7%
                                                                                                                                 Commercial Real Estate
(1) Canadian commercial and small business loan deferrals include $1BN of retail residential mortgage deferral balances with commercial clients. (2) Personal Loans includes personal direct lending, auto loans and secured lines of
credit. (3) LTV and FICO are as of March 2020.
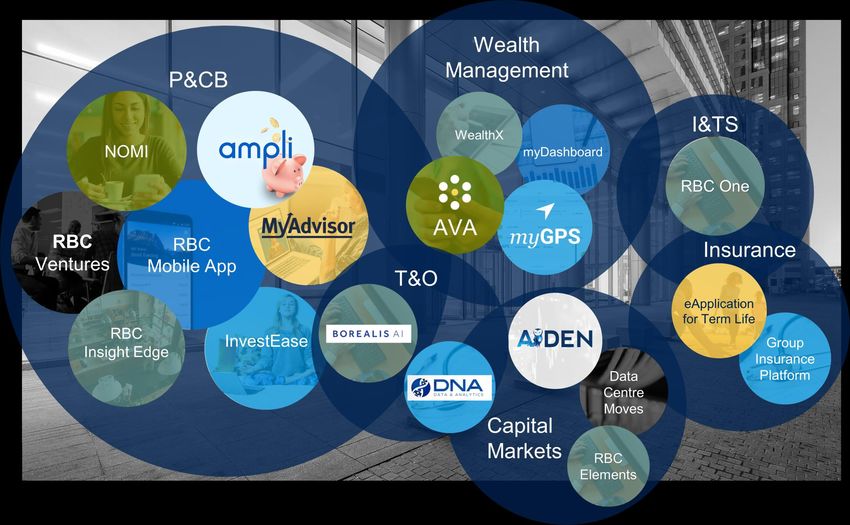
31 | RISK REVIEW                                                                                                                                                                                                                    RBC
Technology @ RBC
Investors value RBC for its industry-leading franchises and innovative approach

                                                 7.5MM active digital users                            Data
                                                                                                                    5 Borealis AI labs connected
   Creating More                                                                                          &
                                                 1.9MM clients onboarded                                            with top universities across
       Value                                         onto MyAdvisor with a                            Artificial     Canada, with 85 PhDs
    for Clients                                      personalized plan                              Intelligence    1.1BN+ insights read by
                                                 4.8MM active mobile clients                         Insights       clients on NOMI in the RBC
                                                     on the RBC Mobile app                                           Mobile app(1)

        Driving
                                                                                                     Innovation
       Efficiency
            &                                    701MM client transactions                          Ecosystem       6 innovation labs globally
                                                     daily                                               &           19 RBC Ventures in market
      Operational
                                                                                                    Partnerships     Top 3 for places to Work in
      Excellence
                                                                                                                      Tech in Toronto(2)

(1) 1.1BN insights read on a launch to date basis. (2) Based on HIRED’s 2019 Global Brand report.

33 | TECHNOLOGY @ RBC                                                                                                                           RBC
Our technology platforms are enabling all businesses to exceed client expectations

34 | TECHNOLOGY @ RBC                                                          RBC
We have developed a rich innovative ecosystem that attracts top talent

                          Unique Partnerships
                          (FinTech, Big Tech)

  6 Innovation Labs                                  Research
  around the world                                  Institutions

  Fostering Engineering                         RBC Ventures,
   & Innovation Culture                         Incubators and
                                                 Accelerators

                           Digital RBC

35 | TECHNOLOGY @ RBC                                                    RBC
Transforming the distribution network in Canadian Banking

               Active Digital Users(1)                                           Digital Adoption Rate(2)                                              Active Mobile Users(1)

                             7%                                                                 190 bps                                                                   16%

                                          7,544                                                                                                                                         4,819
                            7,354                                                                                 53.9%
                                                                                                                                                                          4,619
             7,030                                                               52.0%           52.5%
                                                                                                                                                           4,144

            Q2/19          Q1/20         Q2/20                                   Q2/19            Q1/20           Q2/20                                   Q2/19          Q1/20         Q2/20

                  Mobile Sessions(3)                                           Self-Serve Transactions(4)                                                          Branches

                         38%                                                                    460 bps
                                                                                                                 92.0%                                                      0%
                                          91,649

                                                                                                                                                          1,207            1,206            1,205
                          76,633                                                                  88.8%
                                                                                  87.4%
           66,571

                                                                                                                                                         32,800           32,783           32,750

            Q2/19          Q1/20          Q2/20                                   Q2/19           Q1/20          Q2/20                                    Q2/19           Q1/20            Q2/20
                                                                                                                                                                         Total FTE
(1) These figures (in 000s) represent the 90-Day Active customers in Canadian Banking only and are spot values. (2) Digital Adoption rate calculated using 90-day active users. (3) These figures (in 000s)
represents the total number of application logins using a mobile device. (4) Financial transactions only.

36 | TECHNOLOGY @ RBC                                                                                                                                                                                  RBC
RBC Ventures
We are making great progress going                                      Boomerang
‘beyond banking’                                             Dr. Bill

                      Ownr                                          WELLNESS

                             Sorted

                                                                                    Get Digs
                                                                                          Propertii
                    BUSINESS
                                                                        Garbage
                                                                                               Unison
                                                                          Day

                                                                         Smart                   OJO
                                                                         Reno       HOME
                             Arrive                                        Renoshield
                                        Butter                                    Movesnap
                  Ampli                     Dipp             Handshake
                                                      Rocketman
                Wellspent                   Willgo
                            LIFESTYLE                Drive
                   Prepped                                   MOBILITY
                             MyDoh

 38
Economic Backdrop
Canada’s balance sheet is well positioned to provide support
  COVID-19 government support (1)                                                                                        G7 Government Debt
  (% of GDP)                                                                                                             (% of GDP)
50%                                                                                                                         250%         237%
          46.1%
45%

40%                                                                                                                         200%

35%

30%                                                                                                                         150%
                       26.6%                                                                                                                              135%
25%
                                                                                                                                                                     109%
                                   18.5%                                                                                                                                           99%
20%                                             17.6%       17.0%
                                                                                           (2                               100%                                                                 89%           85%
15%                                                                      14.2%        14.1%)
                                                                                                  10.8%                                                                                                               60%
10%                                                                                                                           50%
 5%

 0%                                                                                                                            0%
           Italy     Germany         UK        France      Australia    Canada          US        Spain                                  Japan            Italy       US          France        Canada         UK    Germany

  Bank of Canada asset purchase programs                                                                                 Central bank balance sheets
  Change in BoC holdings vs. end of 2019, ($ billions)(2)                                                                (% of GDP)
 75                                                                                                                           50%
           BoC will buy
           40% of new                                                                                                         45%
 65           T-bill
            issuance
                                  BoC                                                                                         40%
 55                            purchasing
                                 at least                                                                                     35%
 45                             $5bn per                                                                                                                  Year-to-date
                                  week                                                                                        30%                         increase
 35
                                                                                           BoC will buy                       25%
                                                                                            $10bn in
 25                                                                                     corporate bonds                       20%
                                                                      BoC will buy          (program
                                                                        $50bn in         launching May                        15%
 15                                                                                            26)
                                                                    provincial bonds
                                                                    (starting in May)
                                                                                                                              10%
   5
                                                                                                                                5%
  -5                                                                                                                            0%
           GoC bills           GoC bonds       Canada Mortgage Provincial money             Banker's                                                (3)
                                                   Bonds       market securities         acceptances &
                                                                                                                                              BoC                 RBA                 Fed                BoE          ECB
                                                                                        commercial paper

(1) Includes direct government spend, loans and guarantees. (2) Note: ~$165 billion in term repos not shown. (3) Quantitative easing program indicates $5 billion weekly purchases continuing for one year.

40 | ECONOMIC BACKDROP                                                                                                                                                                                                      RBC
Canada’s fiscal position
 Strong rating as a result of fiscal prudence, conservative bank lending practices and a solid economy
 Lowest net debt-to-GDP ratio among G7 peers

                                                        Canadian GDP by Industry(1)
                                                                (November 2019)

                                                                                      Finance, Insurance & Real Estate

                                                  14%
                                                                                      Manufacturing
                                                                    20%

                                                                                      Wholesale and Retail Trade
                                   5%

                                                                                      Scientific, Technical & Educational
                                                                                      Services
                             8%
                                                                                      Public Administration and Utilities
                                                                                10%

                                                                                      Mining, Oil & Gas Extractions
                              8%

                                                                                      Construction

                                     4%                                   10%
                                                                                      Health Care

                                                 10%
                                                          12%                         Transportation, Warehousing

                                                                                      Other

(1) Statistics Canada, RBC Economics Research.

41 | ECONOMIC BACKDROP                                                                                                      RBC
Services sector and oil price free fall will drive economic downturn
 Contrary to previous downturns, social distancing measures to limit the spread of the novel coronavirus (COVID-19) are dramatically
  weighing on activity in service-sector industries that are normally a buffer in an economic downturn. Fiscal/monetary policy measures
  will do little to limit the near-term economic shutdown, which is being driven explicitly by social distancing policies. But supporting more
  households/businesses to stay solvent should help to speed the recovery once the virus is under better control.
 Global demand and supply-chain disruptions are weighing on virtually all other sectors of the economy as well. Oil prices were already
  under pressure from global demand concerns but fell sharply further in March due to a dispute over appropriate production levels
  between Saudi Arabia and Russia. The combined effect pushed West Texas intermediate (WTI) oil prices down below $20/bbl. We
  expect investment activity in the oil & gas sector to fall dramatically by the summer, and do not assume a recovery in the foreseeable
  future.
 We expect Canadian GDP to contract 6.4% in 2020 and bounce back 3.4% in 2021 as COVID-19 containment measures ease. Annual
  headline inflation will fall to 0.4% for 2020 by our count, due to broad-based decline in demand and drop in oil prices. Employment has
  declined by 1 million in March, with another 2 million drop following in April(1). We expect the unemployment rate in Canada to average
  almost 10% in 2020.

  Canadian Inflation (YoY)(2)                                                                                        Canadian Labour Markets (YoY)(3)

 (1) Statistics Canada. (2) Statistics Canada, RBC Economics Research. (3) Statistics Canada, Bureau of Labor Statistics, RBC Economics Research.

42 | ECONOMIC BACKDROP                                                                                                                                  RBC
2020 Economic Outlook
Projected Economic Indicators for 2020(1)

                                                                                                   Unemployment                   Interest Rate              Current Account      Budget
                                               GDP Growth                    Inflation
                                                                                                       Rate                      (3 mth T-bills)              Balance/GDP(2)   Surplus/GDP(3)

 Canada                                             (6.4%)                      0.4%                      9.7%                        0.20%                         (3.7%)         (5.4%)

 U.S.                                               (5.5%)                      0.5%                      8.4%                        0.15%                         (2.6%)        (11.6%)

 Euro Area                                          (5.4%)                       NA                       11.9%                          NA                          2.6%           NA

                                 The Canadian economy is forecast to contract by 6.4% in 2020. We expect dramatic declines in GDP over the first half of
                                  the year (-10% Q1, -32% Q2 at annualized q/q rate). That profile is contingent on governmental authorities being able to
                                  allow some limited easing in social distancing restrictions before end-of-quarter. We expect an initial sharp, but only partial,
                                  bounce-back in activity in Q3 and Q4. Tourism industries, restaurants, etc. will remain under pressure. And the oil & gas
                                  sector is likely to remain under pressure. We expect the recovery will remain partial – and the unemployment rate still
  Canada                          elevated – through 2021.
                                 The Bank of Canada (BoC) cut its overnight rate by 150 basis points, to 0.25%, in less than a month and initiated a round
                                  of quantitative easing for the first time in the bank’s history in addition to a slew of liquidity and credit easing measures. We
                                  do not preclude further action by the BoC (e.g. purchasing non-federal government bonds, moving rates below 0 etc.), but
                                  we do not see it as a base – even though near-term prospects are quite dire as noted above.

                                  We are penciling in a 35% drop in US Q2 GDP. We expect a partial, but not full, bounce-back in the second half of the
                                   year. The economy is expected to contract 5.5% in 2020. A large number of workers will be able to be re-hired relatively
                                   quickly once activity begins to recover. But we expect not all industries will recover quickly. Government measures will
  U.S.                             likely help many bridge the gap but several businesses are likely close up shop permanently.
                                  The Federal Reserve cut rates by 150 basis points in just 2 weeks, and is restarting quantitative easing alongside other
                                   measures to support lending. These measures include US$700bn of planned Treasury and MBS purchases, a reduction in
                                   the discount window borrowing rate (of 50 bps over and above the funds rate cut) and an elimination of reserve
                                   requirements.

                                  As in other regions, we expect the COVID-19 outbreak to weigh significantly on GDP in the Euro area in Q2, with gradual
                                   rebound coming in the second half of the year. The euro area composite PMI registered its lowest print on record in March
                                   – far surpassing the previous low seen in February 2009 at the height of the global financial crisis and signaled deep
  Euro Area                        recession. Euro area GDP growth is expected to slow by 5.4% in 2020.
                                  The European Central Bank held their policy rate steady in March (-50 bps deposit rate) but announced a new LTRO
                                   program and increased planned asset purchases as part of the existing QE program, along with other measures to inject
                                   liquidity into financial markets.
(1) RBC Economics Research as of April 14, 2020 and reflect forecasts for calendar 2020. (2) RBC Economics Research, IMF WEO (April 2020). (3) RBC Economics Research.

43 | ECONOMIC BACKDROP                                                                                                                                                                          RBC
Canadian Housing Market
Structural backdrop to the Canadian and U.S. housing market
                                                                            Canada(1)                                                               U.S.(1)
    Regulation                 Government influences mortgage underwriting policies                                          Agency insured only if conforming and LTV under
                                primarily through control of insurance eligibility rules                                       80%
                               Fully insured if loan-to-value (LTV) is over 80%                                              No regulatory LTV limit – can be over 100%
                                    Must meet 5-year fixed rate mortgage standards                                           Not government-backed if private insurer defaults
                                    Government-backed, on homes under $1MM
                                    Down-payment over 20% on non-owner occupied
                                     properties
                                    CMHC last increased mortgage loan insurance premiums
                                     in 2017 by ~15% for new mortgages with LTV over 90%
                                    Minimum down payment for new government-backed
                                     insured mortgages is 10% for portion of the value of a
                                     home being purchased that is between $500,000 –
                                     $999,000, and 5% below $500,000
                               Re-financing cap of 80% on non-insured
     Consumer                  Mortgage interest not tax deductible                                                          Mortgage interest is tax deductible
     Behaviour                 Greater incentive to pay off mortgage                                                         Less incentive to pay down mortgage
      Lender                   Strong underwriting discipline; extensive documentation                                       Wide range of underwriting and documentation
     Behaviour                                                                                                                 requirements
                               Most mortgages are held on balance sheet
                                                                                                                              Most mortgages securitized
                               Conservative lending policies have historically led to low
                                delinquency rates
      Lenders’                 Ability to foreclose on non-performing mortgages, with no                                     Stay period from 90 days to one year to foreclose
      Recourse                  stay periods                                                                                   on non-performing mortgages
                               Full recourse against borrowers(2)                                                            Limited recourse against borrowers in key states

(1) Current regulation and lenders recourse. (2) Alberta and Saskatchewan have some limited restrictions on full recourse.

45 | CANADIAN HOUSING MARKET                                                                                                                                                  RBC
Legislation and policies – promoting a healthy housing market
 April 2020 (postponed due to COVID-19) – Department of Finance

   The benchmark rate used in the insured mortgage qualification stress test changing to the median contract rate on all insured mortgages,
    making the stress test more responsive to actual market rates. OSFI is considering a similar change for uninsured mortgages

 February 2018 – Government of British Columbia

   The B.C. government introduced a 30-point plan to address housing affordability issues. It included a new speculation tax (2% of assessed
    value) on homeowners who do not pay income tax in the province and increased in the foreign buyer tax to 20% from 15%

 January 2018 – OSFI

   Qualifying rate for uninsured mortgages raised to 2 percentage points above the contract rate or the five-year posted rate, whichever is higher

 April 2017 – Government of Ontario

   Introduced the ‘Fair Housing Plan’: 16 measures to address risks in the housing market including a 15% speculation tax on non-residents
    purchasing homes in the Greater Golden Horseshoe region

 January 2017 – City of Vancouver

   Vancouver introduced a tax of 1% of the assessed value of each home which is vacant (principal residence is exempt)

 October 2016 – Department of Finance

   Qualifying rate for high-ratio mortgages with a term of five years or more is changed to the 5-year posted rate
   Portfolio-insured low-ratio mortgage loans must meet the eligibility criteria of high-ratio insured mortgage
   A principal residence sale must be reported in the seller’s tax return, even if any capital gain is protected by the principal residence exemption

 July-August 2016 – OSFI & the Government of British Columbia

   OSFI increased scrutiny on mortgage underwriting standards: greater emphasis on internal controls, risk management practices and market
    developments
   BC government introduced a property transfer tax of 15% on foreign buyers registering the purchase of a home in Metro Vancouver

46 | CANADIAN HOUSING MARKET                                                                                                                       RBC
You can also read