House Views The Great Rebalancing - September 2020 For Professional Clients and Institutional Investors only
←
→
Page content transcription
If your browser does not render page correctly, please read the page content below

House Views
The Great Rebalancing
September 2020

For Professional Clients and Institutional Investors only

Not for further distribution

This commentary provides a high level overview of the recent economic
environment, and is for information purposes only. It is a marketing
communication and does not constitute investment advice or a recommendation
to any reader of this content to buy or sell investments nor should it be regarded
as investment research. It has not been prepared in accordance with legal
requirements designed to promote the independence of investment research
and is not subject to any prohibition on dealing ahead of its dissemination

Table of contents

Executive summary                      2
Macro and strategy outlook             3
Inflated opinion                       8
A new era for Asian monetary policy?   11
Time for the great rebalancing         14
Important information                  18

Executive summary

Macro and strategy    Some analysts have labelled the huge market recovery since mid-March as “the rally in everything”.
                      But against the backdrop of volatility in the tech sector, there is a concern that the recovery is on shaky
outlook               foundations: covid is still with us, unemployment and default rates are high, policy support is fading,
                      and political uncertainty is returning. Does it mean that we are set for a market reversal in Q4?

                      We argue that during the so-called “rally in everything”, market pricing has not become disconnected
                      from the economic facts. However, after a strong rebound in the economic data in Q2 and Q3, growth
                      is now set to moderate and, in Q4, we are entering the next phase of recovery – a “flattening of the
                      swoosh”. The market needs to adapt to that reality. We think it implies a new, range-bound scenario, a
                      focus on income and “clipping coupons” for investors, and a requirement to keep a keen eye on
                      political events.

Inflated opinion      With economies now in recovery mode, a debate as to whether the covid shock will ultimately prove to
                      be deflationary or inflationary is emerging. This is a critical question for financial markets, given risk-
                      asset valuations are supported by current exceptionally low government bond yields.

                      In this article, we argue that at this stage, continued subdued inflation is probably the greater risk in
                      most developed economies. The main challenge for the eurozone and Japan is likely to be getting
                      inflation up to target, rather than avoiding an overshoot.

                      The risks for the US are more balanced, in our view, but reflation is likely to be gradual and a period of
                      persistent, excessive inflation would take time to emerge and require a “regime shift” with the
                      government overriding central bank independence.

A new era for Asian   Since the covid outbreak, EM central banks have eased monetary policy aggressively through policy
                      rate cuts and injecting market liquidity to ease the economic fallout. Some have also embarked on
monetary policy?      unconventional monetary policies; measures usually associated with advanced economies. In Asia,
                      these policies have mostly been in the form of government securities purchases, some purchases of
                      corporate debt and some yield curve control management.

                      An important question for Asian policy-makers is about the effectiveness of many of these
                      unconventional measures, especially at a time when credit risk aversion is high and money multipliers
                      are low. In this article, we argue that we don’t believe the impact of fast money and credit expansion
                      on inflation and FX stability in Asia is an immediate concern.

                      In the medium-term, we would look for EM Asian central banks to establish exit strategies from these
                      unconventional measures to preserve central bank autonomy, inflation-targeting, and long-run macro
                      stability.

Time for the great    Government bonds have been one of the best asset classes to own in the last decade, offering high
                      single-digit returns and negative correlations to equities. They have protected portfolios during times of
rebalancing           poor equity performance. However, current low yields, and a shift in macro policy beyond interest
                      rates, means that the hedging properties of bonds are set to diminish.

                      In this article, we argue that this situation leads institutional investors to allocate away from
                      government bonds into asset classes that can offer portfolio diversification in the current environment.
                      Inflation-linked bonds and some commodities can help. However, a great rebalancing means that
                      liquid and illiquid alternatives must play a much greater role in institutional asset allocations.

                                                       2
Macro and strategy outlook
                     Joe Little
                     Global Chief Strategist

Swoosh-onomics,      Some analysts have labelled the huge market recovery since mid-March as “the rally in everything”.
                     But against the backdrop of volatility in the tech sector, there is a concern that the recovery is on shaky
political            foundations: covid is still with us, unemployment and default rates are high, policy support is fading,
uncertainties, and   and political uncertainty is returning. Does it mean that we are set for a market reversal in Q4?

clipping coupons     We argue that during the so-called “rally in everything”, market pricing has not become disconnected
                     from the economic facts. However, after a strong rebound in the economic data in Q2 and Q3, growth
                     is now set to moderate and, in Q4, we are entering the next phase of recovery – a “flattening of the
                     swoosh”. The market needs to adapt to that reality. We think it implies a new, range-bound scenario, a
                     focus on income and “clipping coupons” for investors, and a requirement to keep a keen eye on
                     political events.

Market anatomy       Figure 1 shows the year-to-date performance for a range of asset classes. Many traditional and
                     alternative asset classes are trading at, or close to, highs for the year. Before we turn to the outlook,
                     it’s important to understand how we arrived at what some called a “rally in everything”.

                     Figure 1: The rally in everything
                          60%
                                 USD Total Returns
                                                                                      Peak YTD    Trough YTD     Year to date
                          40%

                          20%

                           0%

                         -20%

                         -40%

                         -60%

                         -80%
                                 Government Corporate     EM         Equity      Commodities     Alternatives    Global Equity Styles
                                   Bonds     Bonds        Debt                    and USD                            (Long Only)
                         -100%

                     Source: Bloomberg, HSBC Global Asset Management, September 2020.
                     Past performance is not a guarantee of future performance.

                     There have been three distinct “acts” to the market recovery. First, from mid-March to mid-May, we
                     saw the effects of bold policy support, which pushed the discount rate lower1. Central bankers’ promise
                     of “lower for even longer” interest rates anchored Treasury yields into a 60-80bp range ever since. In
                     addition, fiscal stimulus, as well as targeted monetary measures, forced the “disaster risk premium” out
                     of the market pricing kernel2. Those factors enabled the first phase of recovery.

                     1
                       For example, recent research by Landier and Thesmar (https://www.nber.org/papers/w27160) and by Gormsen and
                     Koijen (https://voices.uchicago.edu/gormsen/gdp-growth-forecasts-from-dividend-futures/) demonstrates that large
                     portions of stock market volatility in 2020 can’t be explained by changes in expectations about dividends and
                     earnings.
                     2
                       Event studies on the February/March crisis episode nicely illustrate how the disaster risk premium had moved into
                     market pricing - https://voxeu.org/article/financial-markets-and-news-about-coronavirus.

                                                        3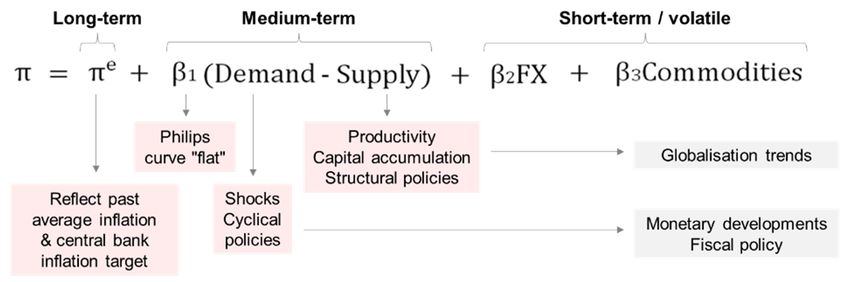
The second “act” of the market recovery story took place from May to mid-June. This is when the
                    market began to price-in better macro-economic news, and revise its expectation of future growth.
                    Economic data in Asia had improved first, linked to what we described as “first-in-first-out” and a
                    robust health policy response but, from May, we saw confirmation of an improved global growth
                    outlook. The market moved from pricing an L-shape recovery, toward a more constructive scenario;
                    economists’ growth expectations moved significantly higher, and small caps and emerging markets
                    outperformed US big caps.

                    Finally, the third “act” was from mid-June through the summer months. This part of the story is also
                    linked to movements in the discount rate. In the US, long-run real interest rates fell to -1%, which
                    supported risk assets at a time when the growth surprise was flattening-out; commodities
                    outperformed and the dollar weakened.

What growth         The delivery of policy support has clearly been a crucial component in the recovery, but not the only
                    driver. An important idea from academic research is that asset price overshooting is not just a
scenario does the   consequence of policy measures, but it is a desired policy objective in itself to foster economic
market discount?    reflation3.

                    As investors, we need to be sensitive to this. Our baseline scenario for the economy has been for a
                    “swoosh recovery”, an assumption of a big bounce in activity in Q3 and a longer-run return to pre-virus
                    growth rates, but with lower trend output. However, we need to understand what macro-economic
                    assumptions are built-into investment markets today. After the “rally in everything”, we think the market
                    now assumes a slightly-stronger profile than this “swoosh”; we might call this the priced scenario
                    “swoosh-plus”.

                    To reach that conclusion, we have used three models. First, we track the price behaviour of growth-
                    sensitive asset classes. Figure 2 shows our measure of market-implied growth4. The market’s
                    perception of growth has picked-up, but it remains rather subdued, linked to the current environment of
                    low oil prices and bond yields, despite the recovery in other risk assets.

                    Figure 2: Proprietary market implied growth indicator
                    110          Index

                    105

                    100

                        95

                                                                  Total return                      7.2%
                        90
                                                           Short ILBs & Gold     -8.3%

                                                         Short nominal bonds         -2.1%

                        85                                Long real assets
                                                                                                   6.6%
                                                        (Commoities +REITs)
                                                       Long equities + credits                              18.0%

                        80
                          2015            2016                2017                2018              2019               2020

                    This indicator is the market performance of an equal volatility long-short portfolio of growth asset classes against
                    defensive asset classes (implied growth index).

                    Source: Bloomberg, HSBC Global Asset Management, September 2020.
                    Past performance is not a guarantee of future performance.

                    3
                      See for example Ricardo Caballero’s 2020 paper: https://www.nber.org/papers/w27712.pdf.
                    4
                      Market-implied growth signal is a proprietary measure tracking an equal volatility-weighted long/short portfolio of
                    growth versus defensive asset classes. The rally in inflation-linked bonds and gold have acted as a drag on recent
                    readings.

                                                         4
Second, we look at equities more closely, using a dividend discount model. We define a recovery
                        profile for dividends linked to our swoosh baseline (dividends recover their previous peak over the next
                        year). That scenario, connected to current prices and bond yields, implies a global equity premium of
                        below 3% today. That is a lower premium than we would expect in equilibrium5. It suggests that global
                        equities already discount a stronger macro scenario than the swoosh.

                        Third, we take an even-more structured approach to valuation by estimating market-implied long-run
                        expected returns for over 300 asset classes. Figure 3 shows the current capital market line (CML)
                        compared to the recent past. Today’s CML is still upward-sloped, but far less so than in April. In fact,
                        the CML has a similar shape to what we saw in December 2019 – a combination of negative real
                        returns on cash, negative bond risk premia, and more normal-looking risk premia in parts of credits,
                        equities, EMs and alternatives. In other words, current valuations suggest that the macro scenario
                        discounted by the market has moved on materially – even if they don’t indicate anything like bubble
                        dynamics yet.

                        Figure 3: A flatter capital market line
                                                                     10
                                                                                           Aug-20         Mar-20         Dec-19
                            Expected Risk Premia (%, Nominal, USD)

                                                                     8

                                                                     6                                                   Local EMD
                                                                                                         Asia HY
                                                                                                                                             EM Equity

                                                                     4
                                                                                                                            DM Equity

                                                                     2                              Global HY      $EMD Sov

                                                                                 Global IG
                                                                     0
                                                                              Global Bonds

                                                                     -2
                                                                          0       5                 10                 15               20               25
                                                                                                    Expected Volatility (%)

                        Source: Bloomberg, HSBC Global Asset Management, September 2020.
                        Past performance is not a guarantee of future performance.

A flatter part of the   That means that the investment outlook for Q4 is not going to be determined by starting valuations.
                        Instead, market action will be driven by whether the economic news-flow can keep pace with the
swoosh recovery         market’s priced scenario of “swoosh-plus”. This creates a challenge, because GDP growth is set to
                        moderate as we go into Q4.

                        The reason for this is that we understand the recovery as playing-out in two phases. First, there was a
                        “natural rebound”, as the electricity to the economic system was turned back-on post-lockdown. In this
                        phase, we saw a faster-than-expected recovery across global economies, driven by large-scale
                        income support6.

                        However, we are now entering a second, “flatter” phase of the swoosh recovery, where growth will
                        moderate. Mobility data already shows the speed of recovery slowing in Q3. And the previous strength
                        in consumer spending, which has been driven by the goods sector, is starting to slow. Further recovery
                        is more dependent on services sector spending, which remains compromised by social distancing
                        measures.

                        Meanwhile, covid is still with us, unemployment rates are abnormally high7, and savings ratios are
                        elevated. Experience suggests that we face a prolonged phase of low output ahead8. Our working
                        assumption is that the economy will be operating at 90-95% of pre-covid levels over the next 6-12
                        months.

                        5
                          Siegel’s 2017 CFA Institue e-book is a classic reference for the equity premium. Estimates of a “normal” equity
                        premium vary. But we would assume 3.5-4.5%, depending on the volatility of the equity market concerned.
                        (https://www.cfainstitute.org/-/media/documents/book/rf-lit-review/2017/rflrv12n11.ashx).
                        6
                          For example, US retail sales are up 5% versus the pre-covid level. We have seen a remarkable recovery in
                        spending on goods, at the expense of services. This, in turn reflects the policy support provided to household
                        incomes – US personal incomes, for example, are 8% higher than a year ago.
                        7
                          On average, US unemployment rate falls by -0.85% in an expansion: https://voxeu.org/article/what-do-recoveries-
                        past-us-recessions-teach-us-about-recovery-pandemic-recession.
                        8
                          See the research of US economist Robert Hall on “persistent slumps”
                        https://web.stanford.edu/~rehall/HBC010716.pdf.

                                                                                       5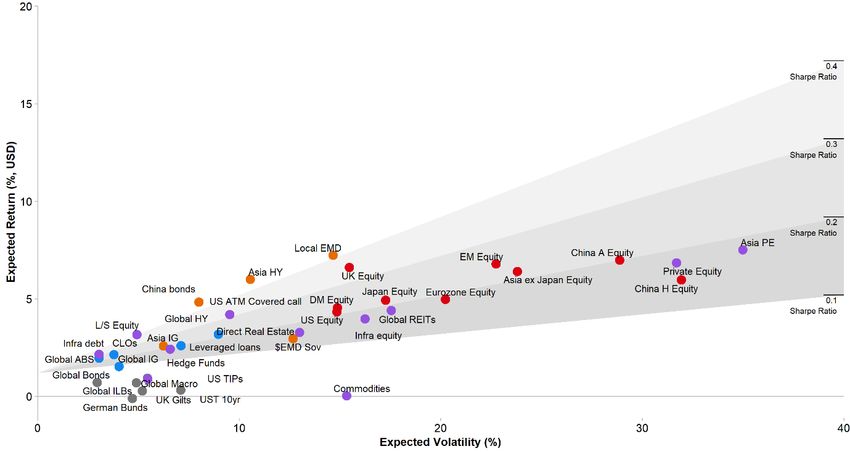
Figure 4: Recovery in goods consumption at expense of services
                   110      US consumption
                            (index February 2020 = 100, constant prices)
                   105

                                                                                                                          Slower growth in July
                                                                                Goods (c.35% of consumption)

                   100

                       95

                       90
                                                                                 Total

                       85

                       80
                                                                                Services (c.65% consumption)

                       75

                                    2017                      2018                       2019                     2020

                   Source: HSBC Global Asset Management, Macrobond, September 2020.
                   Past performance is not a guarantee of future performance.

                   Figure 5: Path of swoosh recovery (de-trended and smoothed global GDP)

                                                                                                                      C

                                                                                                               Swoosh recovery
                                                                                                               complete from a
                                                                                                               deep recession

                                                        B
                                                              Natural rebound once
                                                              lockdowns eased

                                                  A

                                           Lockdown causes sharp
                                           fall in GDP

                   Source: HSBC Global Asset Management, September 2020.
                   Any forecast, projection or target where provided is indicative only and not guaranteed in any way. HSBC
                   Global Asset Management accepts no liability for any failure to meet such forecast, projection or target.

Balance of risks   A more rapid recovery would require some combination of a covid vaccine and even more policy
                   support. On the former, the “super-forecasters” at the Good Judgement Project now estimate that
                   there is c 70% chance that a vaccine will be available by the end of Q1 20219. That is encouraging, but
                   already an assumption that we bake into our baseline scenario.

                   The outlook for policy support, meanwhile, remains a significant downside risk. The crisis has pushed-
                   out debt ratios by 20-30% points for the main economies. Even though we believe significant fiscal
                   space remains due to low inflation and low bond yields, it seems increasingly likely that fiscal support
                   will be withdrawn prematurely, due to a combination of stimulus fatigue, conventional thinking about
                   the deficit (the so-called “Treasury view”), and political gridlock. That risk will vary country-to-country.
                   The US, with the progress already made on the second fiscal package, is in the strongest position.
                   However, the policy choices of the next US administration will be key.

                   9
                       The Good Judgment Project link is here: https://goodjudgment.io/covid-recovery/#1363

                                                        6
Coupon-clipping in        The veteran economist Jim O’Neill has described the last six months in financial markets as
                          “bewildering, complex, and fascinating”10. We don’t believe that market pricing is divorced from facts
the flatter part of the   about the economy – as some analysts have argued. But markets have certainly been complex.
swoosh                    After the “rally in everything”, investors need to be realistic about the investment returns that are
                          achievable from here. The market has to transition to price-in a flatter profile of growth in the second
                          phase of the “swoosh recovery”. There are significant uncertainties about covid control, policy support,
                          and the US election. That means that a scenario for a more range-bound market seems likely as we
                          head into Q4. For investors, it means a greater focus on carry and income, what we call a “coupon
                          clipping” environment.

                          Figure 6: Market scenario – balanced risks and coupon clipping

                                   Downside risks                                                                       Upside
                                                                                                                        risks

                                                                          Market scenario

                               •     Fiscal policy error (premature withdrawal of     •     Momentum strengthening (FOMO, mass retail
                                     policy support)                                        participation, more leverage)
                               •     US political uncertainty intensifies             •     Further commitment from policy makers to
                               •     Covid outbreaks in back-to-school phase                support the economy and avoid spillovers
                               •     US-China tensions escalate further               •     Better news on covid (widespread adoption of
                               •     Swoosh flattens off more than we expect,               vaccine *some real rate risk!)
                                     negative surprises on macro data                 •     Positive surprises on corporate data – shock on
                                                                                            profits is lower than feared

                          Source: HSBC Global Asset Management, September 2020.
                          Any forecast, projection or target where provided is indicative only and not guaranteed in any way.
                          HSBC Global Asset Management accepts no liability for any failure to meet such forecast, projection or
                          target.

                          10
                               https://www.project-syndicate.org/commentary/financial-market-outlook-august-2020-by-jim-o-neill-2020-08

                                                                 7
Inflated opinion
Dominic James Bryant
Economist and Macro Strategist
With economies now in recovery mode, a debate as to whether the covid shock will ultimately prove to
be deflationary or inflationary is emerging. This is a critical question for financial markets, given risk-
asset valuations are supported by the current exceptionally low government bond yields.
The initial impact of the covid crisis on inflation was largely negative. Headline inflation rates slumped
on the back of the precipitous fall in the oil price from February to April. More importantly, core inflation
rates generally declined (Figure 1), with the exceptions typically in emerging markets.
Figure 1: Core inflation developments
5 Core CPI (% y/y)
HUN
PO
4 Rising inflation MEX
PH
3 ZAF
COP
Latest month
2 UK BRA
CLP
IDN
US
1 MYS
CA
RU KOR EU
AU Falling inflation
TWN THA
0 JPN CHN
-1
-1 0 1 2 3 4 5
February
Source: HSBC Global Asset Management, Macrobond, September 2020.
This trend is consistent with the view that while government-mandated lockdowns were a negative
supply shock, they triggered a larger, disinflationary, negative demand shock. The picture for emerging
markets was more complex than for developed markets, given the significant weakening of some EM
currencies, which had the potential to offset domestic disinflationary pressures.
What drives Now that activity has picked up sharply across many economies, questions are being asked regarding
the longer-run impact of the crisis on inflation; could inflation actually rise as result of the covid
inflation? recession, given the immense monetary and fiscal support packages that have been implemented?
In our view, whether rampant money growth, fiscal largesse and tweaks to policy frameworks generate
higher long-term inflation in developed markets depends on whether they are able to deliver a
persistent excess of demand over supply in economies, which drags inflation expectations up from
their current subdued levels.
Many factors influence demand and supply in an economy. Here we focus on three that are front of
mind at present: globalisation trends; money and credit developments; and fiscal policy.
Figure 2: Inflation framework
Source: HSBC Global Asset Management, September 2020.
8Backsliding on Globalisation is widely viewed as one of the factors that has held inflation down since the 1990s.
Certainly global inflation trended down while global trade intensified significantly after the formation of
globalisation the World Trade Organisation (WTO) in 1995 and China’s admission in 2000.
The covid pandemic has, however, exposed the potential fragility of complex, just-in-time supply
chains. Hence, firms may now look to build greater resilience into their operations, which could hinder
efficiency and reduce the effective pool of labour that firms have access to, pushing up prices.
At the margin, this may put upward pressure on inflation, but for a number of reasons we do not think it
is a game changer for the outlook:
Globalisation, as measured by trade intensity, has broadly stagnated since the global financial
crisis (GFC). Inflation, however, has been more subdued, suggesting other factors are more
important determinants of inflation.
Wage differentials between many emerging markets and their developed counterparts remain
wide, suggesting that the desire for more resilient supply chains has to be weighed against the
cost increases.
Overall, we view the issue as one of gradually stepping back from peak globalisation, rather than a
rapid period of de-globalisation; the latter would arguably have greater implications for inflation.
Monetary madness? Money and credit growth have picked up sharply, particularly in the US, since the covid-crisis struck.
Normally, this would indicate the potential for a booming economy and the risk of rising inflation. This
time is likely to be different. Credit growth has been driven by a surge in lending to firms; not for
investment purposes but to cover a “cash crunch”. Lending to households has been subdued –
households have been saving.
The upshot is that firms enter the recovery phase with battered balance sheets that they are likely to
want to repair. Indeed, this dynamic is already playing out in the US with commercial and industrial
loans (Figure 3). The corporate sector’s desire to deleverage is likely to weigh on money and credit
growth going forward and mean the pace of economic recovery slows after the post-April sharp
bounce in activity.
Figure 3: US commercial bank loans
Source: HSBC Global Asset Management, Macrobond, September 2020.
Fiscal folly? Strong money growth is also a function of the blowout in government deficits; central banks have been
buying government bonds in secondary markets, which directly increases money supply. However, to
think of wider deficits as fiscal stimulus is wrong at this stage; they are life support for the economy.
In most countries, government support measures essentially guaranteed household incomes and
loans to the corporate sector in the face of a huge interruption to cash flows, preventing a bigger
collapse in demand, rather than driving demand to unsustainably high levels.
The policy support has created relative “winners”; consumer spending on goods, for example, is above
pre-covid levels in a number of economies. However, even in these economies overall economic
activity remains well below normal levels at the end of Q3, with weakness increasingly focused in the
service sector. This could feasibly lead to relative price changes, with upward pressure on some goods
prices and downward pressure on some services prices.
9But for high government debt and large deficits to create widespread inflation, they would need to push
aggregate demand above aggregate supply for a sustained period. Whether this happens depends on
how governments address their debt levels. Excluding defaults, governments have three ways to
manage high debts: 1) Austerity, 2) Policy Coordination or 3) Financial Repression. Each has a
different conclusion for medium-run inflation:
With businesses likely to deleverage post-crisis, austerity would be disinflationary
Well-managed policy coordination could return inflation close to target
Financial repression would ease funding constraints for governments but risks ‘fiscal dominance’.
In this scenario undesirably high inflation would emerge
Inflation is a choice We need to remember the starting point is that somewhat higher inflation is desirable for many
economies – eurozone core inflation is at a record low, for example. With demand clearly below long
run supply, the most immediate risk for most economies is persistent low inflation/disinflation,
particularly if governments become more cautious in supporting economies – the risk of policy “under-
delivery”.
For inflation to re-emerge on a sustained basis, policy makers have to drive demand above supply and
drag inflation expectation up to a level consistent with their inflation targets. This requires fiscal and
monetary policy coordination; central banks have limited ammunition to support the real economy and
are unlikely to be able to achieve their objectives without help.
Excessive inflation would require governments to pressure central banks to maintain unduly loose
monetary conditions in order to accommodate continued fiscal largesse, even once inflation is
approaching target. This could occur if there is an unwillingness by households or governments to
accept the covid-crisis is likely to permanently damage the supply side and, therefore, reduce future
real incomes relative to pre-covid trends. Governments may be tempted to try and push incomes up,
thus creating excess demand (Figure 4).
Figure 4: Route to high inflation – push demand above long-run supply
110 GDP Index
105
100
Permanent damage
95
SR-supply
Demand
90
Pre-virus trend
Post-virus trend
85
Q1 Q3 Q1 Q3 Q1 Q3 Q1 Q3 Q1 Q3
Source: HSBC Global Asset Management, September 2020.
Balance of risks At this stage, continued subdued inflation is probably the greater risk in most developed economies;
the main challenge for the eurozone and Japan is likely to be getting inflation up to target, rather than
avoiding an overshoot. The risks for the US are more balanced, in our view, reflecting two key factors:
1. Central bank and fiscal support packages have been larger than elsewhere; and
2. A greater institutional desire to push inflation up, as seen by the Fed switching to an “average
inflation targeting” framework.
Even for the US, reflation is likely to be gradual and a period of persistent, excessive inflation would
take time to emerge and require a “regime shift” with the government overriding central bank
independence.
10A new era for Asian monetary policy?
Renee Chen
Senior Economist
EM Asian central Since the covid outbreak, EM central banks have eased monetary policy aggressively through policy
rate cuts and injecting market liquidity to ease the economic fallout. A number of EM central banks
banks turn more have also embarked on unconventional monetary policies; measures usually associated with
innovative and advanced economies.
unconventional In Asia, these policies have mostly been in the form of government securities purchases (primary and
secondary markets), some purchases of corporate debt as well (e.g. Korea and Thailand), as well as
some yield curve control management (e.g. India).
It is a fascinating new era for Asian monetary policy.
Figure 1: Unconventional monetary policies in selected countries
Policy rate cuts
Country Unconventional monetary policy measures
(Jan-Aug 2020)
Long-term repo operations (LTRO) injecting liquidity into the banking system to
improve the efficiency of policy transmission and support credit growth
Special OMOs/operation twist to contain yield curve steepening via RBI sales
of short-tenor government securities and purchases of long-tenor bonds.
India -115 bps
A special lending facility for mutual funds of INR500bn providing liquidity to
mutual funds and alleviating stress in the corporate bond market
A special liquidity scheme for non-banking finance companies (NBFCs) and
housing finance companies (HFCs) to improve their liquidity position in order to
avoid any potential systemic risks to the financial sector
BI buys government bonds in both primary and secondary markets
Under a 2020 "burden-sharing" agreement: BI will be buying government
bonds via private placement to help finance fiscal spending worth IDR397.5trn
Indonesia -100 bps (2.5% of GDP); BI will also act as a stand-by buyer and non-competitive bidder
in government bond auctions
Reserve requirement ratio cuts, while mandating that banks use this liquidity to
purchase government bonds in the primary market
The BoK will directly purchase government bonds every month in the
secondary market worth ~KRW5 trillion by the end of this year to curb bond
yield volatility and assist the extra debt financing needed to fund the 4th
supplementary budget
Korea -75 bps
Corporate bond-backed lending facility
A Special Purpose Vehicle (SPV) alongside the government to purchase
corporate bonds and commercial paper, including those with low credit ratings
Purchase of PHP300bn of government bonds directly from the Treasury under
a repurchase agreement to help finance the government's additional borrowing
Philippines -175 bps needs and support liquidity to the bond market
Purchase of local government securities from the secondary market via a daily
purchase 1-hour window
A corporate bond stability fund of THB400bn to enable the central bank to buy
high-quality corporate bonds that are being rolled over in 2020-21
Additional liquidity support through the Mutual Funding Liquidity Facility
Thailand -75 bps
(MFLF), which will run until market conditions normalise
Purchase of government bonds in the secondary market to support market
functioning
Source: HSBC Global Asset Management, CEIC, September 2020.
QE, but not DM-style In developed markets, unconventional monetary policy is aimed at providing additional stimulus for
growth and inflation, when the room for rate cuts is exhausted (and sometimes to address disruptions
in policy transmission too). But in EMs, the motivation for these policies varies significantly, and
approaches differ across, and within, regions.
In our view, the policies adopted by major Asian central banks do not fall into the standard definitions
of QE or yield curve control as those used in western economies. We define QE as: an unsterilised
asset purchase at the effective lower policy bound, aimed at bringing down long-term rates and the
expected future path of policy. Typically, we see a policy program and a high degree of commitment
(e.g. western central banks announce a target size of purchases). Plus, QE should lead to central
bank balance sheet expansion and growth in the monetary base.
11The current situation in EM Asia is slightly different to that playbook.
Policy rates are low in some economies, such as Thailand and Korea. But both central banks have
been cautious about whether QE and yield curve control are effective, appropriate, or warranted.
Meanwhile, elsewhere, other EM Asian central banks still have policy rates well above the zero lower
bound. Bond purchases in the Philippines or Indonesia, for example, are mainly aimed at limiting
market dislocations and supporting liquidity in a time of stress.
Better coordination There is increased need for greater coordination between fiscal and monetary policies given rising
public debt levels. That is particularly the case where economies have less “fiscal space”, either on
with fiscal policy debt sustainability grounds or due to budget rules.
Bond purchase programs can usefully offset market dislocations from new bond supply, which reduces
the risk that higher yields “crowd out” private sector investment. That’s important in the covid recovery
phase. As noted in the table above, both Korea and Indonesia have adopted policies in this spirit. For
Indonesia, central bank purchases by private placement are supposed to be a one-off for 2020, but we
see a possibility of debt monetisation extending into 2021 and beyond.
Other Asian central banks appear more reluctant to go down the path of debt monetisation, either
because of legal rules or convention. In India, the RBI has pushed-back on calls to conduct outright
bond purchases in the primary market. Activity in the secondary market is likely to be the “first-line-of-
defence”, but we would not rule out a more coordinated fiscal-monetary response later.
Low inflation and Overall, we expect monetary policy in Asia to remain accommodative until the macro-economy shows
clear signs of a sustainable recovery. Benign underlying inflation in most Asian economies means that
policy accommodation there is space to keep policy accommodative.
Asian core inflation remains on a clear downward trend. A combination of credible inflation-targeting,
flexible exchange rates (which has contributed to lower FX pass-through to inflation), as well as other
structural features has created a multi-year trend of stable/declining inflation.
Large negative output gaps in the aftermath of the covid shock intensify that trend for disinflation. It
means that Asian central banks can look-though any first-round effects of supply-side shocks on
inflation, especially in terms of commodity price swings.
Figure 2: Core CPI inflation
10 % yoy China
9 India
Indonesia
8
Avg of Philippines, Malaysia and Thailand
7 Avg of Korea, Singapore and Taiwan
6
5
4
3
2
1
0
2013 2014 2015 2016 2017 2018 2019 2020
Source: HSBC Global Asset Management, Bloomberg, CEIC, September 2020.
Even so, we see limited additional policy rate cuts this cycle. Increasingly, the focus will be on
quantitative easing and regulatory measures to support financial market stability and to provide credit
to the real economy. We should expect more fiscal-monetary co-ordination too, until market conditions
normalise.
In China, there is still significant fiscal and monetary space to provide stimulus, without resorting to
unconventional measures. The traction in the Chinese economic recovery and a focus on financial
stability means that the PBOC is able to take a more targeted policy approach.
12Manageable near An important question for Asian policy-makers is about the effectiveness of many of these
unconventional measures, especially at a time when credit risk aversion is high and money multipliers
term risks and long- are low.
run exit strategies However, we don’t believe the impact of fast money and credit expansion on inflation and FX stability
in Asia is an immediate concern.
The scale of government bond purchases by EM Asian central banks is still small, especially when
compared with advanced economies. That is true even in the context of Bank Indonesia committing to
purchasing 3.6% of GDP worth of bonds, or the Philippines central bank purchases constituting a
sizable portion of trading volumes.
Broad money growth has picked-up across the region. But that growth has been moderate, and partly
reflects higher demand for liquidity during uncertain times. Credit growth has not picked-up materially
(except in Korea, Philippines and Thailand), and lending to the private sector for investment and
consumption has remained weak.
In any case, excess capacity should slow the translation of credit growth into inflation or trade deficits.
The typical twin-deficit countries (India, Indonesia and Philippines) have seen a notable (but transitory)
improvement in trade balances this year (i.e. imports have weakened more sharply than exports),
while most other economies maintain decent surpluses. Rising foreign reserves strengthen currency
defences too.
In the medium-term, we would look for EM Asian central banks to establish exit strategies from these
unconventional measures to preserve central bank autonomy, inflation-targeting, and long-run macro
stability.
Figure 3: Monetary base/reserve money growth
50 % yoy
40
2019 average H1 2020 Latest
30
20
10
0
-10
-20
Source: HSBC Global Asset Management, Bloomberg, CEIC, September 2020.
Figure 4: FX reserves
200 Jan-13=100
180 HK India Indonesia
Korea Malaysia Philippines
Singapore Taiwan Thailand
160 China
140
120
100
80
60
2013 2014 2015 2016 2017 2018 2019 2020
Source: HSBC Global Asset Management, Bloomberg, CEIC, September 2020.
13Time for the great rebalancing
Pierre Dongo-Soria
Strategist
The role of bonds in a Historically, government bonds have played a number of important roles in our portfolios: (i) they have
provided a different factor exposure to equities (i.e. a different economic source of returns), (ii) they
“lower for even have offered good and reliable income, and (iii) they have helped with portfolio liquidity. However,
longer” yield today’s low yield environment is challenging all of these portfolio roles.
environment Prospective bond returns are poor and, with most bond yields close to zero (or even negative), there is
little income for investors to enjoy. That means that the main attraction of government bonds today is
their hedging property.
Since 2000, global government bonds have delivered positive returns and negative correlation (see
figures 1 and 2). Other asset classes and strategies may have better protected investment portfolios
from equity losses, but long-run returns have been low or even negative. Conversely, there are many
asset classes and strategies that have produced higher returns but haven’t performed well in bad
times.
Figure 1: 5y annualised returns
14.0%
Global equities Global government bonds
12.0%
10.0%
8.0%
6.0%
4.0%
2.0%
0.0%
1996-2000 2001-2005 2006-2010 2011-2015 2016-Latest
Source: HSBC Global Asset Management, Bloomberg, September 2020.
Past performance is not a guarantee of future performance.
Figure 2: 5y rolling monthly bond/equity correlation
0.5
0.4
0.3
0.2
0.1
0
-0.1
-0.2
-0.3
-0.4
-0.5
1996 2001 2006 2011 2016
Source: HSBC Global Asset Management, Bloomberg, September 2020.
Past performance is not a guarantee of future performance.
14The key question today is: can government bonds still provide the same degree of downside protection
within an institutional asset allocation?
We think there are good reasons to believe that the best days of bonds as an equity hedge are behind
us. They are traditionally thought of as the safety asset class – a mitigator of risk. But, perversely, they
may now have become a source of risk for investors.
First, current levels of bond yields can limit the ability of bonds to effectively reduce portfolio
drawdowns. The bond price return needed to offset equity losses would require bond yields to move
deeply negative (see figure 3). Such a move might not be possible in the current policy regime and
central banks worry that deeply negative rates will “reverse” the benefits of lower borrowing costs by
decreasing banks’ net interest margins11. Policy-makers remain sensitive to inverted yield curves. And
the experience in Japan and Europe reminds us that negative rates is not a silver bullet for reflation
(and often has to go hand-in-hand with other measures such as tiered interest rates).
This situation can limit the potential upside from bonds. Evidence from the covid episode suggests this
is already happening. Figure 4 shows that negative rate bond markets struggled to rally in the crisis –
JGBs, Bunds and Swiss bonds actually lost money in March.
Figure 3: Yields required to offset equity losses
3.0
2.0 10% equity decline 20% equity decline Current yield
1.0
0.0
-1.0
-2.0
-3.0
10y USTs 10y Bunds 10y Gilts 10y JGBs
Source: HSBC Global Asset Management, Bloomberg, September 2020
Past performance is not a guarantee of future performance
Figure 4: Bond performance during Covid-19 sell-off (Feb-March)
Switzeland
7-10 year bond return
Germany
Japan Starting Short Rate
Sweden
Australia
UK
New Zealand
Norway
Canada
US
-4.0% -2.0% 0.0% 2.0% 4.0% 6.0% 8.0%
Source: HSBC Global Asset Management, Bloomberg, September 2020.
Past performance is not a guarantee of future performance.
Second, recent changes in the policy climate also undermine this hedging property of bonds. More and
more, we are living in a “post-interest rate world”. Macro-economic stabilisation policy is moving away
from an age of “monetary dominance”, with its focus on inflation-targeting central banks, rates and QE,
toward more targeted policy measures in the covid crisis, and a greater use of fiscal policy (“fiscal
dominance”). That means that the ability of bonds to rally in future recessions is more limited, because
the mixture of policy stimulus will change.
11
“The Reversal Interest Rate” Brunnermeier and Koby, 2018
15Looking for a better We think this calls for a “great rebalancing” of portfolios out of core bonds.
diversifier Within traditional asset classes, inflation-linkers and some commodities (like gold) can help to build
portfolio resilience. Similarly, the market price of inflation-linked bonds seems to offer investors a
reasonable entry point today. While real yields are already negative, we think asset classes like TIPS
can outperform nominal bonds over the medium term. Meanwhile, gold can benefit from currency
devaluation, inflation, or safe-haven flows. Nonetheless, its lack of a valuation anchor means price
swings will be mostly based on psychology rather than fundamentals12.
Alternative strategies are another obvious option. They have progressively been taking up a larger
proportion of institutional strategic allocations. As shown by the 2020 European Asset Allocation
survey by Mercer, the overall allocation to alternatives for Defined Benefit plans is now around 18%
on average – but varies significantly from one country to another.
Figure 5: Broad strategic asset allocation by country (%)
Germany
Denmark
UK
Italy
Ireland
Spain
France
Switzerland
Portugal
Belgium
Norway
Netherlands
Average
0% 10% 20% 30% 40% 50% 60% 70% 80% 90% 100%
Alternatives Equity Bonds Property Cash
Source: Mercer LLC European Asset Allocation Survey, 2020.
At a time when bonds are becoming riskier through higher duration, we expect this trend to
accelerate, with liquid alternative asset classes and strategies becoming a key component of
institutional asset allocation. Although returns of strategies that offer low beta to equities, low
duration, and moderate volatility have been low in recent years, poor prospective returns on
government bonds favour the increase of the allocation to liquid alternatives.
Illiquid alternatives should also play a greater role in investment portfolios. They can be thought of as
“return enhancers”, since they can increase capital gains and income. Current macro challenges and
the low return environment means that long-term investors have a good entry point into private equity
and venture capital, especially to funds exposed to Asia growth and technologic dynamism. Incoming
vintage years can produce outsized returns relative to liquid equity markets. Meanwhile, investors
willing to exchange portfolio liquidity for income can benefit from investments in securitised debt and
infrastructure.
Understanding the The asset allocation decision is a relative one. Adding exposure to one asset class means reducing
exposure to another.
opportunity set
The challenge therefore, is to find a way to compare asset classes against each other in a flurry of very
different valuation metrics. There is value in developing a framework enabling investors to assess
asset-class attractiveness across the opportunity set, and in the economic context. We build a
scenario for policy interest rates across major advanced and emerging economies, which we combine
with our assumptions for asset class fundamentals to deduce a risk premium for each asset class
based on market pricing. This framework allows us to systematically assess the relative attractiveness
of assets across the investable universe, as they evolve through market cycles.
Risk premia are then updated on an ongoing basis to account for their variations over the course of
market cycles. They can also be measured against underlying asset-class risks, as determined by
market cycles, structural changes and policy regimes. This creates opportunities to identify anomalous
valuations, and thus to be contrarian where risks are over- or under-rewarded.
Adding alternatives strategies comes with a few additional challenges. For example, traditional risk
metrics (volatility, correlation) are hard to measure since historical returns for some alternatives are
smoothed. In addition, the lack of daily market pricing, cash flow generation, and the idiosyncratic
nature of these asset classes can make it difficult to measure prospective returns.
12
“The Golden Dilemma” Erb, Campbell (2013)
16Nevertheless, our long-term (10-year) expected returns framework now tracks over 300 asset classes
and allows us to maintain a “pecking order” of risk premia across the main asset classes (see figure 6).
This help us see where current opportunities lie, and measure the benefit of alternative asset classes
and strategies versus other more traditional investments.
Currently, we see an upward-sloping capital market line – the market rewards us for taking risk.
Although the line has flattened since March as risk markets rallied, a number of alternative asset
classes seem to offer attractive risk/returns perspectives, especially relative to global bonds.
Figure 6: Pecking order chart
Source: HSBC Global Asset Management and Bloomberg, September 2020. Global Fixed Income assets are shown
hedged to USD. Local EM debt, Equity and Alternatives assets are shown unhedged. Forecasts are indicative only
and not guaranteed in any way. The commentary and analysis presented in this document reflect the opinion of
HSBC Global Asset Management on the markets, according to the information available to date. They do not
constitute any kind of commitment from HSBC Global Asset Management. Consequently, HSBC Global Asset
Management will not be held responsible for any investment or disinvestment decision taken on the basis of the
commentary and/or analysis in this document.
17Important information
For Professional Clients and intermediaries within countries and territories set out below; and for Institutional
Investors and Financial Advisors in Canada and the US. This document should not be distributed to or relied upon
by Retail clients/investors.
The value of investments and the income from them can go down as well as up and investors may not get back the
amount originally invested. The capital invested in the fund can increase or decrease and is not guaranteed. The
performance figures contained in this document relate to past performance, which should not be seen as an
indication of future returns. Future returns will depend, inter alia, on market conditions, fund manager’s skill, fund
risk level and fees. Where overseas investments are held the rate of currency exchange may cause the value of such
investments to go down as well as up. Investments in emerging markets are by their nature higher risk and
potentially more volatile than those inherent in some established markets. Economies in Emerging Markets
generally are heavily dependent upon international trade and, accordingly, have been and may continue to be
affected adversely by trade barriers, exchange controls, managed adjustments in relative currency values and other
protectionist measures imposed or negotiated by the countries and territories with which they trade. These
economies also have been and may continue to be affected adversely by economic conditions in the countries and
territories in which they trade. Mutual fund investments are subject to market risks, read all scheme related
documents carefully.
The contents of this document may not be reproduced or further distributed to any person or entity, whether in whole or in
part, for any purpose. All non-authorised reproduction or use of this document will be the responsibility of the user and may
lead to legal proceedings. The material contained in this document is for general information purposes only and does not
constitute advice or a recommendation to buy or sell investments. Some of the statements contained in this document may
be considered forward looking statements which provide current expectations or forecasts of future events. Such forward
looking statements are not guarantees of future performance or events and involve risks and uncertainties. Actual results may
differ materially from those described in such forward-looking statements as a result of various factors. We do not undertake
any obligation to update the forward-looking statements contained herein, or to update the reasons why actual results could
differ from those projected in the forward-looking statements. This document has no contractual value and is not by any
means intended as a solicitation, nor a recommendation for the purchase or sale of any financial instrument in any jurisdiction
in which such an offer is not lawful. The views and opinions expressed herein are those of HSBC Global Asset Management
at the time of preparation, and are subject to change at any time. These views may not necessarily indicate current portfolios'
composition. Individual portfolios managed by HSBC Global Asset Management primarily reflect individual clients' objectives,
risk preferences, time horizon, and market liquidity. Foreign and emerging markets. Investments in foreign markets involve
risks such as currency rate fluctuations, potential differences in accounting and taxation policies, as well as possible political,
economic, and market risks. These risks are heightened for investments in emerging markets which are also subject to
greater illiquidity and volatility than developed foreign markets. This commentary is for information purposes only. It is a
marketing communication and does not constitute investment advice or a recommendation to any reader of this content to
buy or sell investments nor should it be regarded as investment research. It has not been prepared in accordance with legal
requirements designed to promote the independence of investment research and is not subject to any prohibition on dealing
ahead of its dissemination.
All data from HSBC Global Asset Management unless otherwise specified. Any third party information has been obtained
from sources we believe to be reliable, but which we have not independently verified.
HSBC Global Asset Management is a group of companies in many countries and territories throughout the world that are
engaged in investment advisory and fund management activities, which are ultimately owned by HSBC Holdings Plc. (HSBC
Group). HSBC Global Asset Management is the brand name for the asset management business of HSBC Group. The above
communication is distributed by the following entities:
In Argentina by HSBC Global Asset Management Argentina S.A., Sociedad Gerente de Fondos Comunes de Inversión,
Agente de administración de productos de inversión colectiva de FCI N°1;
In Australia, this document is issued by HSBC Bank Australia Limited ABN 48 006 434 162, AFSL 232595, for HSBC
Global Asset Management (Hong Kong) Limited ARBN 132 834 149 and HSBC Global Asset Management (UK) Limited
ARBN 633 929 718. This document is for institutional investors only, and is not available for distribution to retail clients
(as defined under the Corporations Act). HSBC Global Asset Management (Hong Kong) Limited and HSBC Global Asset
Management (UK) Limited are exempt from the requirement to hold an Australian financial services license under the
Corporations Act in respect of the financial services they provide. HSBC Global Asset Management (Hong Kong) Limited
is regulated by the Securities and Futures Commission of Hong Kong under the Hong Kong laws, which differ from
Australian laws. HSBC Global Asset Management (UK) Limited is regulated by the Financial Conduct Authority of the
United Kingdom and, for the avoidance of doubt, includes the Financial Services Authority of the United Kingdom as it
was previously known before 1 April 2013, under the laws of the United Kingdom, which differ from Australian laws;
in Bermuda by HSBC Global Asset Management (Bermuda) Limited, of 37 Front Street, Hamilton, Bermuda which is
licensed to conduct investment business by the Bermuda Monetary Authority;
in Canada by HSBC Global Asset Management (Canada) Limited which provides its services as a dealer in all provinces
of Canada except Prince Edward Island and also provides services in Northwest Territories. HSBC Global Asset
Management (Canada) Limited provides its services as an advisor in all provinces of Canada except Prince Edward
Island;
18 in Chile: Operations by HSBC's headquarters or other offices of this bank located abroad are not subject to Chilean
inspections or regulations and are not covered by warranty of the Chilean state. Further information may be obtained
about the state guarantee to deposits at your bank or on www.sbif.cl;
in Colombia: HSBC Bank USA NA has an authorized representative by the Superintendencia Financiera de Colombia
(SFC) whereby its activities conform to the General Legal Financial System. SFC has not reviewed the information
provided to the investor. This document is for the exclusive use of institutional investors in Colombia and is not for public
distribution;
in Finland, Norway, Denmark and Sweden by HSBC Global Asset Management (France), a Portfolio Management
Company authorised by the French regulatory authority AMF (no. GP99026) and through the Stockholm branch of HSBC
Global Asset Management (France), regulated by the Swedish Financial Supervisory Authority (Finansinspektionen);
in France, Belgium, Netherlands, Luxembourg, Portugal, Greece by HSBC Global Asset Management (France), a
Portfolio Management Company authorised by the French regulatory authority AMF (no. GP99026);
in Germany by HSBC Global Asset Management (Deutschland) GmbH which is regulated by BaFin (German clients)
respective by the Austrian Financial Market Supervision FMA (Austrian clients);
in Hong Kong by HSBC Global Asset Management (Hong Kong) Limited, which is regulated by the Securities and
Futures Commission;
in India by HSBC Asset Management (India) Pvt Ltd. which is regulated by the Securities and Exchange Board of India;
In Ireland, the materials are distributed by HSBC France, Dublin Branch. HSBC France, Dublin Branch is registered in
Ireland by HSBC France, which is directly supervised by the European Central Bank (ECB), under the Single
Supervisory Mechanism (SSM), and regulated by the French Prudential Supervisory and Resolution Authority (Autorité
de contrôle prudentiel et de résolution – ACPR)) and the French Markets Authority (The Autorité des marchés financiers
(AMF)). HSBC France, Dublin Branch is regulated by the Central Bank of Ireland for conduct of business rules;
In Israel, HSBC Bank plc (Israel Branch) is regulated by the Bank of Israel. This document is only directed in Israel to
qualified investors (under the Investment advice, Investment marketing and Investment portfolio management law-1995)
of the Israeli Branch of HBEU for their own use only and is not intended for distribution;
in Italy and Spain by HSBC Global Asset Management (France), a Portfolio Management Company authorised by the
French regulatory authority AMF (no. GP99026) and through the Italian and Spanish branches of HSBC Global Asset
Management (France), regulated respectively by Banca d’Italia and Commissione Nazionale per le Società e la Borsa
(Consob) in Italy, and the Comisión Nacional del Mercado de Valores (CNMV) in Spain;
in Mexico by HSBC Global Asset Management (Mexico), SA de CV, Sociedad Operadora de Fondos de Inversión,
Grupo Financiero HSBC which is regulated by Comisión Nacional Bancaria y de Valores;
in the United Arab Emirates, Qatar, Bahrain & Kuwait by HSBC Bank Middle East Limited which are regulated by
relevant local Central Banks for the purpose of this promotion and lead regulated by the Dubai Financial Services
Authority.
in Oman by HSBC Bank Oman S.A.O.G regulated by Central Bank of Oman and Capital Market Authority of Oman;
in Peru: HSBC Bank USA NA has an authorized representative by the Superintendencia de Banca y Seguros in Perú
whereby its activities conform to the General Legal Financial System - Law No. 26702. Funds have not been registered
before the Superintendencia del Mercado de Valores (SMV) and are being placed by means of a private offer. SMV has
not reviewed the information provided to the investor. This document is for the exclusive use of institutional investors in
Perú and is not for public distribution;
in Singapore by HSBC Global Asset Management (Singapore) Limited, which is regulated by the Monetary Authority of
Singapore;
in Switzerland by HSBC Global Asset Management (Switzerland) AG whose activities are regulated in Switzerland and
which activities are, where applicable, duly authorised by the Swiss Financial Market Supervisory Authority. Intended
exclusively towards qualified investors in the meaning of Art. 10 para 3, 3bis and 3ter of the Federal Collective
Investment Schemes Act (CISA);
in Taiwan by HSBC Global Asset Management (Taiwan) Limited which is regulated by the Financial Supervisory
Commission R.O.C. (Taiwan);
in the UK by HSBC Global Asset Management (UK) Limited, which is authorised and regulated by the Financial Conduct
Authority;
and in the US by HSBC Global Asset Management (USA) Inc. which is an investment adviser registered with the US
Securities and Exchange Commission.
NOT FDIC INSURED NO BANK GUARANTEE MAY LOSE VALUE
Copyright © HSBC Global Asset Management Limited 2020. All rights reserved. No part of this publication may be
reproduced, stored in a retrieval system, or transmitted, on any form or by any means, electronic, mechanical, photocopying,
recording, or otherwise, without the prior written permission of HSBC Global Asset Management Limited. I 1132. Exp.
31.03.2021
19You can also read