Fair Warning GLOBAL WARMING AND THE LONE STAR STATE - AUTHORS - Environmental Defense Fund
←
→
Page content transcription
If your browser does not render page correctly, please read the page content below
Fair Warning

GLOBAL WARMING AND THE LONE STAR STATE
                  AUTHORS
             Ramon Alvarez, Ph.D.
                 Mary Sanger
                 Colin Rowan
              Lisa Moore, Ph.D.

                   MAY 2006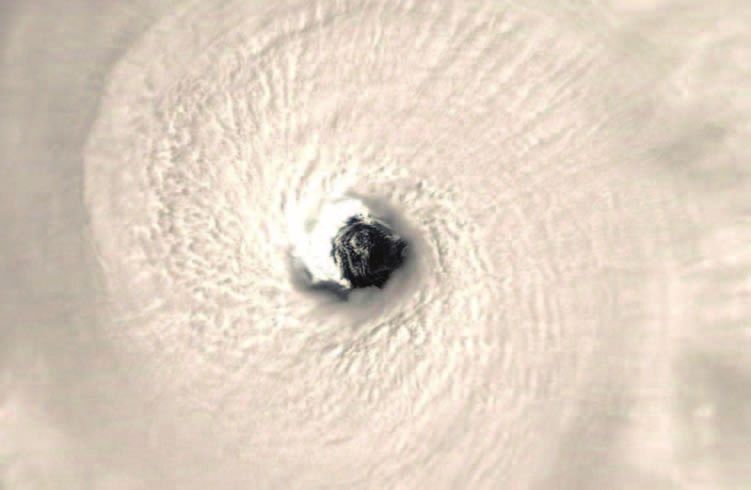
Authors
Ramon Alvarez, Ph.D., Senior Scientist, ralvarez@environmentaldefense.org
Mary Sanger, Outreach and Research Specialist, msanger@environmentaldefense.org
Colin Rowan, Regional Director of Communication, crowan@environmentaldefense.org
Lisa Moore, Ph.D., Lokey Fellow, lmoore@environmentaldefense.org

For more information, contact the Texas office of Environmental Defense at
512-478-5161.

Environmental Defense acknowledges the contribution that the Houston Advanced
Research Center (HARC) has played in increasing our understanding of the impacts
of global warming on Texas. In 1991, HARC assembled an interdisciplinary task
force to provide the best available research on climate change and its impacts on
Texas. The result of the task force’s work was The Impact of Global Warming on Texas,
published in 1995 by the University of Texas Press.

Photos: All hurricane images from NOAA. Other photos from iStockphoto unless
otherwise noted.

Our mission
Environmental Defense is dedicated to protecting the environmental rights of all
people, including the right to clean air, clean water, healthy food and flourishing
ecosystems. Guided by science, we work to create practical solutions that win lasting
political, economic and social support because they are nonpartisan, cost-effective
and fair.

©2006 Environmental Defense

The complete report is available online at www.environmentaldefense.org.
Consumer information about combating global warming is available at
www.fightglobalwarming.com
Contents
           Executive summary                                            2

           Facing the threat: What is global warming?                   4

           The big picture: How will global warming affect Texas?       5

           Getting down to details: Global changes, Texas challenges    6

           Texas at a crossroads                                       15

           Charting a new course for Texas                             17

           Citizen action for reducing greenhouse gases                18

           Planning for opportunities and consequences                 19

           Endnotes                                                    20

                                                 1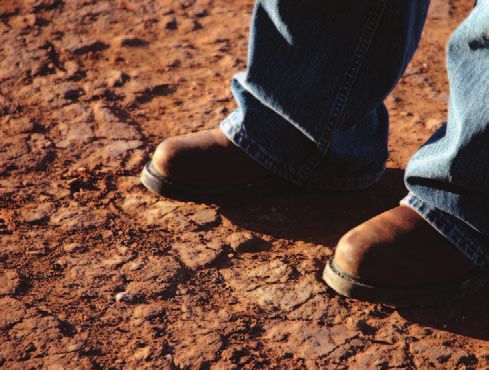
Executive summary
“Anthropogenic climate change is now likely to continue for many centuries. We are venturing into the
unknown with climate, and its associated impacts could be quite disruptive.”1
Thomas Karl, director, National Climatic Data Center, and Kevin Trenberth, National Center for Atmospheric Research

                                  Last year tied a record for the warmest year in history.2 In each of the first four
                                  months of 2006, at least one day reached a historic high temperature in Texas.3 It
                                  hit 100 degrees in Austin in April for the first time ever.4
                                     With 95-degree Easter egg hunts and 100-degree days before May, we’re getting
                                  a pretty good taste of what global warming will mean for Texas. But global warming
                                  means more than heat waves. If the temperature rises another 3 to 7 degrees Fahren-
                                  heit by 2050 as scientists predict, a variety of changes will be triggered around the
                                  world. Some places will be hotter, some cooler, some wetter and some drier. For
                                  example, if the Gulf Stream shifts or stops, which scientists say is a possibility,
                                  England and northern Europe will be substantially colder. In many cases, local
                                  weather and temperature extremes will be . . . well, more extreme.

                                  What global warming could mean for Texas
                                  The Texas impacts of global warming will vary by region. Because of Texas’ size, terrain,
                                  location and diversity, the list of those impacts is startling: more heat waves, worse air
                                  quality, increased risk of disease, droughts, wildfires and coastal erosion. If the sea level
                                  rises by three feet—as scientists
                                  predict it will—South Padre Island
                                  will be lost. Much of Galveston
                                  Island would be uninhabitable.5
                                     Global warming already threatens
                                  marine ecosystems, jeopardizing
                                  Texas’ coastal tourism and commer-
                                  cial and recreational fishing indus-
                                  tries. It could undermine Texas’
                                  agricultural economy and affect our
                                  wildlife’s migratory patterns. In fact,
                                  unless we act now to reduce green-
                                  house gas emissions, it is hard to
                                  imagine any facet of life in Texas that
                                  will not be affected by global warming.
                                     More startling than these impacts is
                                  the fact that so few of our elected and
                                  appointed officials are planning for        Despite the impact that global warming will have on
                                                                              Texas, the State Legislature has taken no action to
                                  them or examining ways to prevent           reduce Texas’ emissions or plan for the consequences.
                                  them.

                                  Other states are out in front
                                  Legislators in other states from California to New York—Republicans and Demo-
                                  crats alike—are tackling this problem head on. But not in Texas. While some Texas

                                                                                          2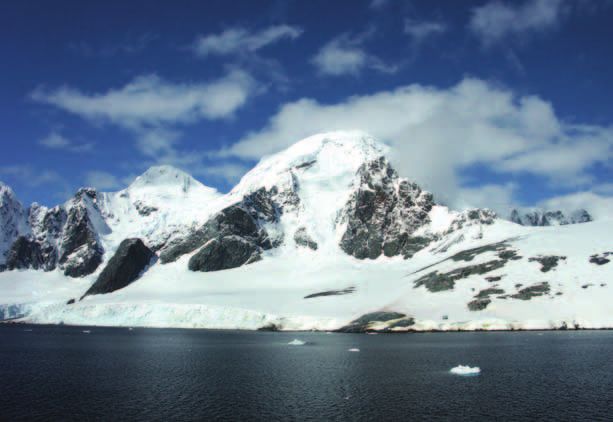
Texas emits more      mayors have joined a national effort to get cities to act, most state legislative leaders
carbon dioxide than   have been conspicuously absent from discussions on global warming. Texas emits
any other state,      more carbon dioxide, the principal manmade greenhouse gas, than any other state,
and there’s no plan   and there’s no plan to stop it, slow it or deal with the consequences.
to stop it, slow it      Fair Warning is not a guaranteed list of date-certain predictions. No one can
                      produce that. Environmental Defense intends it to be a discussion guide about what
or deal with the
                      Texas may face as global warming becomes more visible and pronounced. And true
consequences.
                      to our solution-oriented roots, we offer some recommendations for consumers and
                      public officials that will help Texas prepare for and reduce the impacts of global
                      warming on the Lone Star State.
                         We hope this will jumpstart conversations among families, co-workers, and neigh-
                      bors, but especially among the leaders who have the responsibility to protect Texas
                      and its citizens, economy, property and quality of life. Texas may look a lot different
                      in 100 years. Will we have done all we could to prevent the worst? If not, will we be
                      prepared to deal with the consequences?

                                                                  3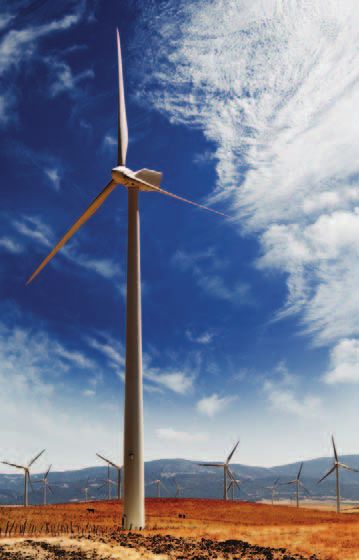
Facing the threat: What is global warming?
                                                       The greenhouse gas “blanket” in the Earth’s atmosphere, which traps the sun’s heat
                                                       and slows its escape back into space, protects the delicate balance necessary to sustain
                                                       life as we know it. However, pollution is making this blanket thicker than at any
                                                       other time in human history. For example, levels of carbon dioxide—the most
                                                       important greenhouse gas—are higher today than they have been in the past 650,000
                                                       years.6 As a result, temperatures are rising rapidly and our planet’s climate is changing.7
                                                           Although the Earth’s climate varies naturally over time, the overwhelming scien-
                                                       tific consensus is that most of the warming over the past 50 years has been caused by
                                                       emissions of human-produced greenhouse gases.8 Once emitted, many greenhouse
                                                       gases stay in the atmosphere for a long time. For example, carbon dioxide emissions
                                                       from the world’s first cars are still contributing to global warming. The pollution we
                                                       emit today will warm the planet for at least another century. That’s why it’s important
                                                       to act decisively now to cut greenhouse gas emissions as much as possible.

                                                                                                                                               380

                                                                                                                                               360

                                                                                                                                               340

                                                                                                                                               320

                                                                                                                                                     CO2 (ppmv)
                                                                                                                                               300

                                                                                                                                               280

                                                                                                                                               260

                                                                                                                                               240
                                 –50
   Temperature Antarctica (°C)

                                                                                                                                               220
                                 –52
                                 –54                                                                                                           200

                                 –56                                                                                                           180
                                 –58
                                 –60
                                 –62
                                 –64
                                  650,000 600,000 550,000 500,000 450,000 400,000 350,000 300,000 250,000 200,000 150,000 100,000 50,000   0
                                                                           Age (years before present)

Atmospheric carbon dioxide concentrations (in parts per million, or ppmv, on the right-hand axis) and average temperature in
Antarctica (in degrees Celsius, °C, on the left-hand axis) over time, from 650,000 years ago (left) to the present (right). The solid blue
line shows carbon dioxide concentrations measured from air bubbles in Antarctic ice cores. The solid red line shows average
temperature in Antarctica, based on isotopic analyses of the ice cores. The upper dashed blue line shows the level of carbon dioxide at
the start of the industrial revolution and the lower dashed blue line shows the lowest carbon dioxide level on record. Gray shaded
areas show periods that were at least as warm as it was 10,000 years ago.9

                                                                                                        4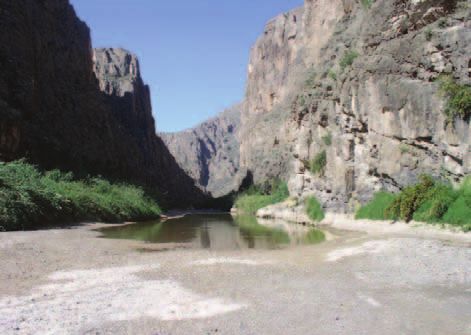
The big picture: How will global warming affect Texas?

              • Temperatures will be warmer and precipitation patterns will change, affecting
                human health, air quality, natural resources and wildlife, the economy and other
                quality of life issues. Heat waves are likely to be longer, hotter and more frequent,
                increasing heat-related deaths and wildfire risks.

              • The sea level will rise, threatening low-lying communities along Texas’ 600-mile
                coast, the many species that rely on coastal and wetland ecosystems, and the multi-
                billion-dollar coastal economies.

              • Hotter weather, more frequent and severe droughts and increased evaporation—
                on top of Texas’ exploding population—will combine to put an unprecedented
                strain on Texas’ already-scarce water supply.10

              • Warmer ocean water will increase the severity of hurricanes in the Gulf of Mexico,
                and an increase in sea level would virtually eliminate the protection offered by
                Texas’ barrier islands and coastal wetlands.

                                                          5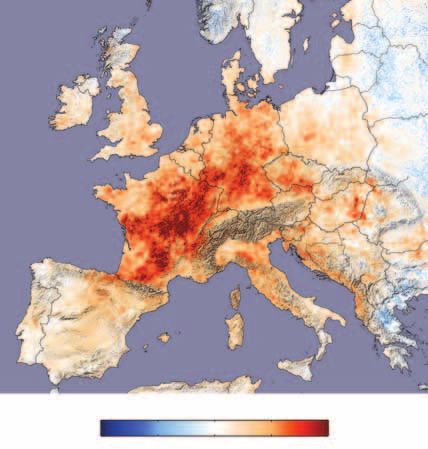
Getting down to details: Global changes, Texas challenges
              GLOBAL CHANGE: Earth’s atmosphere is warming
              Temperature records show that, although a few areas of the world have cooled, most
              have warmed—some a great deal.11 On average, the world is about one degree Fahrenheit
              warmer today than it was 100 years ago.12 And the warming is accelerating.
                 Greenhouse gas pollution has already doubled the risk of extreme heat waves, like
              the one that killed tens of thousands of people in Europe in the summer of 2003.13

                                            .6

                                                                 Annual mean
                                                                  Annual mean
                                                                 5-year mean
                                            .4                    5-year mean
                Temperature anomaly (ºC)

                                            .2

                                            0

                                           –.2

                                           –.4

                                                                                                                                              NASA GISS
                                                 1880          1900         1920           1940     1960         1980         2000

              Global air temperature relative to the 1951–1980 average. Black symbols and dotted lines show annual
              averages; the thick red curve shows the five-year average.14 A change of 1°C is the same as a change
              of 1.8°F.

                                                                                                  The difference in land surface tempera-
                                                                                                  ture (in °C) between 2003 and the aver-
                                                                                                  age of 2000, 2001, 2002 and 2004, for the
                                                                                                  date range July 20–August 20. A change
                                                                                                  of 1°C is the same as a change of 1.8°F,
                                                                                                  so dark red areas were about 10°F
                                                                                                  warmer in 2003.15

                                                 Land surface temperature difference [K]

                                                  –10     –5          0     5      10

                                                                                           6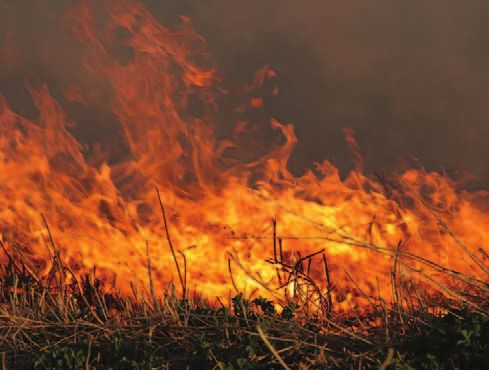
TEXAS CHALLENGE: A hotter Texas and changes in timing and amount
                            of precipitation will threaten human health, air quality, natural
                            resources and wildlife, the economy and other quality of life issues

                            HEAT WAVES

                            • Many major Texas metropolitan areas violate public health standards for ozone—
                              a ground-level pollutant
                              that is exacerbated by hot
                              weather. A hotter Texas
                              will result in more
                              frequent “ozone action”
                              days,16 more asthma
                              attacks, more hospitali-
                              zations and higher public
                              health costs.

                            • Despite Texas’ familiarity
                              with hot summers, longer,
                              hotter and more frequent
                              heat waves will pose new challenges. They will not just be uncomfortable. Their
                              frequency and severity will strain energy resources, public health facilities, business
                              productivity and tourism.

                            • Energy demand (and costs to Texans) will increase as temperatures rise and
                              summer lasts longer. Ironically, the electric power industry is among the worst
                              greenhouse gas polluters in Texas. So unless our utilities reduce their greenhouse
                              gas emissions, we’ll actually be making the problem worse as we use more power
                              to cool our homes and businesses.

                            PRECIPITATION

                            • Global warming will exacerbate normal drought cycles, causing longer and more
                              frequent droughts in
                              Texas.17 Longer periods
Top: Texans already face      without precipitation will
frequent “ozone action”
days that can trigger         decrease runoff to our
asthma attacks and other      rivers and recharge to our
respiratory illnesses.
Warmer weather will
                              aquifers, resulting in a
exacerbate the problem.       reduction in the amount
                                                                                                                        NATIONAL PARK SERVICE

Bottom: Texas is no           of water available to
stranger to droughts.
But global warming will       businesses, cities and
make them more fre-           agriculture.18
quent and severe. The
stretch of the Rio Grande
that runs through Big       • The reduction of fresh
Bend National Park ran        water inflows will also
dry in 2002 for the first     affect reservoir storage, an impact that is not easily reversed. The loss of aquifer
time since the 1950s—a
harbinger of things to
                              recharge will further increase pressures on our already overtaxed groundwater
come.                         resources and drive up groundwater costs.19

                                                                        7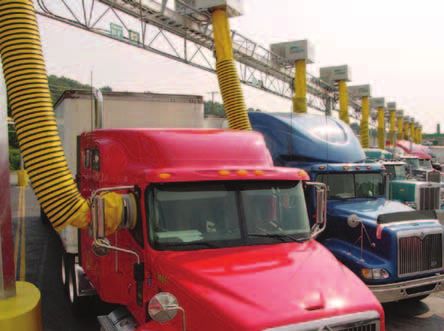
“Rising temperatures and associated emission increases will contribute to worsening air quality and
respiratory illnesses, including aggravated asthma, increased hospitalizations for respiratory and
cardiovascular disease, reduced lung capacity and premature deaths.”
                                                                                    —American Lung Association of California

                           • Less predictable precipitation is only one of Texas’ water worries. Warmer tempera-
                             tures will increase the amount of surface water that evaporates. One model predicts
                             that a temperature increase of approximately 4 degrees Fahrenheit and a 5% reduc-
                             tion in precipitation would reduce the amount of river flow to the coast by 35% in
                             normal conditions and up to 85% during droughts.20

                           • Global warming’s impact on Texas’ $14 billion agriculture industry will vary by
                             crop and location. For example, the EPA projected that global warming could
                             reduce wheat yields in Texas by 43-68%.21 Corn yields also would be reduced.
                             Other crops, however, such as cotton, may actually benefit from global warming.

Mosquitoes are already
                           • Warmer, drier seasons in already dry regions will result in a significant reduction of
familiar pests in Texas.     soil moisture and an increased demand for groundwater for irrigation.22 This could
Scientists predict that      have its greatest impact on the agriculture economy in western and southern Texas
warmer weather will
                             where water is already a precious resource. Texas agriculture can and will have to
make mosquito-borne
diseases more prevalent.     adapt by changing to more suitable crops.

                           • With more heat waves and droughts, wildfires, like the ones that threatened central
                             and north Texas in late 2005 and early 2006, will become more common concerns
                             for a larger portion of the state.

                           DISEASE

                           • A warmer climate will allow mosquito-borne disease to migrate north from the
                             tropics. Scientists predict that malaria will spread, and Texas has already seen cases
                             of West Nile virus and dengue fever.

                           SHIFTING HABITAT

                           • Researchers predict that species—from birds and insects to trees and grasses—
                             may try to move north to find more preferable climates.23 In some cases, suburban
                             development and the resulting fragmentation of habitat will make relocation diffi-
                             cult if not impossible. Successful migration may cause problems, as well, if pollina-
                             tion patterns change and the absence of beneficial insects alters the balance of
                             nature in different regions.

                           • In addition to literally changing the Texas landscape, this northward migration
                             would significantly alter the annual migration of bird species that cross Texas
                             in the spring and fall and the resulting multimillion-dollar bird watching and
                             hunting industries.

                           • Species that rely on isolated, seasonal or temporary aquatic habitats will be particu-
                             larly threatened as these habitats dry up and movement to better areas is restricted.
                             Temporary aquatic areas could become the most endangered habitat in Texas.

                                                                      8
GLOBAL CHANGE: Earth’s ice is melting and sea level is rising
MELTING ICE
Global warming is melting ice around the world. Arctic sea ice is disappearing,
endangering traditional hunting societies.24 Permafrost is no longer permanent.25 In
Alaska, thawing permafrost and slumping ground cause $35 million per year in
damage to houses, pipelines, roads, airports and military installations.26 Around the
world, shrinking glaciers are
creating water shortages and
threatening tourism in scenic
parks.27 For example,
Montana’s Glacier National
Park could be glacier-free in
25 years.28
COURTESY OF CARL H. KEY
RISING SEA LEVELS
As warming waters expand
and melting ice sheets and
glaciers pour into the oceans,
sea levels rise.30 Historical
Grinnell Glacier in Glacier National Park, in 1938 (left) and 1981
tide records and modern (right). The arrows in the right-hand photo show the glacier’s
satellite altimetry data show perimeter in 1850. Between 1850 and 1993, the glacier shrank
29
63% in area.
that the sea level has risen four
to eight inches over the past century (10 times the average rate over the last 3,000
years).31 Depending on future rates of greenhouse gas pollution, scientists project that
the sea level could rise another three feet by the end of this century.32 Even larger
changes are not out of the question. The warmer it gets, the more likely that vast ice
NATIONAL PARK SERVICE
Left: Open water and bare soil are not as bright and reflective as ice and snow. When ice melts, the darker surfaces beneath absorb
more solar energy. This extra warming melts even more ice, exposing even more dark surfaces, and warming accelerates. Right:
Permafrost is permanently frozen soil found at high latitudes, such as Alaska’s Denali National Park. These soils store vast amounts
of carbon. As long as the soil remains frozen, the carbon is locked in place. Scientists fear that as these areas thaw, they will release
large amounts of carbon dioxide and methane.
9sheets will disintegrate, leading to potentially catastrophic sea level rise. For example,
if the Greenland ice sheet melted completely, the sea level would rise 23 feet,
flooding coastal areas around the world.33
VICIOUS CYCLES
Global warming can set off vicious cycles that cause the Earth to warm even faster.
Melting ice is one example that is already occurring.34 Scientists believe that a second
process, thawing permafrost, could also accelerate warming by releasing tons of
methane—a potent greenhouse gas—into the atmosphere.35
Greenhouse gas levels are higher today than they have been at any time in the
history of civilization.36 As these levels continue to increase, global warming will get
worse, and sudden, irreversible changes (like species extinctions and the collapse of
ice sheets) will be even more likely to occur. We must act now to cut greenhouse gas
pollution, to minimize the amount of warming—and the level of risk—that we and
future generations will face.
10TEXAS CHALLENGE: Texas has more than 600 miles of low-lying
coast that will be severely impacted by even the lowest estimates
of increased sea level
• Without strong action to curb greenhouse gas emissions, particularly carbon dioxide,
even the most conservative estimates of sea level rise spell trouble for Texas (see maps).
Unlike some coastlines that are marked by tall cliffs and other abrupt changes in
altitude, the Texas coast gradually slopes into the Gulf of Mexico, and much of our
coast and most of our barrier islands are less than five feet above sea level. If the sea
level rises by three feet,
South Padre Island will be Beaumont
lost. Much of Galveston Houston Port Arthur
Island would be unin-
Galveston
habitable.
• A three-foot increase in sea
level would threaten in- GULF OF MEXICO
dustrial plants, refineries and Corpus Christi
residential communities near Coastal areas under 1 foot above sea level
the Houston Ship Channel
and other Texas ports.
South Padre Island
• A one-foot increase in sea Brownsville
level would cover approxi- Beaumont
mately 402 square miles of Houston Port Arthur
Texas coast. A three-foot rise
in sea level would submerge Galveston
nearly 1,000 square miles.
(For context, the City of
Dallas covers 380 square GULF OF MEXICO
miles. Big Bend National Corpus Christi
Park covers 1,100 square Coastal areas under 3 feet above sea level
miles.)
• Many of Texas’ 1.6 million South Padre Island
Brownsville
coastal county residents would
Most climate models be displaced by a rising sea Beaumont
predict that without level. Coastal schools, busi- Houston
strong action to curb Port Arthur
nesses, hospitals and roads
greenhouse gas
emissions, the sea level would be inundated. Galveston
will rise one to three feet
over the next 100 years.
Some predict an increase
• The Texas coastal ecosystem
as high as 10 feet.37 The
generates more than
GULF OF MEXICO
current EPA estimates an $12 billion in annual eco- Corpus Christi
increase of two feet.38 The nomic activity—ranging
shaded portions of the Coastal areas under 10 feet above sea level
maps indicate the land from tourism to recreational
along the Texas coast and commercial fishing. All
that sits lower than one,
three and ten feet above
of this will be threatened South Padre Island
sea level.39 by a higher sea level. For Brownsville
11example, Texas bays and estuaries play a critical role in the state’s $2 billion
commercial and recreational fishing and seafood industry. Rising seas and altered
freshwater flows may change the salinity of these sensitive areas and alter the
nurseries of Texas’ most valuable fisheries, including shrimp.
• A rising sea may harm migrating birds. Some bird species that cross the Gulf of
Mexico barely make it to coastal woodlands where they stop, rest and refuel. A
retreating coastline would add distance and risk to their migration.
• Texas’ barrier islands and coastal wetlands serve as Texas’ first line of defense from
hurricane storm surges. A three-foot increase in sea level will virtually nullify any
protection they would provide against a strong hurricane.
12GLOBAL CHANGE: Oceans are warming
Sea surface temperature is a key factor in hurricane intensity: the warmer the water,
the stronger the storm. New scientific studies have confirmed that hurricanes are
now more intense worldwide, in part because of warmer sea surface temperatures.41
Excessively warm waters can kill coral reefs through a process called “bleaching.”
Between 1997–1998 (which tied for the hottest 12-month period on record), warm
waters damaged 16% of all coral reefs in the world.42
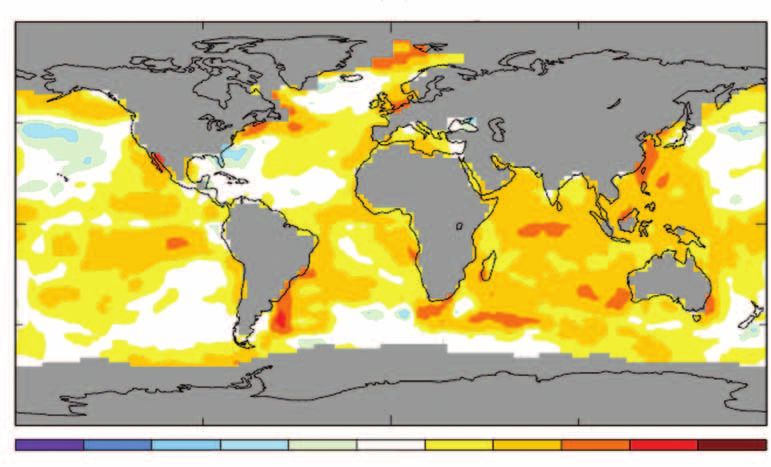
COURTESY OF NASA
–8 –4 –2 –1 –.5 –.2 .2 .5 1 2 4 8
Change in annual average sea surface temperature between 1955 and 2005. The color bar below the
map shows the temperature scale in Celsius. (A change of 1°C is the same as a change of 1.8°F.)
Yellow, orange and red show warming; green and blue show cooling. On average, the top 300 meters
(about 900 feet) of the world’s oceans have warmed almost 0.6°F since the mid-1950s.40
13TEXAS CHALLENGE: A warmer Gulf of Mexico will threaten the
economy, health and safety of the Texas coast
• During the last 23 years, the water temperature in the majority of Texas bays has
increased by nearly three degrees
Fahrenheit.44 Coupled with increased Category 4 and 5 hurricanes worldwide
salinity, warmer bays could reduce the
100
productivity of Texas’ seafood industry.
• Scientists have linked the severity of
GEORGIA INSTITUTE OF TECHNOLOGY
80
the 2005 hurricane season to global
warming.45 Hurricanes are fueled by
warm water, and a warmer Gulf of 60
Mexico will increase the severity of
hurricanes that enter it. So not only
could Texas lose the protection of the 40
‘70
‘75
‘ 80
‘8 5
‘9 0
‘9 5
‘0 0
barrier islands, it would do so as Gulf
-’74
-’79
-’8
-’8
-’99
- 04
-’94
4
9
hurricanes get more intense.
The number of category 4 or 5 hurricanes per
• Global warming will impose new five-year period since 1970. Worldwide, there are
more than twice as many of these destructive
insurance costs on Texas homeowners storms today than there were 35 years ago.43
and businesses. If hurricane “danger
zones” move further inland, insurance companies will adjust rates to account for the
increasing risk of damage.
“The hurricanes we are seeing are indeed a direct result of climate change and
it’s no longer something we’ll see in the future, it’s happening now.”
Greg Holland, division director, the National Center for Atmospheric Research46
14Texas at a crossroads
There is no Texas hasn’t always been known for its environmental leadership. Among its dubious
statewide plan to environmental honors, Texas ranks number one in:
deal with global
• Amount of toxic emissions from manufacturing facilities
warming.
• Number of clean-water permit violations
• Total releases of pollution into the water
• Hazardous chemicals injected underground
• Emission of recognized carcinogens into the air
Texas also leads all states in annual carbon dioxide emissions. It emits more than
the UK, Canada or Italy. Unfortunately, that’s where Texas’ leadership stops. There is
no statewide plan to deal with global warming. No plan to curb carbon emissions. No
official inventory of risks posed by global warming. No plan to deal with the consequences.
What other states are doing
In other parts of the country, forward-thinking leaders of both parties are stepping up
to tackle their states’ contribution to this global problem. Consider the current global
warming efforts of other states:
• Seven Northeastern states signed a multistate pact to reduce by 10% greenhouse
gas emissions, specifically carbon dioxide, from power plants by 2020 using
market-based solutions.
• California has passed legislation that will cap emissions from automobiles and has
recently introduced a bill that will cap
carbon emissions economy-wide. Nine
Biggest emitters of
other states have now adopted the
greenhouse gases
California car standard.
1. United States
• Oregon’s governor appointed a Task 2. China
3. Russia
Force on Global Warming to develop
4. Japan
a strategy to reduce greenhouse gas
emissions and to plan for the conse-
5. India
6. Germany
#7
quences of climate change. 7. Texas
8. Great Britain
• Washington State has new carbon If Texas were a country, it
dioxide emission standards for fossil- would rank seventh globally in green-
fueled power plants. house gas emissions.
• Montana’s governor has asked his
state’s environmental agency to form an Advisory Committee on Global Warming
to develop strategies for reducing greenhouse gases.
• Governors of New Mexico and Arizona have implemented the Southwest Climate
Change Initiative, committing to collaborate on global warming pollution reductions.
• New Mexico Governor Bill Richardson has directed state agencies to assess the
potential impacts of global warming on New Mexico. New Mexico has set a target
of reducing greenhouse gases by 10% by 2012 and has joined the Chicago Climate
15Exchange, a market for non-profits and local governments to trade credits gener-
ated by cutting emissions.
• New Mexico (which is already facing water shortages), California and Arizona are
among the western states already addressing the impact of global warming on their
water supplies. The governors of New Mexico and California have each asked for
specific reports addressing potential water resource impacts of global warming.
Some states, like North Carolina and California, are approaching this problem
with economic opportunity in mind. The North Carolina Climate Stewardship Task
Force completed a study that predicted that preparing for global warming now—
developing a plan that helps the state benefit from a new energy economy, estab-
lishing a carbon-reduction goal, increasing its energy independence by developing
alternative energy sources, and pursuing incentives to promote energy efficiency and
conservation—could benefit the North Carolina economy in the future. In California,
leaders are pursuing a new law that would
unleash a wave of innovation by provid-
ing incentives to businesses to develop
cleaner power sources.
There is no reason for Texas to stand
idly by while the rest of the country
rolls up its sleeves and addresses global
This is more than warming. As the nation’s leading carbon
a moral issue. It’s emitter, Texas has a moral responsibility
to its citizens and its neighbors to show
also a money issue.
leadership by reducing our carbon foot-
print and doing what we can to slow
the consequences of global warming.
Our leaders owe it to this and future
generations to protect the health of the
state’s essential natural resources. But
this is more than a moral issue. It’s also
a money issue.
Other states are examining ways to
help their businesses lead (and profit) in
the fight against global warming. And
Texas should, too. Our cities are home Wind power offers Texas perhaps its greatest
opportunity to contribute to global warming
to some of the world’s largest energy solutions.
and computer companies. Our ingenuity
played a major role in the computer revolution, and our research universities boast
of some of the best talent in the country.
But when it comes to tackling the greatest energy and technology challenge of
our lifetime, Texas talent and Texas business savvy have been underused by state
leaders who seem dead-set on ignoring the necessity and inevitability of a new
energy economy. How much potential revenue is being lost because our leaders
are stuck in the carbon-based economy? Is Texas going to let New Mexico, North
Carolina or California pave the way to our new energy economy? So far, that appears
to be the plan.
16Charting a new course for Texas
“The presence of Texas can and should lead the way toward solving our global warming problems.
uncertainty need But we need to get to it quickly—others have a few years’ head start. Environmental
not immobilize us Defense recommends specific actions our state leaders can take immediately to
like a deer trapped reduce carbon emissions in Texas and some thoughtful processes they can launch
in the headlights of so Texas is better prepared for the challenges ahead.
an on rushing
ADOPT NO-RISK, NO-REGRETS SOLUTIONS IMMEDIATELY
truck. There is
The Legislature and administrative agencies should adopt a series of no-risk, no-
enough information regrets initiatives that will either cost Texas nothing or save money while reducing
to craft a sound emissions. Following are just a few examples:
program for a
rational response Implement energy efficiency standards and programs. Adding new efficiency stan-
to climate change dards to the state building code would significantly reduce energy consumption and
in Texas.47” save consumers money. The state should also clean up its own facilities by retrofitting
Dr. Gerald North, Texas A&M
all state buildings and facilities to reduce energy consumption and save tax dollars.
University
Implement pay-as-you-drive auto insurance. Studies have shown that basing auto
insurance premiums on miles driven is fairer to consumers. It just so happens that it
also encourages people to drive less (and emit less carbon dioxide). Though state law
allowed insurance companies to offer this pricing model as an option for customers,
no companies have. The state should now require them to do so.
Offer incentives to companies to offer cash rebates to employees who agree to
forego an office parking spot and use other modes of transit to get to work. Com-
panies would require fewer
parking spots and employees
would make money by reducing
their commuting emissions.
Offer incentives to reduce the
greenhouse gas emissions of
18-wheelers. Large trucks that
idle through the night at truck-
stops can burn up to a gallon of
diesel fuel per hour, emitting IDLEAIRE
tons of greenhouse gases a year
and wasting millions of dollars.
Trucks that idle all night at truck stops emit tons of green-
The state should adopt policies house gas pollution into the atmosphere. Electrified truck
that promote the construction stops like this one deliver air conditioning, heating and even
of electrified truck stops that phone and Internet service to drivers to they can turn off
their engines.
provide truckers heating, air
conditioning, and phone, cable and Internet access so they do not have to run their
engines while parked.
17Citizen action for reducing greenhouse gases
Government intervention is imperative because federal rebates available to offset the cost of new
Texas’ carbon emissions are so great and reduc- energy-efficient appliances.
tions are needed so quickly. But that doesn’t
mean individual Texans can’t make a difference. • Drive smart. Emissions from cars and trucks
are the most direct “consumer controlled” source
There are more than 15 million adults in Texas
of greenhouse gases. But not everyone has to
who make annual, monthly and even daily spend-
give up driving to make a difference. When shop-
ing decisions that impact the state’s emission
ping for a new car, look for the most fuel-efficient
levels. Even minor lifestyle adjustments add
model in the class your family needs. It will
up when multiplied by 15 million. Consider the
reduce emissions and save you money. The
following steps everyday Texans can take to reduce
difference in fuel costs between a 20 mpg and
their carbon emissions without sacrificing comfort,
30 mpg car is nearly $700 a year.48 Keep cars
cost or convenience.
well tuned and tires properly inflated. Combine
errands. If your schedule permits, carpool with
• Replace regular a co-worker or take the bus to work once a week
household light bulbs
or once a month.
with compact fluor-
escent bulbs. Not only • Think globally, vote locally. As much as con-
do they last up to 10 sumers can do to reduce Texas emissions, we
times longer but they need our elected officials to take action on global
provide the same Compact fluorescent light warming. Be an educated voter and demand that
amount of light as bulbs that save energy and your elected officials take action on global warm-
last longer than regular bulbs
regular bulbs while ing now.
are one of the easiest ways to
using about one-fifth reduce household greenhouse
the electricity. gas emissions.
• Pick an electricity provider that is committed
to renewable energy. In some markets, con-
sumers can “lock in” an electric rate for power
generated from low-emission sources, so not
only are they curbing their emissions, they
also are protected when rising fuel costs cause
rate hikes.
• Weatherproofing, such as caulking leaky doors,
replacing insulation or installing double-pane
windows, can save energy and reduce strain on
air conditioners.
• Look for the EnergyStar logo when you shop. New
refrigerators, washing
machines, water
heaters and air con-
ditioners are much
more efficient than
older models. When
shopping for new
appliances, pay atten-
tion to their estimated Texans can help curb global warming at home and on their
way to work. To learn more consumer tips that will reduce
“annual energy costs” and select less power- carbon dioxide emissions, visit www.fightglobalwarming.com
thirsty models. In many cases, there are local and and download our Low Carbon Diet kit.
18Planning for opportunities and consequences
The Texas Legislature should follow the lead of other states by commissioning a
Global Warming Task Force of business leaders, academics, scientists, economists
and environmentalists to develop a balanced and expert assessment of the global
warming challenges and opportunities that lie ahead.
The Texas leadership is years behind other states in investigating what global
warming will mean to our state’s resources and economy, what we can do to
reduce our emissions, and what economic opportunities might exist in tackling
global warming.
Other states have inventoried and begun planning for the risks and consequences
of global warming. Fifteen years ago, the
Houston Advanced Research Center, a
States with most wind energy
non-profit corporation, had the foresight
installed, by capacity (MW)
to convene experts to assess the varied
California . . . . . . . . . . . . . . . . . .2,150
impacts global warming might have on
Texas . . . . . . . . . . . . . . . . . . . . . .1,995
Texas and identify policy options to help Iowa . . . . . . . . . . . . . . . . . . . . . . . .836
Texas prepare. The result of that effort Minnesota . . . . . . . . . . . . . . . . . . .744
was The Impact of Global Warming on Oklahoma . . . . . . . . . . . . . . . . . . .475
New Mexico . . . . . . . . . . . . . . . . . .407
Texas, published in 1995. The task force
Washington . . . . . . . . . . . . . . . . . .390
recommended here should build upon the Oregon . . . . . . . . . . . . . . . . . . . . . .338
1995 findings and bring them up to date Wyoming . . . . . . . . . . . . . . . . . . . .288
so that state and local leaders can develop Kansas . . . . . . . . . . . . . . . . . . . . . .264
solutions with the best available data. Capacity—measured in kilowatts (kW)
Broad, bipartisan agreement on the likely or megawatts (MW)—measures a
consequences of global warming will turbine’s generating potential. A
1.5-MW wind turbine operating in
make planning for them possible.
a good wind resource area can be
The task force should also examine expected to generate over 4 million
the quickest and most cost-effective route kilowatt hours per year or enough to
to lowering the state’s greenhouse gas supply 400 average homes.
emissions. Other states have imple- California, where the U.S. wind
industry began, has had the largest
mented market-based tools like emission wind power capacity since electricity-
credit trading to spark new sources of generating wind turbines were first
revenue for carbon-emitting industries, installed there in 1981. Texas gained
and Texas should develop its own plan fast last year and is expected to
overtake California in 2006.
before one is mandated by the federal
Source: America Wind Energy Association,
government. http://www.awea.org/news/Annual_Industry
_Rankings_Continued_Growth_031506.html
And finally, the task force should iden-
tify opportunities that could turn the fight
against global warming into an economic opportunity for Texas businesses. Corpora-
tions like General Electric are investing billions of dollars into products and programs
that reduce emissions. Some of that money could come to Texas, and our leaders
should be among Texas’ greatest new energy ambassadors. For example, renewable
energy capacity is one of Texas’ environmental bright spots. Texas will soon rank above
all states in wind power generation, and the capacity for green economic growth here
is staggering. But our leaders in Austin have so far ignored economic upsides to a
carbon-reduced world. As other states move toward a clean and prosperous future,
an official assessment of just how much money Texas businesses stand to gain (or
miss out on) would spur interest and investment.
19Notes
1
Karl, T. and K. Trenberth. “Modern global Updated data available at: http://data.giss.nasa
climate change; State of the Planet.” Science .gov/gistemp/graphs/; used with permission.
302 (2003): 1719. 15
Image by Reto Stöckli, Robert Simmon and
2
From the National Climatic Data Center’s David Herring, NASA Earth Observatory,
Experimental Blended Temperature Rankings, based on data from the MODIS land team.
January 2006. See http://www.ncdc 16
American Lung Association of California,
.noaa.gov/oa/climate/research/2005/dec/ 2004.
experimental-blended.html. California Air Resources Board. Backgrounder:
3
Source: National Weather Service, 2006. The Greenhouse Effect and California. Available
4
Ibid. at http://www.arb.ca.gov/cc/factsheets/
5
ccbackground.pdf.
Environmental Defense GIS analysis. See 17
maps on page 11. National Research Council of the National
6
Academies, 2005.
Siegenthaler, U., et al., “Stable carbon cycle 18
North, G., J. Schmandt and J. Clarkson, ed.
climate relationship during the late Pleisto-
The Impact of Global Warming on Texas. Uni-
cene.” Science 310 (2005): 1313–1317.
versity of Texas Press. (1995): 78–87.
7
IPCC. Climate Change 2001: The Scientific 19
Ibid.
Basis. Houghton, J.T. and Ding, Y. (eds.), 20
Cambridge, Cambridge University Press, 2001. Ibid.
21
Joint science academies’ statement: Global Climate Change and Texas. Environmental
response to climate change. 7 June 2005. Protection Agency publication. EPA Publica-
Available at: http://nationalacademies.org/ tion No. 230-F-97-008qq. September 1997.
22
onpi/06072005.pdf. http://yosemite.epa.gov/oar/globalwarming
8 .nsf/content/Climate.html.
Ibid.
23
9
Parmesan, C. and G. Yohe. (2003), Nature 421
This figure is based on data from:
(2003): 57–60.
Siegenthaler, U., et al.,”Stable carbon cycle- 24
climate relationship during the late http://nsidc.org/news/press/20050928
Pleistocene.” Science 310 (2005): 1313–1317. _trendscontinue.html (A joint press release
from the National Snow and Ice Data Center
EPICA. 2004.” Eight glacial cycles from an at the University of Colorado, Boulder, NASA
Antarctic ice core.” Nature 429: 623–628. In the and the University of Washington).
figure, interglacial periods are defined as those
during which deuterium isotope composition Yu, Y., G.A. Maykut and D.A. Rothrock.
of the cores exceeds—403‰, which is the “Changes in the thickness distribution of
value marking the beginning of the Holocene. Arctic sea ice between 1958-1970 and
10
1993–1997.” Journal of Geophysical
National Research Council of the National Research—Oceans 109:C8 (2004): C08004.
Academies, “The Science of Instream Flows:
Wadhams, P. and N.R. Davis. “Further
A review of the Texas Instream Flow program,”
evidence of ice thinning in the Arctic Ocean.”
Prepared for the Texas Water Development
Geophysical Research Letters 27:24
Board, February 8, 2005. http://www.twdb
(2000):3973–3975.
.state.tx.us/instreamflows/index/html.
11
Tucker, W.B. et al., “Evidence for rapid thin-
IPCC, 2001.
ning of sea ice in the western Arctic Ocean at
12
Ibid. the end of the 1980s.” Geophysical Research
13
Stott, P.A., D.A. Stone, and M.R. Allen. Letters 28:14 (2001): 2851–2854.
“Human contribution to the European heat- Rothrock, D.A., Y. Yu, and G.A. Maykut.
wave of 2003”. Nature 432 (2004): 610–614. “Thinning of the Arctic sea-ice cover.”
Munich RE, Geo Risks Research Dept. 2004. Geophysical Research Letters 26:23 (1999):
Topics Geo: Annual Review: Natural Catastro- 3469–3472.
phes 2003. http://www.munichre.com/ Parkinson, C.L. et al., “Arctic sea ice extents,
publications/302-03971_en.pdf?rdm=30220. areas, and trends, 1978–1996.” Journal of
Luterbacher, J. et al., “European seasonal and Geophysical Research 104:C9 (1999):
annual temperature variability, trends, and 20837–20856.
extremes since 1500.” Science 303 (2004): Meier, W. et al., “Reductions in Arctic sea ice
1499–1503. cover no longer limited to summer.” Eos
14
Hansen, J. et al., “A closer look at United Transactions AGU 86:36 (2005):326.
States and global surface temperature change.” ACIA. Impacts of a Warming Arctic: Arctic
Journal of Geophysical Research. Vol. 106, No. Climate Impact Assessment. Cambridge
D20(2001): 23, 947–53, 963. University Press 2004.
25
Hansen, J. et al., “Global Warming Continues.” Camill, P. “Permafrost thaw accelerates in
Science. Vol. 295 (2002):275. boreal peatlands during late- 20th century
20climate warming.” Climatic Change 68:1–2 36
Siegenthaler et al., (2005).
(2005):135–152. 37
Source: United Nation’s Intergovernmental
Stokstad, E. “Defrosting the carbon freezer of Panel on Climate Change.
the North.” Science 304 (2004): 1618–1620. 38
http://yosemite.epa.gov/oar/globalwarming
26
Alaska Regional Assessment Group. The Poten- .nsf/content/Climate.html.
tial Consequences of Climate Variability and 39
Maps created by Environmental Defense using
Change. A Report for the US Global Change ArcInfo Software from ESRI. Data from
Research Program. Published by the Center for USGS, digital elevation models.
Global Change and Arctic System Research, 40
Rayner, N. HadISST1 Sea ice and sea surface
University of Alaska, Fairbanks (1999). temperature files. Hadley Center, Bracknell,
27
Liniger, H., R. Weingartner and M. Grosjean. U.K.(2000).
Mountains of the World: Water Towers for the Reynolds, R.W. et al., “An improved in situ
21st Century. Berne (Switzerland): Mountain and satellite SST analysis for climate.” J.
Agenda (1998). Climate 15 (2002): 1609–1625.
J. Thomas and S. Rai. An Overview of Glaciers, Updated data and mapping tool available at:
Glacier Retreat, and Subsequent Impacts in Nepal, http://data.giss.nasa.gov/gistemp/maps/.
India and China. WWF Nepal Program
The average temperature change for the ocean
(2005). http://www.panda.org/downloads/
surface is taken from Levitus, S. et al., “Warm-
climate_change/glacierssummar .pdf.
28
ing of the world ocean.” Science 287:5461
Hall, M.H.P. and D.B. Fagre. “Modeled (2000):2225–2229.
climate-induced glacier change in Glacier 41
Emanuel, K. “Increasing destructiveness of
National Park, 1850–2100.” BioScience 53
tropical cyclones over the past 30 years.” Nature
(2003): 131–141.
436 (2005): 686–688.
29
Key, C.H., D.B. Fagre and R.K. Menicke.
Webster, P.J. et al., “Changes in tropical
Glacier retreat in Glacier National Park,
cyclone number, duration, and intensity in a
Montana (1998). In Williams, R.S. and J.G.
warming environment.” Science 309 (2005):
Ferrigno, eds. Satellite image atlas of glaciers of
1844–1846.
the world, Chapter J, Glaciers of North America. 42
US Geological Survey Professional Paper Goldberg, J. and C. Wilkinson. Global Threats
13686-J. Condensed version available at to Coral Reefs: Coral Bleaching, Global Climate
http://www.nrmsc. usgs.gov/research/glacier Change, Disease, Predator Plagues, and Invasive
_retreat.htm Species. (2004): 67–92. In C. Wilkinson (ed.).
30
Status of coral reefs of the world. (2004) Volume
Church, J.A. et al., Changes in Sea Level. In:
1: 301. Australian Institute of Marine Science,
Climate Change 2001: The Scientific Basis.
Townsville, Queensland, Australia.
Contribution of Working Group I to the Third
Assessment Report of the IPCC (2001). Hoegh-Guldberg, O. “Climate change, coral
31
bleaching and the future of the world’s coral
Ibid. reefs.” Marine and Freshwater Research 50
32
Ibid. (1999): 839–866.
33
Gregory, J.M., P. Huybrechts, and SCB Raper. 43
Data from Webster, et al., (2005).
“Threatened loss of the Greenland ice-sheet.” 44
Data source: Texas Parks and Wildlife
Nature 428 (2004): 616. Department, as reported in “Sea Change,”
Oppenheimer, M. and R.B. Alley. “Ice sheets, Houston Chronicle, Dina Cappiello, February
global warming, and Article 2 of the 5, 2006.
UNFCCC: An editorial essay.” Climatic 45
“Experts: Global warming behind 2005
Change 68 (2005): 257–267. hurricanes,” CNN, April 25, 2006.
34
Chapin III, F.S. et al., “Role of land-surface 46
Ibid.
changes in Arctic summer warming.” Science 47
North, G. et al., (1995).
310:5748 (2005): 657–660. [DOI: 10. 48
1126/science. 1117368]. Assuming 15,000 miles a year and $2.79/gallon
35 gas prices.
Prentice, I.C. et al., The Carbon Cycle and
Atmospheric Carbon Dioxide. In: Climate
Change 2001: The Scientific Basis. Contribution
of Working Group I to the Third Assessment
Report of the IPCC (2001).
Camill, P. “Permafrost thaw accelerates in
boreal peatlands during late-20th century
climate warming.” Climatic Change 68:1-2
(2005): 135–152.
Stokstad, E. “Defrosting the carbon freezer of
the North.” Science 304 (2004): 1618–1620.
21National headquarters 257 Park Avenue South New York, NY 10010 212-505-2100 1875 Connecticut Avenue, NW Washington, DC 20009 202-387-3500 5655 College Avenue Oakland, CA 94618 510-658-8008 2334 North Broadway Boulder, CO 80304 303-440-4901 2500 Blue Ridge Road Raleigh, NC 27607 919-881-2601 44 East Avenue Austin, TX 78701 512-478-5161 18 Tremont Street Boston, MA 02108 617-723-5111 Project offices 3250 Wilshire Boulevard Los Angeles, CA 90010 213-386-5501 1107 9th St., Suite 510 Sacramento, CA 95814 916-492-7078 East 3-501 No. 28 East Andingmen Street Beijing 100007 China +86 10 6409 7088
You can also read