Geography of Science: Competitiveness and Inequality
←
→
Page content transcription
If your browser does not render page correctly, please read the page content below
Geography of Science: Competitiveness and Inequality
                                              Aurelio Patellia,e,1 , Lorenzo Napolitanob,† , Giulio Ciminic,a,e , and Andrea
                                                                               Gabriellid,a,e
                                                    a
                                                      Enrico Fermi Center for Study and Research, via Panisperna 89a, 00184, Rome (Italy)
                                                          b European Commission, Joint Research Center (JRC), 41092 Seville (Spain)
                                                     c Physics Department and INFN, University of Rome Tor Vergata, 00133 Rome (Italy)
arXiv:2110.01615v1 [cs.DL] 3 Oct 2021

                                                              d Engineering Department, University “Roma Tre”, 00146 Rome (Italy)
                                                           e Institute for Complex Systems (CNR), UoS Sapienza, 00185 Rome (Italy)

                                        Abstract                                                   hypotheses. Similarly to what happens for tech-
                                                                                                   nological innovation and economic growth [1, 2,
                                        Using ideas and tools of complexity science we             3], scientific progress requires appropriate capa-
                                        design a holistic measure of Scientific Fitness,           bilities: previous knowledge, tools, human cap-
                                        encompassing the scientific knowledge, capabil-            ital, resources, and so on. The combination
                                        ities and competitiveness of a research system.            and interaction of such capabilities, even from
                                        We characterize the temporal dynamics of Sci-              different contexts, pushes the boundary of sci-
                                        entific Fitness and R&D expenditures at the                ence through new knowledge and discoveries, as
                                        geographical scale of nations, highlighting pat-           well as through re-discoveries via previously un-
                                        terns of similar research systems, and showing             charted paths [4, 5, 6]. This process naturally oc-
                                        how developing nations (China in particular) are           cur mostly in geographic areas where many dif-
                                        quickly catching up the developed ones. Down-              ferent capabilities are concentrated [7], whence
                                        scaling the aggregation level of the analysis, we          we can assume that the scientific output of a re-
                                        find that even developed nations show a consid-            gion reflects the set of relevant capabilities avail-
                                        erable level of inequality in the Scientific Fitness       able.
                                        of their internal regions. Further, we assess com-
                                        paratively how the competitiveness of each geo-      The quantitative evaluation of scientific out-
                                        graphic region is distributed over the spectrum ofcomes, from the microscopic level of individual
                                        research sectors. Overall, the Scientific Fitness researchers and institutions to the macroscopic
                                                                                          case of entire nations, is nowadays a common
                                        represents the first high quality estimation of the
                                        scientific strength of nations and regions, open- practice [8, 9]. At the macro level, a seminal
                                        ing new policy-making applications for better al- work by May [10] assessed the performance of
                                                                                          national research systems using an index bor-
                                        locating resources, filling inequality gaps and ul-
                                        timately promoting innovation.                    rowed from the economic literature: the Re-
                                                                                          vealed Comparative Advantage (RCA) [11], com-
                                                                                          puted on the number of scientific documents pro-
                                        1 Introduction                                    duced by each nation in the various research sec-
                                                                                          tors. King [12] pursued a different approach,
                                        Science is based on the progressive augmentation ranking nations according to the share of global
                                        of existing knowledge building on past discover- citations received by their document output, and
                                        ies, through a recursive process involving empir- introduced funding as an additional variable of
                                        ical observation and the formulation of testable the analysis. Subsequently, the use of citations

                                                                                               1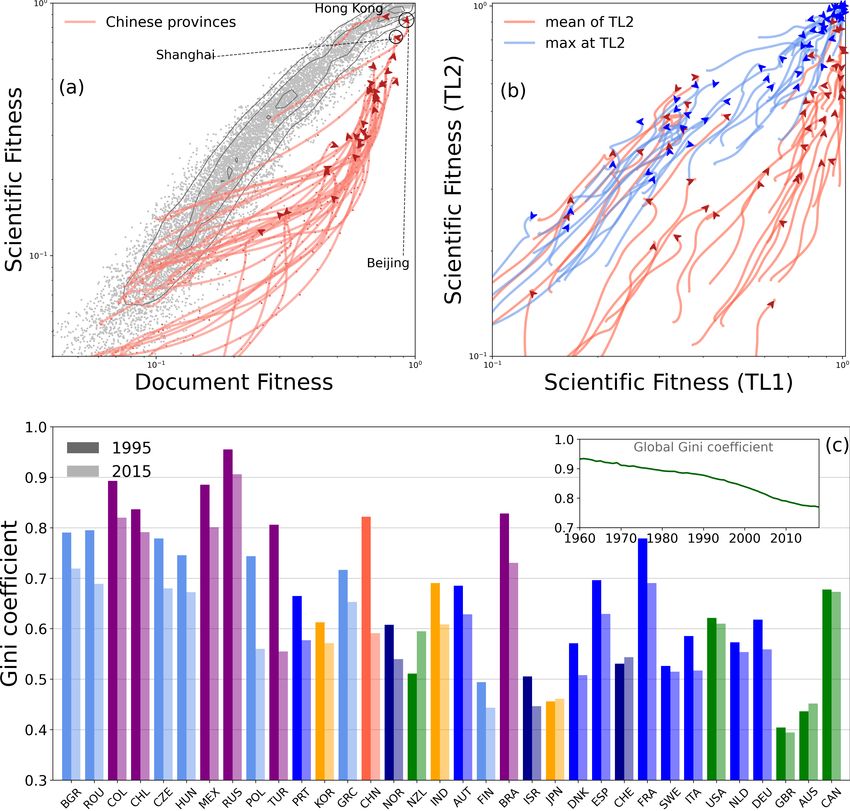
became the gold standard for assessing research            ity scheme, indicates the presence of a competi-
quality, and several metrics with swinging perfor-         tive mechanism shaping the connections amidst
mance have been proposed – see [8] for a com-              the scientific actors – akin to what is observed
prehensive review of the field. However this ap-           in natural ecosystems [22] as well as in human
proach has recently been questioned, due for ex-           productive activities [1]. Indeed, although the
ample to the very different amount of resources            scientific environment is neither directly nor indi-
that nations invest in scientific research. In fact,       rectly aimed at the production of physical goods
even for the most economically developed na-               or services (for which there is a clear payoff)
tions, the scientific success measured on citations        and is not subject to the incentives of compet-
and the public spending in research and develop-           itive markets, there are actually many sources
ment (R&D) [13, 14] (as well as returns to inno-           of competition, since most research systems rely
vation [15]) are correlated but also present strong        on merit-based processes to determine funding,
deviations, and therefore should be considered as          hiring, careers, and thus indirectly scientific re-
complementary dimensions for a correct evalua-             search itself. Therefore, only naively science
tion of scientific performance. Another impor-             can be considered as guided by non-competitive
tant problem is given by the presence of bias and          actors who collaborate for the advancement of
distortions in citation patterns [16, 17]. Indeed          knowledge.
the dynamics of the citation process strongly de-      Overall, the nested pattern observed when
pend on sector-specific characteristics, and cita-  comparing national research systems [23] sug-
tion statistics are often distorted by the pres-    gests that diversification and composition of the
ence of outliers (the few documents attracting a    scientific research basket can be used to measure
huge amount of citations) [18, 19]. These and       the scientific competitiveness (or Fitness) of a
other issues may reduce the explanatory power       nation; at the same time, the complexity of a re-
of citation-based metrics, as well as their variantssearch sector depends on its ubiquity and on the
based on top-percentage citations [20], including   Scientific Fitness of nations that are competitive
the H-index [21].                                   in that sector. The Economic Fitness and Com-
   There are two additional key aspects that cita- plexity (EFC) [24, 25, 26] algorithm is the ideal
tion share metrics do not take into account. On tool to estimate the fixed point of this circular
the macroscopic scale, nations do not specialize relation. The purpose of this work is precisely
in a few research sectors but tend to diversify to develop a framework for quantifying scientific
their activity into as many sectors as possible. competitiveness by leveraging the EFC toolbox.
This is explained by the capability scheme, for        In a nutshell, we build an appropriate
which a given geographic area is active in all re- database for our analysis starting from the Open
search sectors allowed by the capabilities that Academic Graph (OAG)[27] [28, 29, 30], a freely
are present on its territory. Since capabilities accessible collection of information about indi-
are heterogeneously distributed, nations have a vidual scientific publications, covering a large
heterogeneous level of diversification, thus diver- portion of the scientific production corpus. On
sification itself can be used as a basic proxy of the one hand, OAG assigns documents to geo-
scientific performance. In addition, while na- graphic areas according to the location of the
tions with many different capabilities (typically, research institutes to which the authors are af-
the developed economies) are competitive in al- filiated. On the other hand, OAG assigns docu-
most all existing research sectors, nations with ments to research sectors according to a hier-
fewer capabilities (the less developed economies) archical classification of scientific topics, each
perform well only in a few research areas with known as Field of Studies (FoS). The docu-
a lower degree of sophistication or complexity. ments produced by a geographical area in a re-
Such a nested structure, induced by the capabil- search sector provide a basic measure of scien-

                                                       2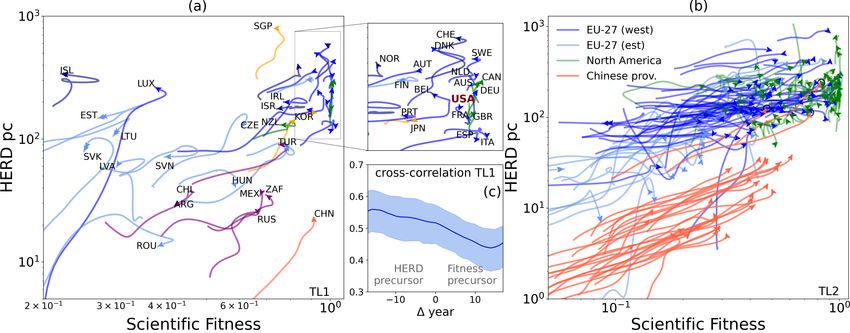
tific performance through an appropriate count           sures [33] (see SI for a further comparison). No-
of citations received. In this analysis we can           tably, the raking of Scientific Fitness is also dif-
use a variable resolution both in terms of geo-          ferent from that obtained using metrics based
graphical scale (we follow the Territorial Level         on citation shares, such as the Mean Normalized
scheme implemented by the OECD [31]) and of              Citation Score (MNCS) [8, 13], which measure
FoS hierarchical level. Filtering this data us-          research efficiency rather than competitiveness.
ing the RCA allows obtaining the scientific bi-          Indeed, MNCS ranks at the top the small but
partite network (SBN hereafter) connecting geo-          efficient research systems – such as Switzerland,
graphic areas with the research sectors they are         Israel and Singapore. Instead Scientific Fitness
competitive in, and finally computing the Sci-           accounts both for efficiency (through the use of
entific Fitness of such areas through the EFC            the RCA filter) and diversification (i.e., the cu-
algorithm [23]. Note that our approach follows           mulative stock of capabilities owned by a na-
the path initially outlined by May [10], though          tion), and thus allows for a more fair compar-
we compute RCA not on document production                ison between small and large research systems.
but on citation counts, in accordance with the           Remarkably the same patterns are observed also
ideas proposed by King [12] — and likewise we            when the analysis is performed using a different
complement the analysis with data about mone-            dataset (we report in the Supporting Informa-
tary resources invested in scientific research. In       tion the case of Scimago [34], based on Scopus).
particular we use Higher Education expenditures             Following previous literature on Science of Sci-
on Research & Development (HERD), again pro-             ence [12, 16, 13], we obtain a richer picture
vided by the OECD [32]. We refer the reader to           by complementing Scientific Fitness with the
the Materials and Methods section for a more             amount of resources that are invested in scientific
detailed description of the workflow.                    research. A similar approach (with some caveats
                                                         discussed below) is also used in the classic EFC
                                                         literature, where Economic Fitness is scattered
2    Results                                             against a monetary measure of income (typi-
We start by discussing Scientific Fitness at the         cally the Gross Domestic Product per capita);
geographic scale of nations – corresponding to           the dynamics in the two dimensional space de-
Territorial Level 1 (TL1) of the OECD classi-            fined by these variables highlight clusters of sim-
fication. Unsurprisingly the geographical distri-        ilar economies, allowing for a very precise eco-
bution of Fitness values, reported in the top map        nomic forecasting [35]. As already mentioned,
of Figure 1, shows that the most developed and           here we employ Higher Education expenditures
rich nations are also the top performers in sci-         on R&D (HERD) [32], namely the expenditures
ence, while the developing nations are ranked            for basic research performed in the higher edu-
lower [23]. Such heterogeneous patterns are simi-        cation sector, which among the sources of pub-
lar to those associated with traditional measures        lic funding are those most connected to scien-
of economic size or relevance (such as GDP or            tific performance as measured through citations
population) but have a more intensive charac-            of published documents 1 . This data is avail-
ter, since small countries can display a high Sci-
                                                            1 The other sources of public funding are [32]: the
entific Fitness while large ones may not, e.g.
                                                         Business Expenditures on R&D (BERD), namely R&D
Switzerland ranks higher than India. A higher            expenditures performed in the business sector, which is
correlation is observed with the Economic Fit-           mostly related to the creation of new products and pro-
ness computed using export data [24, 25, 26],            duction techniques (patents); the Government Intramu-
                                                         ral Expenditures on R&D (GOVERD), namely expendi-
which is also aimed to measure competitiveness
                                                         tures in the government sector, which is often mission-
based on owned capabilities, tough there is not a        oriented and therefore less connected to publication out-
one-to-one correspondence between the two mea-           puts (see [13] and the discussion therein). In the Support-

                                                     3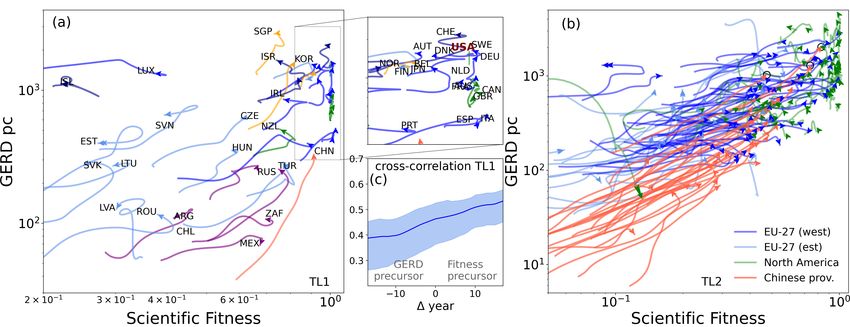
Figure 1: Map of the Scientific Fitness of nations (TL1, panel a) and of regions (TL2) within North
America (panel b), Europe and Turkey (panel c) and China, Japan and South Korea (panel d).
The color scale indicates the average Fitness between 1998 and 2018 (missing entries are colored
in gray), with darker and lighter tone for higher and lower Fitness, respectively (the scale [0, 1] is
the same for the national and regional levels). Notice how the Fitness of a nation cannot be simply
obtained by summing nor averaging the Fitness of its regions (see Figure 3 below). The elliptic
projection of the map follows the Robinson projection (esri:54030).

                                                  4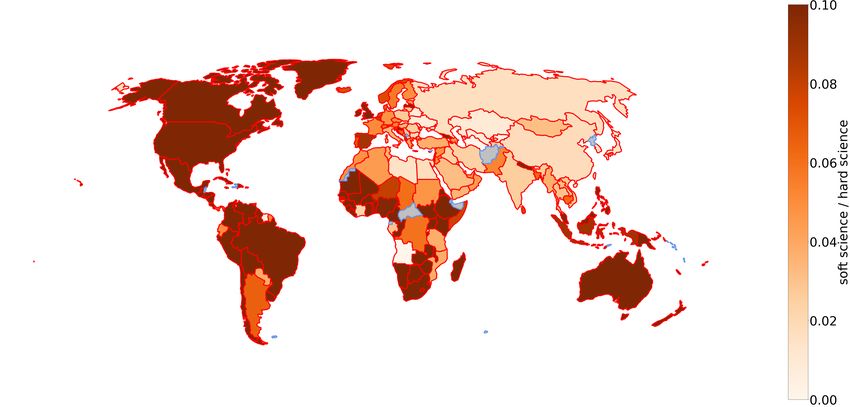
able only for OECD members and a few other Fitness of a nation is mostly concentrated in
important economies (such as China and Rus- its capital region (also because capitals typically
sia); therefore the following analysis will be fo- host the headquarters of the largest national re-
cused only on this subset of high and middle search institutions). The English-speaking na-
income countries. Figure 2 in panel-(a) shows tions (United States and United Kingdom, and
the trajectories of these nations in the two di- the same happens for Australia) are the excep-
mensional plane defined by Scientific Fitness and tion by featuring high Fitness in all their regions.
HERD per capita (HERD-pc). We observe that Such a widespread competitiveness can be also
the most developed economies usually concen- due to the language bias of the dataset, which
trate in the top right corner of the diagram (en- covers non-English literature only partially, es-
larged in the inset) characterized by high values pecially for Social Sciences and Humanities [37]
of both Fitness and HERD-pc. The other na- (see Materials and Methods and further analy-
tions are instead scattered along the diagonal, sis in the Supporting Information), and possibly
for which Scientific Fitness is proportional to re- to the advantage of native English speakers in
sources invested, and their trajectories are typi- better writing scientific articles which therefore
cally directed towards the top-right region: these attract more citations. The evolution of Scien-
countries are quickly catching up with the most tific Fitness and HERD-pc at the regional level
advanced ones. Off-diagonal trajectories provide is shown in the right panel of Figure 2. We
interesting information, similar to those obtained see again that while most of the North Amer-
within the economic framework [25]. The top icans regions are top performers, Fitness val-
left corner contains small national research sys- ues of European regions form a cloud ranging
tems with peculiar features, where investments from low to high competitiveness. The case of
are not efficiently turned into scientific competi- China stands alone: only three provinces (Bei-
tiveness. This is for instance the case of Iceland, jing, Hong Kong and Tianjin) belong to the cloud
which does not attract much attention in terms of EU regions, while the others follow a very reg-
of citations, and of Luxembourg, where the pres- ular flow with a steady increase both in compet-
ence several private firms headquarters may bias itiveness and public expenditures. Indeed China
the scientific production to patent-related docu- invested enormously in science starting from the
ments [15]. In the opposite corner, China (and to end of the last century, with growing expendi-
a minor extent Russia, South Africa and Mexico) tures in R&D throughout the country. Apart
features a high scientific competitiveness despite from the three outliers, the competitiveness of
low public R&D expenditures, with both quan- Chinese provinces has not yet reached that of
tities growing quickly in time. the western countries regions, but it will eventu-
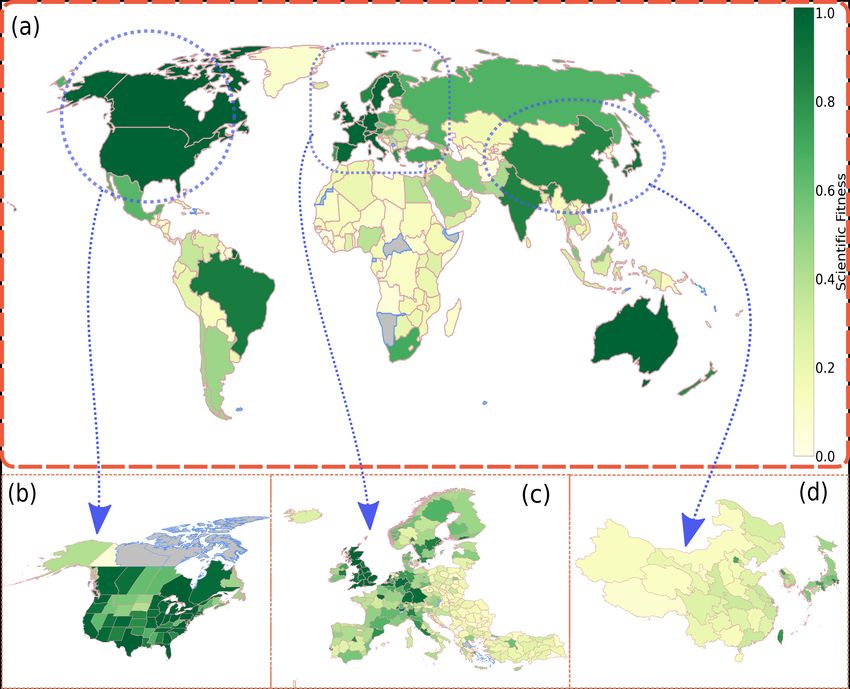
A main advantage of our framework is the ally do [38, 39]. This can be clearly seen in panel-
possibility to perform the analysis of Scientific (b) of Figure 3, where the trajectories of regional
Fitness at a more detailed geographic level, in Scientific Fitness are scattered with those of doc-
order to highlight the competitiveness of spe- ument Fitness, i.e., competitiveness computed
cific regions within nations. The bottom maps on document production rather than citation ac-
of Figure 1 report the Scientific Fitness of re- crued (see the Materials and Methods). Main-
gions (as defined by Territorial Level 2 (TL2) land Chinese provinces follow a unique pattern.
of the OECD classification) for three macro- Their document Fitness has increased substan-
areas: North America, Europe and East Asia. tially in the considered time span (2000-2018),
We observe a recurrent pattern for which the due to growing resources and the consequent ac-
quisition of new capabilities. However, initially
ing Information we show results of analysis performed this research output was not able to capture
using Gross Expenditure on R&D (GERD), given by the many citations from the international scientific
sum of HERD, BERD and GOVERD.
5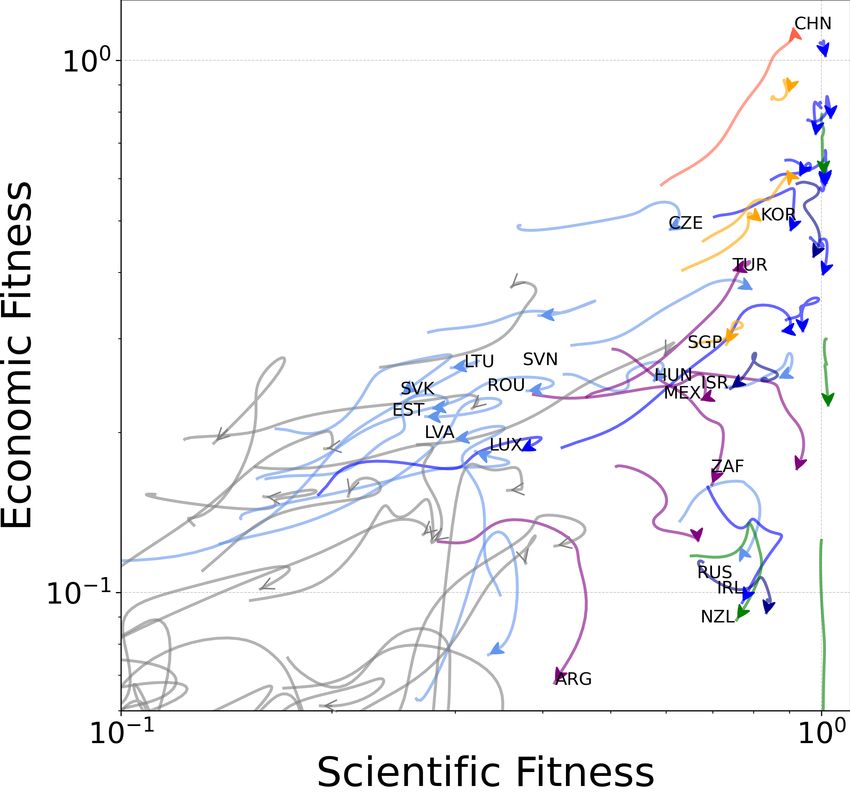
Figure 2: (panel a) Trajectories of nations (TL1) in the plane defined by Scientific Fitness and
resources invested, the latter measured by Higher Education expenditures on R&D per capita
(HERD-pc). Line colors are used to group nations into macro-areas: dark blue for west EU nations
(plus Switzerland, Israel, Norway, Island), light blue for east EU nations, , green for the English-
speaking nations (United States, United Kingdom, Canada, Australia, New Zealand) red for China,
yellow for the other Asian nations (Singapore, South Korea, Japan) and purple for middle-income
countries (Russia, South Africa, Mexico, Argentina, Chile). Trajectories represent data from 2000 to
2017, with the arrow indicating the direction of time. The inset zooms on the top-right corner where
there is a concentration of highly competitive nations. (panel b) Trajectories are also displayed
for regions (TL2) belonging to China and a selection of EU west, EU east and North America
nations. (panel c) Cross-correlation between Scientific Fitness and HERD at the national scale
(TL1) averaged over the whole set of countries as a function of the temporal delay (∆ year) used
to compute these quantities. The blue contour represents the 25 − 75% quantile, generated with a
bootstrapping technique. Note that a cross-correlation value of about 0.5 is comparable to analogous
estimations carried out in the economics context [36]

                                                 6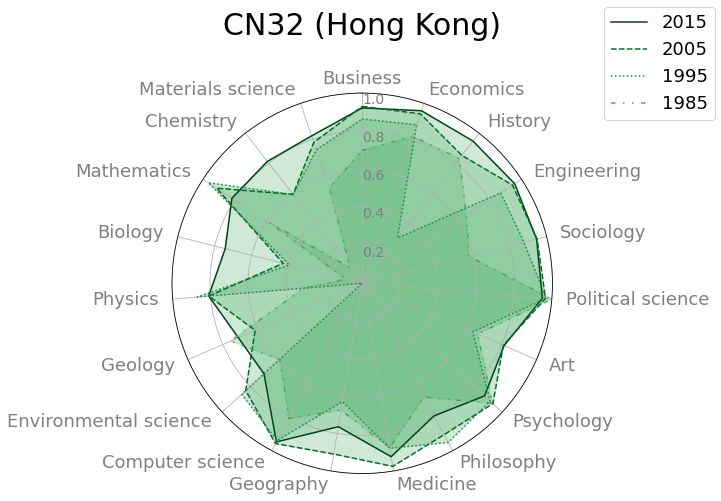
Figure 3: (panel a) Comparison of Scientific Fitness and document Fitness (i.e., Fitness computed
using published documents) at the regional level (TL2). The black lines indicate the density level
contour of the cloud of points while each red trajectory indicates the evolution of a Chinese province.
The trajectories map the evolution from 2000 to 2018, with the arrow indicating the direction of
time. (panel b) Comparison between the Scientific Fitness of nations, computed either at the
national level (TL1) or as the mean (red line) or maximum (blue line) of the Fitness of internal
regions (TL2). (panel c) Gini coefficients of each nation, computed over the citation counts of
internal regions. We report values for two years: 1995 (full color bars) and 2015 (shade color bars).
Nations are ordered according to their average Scientific Fitness in the central decade (2000-2010).
The inset represents the temporal evolution of the Gini coefficient of the whole world.

                                                  7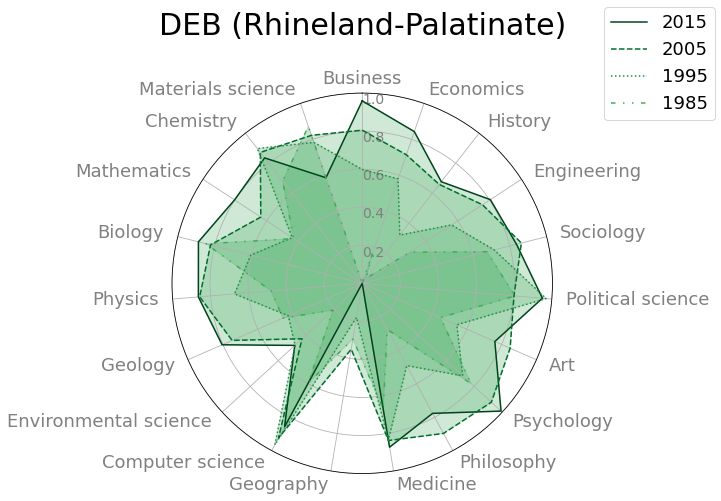
community, likely due to a low initial level of           area we can compute its sector Fitness restricted
competitiveness. Only recently Chinese research           to one of the 19 entries of the FoS main hier-
became very competitive and started to attract            archical level. Figure 4 shows the radar plots
citations, with a consequent growth in Scientific         of the sector Fitness for some example regions.
Fitness: the trajectories of Chinese provinces are        The 19 research sectors are ordered clockwise in
quickly moving towards the main cluster where             the radar according to their complexity (com-
the regions of other countries are located.               puted as the average complexity of their sub-
   Overall the results of the analysis at TL2 indi-       sectors), so that Business is the most complex
cate that the Fitness of a nation is not obtained         and Material Science is the less complex FoS.
by simply averaging or summing up the Fitness             Note that the EFC algorithm typically assigns
of its regions, because the most exclusive capa-          higher complexity to soft sciences (Economics,
bilities are typically concentrated only in a few         Social Sciences and Humanities) rather than to
regions, which thus determine the national com-           medical and hard sciences, because it turns out
petitiveness. This is confirmed by the plot in            that only the most competitive players are ac-
panel-(a) of Figure 3, which shows that the na-           tive in the former sectors, while the latter sec-
tional Fitness is more correlated to the Fitness          tors are more ubiquitous. This pattern can be
of its most competitive region (Pearson correla-          partially due to the aforementioned bias of our
tion of about 0.96) rather than to the mean Fit-          bibliometric data towards English-speaking na-
ness of its regions (Pearson correlation of about         tions in soft sciences. However a more fundamen-
0.70). More importantly, our framework high-              tal explanation exists: only the most developed
lights the strong heterogeneity of Fitness values         research systems have reached the level of ca-
both across and within nations, and thus allows           pabilities required to perform scientific research
locating the geographical inequalities of the sci-        in, e.g., Business Administration, Environmen-
entific research system. Values of the Gini coeffi-       tal Ethics and Cognitive Science. These sectors
cients (see Materials and Methods for the precise         require solid prerequisites in the hard sciences,
mathematical definition of the Gini coefficients          but they are not necessarily related to high tech-
implemented) are shown in the bottom panel of             nological requirements2 , rather they are aimed
Figure 3 for the available nations with more than         at addressing the most advanced needs of a so-
4 TL2 regions, and for two reference years (1995          ciety [23]. Overall, the analysis of the scientific
and 2015) spaced by two decades. The anal-                sector Fitness allows to quantitatively detect the
ysis shows that the United Kingdom and Aus-               strengths and weaknesses of each region, as well
tralia have the lower inequality score and in gen-        as their temporal evolution. For instance Fig-
eral the English-speaking nations feature low in-         ure 4 shows how the Beijing region experienced
equalities, while mid-income countries are char-          a fast growth in competitiveness in the hard sci-
acterized by the highest inequality levels. We            ences while it still falls back in artistic and cul-
also compute the global Gini coefficient over all         tural areas with respect to western regions. Re-
available regions in the world; the Inset in panel-       gions like Zurich, Lazio and Alberta have instead
(c) of Figure 3 shows that the global level of in-        a more uniform pattern of competitiveness, espe-
equality is slowly decreasing in time.                    cially in the last decades. Note how the top-
   Down-scaling the analysis from nations (TL1)              2 Note that the average complexity of a research sector
to regions (TL2) means increasing the geograph-           does not fully reflect the complexity of the associated sub-
ical resolution of our method. Similarly, we can          sectors. Indeed also in the hard sciences there are highly
increase the resolution regarding the research            sophisticated research sectors that require expensive in-
                                                          struments and large collaborations. For example, while
sectors, by exploiting the hierarchical classifica-
                                                          the average complexity of Business is 1.82, the complex-
tion of FoS. Thus, for example, instead of com-           ity of Polymer science, a child code of Material science
puting the total Scientific Fitness of a geographic       and Chemistry, is as high as 5.34.

                                                      8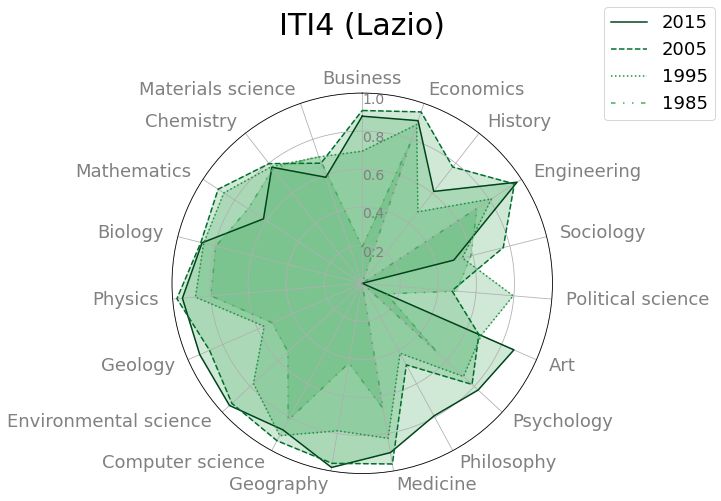
Figure 4: Radar plots of the scientific sector Fitness of different sample regions (TL2). Top row:
Nevada (USA), Alberta (Canada), New South Wales (Sydney). Central row: Zurich (Switzerland),
Lazio (Italy), Rhineland-Palatinate (Germany). Bottom row: Beijing (China), Hong Kong (China),
Rio de Janeiro (Brazil). Sectors are ordered clockwise with decreasing average complexity (Business
is the most complex and Material Science is the less complex sector). The radar lines indicate how
Fitness has evolved over the course of thirty years, from 1985 to 2015.

                                                9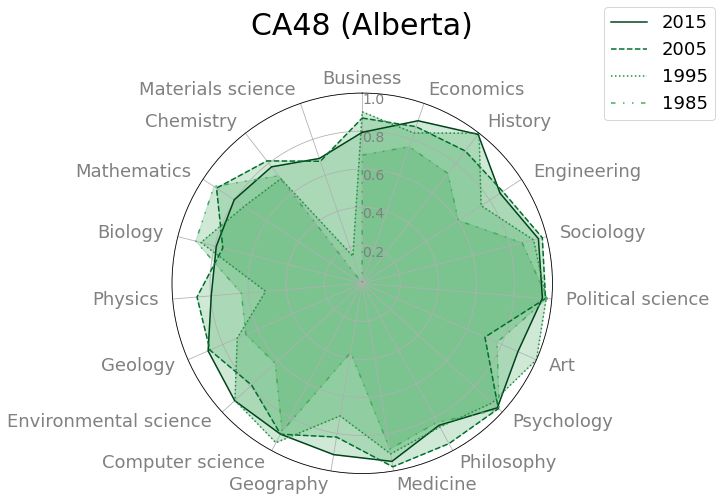
performing regions like New South Wales can            it reflects the outcome of the production pro-
also have competitive gaps but only in the less        cess; for this reason GDP can be interpreted as
complex sectors.                                       a a consequence of Economic Fitness. Instead,
                                                       HERD measures the amount of public resources
                                                       that are fed into the scientific system and thus
3    Discussions and Conclu-                           is an input requisite for Scientific Fitness. Con-
                                                       sequently, while both the trajectories of coun-
     sion                                              tries in the GDP-Fitness plane and the trajec-
                                                       tories in the Scientific Fitness-HERD allow to
This work aims to bring together two recent lines
                                                       extract interesting patterns concerning the way
of research: Science of Science [8, 40, 9], which
                                                       in which nations cluster in the plane, there are
develops quantitative methods and assessment
                                                       also remarkable differences in their interpreta-
tools to study the evolution of science itself, and
                                                       tion. For instance, there is evidence suggesting
Economic Fitness and Complexity [1, 24, 41],
                                                       that one can qualitatively predict 5-years trends
which aims at measuring the productive capa-
                                                       in GDP in the light of the historical evolution of
bilities of economic systems. Indeed, our frame-
                                                       economic fitness [35]. However, it would be over-
work to assess competitiveness in scientific re-
                                                       confident to push the analogy between Economic
search builds on the theory of hidden capabilities
                                                       Fitness and Scientific Fitness to the point of try-
and employs properly calibrated bibliometric in-
                                                       ing to infer future Scientific Fitness from histor-
dicators. The proposed methods allow for a con-
                                                       ical HERD data. A comprehensive analysis of
sistent comparison between different geograph-
                                                       the relation between Scientific Fitness and dif-
ical areas and research sectors at varying level
                                                       ferent measures of input and output of research
of resolution. In this work we presented only a
                                                       systems represents a promising avenue for future
handful of applications, highlighting the hetero-
                                                       research.
geneity of scientific competitiveness among na-
tions as well as the inequalities within national         In addition to uncovering non-trivial patterns
research systems. We further characterized the         in the evolution of national and regional knowl-
performance of scientific actors across the vari-      edge production systems, the application of the
ous research sectors, and showed that the evo-         EFC methodology to the realm of scientific pro-
lution of research systems can be properly de-         duction data also has the potential relevance for
scribed using two dimensions, Scientific Fitness       policy making. Even though the direct concern
and R&D expenditure. In the plane defined by           of Economic policy is not so much knowledge
these variables, nations form clusters of similar      creation, but rather Economic output or innova-
research systems operating within countries that       tion, it is known that competitiveness in scien-
have reached comparable stages of development.         tific fields is robustly linked to the development
   Similarly to other the classic applications in      of competitive advantages in patenting as well as
the EFC literature, this study shows that a high       export [3]. Since success in one of the above three
explanatory and forecasting power is achieved          layers – knowledge, innovation, trade – tends to
when Economic Fitness is coupled with a vari-          be a precursor of success in the others, it is rea-
able related to the amount of resources avail-         sonable to argue that a long-sighted approach to
able in the system under enquiry. Typically,           growth and development policies can only ben-
the EFC literature proxies resource endowments         efit from factoring knowledge production capa-
with Gross Domestic Product (GDP) [35]; for            bilities into the equation. Finally, the analysis
our purposes, HERD is is the more appropriate          of the scientific competitiveness of regional areas
measure. However there is a fundamental differ-        add a tool in the analysis of local capabilities,
ence between the use of GDP and HERD. GDP is           necessary in the developments of less wealthy re-
a measure of generated capital and wealth, hence       gions.

                                                  10
4 Material and Methods codes while layer 2 has more than 80 000 codes
and this number may change in time when new
We extract the scientific database from FoS are generated 4 .
the Open Academic Graph (OAG) The OAG database is used to construct the
(https://www.microsoft.com/en-us/ bipartite network linking geographical areas to
research/project/open-academic-graph/), research sectors. To this end we select only the
a freely available snapshot of a two billion- OAG entries with full information on authors’
scale academic graph resulting from the affiliation, FoS, citations count and year of publi-
unification of Microsoft Academic Graph and cation. Using this data we build tables reporting,
AMiner [28, 29, 30]. We use OAG v2, created for each year, the number of scientific documents
at the end of November 2018. The database produced by each geographical areas in the var-
is composed by a list of entries related to ious FoS, and their citations received up to the
various scientific literature: journal articles, OAG creation date. In order to assign a docu-
books, conference proceedings, reviews, and ment to a geographic area, OAG uses the loca-
others. The OAG coverage is estimated to be tion of the authors’ main affiliation. Note that in
comparable to that of Scopus or Wos [42], thus some cases it is not possible to select a precise lo-
likely presenting similar geographical and pho- cation because the affiliation may address gener-
netic biases – in particular the partial coverage ically to a multinational firm or a multi-location
of non-English written literature, especially research council (such as CNRS in France or
in the Social Sciences and Humanities where CNR in Italy). In these cases the location of the
research output is often published in the native headquarter is used, although this process may
language [37]. The OAG data spans more than artificially boost capital regions. Note also that
a century, starting in principle at the beginning there are several documents labeled by multiple
of 1800. In practice, data before the Second FoS and/or with several author affiliations. In
World War presents large fluctuations mainly these cases we employ a fractional counting ap-
due to the scarce amount of scientific production proach, by assigning the document to FoS and
for most of the regions. Hence, we start the geographic areas with a weight that is inversely
analysis in 1960, although the core results are proportional to number of FoS and number of
presented only for the recent decades where also authors 5 . Fractional counting has the main ad-
expenditure data is available (see below). vantage that allows aggregating tables on both
The classification of research sectors is defined the geographical and FoS dimensions without
by the Fields of Study (FoS), features which are increasing disproportionately the weight of the
dynamically evaluated by an “in-house knowl- most productive actors. Additionally, fractional
edge base related entity relationship, which is cal- counting has to be preferred as it better bal-
culated based on the entity contents, hyperlinks ances the scientific outputs of large and small
and web-click signals” [28]. The FoS are mostly geographical regions [43].
organized into a hierarchical structure, with the Following the classical approach of the Sci-
main characteristic that a code may have more entometrics literature, we use citations received
parents 3 . This structure presents a static layer 0 4 Deeper layers 3, 4 and 5 mostly split the larger topics,
with 19 hand-defined codes, corresponding to the but are not considered in the present work.
main classification of the research sectors. Mov- 5 For example, if a paper is labeled with FoS s and s
1 2
ing deeper in the hierarchy, layer 1 presents 294 and has three authors, the first two affiliated with (also
different) institutions in area g1 and the third with an
3 The very few exceptions of codes that are labelled institution in area g2 , the paper is assigned to FoS s1
at a fine level but without information on their parents and s2 with the same weight 1/2, while it is assigned to
are removed from the analysis. This does not represent a geographic areas g1 and g2 respectively with weights 2/3
problem, since we consider only the highest levels of the and 1/3. The paper’s citations are split according to the
FoS hierarchy. same ratios.
11by scientific documents as a reliable proxy for We thus build the SBN using the binary filter
the quality of research [8]. However, the sim- Mgs = 1 if RCAgs ≥ 1 and Mgs = 0 otherwise.
ple citations count presents a few drawbacks, es- Note that before implementing the filter we ap-
pecially when used to assess a small corpus of ply an exponential smoothing to the RCA series,
papers. This is due to the time papers need to considering a half-life of 3 years in order to keep
reach a stable level of citations [44], to the high a short persistence in the data.
skewness of the citation distribution for single At last we feed to SBN to the Fitness and com-
papers [45, 46], and to the dependence of cita- plexity algorithm [24, 25, 52]. The method ex-
tion patterns on the specific sector and journal ploits the nested structure of the network and
considered. Indeed the dynamical process un- obtains the Fitness F or competitiveness of a ge-
derlying the evolution of citation counts is well ographic area g by aggregating the complexities
modeled using a preferential attachment pro- of its basket of research sectors in a non-linear
cess [47, 48, 49]. This means that the sum of the way (so that the most complex sectors of activ-
citations accrued by a set of papers is dominated ity weigh the most), and in the same way the
by the citations of the few most cited outliers, the complexity C of a research sector s is given
which are in turn subject to strong statistical by the Fitness of the geographic areas that are
fluctuations (especially in small sets). A simple active in it (with low competitive regions weight-
yet effective approach to reduce such fluctuations ing the most). Operationally, the Fitness and
as well as the skewness of the citations distribu- the complexity vectors are the fixed point of the
tion consists in using a logarithmic transforma- following non-linear iterative map
tion [50, 51]. Thus we employ the log-citations (n)
count (n) (n−1) Feg
Fg(n) =
P
Feg = s Mgs Qs (n)
hFeg ig
wgs = log(1 + cgs ) (1)
1 Qe (n)
s
e (n)
Q s =P Q(n)
s =
where g labels a geographical area and s a re- 1 e (n)
hQ
Mgs s is
g (n)
search sector, while cgs is the citation count of Fg
documents assigned to area g for FoS s published
in a given year. where the operator h·ix indicates the arithmetic
We further filter the log-citations counts to mean with respect to the possible values assumed
build a Scientific Bipartite Network (SBN), re- by the variable dependent on the set x. Fixed
lating for each year the geographical areas on point values of the Fitness are finally normalized
one set with the research sectors in which they by a reference value, which is taken to be the
are competitive on the other set. To this end Fitness of United States at TL1 and that of Cal-
we use an index borrowed from the economics ifornia at TL2. Fixed point values of the Fitness
literature, the Revealed Comparative Advantage are finally normalized by a reference value, which
(RCA) [11], which measures competitiveness as is taken to be the Fitness of United States at TL1
the ability of an actor to perform an activity and that of California at TL2 (US06). The nor-
more that a reference level – the latter given by malization aims to regularize the heterogeneous
the global average performance of the selected distribution of Fitness among the years, enhanc-
activity. Applied to our case study, a geograph- ing the relative strength of the nations instead of
ical area is considered competitive in a research a global competitiveness. Note that we build two
sector if its RCA is above a threshold, typically kind of Fitness indicators: the Scientific Fitness
set to 1. In formula: based on log-citations counts of eq. (1), and the
P document Fitness when log-documents counts is
wgs . 0 wg 0 s used in its place.
RCAgs = P P g (2)
s0 wgs
0
g 0 s0 wg s
0 0 We quantify the degree of scientific inequality
12within a nation using the Gini coefficient esti- SBN, edited by the OECD. However, the recon-
mated on the dispersion of citation counts among struction at the lower scales is interpolated keep-
its regions [53] (in the Supporting Information ing constant the national performances, since the
we consider a version of the Gini coefficient that data presents more than 50% of missing entries.
takes population size into account). For our pur-
poses, the Gini index can be written as follows:
Pn
f (yi )(Si−1 + Si )
Data Availability
G = 1 − i+1
Sn The datasets generated and analysed during
Pi
where Si = j=1 f (yj )yj , S0 = 0, f (yi ) is the the current study are available in the Sci-
fraction of regions within the same country that entific database repository, https://efcdata.
has received at least yi citations, and yi < yj cref.it/.
whenever i < j.
We remark that the OAG database allows
obtaining the SBN at different levels of ge- Acknowledgements
ographic aggregations, ranging from the fine-
grained description of individual institutions to A.P. gratefully acknowledge funding received
the macroscale of regions and nations. In this from the Joint Research Centre of Seville (grant
work we focus on the macroscopic scale, in or- number 938036-2019 IT).
der to compare with previous literature of EFC
and Science-of-Science. Leveraging the OECD
Territorial Level Classification [31] we generate A Supporting Information
the SBN both at the Territorial Level 1 (TL1) Appendix (SI)
of nations (207 countries, following the nowa-
days world structure) as well as at the Territo- A.1 Coverage Soft Science / Hard
rial Level 2 (TL2), which includes 577 distinct
regions 6 in 43 countries (some of which are not
Science
OECD members). The Open Academic Graph (OAG) does not pro-
The expenditure database is based on the vide information on the uniformity of the cover-
available data collected by the OECD on the age of the different sectors and nations. Indeed, a
Gross Expenditure in Research and Develop- problem faced by others databases, such as SCO-
ments (GERD) indices [32]. The database cov- PUS, is that English-speaking and developed na-
ers 48 countries, i.e. all the OECD members and tions have a full coverage of the literature pro-
few other relevant nations for which the data is duced in all the scientific domains, from hard sci-
made available, such as China and Russia. How- ences to soft and social sciences, while the rest of
ever, the data’ quality depends strongly on na- the nations may have only a partial coverage, es-
tional features, and the HERD database imple- pecially in the soft sciences that are mostly writ-
mented in the analysis above is made available ten in national languages. This biases is not ad-
for 42 nations (among the OECD members on dressed by OAG but it can be estimated through
Colombia does not provide information of the ex- the computation of the ratio among the scien-
penditure). We implement a linear interpolation tific production in hard and soft sciences of the
reconstructing the missing points, At TL2, the nations. Defining soft sciences the set of FoS
database follows the same classification imple- sons of (Sociology, Political Science, Art, Busi-
mented by the derivation of the territorial level ness, Philosophy, History) and hard science the
6 There are in principle more than 700 regions but for others, OAG presents a language bias that can
some of them there is no affiliation found. be visualized in figure 5.
13Figure 5: The world map where the color-map correspond to the ration of the overall production
of the nations in soft science with respect to hard science.
A.2 Scientific Fitness — Economic lated well with the scientific success, it is pos-
Fitness sible to derive the same qualitative information
considering the gross expenditure, where simi-
The Scientific Fitness is a measure of compet- lar research systems clusters in the expenditure-
itiveness of the national and regional research Fitness diagram. Figure 7 indicate that the tra-
systems, as discussed in the main text. The sci- jectories of the developed nations follow the ones
entific competitiveness depends on the competi- shown in the main text. Remarkably, the larger
tiveness on the others sectors of innovations such difference with the HERD diagram relies on the
as the Economic Fitness [24, 33], since there is a position of China. Indeed, gap that China’s
strong interaction among them. However, there HERD has with respect to the developed nations
is no 1-1 relation among the different competi- can be partially explained by its higher amount
tiveness, as shown in figure 6. Indeed, high Eco- of GOVERD expenditures.
nomic Fitness usually translate to high Scientific
Fitness while the contrary is not found.
A.4 Inequality metrics with the in-
formation of the population
A.3 GERD versus Scientific Fit- size
ness
The inequality implemented in the main text
The scientific expenditure, collected by the is computed following the procedure discussed
OECD, is aggregated in the Gross Expenditure in [53]. However, the computation of the inequal-
in Research and Developments (GERD), avail- ity does not account for the different population
able for 42 nations. The database can be decom- density and the heterogeneity naturally available
posed in the Governmental expense (GOVERD), on the countries. Remarkably, the OECD col-
the Business part (BERD) and the Higher Ed- lect the data on the number of permanent re-
ucational part (HERD). Although HERD corre- searchers [32] that may be a good estimation of
14Figure 6: Trajectories of the nations in the diagram scattering the Scientific Fitness and the Eco-
nomic Fitness
Figure 7: Trajectories of nations (TL1, left panel) in the plane defined by Scientific Fitness and
resources invested, the latter measured by Gross Expenditures on R&D per capita (GERD-pc). Line
colors are used to group nations into macro-areas: dark blue for west EU nations (plus Switzerland,
Israel, Norway, Island), light blue for est EU nations, red for China, purple for middle-income
countries (Russia, South Africa, Mexico, Argentina, Chile), and green for the English-speaking
nations (United States, United Kingdom, Canada, Australia, New Zealand), and yellow for the
Asian nations (Singapore, South Korea, Japan). Trajectories represent data from 2000 to 2017,
with the arrow indicating the direction of time. The inset zooms on the top-right corner where
there is a concentration of highly competitive nations. Trajectories are also displayed for regions
(TL2, right panel) belonging to China and a selection of EU west, EU east and North America
nations. At last the central panel in the bottom displays the cross-correlation between Scientific
Fitness and GERD at the national scale (TL1) averaged over the whole set of countries as a function
of the temporal delay (∆ year) used to compute these quantities. The blue contour represents the
25 − 75% quantile, generated with a bootstrapping technique.
15the population size in the case of the scientific Fitness. Figure 9 shows the scatter plot of the
inequality. Figure 8 shows the bars of the Gini not normalized Fitness using the SBN based on
index as it is implemented in the main text and Scimago and OAG and the English-speaking na-
a weighted version, where the weight are propor- tions (green dots) is the only set not ling in the
tional to the sizes of the researcher’s population. main cluster of points. Removing the outliers,
The difference among the measure appears rel- there is a very good correlation between the Fit-
evant only in some developed nations while it is ness based on Scimago and on OAG. Remark-
does not modify the global picture. ably, the language bias found in OAG is less dom-
inant with respect to the bias of SCOPUS, in the
computation of the Scientific Fitness.
A.5 Comparison of OAG with
Scimago
A second source of data available for the con-
References
struction of the Scientific Bipartite Network is [1] C. A. Hidalgo and R. Hausmann. The build-
the database offered by Scimago [34]. This ing blocks of economic complexity. PNAS,
database is aggregated by Scimagolab using the 106, 2009.
data available from the SCOPUS [54] database,
collected by Elsevier. The Scimago database of- [2] A. Tacchella, M. Cristelli, G. Caldarelli,
fers the matrices of scientific performance (ci- A. Gabrielli, and L. Pietronero. Economic
tation counts and document productions among complexity: conceptual grounding of a new
the others) at the national level and implements metrics for global competitiveness. Jour-
the full counting statistics: each document as- nal of Economic Dynamics and Control, 37,
signs a unitary value at each nation having at 2013.
least an affiliation among the authors. Thus
each national value corresponds to the number of [3] E. Pugliese, G. Cimini, A. Patelli, A. Zac-
papers produced by researchers operating from caria, L. Pietronero, and A. Gabrielli. Un-
the nations, independently on the collaboration folding the innovation system for the devel-
sizes. opment of countries: co-evolution of science,
The scientific classification implemented on technology and production. Scientific Re-
the database is the All Science Journal Classifi- ports, 9, 2017.
cation (ASJC) [55], which gives at the finer level
327 codes, and it is based on the journal classifi- [4] G. Dosi, R. Nelson, and S. Winter. The
cation on which the scientific documents appear. nature and dynamics of organizational ca-
Thus, the classes does not depend directly from pabilities. Oxford University Press, 2000.
the context of the paper but rather on the topic
[5] F. Tria, V. Loreto, V. Servedio, and S. H.
of the journal, reducing the precision of the anal-
Strogatz. The dynamics of correlated nov-
ysis based on capabilities.
elties. Scientific Reports, 4, 2014.
Despite these aforementioned differences with
respect to the OAG database implemented in [6] Iacopo Iacopini, Gabriele Di Bona, Enrico
the main manuscript, the Scientific Fitness com- Ubaldi, Vittorio Loreto, and Vito Latora.
puted on the Scimago database does not dif- Interacting discovery processes on complex
fers from the one obtained from OAG, except in networks. Phys. Rev. Lett., 125:248301, Dec
the subset of the English-speaking nations. In- 2020.
deed, the English-speaking nations and primar-
ily the USA outperform the competitiveness of [7] Pierre-Alexandre Balland, Cristian Jara-
the other nations, collecting most of the global Figueroa, Sergio G. Petralia, Mathieu P. A.
16Figure 8: Comparison of the Gini index among the nations computed with and without the esti-
mation of the local number of permanent research as a measure of population size.
Figure 9: Comparison between the not-normalized Scientific Fitness (using OAG) and the Fitness
using Scimago. Each point is a country in a year between 2000 and 2010 and the color scheme is:
green are the English-speaking nations, blue are the EU nations, red is China. All the others are
in gray color.
17Steijn, David L. Rigby, and César A. Hi- [17] Giovanni Abramo and Ciriaco Andrea
dalgo. Complex economic activities concen- D’Angelo. A farewell to the mncs and like
trate in large cities. Nature Human Be- size-independent indicators. Journal of In-
haviour, 4(3):248–254, 2020. formetrics, 10(2):646–651, 2016.
[8] L. Waltman. A review of the literature on [18] Dag W. Aksnes and Gunnar Sivertsen. The
citation impact indicators. Journal of In- effect of highly cited papers on national cita-
formetrics, 10:365–391, 2016. tion indicators. Scientometrics, 59(2):213–
224, 2004.
[9] Santo Fortunato, Carl T. Bergstrom, Katy
Börner, James A. Evans, Dirk Helbing, [19] Benjamin M. Althouse, Jevin D. West,
Staša Milojević, Alexander M. Petersen, Carl T. Bergstrom, and Theodore
Filippo Radicchi, Roberta Sinatra, Brian Bergstrom. Differences in impact fac-
Uzzi, Alessandro Vespignani, Ludo Walt- tor across fields and over time. Journal
man, Dashun Wang, and Albert-László of the American Society for Information
Barabási. Science of science. Science, Science and Technology, 60(1):27–34, 2009.
359(6379), 2018. [20] R. Brito and A. Alonso Rodríguez-Navarro.
[10] Robert M. May. The scientific wealth of na- Research assessment by percentile-based
tions. Science, 275(5301):793–796, 1997. double rank analysis. Journal of Informet-
rics, 12:315–329, 2018.
[11] B. Balassa. Trade liberalisation and re-
[21] M. Montazerian, E.D. Zanotto, and H. Eck-
vealed comparative advantage. The manch-
ert. A new parameter for (normalized) eval-
ester school, 33(2):99–123, 1965.
uation of h-index: countries as a case study.
[12] D. King. The scientific impact of nations. Scientometrics, 118:1065—-1078, 2019.
Nature, 430:311—-316, 2004.
[22] M.S. Mariani, Z.-M. Ren, J. Bascompte,
[13] G. Cimini, A. Zaccaria, and A. Gabrielli. and C. J. Tessone. Nestedness in complex
Investigating the interplay between funda- networks: observation, emergence, and im-
mentals of national research systems: per- plications. Physics Reports, 813, 2019.
formance, investments and international [23] C. Cimini, A. Gabrielli, and F. Sylos Labini.
collaborations. Journal of Informetrics, The scientific competitiveness of nations.
10:200–211, 2016. PloS One, 9:12, 2014.
[14] Henry Laverde-Rojas and Juan C Correa. [24] A. Tacchella, M. Cristelli, G. Caldarelli,
Can scientific productivity impact the eco- A. Gabrielli, and L. Pietronero. A new met-
nomic complexity of countries? Scientomet- rics for countries’ fitness and products com-
rics, 120(1):267–282, 2019. plexity. Scientific Reports, 2, 2012.
[15] A. Patelli, G. Cimini, E. Pugliese, and [25] M. Cristelli, A. Gabrielli, A. Tacchella,
A. Gabrielli. The scientific impact of na- G. Caldarelli, and L. Pietronero. Measuring
tions on scientific and technological devel- the intangibles: A metrics for the economic
opment. Journal of Informetrics, 11:1229– complexity of countries and products. PloS
1237, 2017. One, 8, 2013.
[16] Giovanni Abramo and Ciriaco Andrea [26] M. Cristelli, A. Tacchella, and
D’Angelo. How do you define and mea- L. Pietronero. The heterogeneous dy-
sure research productivity? Scientometrics, namics of economic complexity. PLoS
101(2):1129–1144, 2014. ONE, 10:2, 2015.
18[27] Microsof Academic Division. [37] G. Sivertsen and Larsen B.. Comprehensive
https://www.openacademic.ai/oag/, 2019. bibliographic coverage of the social sciences
and humanities in a citation index: An em-
[28] J. Tang, J. Zhang, L. Yao, J. Li, L. Zhang, pirical analysis of the potential. Scientomet-
and Z. Su. Arnetminer: Extraction and rics, 91:567–575, 2012.
mining of academic social networks. In Pro-
ceedings of the Fourteenth ACM SIGKDD [38] F. Huang. Quality deficit belies the hype.
International Conference on Knowledge Nature, 564:S70–S71, 2018.
Discovery and Data Mining, pages 990–998, [39] Q. Xie and R. B. Freeman. Bigger than you
2008. thought: China’s contribution to scientific
publications and its impact on the global
[29] A. Sinha, Z. Shen, Y. Song, H. Ma, D. Eide, economy. China and World Economy, 27,
B. Hsu, and K. Wang. An overview of mi- 2019.
crosoft academic service (mas) and appli-
cations. In Proceedings of the 24th Inter- [40] An Zeng, Zhesi Shen, Jianlin Zhou, Jinshan
national Conference on World Wide Web, Wu, Ying Fan, Yougui Wang, and H. Eu-
pages 243–246, 2015. gene Stanley. The science of science: From
the perspective of complex systems. Physics
[30] Michael Färber. The microsoft academic Reports, 714-715:1–73, 2017. The Science of
knowledge graph: A linked data source with Science: From the Perspective of Complex
8 billion triples of scholarly data. ISWC’, Systems.
19:113–129, 2019.
[41] César A. Hidalgo. Economic complexity
[31] Oecd Centre for Entrepreneur- theory and applications. Nature Reviews
ship, Regions SMEs, and Cities. Physics, 3(2):92–113, 2021.
http://www.oecd.org/regional/regional- [42] Sven E. Hug and Martin P. Brändle. The
statistics/territorial-grid.pdf, 2020. coverage of microsoft academic: analyzing
the publication output of a university. Sci-
[32] https://data.oecd.org/rd/gross-domestic- entometrics, 113(3):1551–1571, 2017.
spending-on-r-d.htm.
[43] D. W. Aksnes, J. W. Schneider, and
[33] A. Patelli, L. Napolitano, A. Zaccaria, M. Gunnarsson. Ranking national research
G. Cimini, A. Gabrielli, and L. Pietronero. systems by citation indicators. A compara-
Jrc final report: Economic Fitness and tive analysis using whole and fractionalised
Complexity: an inquiry into the innovation counting methods, Journal of Informetrics,
and competitiveness of world regions, 2021. 6:36–43, 2012.
[44] Q. L. Burrel. The nth-citation distribution
[34] ScimagoLab. https://www.scimagojr.com/countryrank.php,
2020. and obsolescence. Scientometrics, 53, 2002.
[45] F. Radicchi, S. Fortunato, and C. Castel-
[35] A. Tacchella, D. Mazzilli, and L. Pietronero. lano. Universality of citation distributions:
A dynamical systems approach to gross do- toward an objective measure of scientific im-
mestic product forecasting. Nature Physics, pact. PNAS, 105, 2008.
14:861–865, 2018.
[46] M. Romeo, V. Da Costa, and F Bardou.
[36] A. Patelli, A.. Zaccaria, and L. Pietronero. Broad distribution effects in sums of log-
Universal database for economic complex- normal random variables. Eur. Phys. J. B,
ity, 2021. 32:513–525, 2003.
19[47] Matúš Medo, Giulio Cimini, and Stanis-
lao Gualdi. Temporal effects in the growth
of networks. Phys. Rev. Lett., 107:238701,
2011.
[48] Y. Eom and S. Fortunato. Characteriz-
ing and modeling citation dynamics. PLoS
ONE, 6, 2011.
[49] D. Wang, C. Song, and Barabási A.-
L. Quantifying long-term scientific impact.
Science, 342:127–132, 2013.
[50] Ruth Fairclough and Mike Thelwall. More
precise methods for national research cita-
tion impact comparisons. Journal of Infor-
metrics, 9(4):895–906, 2015.
[51] Matúš Medo and Giulio Cimini. Model-
based evaluation of scientific impact indi-
cators. Phys. Rev. E, 94:032312, 2016.
[52] E. Pugliese, A. Zaccaria, and L. Pietronero.
On the convergence of the fitness-
complexity algorithm,. Eur Phys. J.
Spec Top, 225:1893, 2016.
[53] Claudio Cozza and Francesco Schettino. Ex-
plaining the Patenting Propensity: A Re-
gional Analysis Using EPO-OECD Data,
chapter 10, pages 219–236. Springer Berlin
Heidelberg, 2015.
[54] Elsevier. https://www.scopus.com/.
[55] Elsevier. http://service.elsevier.com/app/answers/detail/a_.
20You can also read