Precocious Inventors: Early Patenting Success and Lifetime Inventive Performance - ZEW
←
→
Page content transcription
If your browser does not render page correctly, please read the page content below
// NO.21-041 | 05/2021

DISCUSSION
 PAPER
 // THERESA MICHLBAUER AND THOMAS ZWICK

Precocious Inventors: Early
Patenting Success and Lifetime
Inventive Performance
Precocious Inventors: Early Patenting Success
 and Lifetime Inventive Performance

 April 2021

 Theresa Michlbauer and Thomas Zwick1

Abstract

This paper shows that inventors with an early patenting success have a higher inventive productivity
during their remaining career. We use European patent data for a period of 32 years for 1240 German
inventors. The patent data are linked with survey data that provide information on an extensive list of
individual inventor characteristics and time variant information on work environment characteristics
for the same period. We define an early success as being in the fastest quartile of inventors applying
for the first patent after completing education or being in the highest quartile of citations received for
the first patent. The higher career productivity seems to be a consequence of higher individual ability
rather than cumulative advantage. Inventors with high productivity early in their career cannot
increase their productivity further but instead experience a regression to the mean. Inventors with a
fast or high-quality first patent also experience this regression, albeit at a lower rate. In addition, these
inventors do not obtain better resources, such as a higher share of research and development time,
larger employers, more voluntary job moves, or more co-inventors, during their remaining career than
inventors without early success.

Key Words Inventive Productivity, Early Patenting Success, Ability, Cumulative Advantage

JEL-Codes J24, M54, O31, O32

1
 Theresa Michlbauer, Chair for Human Resource Management and Organisation, University of Wuerzburg,
Sanderring 2, 97070 Wuerzburg, theresa.michlbauer@uni-wuerzburg.de.
Thomas Zwick, Chair for Human Resource Management and Organisation, University of Wuerzburg, Sanderring
2, 97070 Wuerzburg, thomas.zwick@uni-wuerzburg.de; ZEW – Leibniz Centre for European Economic Research,
Mannheim; Research Centre for Education and the Labour Market (ROA), Maastricht.

We are grateful to Karin Hoisl for many valuable comments on a previous version of this paper.
1 Introduction
It is hard to observe or predict inventor ability directly (Merton, 1973b; Dasgupta & David, 1994).
Therefore, individual characteristics formed before the start of the career of an inventor, such as
education level, family background, or personality traits, are usually used as predictors of future
inventive productivity (Dietz & Bozeman, 2005; Lawson & Sterzi, 2014). However, potential employers
cannot easily observe all of these individual characteristics and the predictive value of several
indicators may be limited for employers. For example, job applicants can manipulate personality tests
and information about their job motivation during their job interview (Robie et al., 2007).
Consequently, transparent and trustable achievements obtained before or during the first career years
may be more reliable indicators to assess individual ability and future productivity for potential
employers (Lazear, 1986). Identifying, attracting, and retaining young talents especially can be a
decisive advantage for enterprises that rely on innovations given that few inventors achieve a high
inventive productivity during their career (Lotka, 1926).

This paper proposes the time span between education and the first patent as well as the quality of the
first patent as indicators of inventive career productivity. The image of the young, great mind making
critical inventions is iconic (Simonton, 1988; Jones, 2010; Jones and Weinberg, 2011). In addition,
patented inventions are a carefully scrutinized and publicly observable form of creativity (Audia &
Goncalo, 2007) and a good indicator for inventive activity in those sectors that use patents (Griliches,
1990). Nevertheless, the informational value of the timing and quality of the first patent on lifetime
inventions has hardly been assessed.

In this paper, we establish that inventors whose time between completing their education and the first
patent application is in the first quartile of all inventors have a patent productivity per work year about
50% higher during their remaining career compared with other inventors. The inventive career output
after the first patent is about 20% higher for inventors whose first patent is in the top citations quartile.
We find a similarly large career productivity difference between inventors with and without early
patenting successes for the quality (measured by number of citations) of all patents after the first
patent. We finally show that the speed and quality of the first patent are independent predictors of
inventive productivity.

We also explore whether the speed and quality of the first patent are a sign of inventive ability or
whether the higher lifetime productivity of precocious inventors (Dietz & Bozeman, 2005, p. 354) is a
consequence of cumulative advantage (DiPrete & Eirich, 2008). Merton (1973a) proposed that early
patenting success may be an exogenous chance event that has positive long-term effects on inventive
productivity because it leads to the attribution of additional resources or rewards. Some observers
argue that the right-skewed distribution of inventive success is the consequence of cumulative

 2
advantage processes instead of ability differences between inventors (see, for example, the literature
review in Allison et al., 1982). However, the distributional shape of inventive success alone is not proof
of the presence of a cumulative advantage process. A right-skewed patent distribution also may evolve
when all inventors produce patents with a given production rate and do not obtain resources related
to previous successes. In other words, there may be a “skewed distribution of talent and tenacity”
instead of cumulative advantage (Huber, 1998, 2002).

We find that high productivity during the first career years does not lead to a stronger increase in
productivity in later career years; the productivity change actually is negative. This regression to the
mean effect in a random distribution (Stigler, 1997) is lower for precocious inventors. Nevertheless,
for these inventors, there is no indication of cumulative advantage. We also find no evidence for
concrete cumulative advantage mechanisms. Precocious inventors do not have a higher share of
working time devoted to research and development (R&D) activities, nor do they have a higher number
of co-inventors in later career years compared with the first career years. However, we find a good
match between the first employer and the precocious inventor. Fewer inventors with early success
voluntarily move to another employer later in their career.

We exploit the richness of a dataset that combines survey data for 1240 German academic and industry
inventors on their career between 1978 and 2010 with their complete patent history drawn from the
official PATSTAT patent data provided by the European Patent Office. The survey data comprise typical
curriculum vitae (CV) information and data on family background and personality. A unique calendar
function in the survey data allows us to observe the work environment and its changes during careers.
Thus, we can differentiate between the work environment during the first career years and later career
years and include many potential individual drivers of inventive career success beyond age, gender,
and education.

Our paper is structured as follows. Section 2 proposes individual ability and cumulative advantage as
explanations for the positive correlation between early patenting success and inventive career
productivity. Section 3 presents our data and the estimation strategy. Section 4 establishes that early
patenting success is significantly positively correlated with lifetime patenting productivity. Section 5
shows that cumulative advantage seems not to be a driver of the correlation between early success
and lifetime productivity. Our results and their potential implications are discussed in Section 6.

2 Theoretical Framework
Early Patenting Success as Indicator for Ability
There is information asymmetry about ingenuity between inventors and other labour market
participants (Greenwald, 1986). According to Spence (1976), a patent may be a signal for inventive
ability that reduces the information disadvantage of potential employers (Hoisl, 2007a, Melero et al.,

 3
2020). First, a patent is easily observable for everybody. For a patent to be issued, the invention must
be new, useful, and not obvious to persons reasonably skilled in the specific technology. This minimum
requirement is applied uniformly to all patents, and thus each patent has a minimum information value
on the inventive ability necessary to obtain it (Griliches, 1990; Huber, 1998). In addition, a substantive
conceptual contribution by the inventor is a legal requirement for an attribution on a patent and
violating this requirement may invalidate the patent (Häussler & Sauermann, 2013). Consequently, the
signalling value can be transferred to all inventors listed on a patent. Second, it is costly and time-
consuming to reach the frontier of knowledge in a field, a necessary component of innovative activity
(Jones, 2009; 2010). There is also a negative relationship between the human capital investments
necessary to obtain a patent and the inventor’s ability (Melero et al., 2020). Finally, there is a strong
incentive to apply for a patent for a suitable inventive idea because a fixed amount of financial income
from patents is typically shared among all listed inventors (Häussler & Sauermann, 2013).

Inventive activity is frequently a contest of priority of discovery. Speed in patenting is rewarded
because usually only the first scientist gets the reputation and rewards for an inventive idea (Merton,
1973a; Dasgupta & David, 1994). Early patenting success is costlier for less able inventors because it is
harder for them to speed up the invention. Young inventors in particular need time to acquire the
necessary background knowledge and cannot spend the time needed for training or education on their
inventive project (Jones, 2010). Higher innate talent and the mindset required for further inventions
allow inventors to complete the patenting process faster than their peers (Dietz & Bozeman, 2005).
Therefore, we assume that:

Hypothesis A1: Inventors who apply for their first patent faster than their peers have a higher inventive
performance for the remainder of their career.

Reputation and economic value of a patent increase with the number of references made to it, typically
calculated by forward citations in other patents or scientific work (Trajtenberg, 1990; Henderson et al.,
1998; Harhoff et al., 1999; Hall et al., 2005; Sapsalis et al., 2006; Gambardella et al., 2008; Czarnitzki et
al., 2009; Czarnitzki et al., 2012). In addition to the age of the inventor at the application date, the
technological importance of a patent can easily be measured after several years by its number of
citations (Häussler et al., 2014). Thus, we assume that an inventor obtaining many citations for a first
patent signals higher inventive capacity. The positive reputation effect of a highly cited patent may be
especially strong for the first patent because young inventors typically are not in a high hierarchical
position and have short professional experience. Attribution on patents indicating a contribution to
the inventive process is positively related to seniority and hierarchical position (Lissoni & Montobbio,
2014). Our second hypothesis is:

 4
Hypothesis A2: Inventors whose first patent is of higher quality than their peers have a higher inventive
performance for the remainder of their career.

Speed and high quality of the first patent may be substitutes. Jones (2010) pointed out that young
inventors must decide how to divide their time between education or training and inventive activity.
If they spend more time working on their inventive idea, this may allow them to apply for the first
patent sooner, but reduce the technological importance of the first patent. Therefore, we assume that
few inventors who apply for their first patent quickly also obtain many citations for their first patent
and that:

Hypothesis A3: Fast first patent and high-quality first patent have an independent correlation with
inventive performance for the remainder of the career.

There is a rich body of literature on determinants of inventive productivity (for example, Huber, 1998;
Hoisl, 2007a,b; Giuri et al., 2007; Mariani & Romanelli, 2007; Walsh & Nagaoka, 2009; Toivanen &
Vaananen, 2012; Zwick et al., 2017). However, we are aware of only three papers that analyze the
quality of early career achievements as predictors of inventive career productivity.2 Audia & Goncalo
(2007) showed that previous inventive success leads to a higher probability of generating further
inventions. They argued that the inventions after past successes are more frequently characterized by
exploitation of earlier ideas instead of exploration of new ideas. However, patents based on
exploitative ideas receive fewer citations, and thus have lower economic value and inventive quality
than patents based on explorative ideas (Harhoff et al., 1999; Gambardella et al., 2008). Dietz &
Bozeman (2005) analyzed CV information merged with patent data of 1200 research scientists and
engineers working for the US Department of Energy, Department of Defense, and National Science
Foundation. They found that scientists who have many publications before obtaining their doctoral
degree have a higher number of patents per career year on average. Finally, Lawson & Sterzi (2014)
looked at the patenting record of more than 500 British academic inventors. Based on CV information,
they showed that the number of citations the first patent receives is the most important predictor for
the number of patents an academic inventor obtains during their career, although the number of
citations does not affect overall patenting productivity. They concluded that a high-quality first
invention signals a high overall career output for an individual inventor.

The differences in the results among these three papers may come from several sources. Audia &
Goncalo (2007) did not only look at the first patent of an inventor, but also analysed the relationship
between patenting success over a period of 2 years and patenting behaviour in the following years,

2
 The early literature on the impact of early success on productivity shows that more productive scientists and
inventors start their career earlier (Manis, 1951; Zuckerman, 1967; Blackburn et al., 1978). Another persistent
finding is that higher inventive productivity during the first career years is correlated with higher productivity in
the following career years (Meltzer, 1949; Lightfield, 1971; Clemente, 1973; Reskin, 1977).
 5
irrespective of the state of the career. Their results came from patents in the hard disk drive sector, a
nascent technology sector during the period they observed. Dietz & Bozeman (2005) and Lawson &
Sterzi (2014) concentrated on the small and probably specific sub-group of academic inventors.
Consequently, the results of all three papers may not be easy to generalize.

Early Patenting Success as Trigger for Cumulative Advantage
We postulate that early patenting success signals individual inventive ability. However, inventors with
early patenting success may also profit from cumulative advantage, as explained in Merton’s famous
definition of the Matthew effect: “the accruing of greater increments of recognition of particular
scientific contributions to scientists of considerable repute and the withholding of such recognition
from scientists who have not yet made their mark” Merton (1973b, p. 446). Cumulative advantage
means that early success attracts new resources as well as rewards. Given the uncertainty about the
ability and motivation of inventors, employers attribute more scarce resources to inventors with an
early success. The additional resources facilitate continued higher performance given the ability of the
inventor (Owen-Smith & Powell, 2001; DiPrete & Eirich, 2008). In the extreme case, cumulative
advantage completely explains higher career productivity instead of ability. In other words, lucky
inventors can turn fortuitous early patents into lasting inventive productivity advantages (Cole & Cole,
1967; Allison et al., 1982).

Cumulative advantage can be shown empirically if high inventive productivity during the first career
years positively correlates with inventive productivity during the remainder of the career. Our first
cumulative advantage hypothesis is:

Hypothesis CA1: Inventive productivity during the first career years is positively correlated with the
increase in inventive productivity in the remainder of the career.

DiPrete & Eirich (2008) posited that a small advantage during the early stage of the inventive process
means that inventors have a long-term positive productivity effect in a cumulative advantage process.
Thus, we assume that precocious inventors have an even steeper productivity trajectory between first
career years and their remaining career. In other words, high early productivity leads to stronger
cumulative advantage if the first patent is fast and high quality. We also assume that a fast patent and
a high-quality first patent have an independent additional effect on cumulative advantage as posited
in hypothesis A3:

Hypothesis CA2: The positive correlation between inventive productivity during the first career years
and inventive productivity during the remainder of the career is stronger for inventors with a fast first
patent.

 6
Hypothesis CA3: The positive correlation between inventive productivity during the first career years
and inventive productivity during the remainder of the career is stronger for inventors with a high-
quality first patent.

Hypothesis CA4: The higher positive correlation between inventive productivity during the first career
years and inventive productivity during the remainder of the career is independent for inventors with
a fast patent and for inventors with a high-quality patent.

Cumulative advantage can not only be tested by the correlation between early career productivity and
the inventive productivity during the remaining career, but it also can be shown when the employer
attributes additional resources to inventors with high early productivity (Owen-Smith & Powell, 2001;
Toivanen & Väänänen, 2012). Precocious inventors may have a better chance of working on R&D
projects later in their career, and they are encouraged to invest time in research instead of
management or organisation tasks (Merton, 1973a). This cumulative advantage mechanism assumes
that employers put their best researchers on the most promising inventive projects and grant them
enough time and resources to complete these projects (Zucker et al., 1998, 2002). Therefore, we
assume:

Hypothesis CA5: Early patenting success is positively correlated with the share of the working time an
inventor can spend on R&D tasks in later career years.

According to the signalling theory described above, outside employers can also observe precocious
inventors easily (Melero et al., 2020). Their visibility increases the likelihood of being poached or
moving voluntarily to another employer to improve job matching (Lazear, 1986). Job mobility may
increase individual productivity because it allows employees to increase the quality of their job match,
exchange their knowledge, build more experience, and enlarge their research network (Song et al.,
2003; Dietz & Bozeman, 2005; Hoisl, 2007a). Especially if the new employer offers a better research
environment, an employer move increases individual career productivity (Crane, 1965; Cole and Cole,
1967; Long, 1978). The quality of the research environment may be measured by the number of
patents an employer has applied for (Czarnitzki et al., 2012; Mariani & Romanelli, 2007; Chabchoub &
Niosi, 2005; Harhoff & Hoisl, 2010; Mansfield, 1986; Scherer, 1999; Lawson & Sterzi, 2014). Our next
two hypotheses are:

Hypothesis CA6: Early patenting success is positively correlated with the probability of moving
voluntarily to another employer in later career years.

Hypothesis CA7: Early patenting success is positively correlated with the probability of moving to an
employer with a stronger research orientation in later career years.

 7
Inventors with an early patent success may also benefit from better research co-operation options
with other inventors (Baldini et al., 2007). There is empirical evidence that high-impact scientists enjoy
more extensive exchange and better co-operation options with other inventors. Owen-Smith & Powell
(2001) suggested that academic inventors with high-quality patents attract more consulting jobs and
research contracts that allow them to improve their research network. Thus, we assume that early
patenting success allows inventors to increase the number of co-operators. However, a larger research
network results in higher inventive productivity because inventors can share or recombine their
knowledge (Crane, 1972; Allen, 1979; Simonton, 1992, 2003; Dunbar, 1995; Breschi & Lissoni, 2009;
Dietz & Bozeman, 2005; Jones, 2009). Our last cumulative advantage hypothesis is:

Hypothesis CA8: Early patenting success is positively correlated with the number of co-inventors in
later career years.

The empirical literature on the role of cumulative advantage for the productivity of inventors is
tenuous and equivocal, see for example the literature reviews by Allison et al., (1982) and DiPrete &
Eirich (2008). Sociological papers mainly show an increase in inequality in publications and citations
over the life cycle of the entire population or certain birth cohorts of scientists, compare Crane (1965,
1972), Cole & Cole (1967), and Allison and Stewart (1974). These papers do not show concrete
cumulative advantage mechanisms, such as the attribution of resources to scientists with previous
successes (DiPrete & Eirich, 2008). These works may also suffer from the compositional fallacy
(Simonton, 1997). The compositional fallacy describes aggregation errors if inferences about individual
experience–productivity patterns are derived from average statistics across many individuals. The
resulting patterns may, for example, be biased if more productive inventors are active longer in R&D
than less productive inventors (Huber, 2002). Hence, the scientometrics literature proposes testing
directly whether inventors with early successes have a higher productivity rate during the rest of their
career (Lotka, 1926; Levine, 1986). The only paper with a direct cumulative advantage test based on
individual inventor productivity measures does not find evidence for a cumulative productivity
advantage during the career (Huber, 1998).

3 Methodology and Data
Methodology

We measure the correlation of the speed and the quality of the first patent with inventive output
during the remaining career and additionally control for the relevant individual and work environment
characteristics when the first patent is applied for. Our empirical model is

 = 1 1 + 2 ℎ ℎ 1 + ` 1 + . (1)

 8
To avoid heterogeneity, career output Yitc is measured for the entire career (c) excluding the first patent
(p1). Early patenting success is denoted by the dummy variables fast and highquality based on the
speed and quality of the first patent. Variable Xip1 denotes a vector of control variables for individual
characteristics and the inventor’s work environment when the first patent was applied for. Variable ɛ
is the idiosyncratic error term. Our identification strategy assumes that there are no unobserved
factors that are correlated with early patenting success and overall inventive career productivity after
the first patent. Therefore, we include a broad range of individual and work environment factors.

In our next estimation step, we check whether there is a positive correlation between inventive
productivity during the first career years, t1, and inventive productivity during the remainder of the
career, t2, that can be explained by cumulative advantage. We use a differential equation of
exponential growth (Yule process) as a formal empirical test of the presence of cumulative advantage3,

 Yit2 – Yit1 = βYit1 + δ´Zit1 + ꞓit1, (2)

with Zit1, which is a vector of resources available for the inventor during the first career years.
Cumulative advantage means that a high productivity during t1 (Yit1) increases the difference in
productivity between t1 and the remainder of the career, t2 (Yit2 - Yit1). Hence, cumulative advantage
implies a positive slope parameter, β. If, according to hypotheses CA2–CA4, precocious inventors enjoy
a stronger cumulative advantage, this can be measured by higher β values for inventors with early
patenting success.

In a final estimation step, we analyse actual cumulative advantage mechanisms according to our
hypotheses. We use difference-in-differences estimations that show whether inventors with early
patenting success enjoy a better attribution of resources during the remainder of their career.
Specifically, we check whether the share of R&D activities during working time, the size of the patent
applicant, the probability of a voluntary job match, and the number of co-inventors increase more
strongly from t1 to t2 for inventors with an early success. The changes in resources are calculated
separately for the four dimensions of indicator Z. We include indicators for resources available for the
two periods t = t1, t2 for each inventor and control for individual fixed effects γi besides the interaction
terms between the early success indicators and t2 as well as a dummy for t2.

 = 1 ∗ 2 + 2 ℎ ℎ ∗ 2 + 3 2 + + . (3)

Cumulative advantage for inventors with an early success predicts positive coefficients β1 and β2.

3
 This test was proposed by Allison et al. (1982), also compare equation (3) in DiPrete & Eirich (2008).
 9
Data

Our dataset combines patent data and individual survey data. The patenting activity of the inventors
is measured using PATSTAT data for patents of German inventors filed between 1978 and 2010 at the
European Patent Office. The patent data include the first filing date of a patent on a daily basis, the
status of the patent application, number of co-inventors, number of forward citations per patent
received during a specific time period, type of patent applicant, and technology sector. The application
date of the first patent4 determines individual age at first patent and the number of years since
obtaining the highest educational degree (derived from the inventor survey).

The patent data are merged with survey data that contain the highest educational grade, social
demographics, and personality traits.5 We use a calendar function in the survey to describe changes in
the work environment during the career. The calendar captures key career characteristics during five-
year spells between 1965 and 2014. As our patent information ranges from 1978 to 2010, seven spells
from the calendar can be used.6 According to our estimation strategy, we differentiate between the
first career years in which the first patent was applied for (t1) and all following active periods (t2). We
define as the last (observable) career period the period in which the inventor reaches age 65, the
period with the last observable patent for those 41 inventors who applied for patents when they were
older than 65 years, or the period 2005–2010. Thus, the number of periods included in t2 depends on
the application date of the first patent. On average, inventors report for 2.3 calendar periods (11.5
years) after t1. In other words, we can observe the work environment for on average 3.3 periods or
16.5 years. The distribution of the observed number of calendar periods is shown in Table A1.

We calculate career productivity in equation (1) by dividing the number of patents and their citations
by the number of career years c (last career year minus year after the first patent application). In the
cumulative advantage equations (2) and (3), we compare average inventive productivity and resources
for t1 and t2. The periodicity of t1 and t2 comes from the mainly 5-year periods given in our calendar.
Five-year brackets are useful for measuring inventive productivity to examine differences in inventive
productivity over time because patents tend to be applied for in waves (Huber, 1998; Hoisl, 2007b).
There is a high risk of measurement errors incurred by attrition bias with shorter productivity
measurement brackets, for example, single years. Accordingly, most papers measure inventive
productivity and its changes in time brackets of between 4 and 10 years (see the literature survey in
Zwick & Frosch, 2017).

4
 No inventor had applied for more than one patent on the day of the first patent application. Therefore, we can
determine the first patent with certainty.
5
 For details of the data collection and matching process, see Frosch et al. (2014) and Zwick et al. (2017).
6
 The seven spells are 1978–1979; 1980–1984; 1985–1989; 1990–1994; 1995–1999; 2000–2004; and 2005–2010.
 10
The patent data are from an administrative source. Thus, we have robust, non-biased information on
patent quantity and quality.7 We use the patent data as the source for the dependent variable in
equations (1) and (2) as well as for estimating the number of co-inventors and the applicant size in
equation (3). Early inventive success is measured by aggregating the patent information over all
inventors. Almost all additional information used as dependent variables comes from the survey data.
Therefore, we can rule out a common method bias. Information on the educational and family
background can be assumed plausibly to pre-date the start of the career, even though the information
was collected at the end of the observation period. However, some survey information on personality
traits, such as self-assessment on risk taking, might not reflect the situation at the time of the first
patent.8

There are 1851 inventors in the data set. For the 298 inventors who started their career before 1978,
the first patent cannot be identified with certainty in the dataset and these inventors are excluded
from the dataset. In addition, we only know the year in which the highest educational degree was
obtained for 1492 inventors. From this group, 252 inventors only applied for one patent in their
recorded PATSTAT patenting activity. They are excluded from our estimations to allow the effect of
the first patent on later career productivity to be identified.9 Consequently, our basic sample consists
of 1240 inventors (67% of the original sample).10

Inventive Productivity

In line with the literature (Trajtenberg, 1990; Albert et al., 1991; Harhoff et al., 1999; Bakker et al.,
2016; Hoisl, 2007b), quantitative and qualitative measures of patent productivity are used. To account
for differences in the career length between more and less prolific inventors (Huber, 2002), the
productivity measures are standardized by years of job experience, and thus are independent of total
career length (Huber, 1998; Dietz & Bozeman, 2005).

Patent quantity: Patent quantity is measured by the total number of patents applied for per inventor
minus the first patent divided by the number of career years, c, after the first patent in the productivity
equation. In the cumulative advantage regressions, patent quantity is measured by the total number

7
 In contrast to other studies, we cannot exclude potential self-citations at inventor level. This might imply that
some results for patent quality are overestimated.
8
 There remains, as in any survey data, the risk of measurement errors.
9
 We also have to exclude one inventor who applied for all (two) patents within one 5-year period. All remaining
inventors have at least one patent in at least one period after the first application period.
10
 According to our hypothesis that early patenting success is a good predictor of future inventive productivity,
inventors with only one patent less frequently had an early success with it (the share with a fast dummy is 19%
and the share with a high-quality dummy is 21%).
 11
of patents applied for per inventor in t1 and in t2, respectively, divided by the period lengths of t1 and
t2.

Patent quality: We use forward citations of patents within 5 years of its filing to measure the quality
of a patent (Trajtenberg, 1990; Albert et al., 1991; Harhoff et al., 1999; Lawson & Sterzi, 2014; Bakker
et al., 2016). Our measure for patent quality is the total sum of citations without the citations of the
first patent divided by c in the productivity estimations. In the cumulative advantage regressions, the
sum of the citations of all patents applied for during t1 and t2 is divided by the period lengths of both
periods.

Early Patenting Success

High-quality first patent: We define a high-quality first patent as a dummy that is 1 if the first patent
is among the best 25% first patents of our sample, ranked by the total number of forward citations
(within 5 years of filing).

Fast first patent: We define a first patent as being filed fast if an inventor belongs to the 25% fastest
inventors in our sample to file the first patent after obtaining the highest degree of education. We use
the time span between the end of education and first patent instead of age to include the trade-off
between education and inventive effort as well as differences in educational attainment (Jones, 2010).

Control Variables

We control for gender differences because career strategies and inventive productivity may differ
between men and women (Jung & Ejermo, 2014; Hunt et al., 2012; Ding et al., 2006; Whittington,
2011; Whittington & Smith-Doerr, 2005; Frietsch et al., 2009; Naldi et al., 2005). We also use controls
for birth cohorts because patenting behaviour may have changed over the years, given the patent
explosion (Hall, 2004; Lawson & Sterzi, 2014) and the increase in average age at first patent (Jones,
2009). The strong increase in the number of patent applications during the last decades and the
increasing burden of knowledge in many technology areas may imply a difference in the chance of
patenting an inventive idea within 5 years of obtaining the highest education in the year 1980 or in the
year 2000 (Levin & Stephan, 1991; Jones, 2009; Jones, 2010; Allen & Katz, 1992; Simonton, 1988;
Harhoff & Wagner, 2005; Dietz & Bozeman, 2005). We also control for education level because a higher
education, particularly a PhD degree, increases inventive productivity (Hoisl, 2007a; Mariani &
Romanelli, 2007; Onishi & Nagaoka, 2012; Toivanen & Väänänen, 2016; Giuri et al., 2007; Akcigit et al.,
2017). An engineering specialisation during schooling may be a boon for inventive output (Gruber et
al., 2013). Therefore, we include a dummy variable for inventors who have an engineering
specialisation in their academic education or a technical occupation for those without academic
 12
training. In addition, family background may influence inventive productivity; academically educated
parents may foster an inventor’s achievement (Caldas & Bankston, 1997). Hence, we include dummy
variables that have a value of 1 if an inventor has a father or a mother with academic education,
respectively.

Previous studies on inventive output find a relationship between personality traits and inventive
performance (Dodds et al., 2002). Particularly the personality dimension openness to new experiences
is positively related to innovative output (McCrae, 1987; King et al., 1996; Furnham & Bachtiar, 2008;
Sung & Choi, 2009; Silvia et al., 2009; Furnham et al., 2011; Furnham et al., 2013; Lin et al., 2013; Grosul
& Feist, 2014; Batey et al., 2010; Zwick et al., 2017). We include the big 5 personality inventory
(openness to experience (ideas, aesthetics), agreeableness (compliance, straightforwardness),
conscientiousness (order, dutifulness, competence), extraversion (warmth, sociability, activity), and
neuroticism (anxiety, depression), compare McCrae and Costa, 2006) as explanatory variables.
Willingness to take risks also is a personality characteristic often related to inventive performance, and
thus is controlled for in this paper (Dewett, 2007; Audia & Goncalo, 2007; Zwick et al., 2017).

Although individual characteristics are key for inventive productivity, the employer is also an important
determinant of patenting success (Gambardella et al., 2008; Lawson & Sterzi, 2014). Therefore, we
control for the share of working time the inventor can devote to R&D activities, the number of co-
inventors, the size of the employer, and a voluntary job move. In addition, we control for the employer
type because it may make a difference whether the inventor works for a private firm, a university, or
a public research institute (Dietz & Bozeman, 2005; Van Looy et al., 2006; Zucker et al., 2007; Crescenzi
et al., 2017).

The literature is unclear whether basic or applied research activities have a stronger positive
relationship with inventive productivity (Mansfield, 1980; Griliches, 1986; Lichtenberg & Siegel, 1991).
Specific knowledge contributes to innovation and generalist knowledge facilitates recombination of
ideas. Previous research also shows ambiguous results on whether working as a specialist or as a
generalist is related to a higher inventive productivity (Jones, 2009; Melero & Palomeras, 2015). We
control for the type of research activities an inventor pursues. Technology fields have different R&D
and patenting activity levels (Klevorick et al., 1995; Gruber et al., 2013; Mansfield, 1986; Levin et al.,
1987). Therefore, we control for the main technology sector in which an inventor is active. Following
Griliches (1990) and Hoisl (2007a, 2009), we also control for the status of the patent application, which
may be pending, refused, withdrawn, or granted.

 13
4 Early Patent Success and Inventive Performance
Descriptive Statistics

Table 1 shows that during the career, an inventor in our sample files 0.61 patent applications per
working year and obtains 0.55 citations per working year. The share of male inventors is 97.7%11.
Around 92% of inventors in the dataset hold an academic degree including a PhD. More than two thirds
of the inventors are engineers. About 10% of the inventors’ mothers and 24% of the inventors’ fathers
have an academic degree. When filing their first patent, inventors are on average nearly 40 years old12
(not shown in the descriptive statistics).

11
 The small share of 2.3% females is in line with other studies (Jung & Ejermo, 2014; Hunt et al., 2012).
12
 This value is close to the 41.4 years reported for the first patent of Swedish inventors (Jung & Ejermo, 2014).
 14
Variables Mean SD Median Description
Inventive output
Patent quantity 0.606 0.841 0.353 Total numbers of patents per inventor (1978–2010), divided by number of working
 years
Patent quality 0.547 1.126 0.160 Total numbers of citations per inventor (1978–2010), divided by number of working
 years
Early inventive success
High-quality first patent 0.289 0.453 0 Dummy = 1 if the first patent is cited at least twice within 5 years of filing
Fast first patent 0.321 0.467 0 Dummy = 1 if the first patent is filed within 4 years of obtaining the highest
 educational degree
Individual background
Male 0.977 0.150 1 Dummy = 1 if inventor is male
Vocational education 0.080 0.271 0 Dummy = 1 if highest level of education is vocational education
Academic education 0.544 0.498 1 Dummy = 1 if highest level of education is academic education
PhD 0.376 0.485 0 Dummy = 1 if highest level of education is PhD
Education with engineering 0.690 0.463 1 Dummy = 1 if the inventor has an educational background in engineering
specialisation
Mother academic 0.100 0.300 0 Dummy = 1 if mother is academic
Father academic 0.235 0.424 0 Dummy = 1 if father is academic
Personality
Positive risk attitude 0.392 0.488 0 Dummy = 1 if self-assessed risk attitude 7 or higher on scale between 0 and 10
Big 5 extraversion 49.60 15.43 49.37 Factor from factor analysis on 15 questions on personality traits
Big 5 neuroticism 49.51 11.11 48.80 Factor from factor analysis on 15 questions on personality traits
Big 5 openness to new ideas 49.56 18.58 50.41 Factor from factor analysis on 15 questions on personality traits
Big 5 agreeableness 50.36 12.08 49.88 Factor from factor analysis on 15 questions on personality traits
Big 5 conscientiousness 50.35 11.83 50.93 Factor from factor analysis on 15 questions on personality traits
Work environment first patent
Generalist work experience 0.667 0.472 1 Dummy = 1 if inventor worked as a generalist
Applied R&D 0.831 0.375 1 Dummy = 1 if inventor worked in applied R&D
Basic R&D 0.131 0.338 0 Dummy = 1 if inventor worked in basic R&D
Intensive R&D work 0.637 0.481 1 Dummy = 1 if share of R&D work is more than half of the working time
Applicant size 1–24 0.285 0.451 0 Dummy = 1 if applicant with 1–24 patents
Applicant size 25–249 0.283 0.451 0 Dummy = 1 if applicant with 25–249 patents
Applicant size 250–999 0.136 0.343 0 Dummy = 1 if applicant with 250–999 patents
Applicant size 1000+ 0.125 0.331 0 Dummy = 1 if applicant with 1000+ patents
Applicant firm 0.947 0.225 1 Dummy = 1 if applicant private company
Applicant university or public research 0.040 0.197 0 Dummy = 1 if applicant university/research institute
institute
Applicant individual 0.013 0.113 0 Dummy = 1 if individual applicant
Number of co-inventors 0 0.121 0.326 0 Dummy = 1 if number of co-inventors is 0
Number of co-inventors 1 0.206 0.404 0 Dummy = 1 if number of co-inventors is 1
Number of co-inventors 2–3 0.402 0.491 0 Dummy = 1 if number of co-inventors is 2–3
Number of co-inventors 4+ 0.271 0.445 0 Dummy = 1 if number of co-inventors is 4+
First patent is refused 0.173 0.378 0 Dummy = 1 if patent application of first patent is refused
First patent is granted 0.601 0.490 1 Dummy = 1 if patent application of first patent is granted
First patent is pending 0.212 0.409 0 Dummy = 1 if patent application of first patent is pending
First patent is withdrawn 0.015 0.120 0 Dummy = 1 if patent application of first patent is withdrawn
Birth cohorts
Birth year after 1970 0.208 0.406 0 Dummy = 1 if inventor was born after 1970
Birth year 1966–1970 0.234 0.423 0 Dummy = 1 if inventor was born between 1966 and 1970
Birth year 1961–1965 0.248 0.432 0 Dummy = 1 if inventor was born between 1961 and 1965
Birth year 1956–1960 0.174 0.379 0 Dummy = 1 if inventor was born between 1956 and 1960
Birth year before 1956 0.135 0.342 0 Dummy = 1 if inventor was born before 1956
Technology fields first patent
Electrical engineering 0.088 0.284 0 Dummy = 1 if main field of technology is electrical engineering
ICT 0.015 0.122 0 Dummy = 1 if main field of technology is ICT
Semiconductors 0.027 0.161 0 Dummy = 1 if main field of technology is semiconductors
Instruments 0.018 0.134 0 Dummy = 1 if main field of technology is instruments
Chemical industry 0.058 0.234 0 Dummy = 1 if main field of technology is chemical industry
Pharma/biotechnology 0.021 0.143 0 Dummy = 1 if main field of technology is pharma/biotechnology
Chemical and process engineering 0.063 0.243 0 Dummy = 1 if main field of technology is chemical and process engineering
Transportation/engines 0.255 0.436 0 Dummy = 1 if main field of technology is transportation/engines
Consumption 0.021 0.143 0 Dummy = 1 if main field of technology is consumption
Mechanical engineering/machinery 0.101 0.301 0 Dummy = 1 if main field of technology is mechanical engineering/machinery
Mechanical elements 0.086 0.280 0 Dummy = 1 if main field of technology is mechanical elements
Nanotechnology 0.047 0.211 0 Dummy = 1 if main field of technology is nanotechnology
Clean technology 0.098 0.298 0 Dummy = 1 if main field of technology is clean technology
Other technology fields 0.103 0.304 0 Dummy = 1 if main field of technology is other technology fields
Table 1: Variable descriptions and descriptive results (n = 1240). SD: standard deviation; ICT: information and communications
 technology.
 15
Less than 30% of the inventors have a first patent that was cited more than twice within 5 years, and thus qualify for our first indicator of early success. More than 30% of the inventors are in the fastest quartile of inventors who applied for their first patent within 4 years of obtaining their highest education degree. The Big Five personality dimensions of an inventor are measured on a 15-item short version of the Big Five inventory (7-point Likert scale; compare Schupp & Gerlitz, 2014). The five personality dimensions are aggregated by a principal components factor analysis with varimax rotation (negatively defined items are rescaled; compare Zwick et al., 2017). About 40% of the inventors opt for a score of 7 or higher on a Likert scale that ranges from 0 (highly risk averse) to 10 (highly risk seeking) (compare Dohmen et al., 2011). The first patent of an inventor is filed on average with about three co-inventors (the maximum is 24 co-inventors). For first patents, 60% are granted, around 21% are pending, fewer than 18% are refused, and the rest are withdrawn by the applicant. The first patent applicant is almost always a private firm (95%). Most of the inventors in our sample work in applied R&D instead of basic R&D when they apply for their first patent (83%). About 64% of the inventors report an R&D working time share of more than half. The ratio of inventors who are specialists to those who are generalists is about 1:2 when they file their first patent Figure A1 shows that the number of patents and their citations per inventor are right-skewed. These results are consistent with findings in other studies on patenting success (Huber, 1998; Toivanen & Väänänen, 2012, 2016; Azoulay et al., 2010). Consequently, the individual shares of the total number of patents and citations closely match Lotka’s law.13 The skewed distribution of the dependent variables requires a negative binomial model (count model) (Allison et al., 1982; Huber, 2002). Therefore, we use a Poisson regression model14 with parameter λ (Baruffaldi et al., 2016; Sapsalis et al., 2006) and our estimation equation (1) is written as Yit2 Poisson(μ*i) μ*I = exp(γ´Yi + ui) exp(ui) Gamma(1/α, 1/α), 13 Lotka’s law can be expressed as pn = p1/nk, where pn is the proportion of inventors with n patents in all inventors, p1 is the number of inventors with one patent, and k is a constant (Huber, 2002). The goodness of fit values, R2, for all regressions on the distributional form of our sample are higher than 0.94. Thus, the empirical distributions closely match the theoretical distributions for the number of patents and their citations. 14 Our dependent variables fit a Poisson distribution according to a Chi2 goodness of fit test (Table A2). A Jacques- Bera and a Shapiro-Wilk-test for normal distribution indicate significant deviations of our dependent variables from a normal distribution. 16
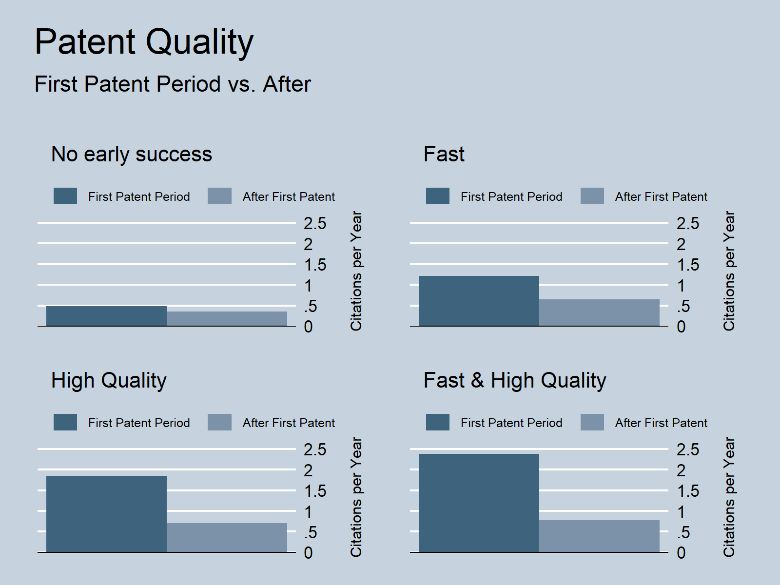
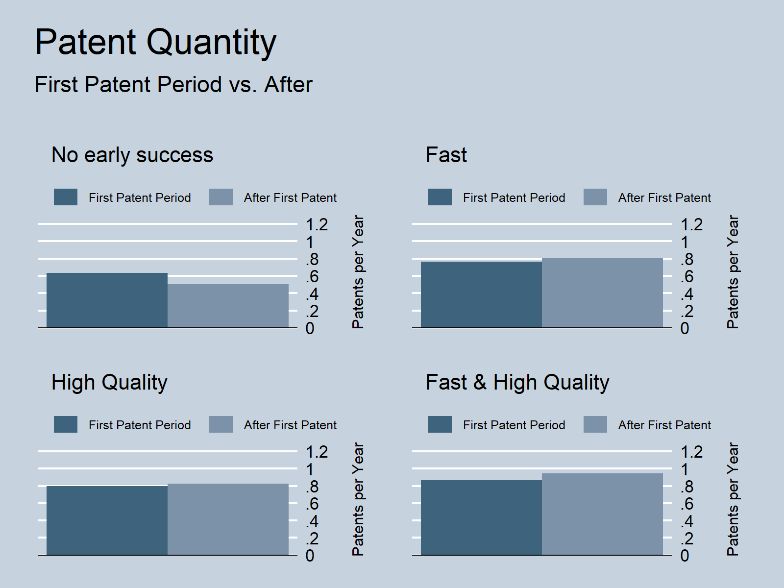
where γ is the vector of parameters associated with the vector of explanatory variables Yi (Xip1, fast
and highquality) and α is the overdispersion parameter. The econometric model of the inventive
productivity estimation is

 ̂ = exp( 1 1 + 2 ℎ ℎ 1 + ` 1 + ), (4)

where ̂ is the estimator of the Poisson parameter.

Tables A3a and A3b summarize the correlations between the most important variables. Our two
indicators for early inventive success are strongly positively correlated with the two inventive
productivity measures. The inventive productivity measures have a high positive correlation with each
other. According to hypothesis A3, the two early success measures hardly correlate with each other.

Finally, we show that precocious inventors have more patents and more citations per career year than
inventors without early success. Average patent number increases slightly for inventors with early
success but decreases for inventors without early success from t1 to t2. Average patent quality is
higher in t1 than in t2 for all four groups (Figure 1). The decrease in patent quality from t1 to t2 supports
the idea of a decrease in inventive capability with age (Jones, 2010), in contrast to the slight increase
in the number of patents for precocious inventors. Besides a decrease in inventive capability, a
decrease in patenting success over the career may also be a consequence of industrial inventors being
promoted to managerial tasks (Hoisl, 2007b).

Figure 1: Average productivity in t1 and t2 of inventors with and without early success (n = 1240).

 17
The higher productivity of precocious inventors is matched by the better resource endowment of this
group of inventors during t1 (Table A4). Inventors with a fast and/or a high-quality first patent have
more co-inventors, larger employers, and a higher share of R&D time in their early career years than
their peers without an early success. We also find that a higher number of precocious inventors
voluntarily move to another employer in t1, although we do not know whether this move occurs before
or after the first patent application.

Correlations Between Early Success and Career Inventive Performance
We assess the relationship between early patenting success and inventive career output in a
multivariate Poisson regression according to equation (4) for patent quantity (Table 2) and patent
quality (Table 3). In models 1 and 2 of each regression table, only one of the two indicators for early
patenting success is used as an explanatory variable. In model 3, both variables are included. Controls
are added in a stepwise manner in models 4 to 6; first individual characteristics are added, and then
the work environment during the first patent application.

Without any further controls, inventors with a high-quality first patent file 25.9% more patents per
working year during their career, c (Table 2, column 1; p < 0.01).15 A fast first patent results in more
than twice as many patents compared with the reference group (Table 2, column 2; p < 0.01). If we
include all control variables, there still is a sizeable effect of 59.4% more patents (p < 0.01) for fast
inventors, and of 19.4% more patents for inventors with a high-quality first patent. The effects of early
patenting success on patenting quality during the career are similar: a highly cited first patent increases
the average number of citations received per work year by 66% after including all controls (Table 3,
model 6, p < 0.01). Likewise, a fast first patent results in an increase in patent citations of 81% (p <
0.01). The coefficients of the early success indicators do not change if the other indicator is added.
Hence, both early success indicators are independently positively correlated with inventive success.16
These empirical results support our hypotheses A1–A3.

The covariates in our regressions in Table 2 give us results previously found in the inventor productivity
literature. Male inventors and inventors with a PhD have significantly higher career productivity. A
specialisation in engineering and parents with an academic degree do not additionally drive
productivity. Inventors with a positive risk attitude and with a high openness to new ideas have a

15
 We can interpret the coefficients in terms of incidence rate ratios (IRRs). The coefficients of a Poisson
regression represent the log changes of the dependent variables after a change of the independent variable. The
interpretation of these coefficients is not always straightforward. IRRs are an alternative representation. These
ratios show the expected change in the incidence of the outcome variable after increasing the dependent
variable by one unit. For dummy and categorical variables, the IRR represents the relative incidence relative to
the reference category. The IRRs are obtained by using the exponential form of the coefficients, that is, the IRR
of coefficient is calculated as . IRRs are interpreted as multiplicative. An IRR above 1 represents an increase
and an IRR below 1 represents a decrease of the dependent variable after a change in the independent variable.
16
 An interaction term between both variables is insignificant.
 18
higher productivity, whereas extrovert and conscientious inventors have a lower productivity.
Generalist work experience and a high R&D share when the first patent is applied for increase career
productivity. Mid-sized patent applicants for the first patent have a stronger positive correlation with
career productivity than small and very large applicants. An industrial applicant for the first patent
leads to higher career productivity than a university, public research institution, or an individual
applicant. The number of co-inventors and mainly working in basic or applied research activities when
applying for the first patent do not have a productivity effect. Including individual and work
environment characteristics more than doubles R2 from 5% to 11%.

 (1) (2) (3) (4) (5) (6)
 Patent Patent Patent Patent Patent Patent
Variables quantity quantity quantity quantity quantity quantity
High-quality first patent 1.259** 1.274*** 1.238*** 1.248*** 1.194**
Fast first patent 2.190*** 2.197*** 1.895*** 1.859*** 1.594***
Individual background
Male 1.787** 1.567** 1.638**
Academic education 1.053 1.095 1.077
PhD 1.439* 1.478** 1.423**
Education with engineering
specialisation 0.884 0.896 0.919
Mother academic 1.062 1.065 1.075
Father academic 0.932 0.911 0.908
Personality
Positive risk attitude 1.167* 1.179**
Big 5 extraversion 0.994* 0.994**
Big 5 neuroticism 0.996 0.995
Big 5 openness to new ideas 1.011*** 1.012***
Big 5 agreeableness 0.996 0.996
Big 5 conscientiousness 0.993** 0.993**
Work environment first patent
Generalist work experience 1.189*
Applied R&D 0.924
Basic R&D 1.055
Intensive R&D work 1.552***
Applicant size 25–249 1.231**
Applicant size 250–999 1.401***
Applicant size 1000+ 1.199
Applicant university or public
research institute 0.634***
Applicant individual 0.422***
Number of co-inventors 1 1.008
Number of co-inventors 2–3 0.952
Number of co-inventors 4+ 0.989
Observations 997 997 997 997 997 997
Pseudo R2 0.004 0.045 0.049 0.077 0.088 0.113
Log-Likelihood -974.9 -933.9 -930.1 -903.4 -892.6 -868.2
Birth year periods - 5 categories Yes Yes Yes Yes Yes Yes
Main technology field - 14
categories Yes Yes Yes Yes Yes Yes
First patent status - 4 categories No No No No No Yes
Table 2: Career productivity estimation, quantity. Poisson regression. Table shows incidence rate ratios.
Significance levels: *** p < 0.01, ** p < 0.05, * p < 0.1.

 19
(1) (2) (3) (4) (5) (6)
 Patent Patent Patent Patent Patent Patent
Variables quality quality quality quality quality quality
High-quality first patent 1.895*** 1.919*** 1.764*** 1.758*** 1.660***
Fast first patent 2.376*** 2.398*** 2.443*** 2.342*** 1.811***
Individual background
Male 1.919** 1.734* 1.723*
Academic education 1.490 1.607* 1.625**
PhD 1.751** 1.901** 1.989***
Education with engineering
specialisation 0.733** 0.740** 0.791*
Mother academic 1.000 0.978 0.971
Father academic 0.912 0.890 0.888
Personality
Positive risk attitude 1.428*** 1.453***
Big 5 extraversion 0.995 0.995
Big 5 neuroticism 1.006 1.006
Big 5 openness to new ideas 1.008** 1.009**
Big 5 agreeableness 0.996 0.997
Big 5 conscientiousness 0.990** 0.988**
Work environment first patent
Generalist work experience 1.555***
Applied R&D 0.667*
Basic R&D 1.014
Intensive R&D work 1.557***
Applicant size 25–249 1.254*
Applicant size 250–999 1.343**
Applicant size 1000+ 1.305
Applicant university or public research
institute 0.485**
Applicant individual 0.337***
Number of co-inventors 1 1.055
Number of co-inventors 2–3 0.830
Number of co-inventors 4+ 1.064
Observations 997 997 997 997 997 997
Pseudo R2 0.0244 0.0457 0.0710 0.130 0.146 0.202
Log-Likelihood -1030 -1008 -981.2 -918.7 -901.5 -842.7
Birth year periods - 5 categories Yes Yes Yes Yes Yes Yes
Main technology field - 14 categories Yes Yes Yes Yes Yes Yes
First patent status - 4 categories No No No No No Yes
Table 3: Career productivity estimation, quality. Poisson regression. Table shows incidence rate ratios.
Significance levels: *** p < 0.01, ** p < 0.05, * p < 0.1.

Robustness Checks
In our robustness checks, we first vary the dependent variables. We use fractional counts or, in other
words, we also divide inventive output by the number of co-inventors (Table A5, columns 1 and 2). In
addition, we extend the time period for citations from 5 to 10 years for our quality measure (Table A5,
column 3). Finally, we divide the number of citations by patents instead of work years (Table A5,
column 4). The results remain robust.

We then use alternative indicators for early patenting success. First, we extend the period in which
citations are counted from 5 to 10 years (Table A6, columns 1 and 2). Second, we use a dummy for
inventors who applied for their first patent before the start of their career instead of within 4 years of

 20
You can also read