Using Fixed-Wing UAV for Detecting and Mapping the Distribution and Abundance of Penguins on the South Shetlands Islands, Antarctica - MDPI
←
→
Page content transcription
If your browser does not render page correctly, please read the page content below
Article

Using Fixed-Wing UAV for Detecting and Mapping
the Distribution and Abundance of Penguins on the
South Shetlands Islands, Antarctica
Christian Pfeifer 1,*, Andres Barbosa 2, Osama Mustafa 1, Hans-Ulrich Peter 3,
Marie-Charlott Rümmler 1 and Alexander Brenning 4
 1 Thuringian Institute of Sustainability and Climate Protection (ThINK), Leutragraben 1, 07743 Jena,
 Germany; christian.pfeifer@think-jena.de (C.P.); osama.mustafa@think-jena.de (O.M); marie-
 charlott.ruemmler@think-jena.de (M.R.)
 2 Department of Evolutionary Ecology, Natural History Museum, CSIC, José Gutiérrez Abascal, 2, 28006

 Madrid, Spain; barbosa@mncn.csic.es
 3 Institute of Ecology and Evolution, Friedrich Schiller University Jena, Dornburger Straße 159, 07743 Jena,

 Germany; hans-ulrich.peter@uni-jena.de
 4 Department of Geography, Friedrich Schiller University Jena, Löbdergraben 32, 07743 Jena, Germany;

 alexander.brenning@uni-jena.de
 * Correspondence: christian.pfeifer@think-jena.de

 Received: 28 March 2019; Accepted: 17 April 2019; Published: 19 April 2019

 Abstract: Antarctic marine ecosystems undergo enormous changes, presumably due to climate
 change and fishery. Unmanned aerial vehicles (UAVs) have an unprecedented potential for
 measuring these changes by mapping indicator species such as penguins even in remote areas. We
 used a battery-powered fixed-wing UAV to survey colonies along a 30-km stretch of the remote
 coast of southwest King George Island and northwest Nelson Island (South Shetland Islands,
 Antarctica) during the austral summer 2016/17. With multiple flights, we covered a total distance of
 317 km. We determined the exact position of 14 chinstrap penguin colonies, including two small
 unknown colonies, with a total abundance of 35,604 adults. To model the number of occupied nests
 based on the number of adults counted in the UAV imagery we used data derived from terrestrial
 time-lapse imagery. The comparison with previous studies revealed a decline in the total abundance
 of occupied nests. However, we also found four chinstrap penguin colonies that have grown since
 the 1980s against the general trend on the South Shetland Islands. The results proved the suitability
 of the use of small and lightweight fixed-wing UAVs with electric engines for mapping penguin
 colonies in remote areas in the Antarctic.

 Keywords: Antarctica; birds; BVLOS; penguin; drone; fixed-wing UAV; monitoring; population
 change; Pygoscelis antarcticus; South Shetland Islands

1. Introduction
 The Antarctic marine ecosystems are currently undergoing enormous changes due to climate
change and fishing activities [1,2]. However, determining these changes in remote Antarctic areas is
difficult, and therefore, the data availability is sparse. Because of their unprecedented potential for
mapping wildlife, Unmanned Aerial Vehicles (UAVs) are promising for measuring these changes
e.g., [3–6] by surveying indicator species such as breeding penguins.
 Penguins are a key part of the ecosystems of the Southern Ocean and the Antarctic, and their
changing population numbers reflect ecosystem changes in the short term [7,8]. The general
population trend of chinstrap penguins (Pygoscelis antarcticus) is considered to be decreasing, but the
spatial pattern is complex, with increasing and decreasing populations in different regions [9].

Drones 2019, 3, 39; doi:10.3390/drones3020039 www.mdpi.com/journal/drones
Drones 2019, 3, 39 2 of 24

Therefore, this species appears to be a sensitive indicator for spatially differentiated ecosystem
changes in the Southern Ocean. However, detailed knowledge of quantitative changes of this species
is lacking, not least due to the often very difficult to access breeding habitats. An area where several
studies reported a significant decline in chinstrap penguin population over the last 30–40 years [10–
12] are the South Shetland Islands.
 A key parameter for detecting these changes is the abundance of breeding pairs or occupied
nests. While the abundance is easy to determine in colonies with good access (e.g., next to stations)
by exact ground counts, many colonies of this species are located in remote areas and rugged terrain.
Such an area is the rocky cliff coast of northwest Nelson Island and southwest King George Island
(KGI). There is a large number of small islets, rocks and headlands only accessible by inflatable boats
that have to navigate over large distances and dangerous currents. Several expeditions in the 1980s
explored the northwest coast of Nelson Island e.g., [13,14] and the west coast of KGI [15,16], providing
estimates of the chinstrap penguin colony distribution and abundance.
 After these explorations, data on the population development in the study region is very sparse.
Only very small chinstrap colonies at the western coast of Fildes Peninsula have been observed [17–
19]. The first precise abundance data for a penguin colony at northwest Nelson Island was provided
just after UAVs were introduced in Antarctica when Withem Island (northwest of Nelson Island) was
mapped using a multicopter UAV [20].
 Nevertheless, current and reliable information about the distribution and abundance of the
chinstrap penguin colonies in the region is needed to detect possible population changes. Of all KGI,
only some colonies at the southern and eastern coast have been monitored regularly e.g., [12, 21]; it
is, therefore, completely unknown whether the strong decline in chinstrap population in the last
decades in those colonies is also representative for the west coast. This question is of particular
interest, since the chinstrap penguins breeding at the southeast coast are most likely to have different
foraging areas during the breeding season than those at the west coast [22].
 To census the colonies, previous expeditions used small inflatable boats launched from research
vessels e.g., [15] or nearby stations e.g., [14]. Precise ground counts are time-consuming for large
colonies, but the available time in the field is limited [20], so most of the previous expeditions were
only able to estimate the abundance of the colonies. One option to avoid these restrictions is the use
of manned aircraft for aerial photography e.g., [23]. However, this entails considerable logistical
efforts and costs. The use of satellite imagery is the most economical option, though it provides much
less detailed and precise information, since colony size can only be derived from the extent of the
guano cover, which is relatively inaccurate compared to counts of individuals [20,24–27].
Additionally, both methods are severely limited by the frequent cloud cover in this region.
 Another method that has been used in the Antarctic is multicopter UAVs [20,28–31], or a heavier
and bigger fixed-wing UAV with an internal combustion engine [6,21,32]. UAVs allow counting
individual penguins precisely [4,33] with minimal disturbance [20,34,35]. However, multicopter
UAVs have only a very limited flight range, while the larger fixed-wing UAVs with internal
combustion engines have much longer flight ranges, but greater logistical demands [36].
 This article presents the first use of a small and lightweight battery-powered fixed-wing UAV
for detecting penguin colonies and determining their population size. We chose this type of UAV for
its longer flight range compared to multicopters, and its smaller logistical demands compared to the
much larger fixed-wing UAVs with internal combustion engines. While the main aim was to detect
colonies and count individuals, we also modeled the number of nests based on the UAV derived
counts of adults, making them comparable to previous historic counts. Since it is not possible to count
nests directly from aerial images [28], we used a ratio describing the relation between the peak
number of nests and the number of individuals at the time of the UAV flights using the data of time-
lapse cameras. In this way, we were able to identify possible changes in size and distribution of the
chinstrap penguin colonies in the study area.

2. Materials and Methods
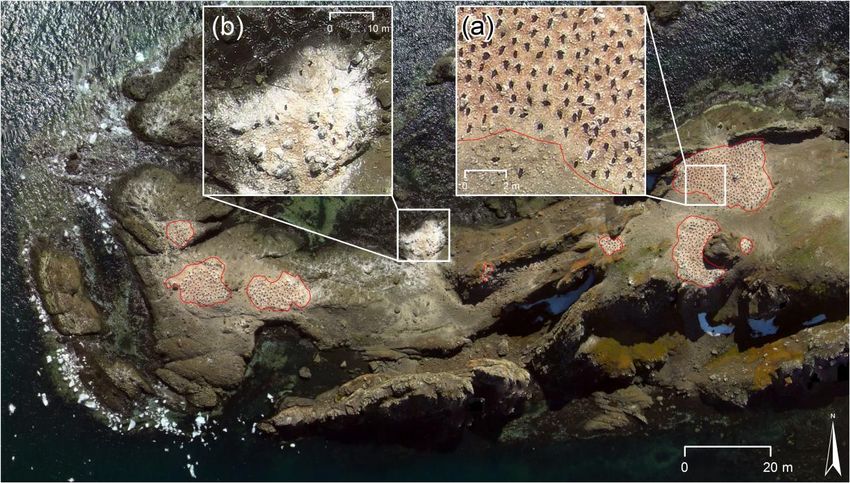
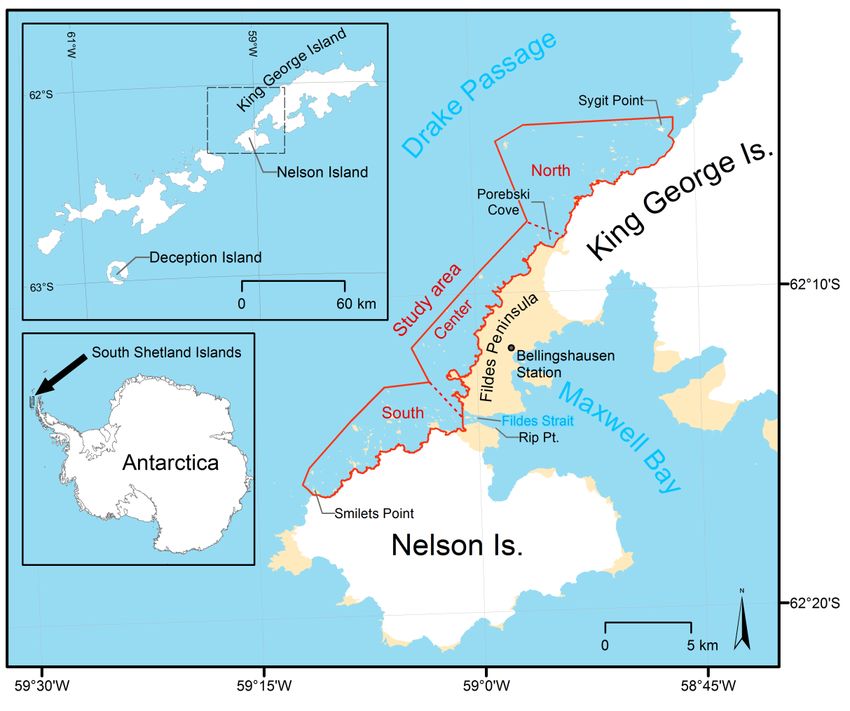
Drones 2019, 3, 39 3 of 24 2.1. Study Area The study area is located at the South Shetland Islands north of the Antarctic Peninsula. It ranges along the west coast of Nelson and King George Island from Smilets Point on Nelson Island in the south to Sygit Point off the coast of King George Island in the north (Figure 1). The cliff coast is characterized by hundreds of islets difficult to reach from nearby stations [37] (Figure 2). The study area was divided into three subareas, each about 10 km long (see Figure 1): The southern subarea from Smilets Point to Fildes Strait at the glacierized coast of Nelson Island, the central subarea from Fildes Strait to Porebski Cove at the glacier-free coast of Fildes Peninsula, and the northern subarea from Porebski Cove to Sygit Point at the glacierized coast of King George Island. Figure 1. The study area extends for about 30 km along the coast of northwest Nelson Island and southwest King George Island (South Shetlands Islands, Antarctica) and is divided into three subareas (North, Center, South). Maps created with data from the SCAR Antarctic Digital Database. To minimize the number of flights, only potential breeding sites were mapped by UAV flights. These are ice-free areas above the supralittoral zone on islands, islets and headlands [38]. To define these sites, a high-resolution Quickbird-2 satellite image (acquisition date: 21 February 2006; id 1010010004D26100) with a ground sampling distance (GSD) of 0.5 m per pixel and a medium resolution Sentinel-2A image with a GSD of 10 m per pixel (acquisition date: 2016 January 2018; tile number T21EUM) have been analyzed visually.
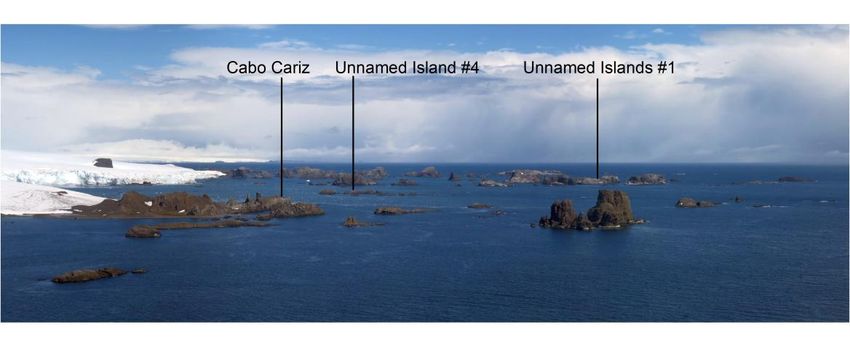
Drones 2019, 3, 39 4 of 24

 Figure 2. Panorama image of the northwestern coast of Nelson Island showing the typical landscape
 with numerous islets and rock outcrops along the glacierized coast, including some penguin colonies
 in the back (photograph taken on 4 January 2017).

2.2. Ground Survey at Fildes Peninsula
 The potential number of flight days in this region is limited by strong winds, rain and fog [29].
To reduce the number of flights to a necessary minimum, we checked the whole ice-free coast of
Fildes Peninsula on the ground for the presence of penguin colonies on 25 December 2016. This
ground survey included all inaccessible islets (< 300 m from the coast) which could be observed by
using binoculars. Because of the good accessibility of the colony at Sehnem Point the number of nests
was counted there directly without the necessity of a UAV flight. UAV flights were therefore
necessary for the islets further away from the coast and for the colonies that were not accessible by
the ground survey.

2.3. UAV and Camera
 The UAV survey was carried out in December 2016 and the beginning of January 2017. This is
during a period of late incubation or early chick-rearing before chinstrap penguin chicks leave the
nests and form crèches.
 To map the remote offshore islets we used the electrically powered micro tailless delta fixed-
wing UAV BORMATEC Ninox (Figure 3). We chose a fixed-wing UAV over the more widely used
multicopter technology for its longer flight duration and higher flight speed, which allows it to cover
a larger area per flight [39]. Because of the small size, and lightweight and compact design of this
model (see Table 1) we were able to launch it by hand from any open space and to land on gravel
beaches or flat patches of ice, snow or dirt. The wings and fuselage of the UAV are made of foam
(Expanded Polypropylene) making it very durable for landings on rougher ground and allowing fast
repair of smaller damages in the field.
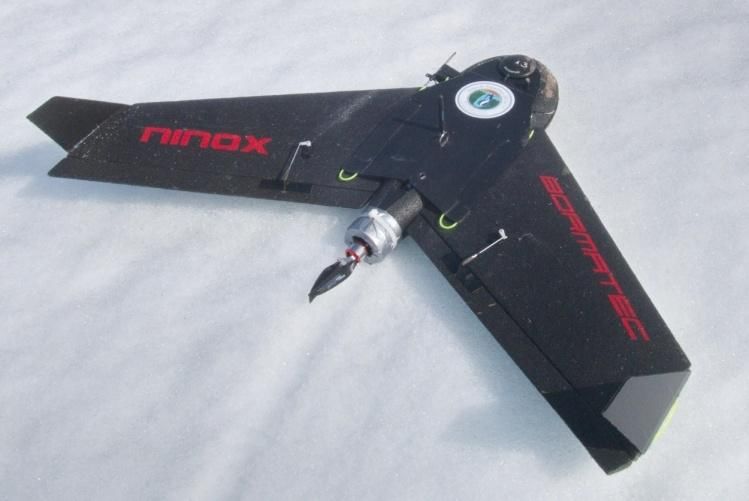
Drones 2019, 3, 39 5 of 24

 Figure 3. The battery-powered fixed-wing UAV BORMATEC Ninox after landing on a snowfield on
 King George Island.

 We had to modify the off-the-shelf UAV to carry a camera and perform long-distance flights
beyond the visual line of sight (BVLOS) even in windy weather. To maximize the flight range, we
equipped the UAV with an additional battery. For better control under harsh weather conditions, we
installed an airspeed sensor. For data capture, we used a lightweight (60g) MAPIR Survey-2 RGB
digital camera. The camera had a 16 megapixel (4,608 × 3,456 pixel) CMOS sensor, a lens with 82°
HFOV and a focal length of 3.97 mm, which results in an image footprint of 155 × 116 m at a flight
height of 100 m AGL. All images were taken in manual mode (f/2.8, shutter speed 1/500 s, ISO 50) to
prevent under-exposure of the relatively dark rock areas when bright snow cover appears in the
image, and to prevent motion blur. Images were taken in JPEG format in 2.5-second intervals using
the built-in intervalometer.

 Table 1. Basic characteristics of the fixed-wing UAV BORMATEC Ninox as used in this study. Source:
 own measurements.

 Parameters

 Size (in flight mode) 1.0 m wingspan, 0.64 m length

 Take-off weight of the
 1 kg
 modified UAV

 Motor / Propellers 160 W brushless motor with 8x4.5″ folding propellers

 Batteries 2 x 3S 2200 mAh lithium polymer

 Autopilot Pixhawk 1

 GNSS uBlox Neo M8N module (GPS & GLONASS were used)

 SiK Telemetry Radio, max. 100 mW output power, 433MHz band
 Telemetry
 with an omnidirectional antenna

 Electronic speed control
 max. 25 A
 (ESC)

 Pixhawk digital differential airspeed sensor (4525DO)
 Additional sensors
 MAPIR Survey-2 RGB digital camera
Drones 2019, 3, 39 6 of 24

 During flights, the UAV was controlled completely autonomously by the Pixhawk 1 flight
computer, which allowed flights beyond the range of the onboard receivers (< 500 m) and beyond the
visual line of sight. Flights were programmed preflight using the ground control station application
Mission Planner (v. 1.3.40), which supports custom-made offline maps. These offline maps included
the most accurate available contour lines, satellite images or scanned maps of the survey region. At
the time of the survey, there were no precise digital surface models available for Nelson Island and
most of the small islands along the coast of Nelson and King George Island. Flight paths were planned
so that the images would have an overlap of 70% in the flight direction and, if necessary, also 70%
between the flight paths. The flight height was planned to range from 70 to 100 m AGL resulting in a
ground resolution of 24 to 34 mm per pixel.
 The UAV was also easy to transport because of its compact size, and could be carried, strapped
to a backpack, by one person for hours. This made it possible to operate the UAV from various points
at Fildes Peninsula that were closest to the predicted penguin colonies, and thus remotely from
stations. In consequence, the area covered by the UAV could be substantially increased in comparison
to a fixed start/landing point e.g., at an airfield.
 At the time of the survey there were no general restrictions regarding flights beyond the visual
line of sight in Antarctica, although all UAV operations for scientific purpose are strictly regulated
and have to go through an Environmental Impact Assessment by the responsible national authority
(based on the Antarctic Treaty Consultative Meeting Resolution 4—2018). Additionally, on-site
permission was obtained from air traffic control before conducting flights within a 1.5 km distance
from the Fildes Peninsula airport and a co-pilot was spotting for aircraft during the flight.

2.4. Geotagging and Orthorectification
 The images obtained by the onboard camera during the flight were stitched to orthomosaics
(UTM 21E/WGS84) for every potential breeding site. For this step, we geotagged the single images
with the software ExifTool (v.10.36) using the flight logs (GPX format; no GNSS post-processing
computation was performed) of the UAV and the time of the image acquisition recorded as Exif tags
in the images. Orthomosaics were created using these geotagged images and the photogrammetric
image processing software Agisoft Photoscan Pro, which implements the Structure from Motion
(SfM) technique e.g., [40]. There were no ground control points available in the study area for
correcting the absolute positional accuracy. With the help of 14 ground control points in the vicinity
of the Bellingshausen Station (see Figure 1), which were mapped using the same UAV, a root-mean-
square error of 8.34 m (XYZ) was obtained.

2.5. Counts of Individual Adults in the Orthomosaics
 All 193 orthomosaics were manually screened for signs of bird colonies such as visible
individuals or reddish guano cover [41–43]. If a penguin colony was found, only adults in guano-
covered areas were counted, not including adults staying at or below the supralittoral zone or adults
walking towards the breeding groups (Figure 4).
 We identified the guano-covered areas in the supralittoral zone based on the elevation (< 5 m
above sea level) with the help of the UAV derived digital surface models, the location (close to the
shoreline), and the guano color (whitish). Counting occupied penguin nests instead of individual
adults was not possible as the occupied nests of the three Pygoscelid species are not clearly
recognizable in the images [44]. For counting, we used QGIS (v.2.18.4). Each individual was marked
with a point in an ESRI shapefile to avoid double counting and gaps.
 We conceptually distinguish between breeding sites, colonies, subcolonies, and breeding groups
(Table 2), and report penguin counts at the colony and subcolony levels. Using these definitions, the
breeding penguins at the site Rzepecki Islands, for example, are part of one large colony with one
subcolony at each of the three islands, which are at most 450 m apart from each other.
 Because of the possible confounding of penguins with rocks or cast shadows we estimated the
precision of the counts. For this purpose, three additional observers counted the adults in an area
Drones 2019, 3, 39 7 of 24

representing 9% of the total number of adults and compared the results with those of the main
observer. All observers had prior experience in UAV image interpretation of penguin colonies.

 Table 2. Definitions used in this study to describe occurrences of breeding penguins.

 Category Description

 Breeding group Occupied nests with a distance < 2 m

 Subcolony Breeding groups with a distance < 50 m

 Colony Subcolonies with a distance < 500 m

 Breeding site Topographically distinct (ice-free) areas with recent and/or historic colonies

 Figure 4. UAV orthomosaic of the chinstrap penguin (Pygoscelis antarcticus) colony at Cabo Cariz
 (Nelson Island): (a) showing the guano-covered areas with occupied nests (red polygons) where
 individuals were counted, and (b) an area in the sublittoral zone close to the shoreline with no
 occupied nests where individuals were not counted.

2.6. Modeling Breeding Pair Numbers of UAV-based Counts

2.6.1. Estimating the Number of Nests
 The standard unit to quantify the size of a penguin colony is the number of breeding pairs or
occupied nests (further referred to as nests [44]). However, in UAV imagery only individuals are
reliably detectable [44]. Due to non-breeders, failed breeders staying in the colony, or individuals
returning from foraging trips, the number of adults in a penguin colony differs from the number of
occupied nests or breeding pairs. The number of adults and the number of occupied nests
furthermore change within a breeding season and over the course of a day, which further complicates
abundance estimation of nests [44–46]. It was therefore necessary to apply adjustment procedures.
 To determine the number of nests ̂ in the study area in 2016/17, we analyzed data from time-
lapse cameras cf. [47,48]. To obtain the ratio ( ), describing the relation between the (peak) number
of nests one week after the peak of egg-laying (PoE) [49] and the number of adult individuals ( )
at a given time :
Drones 2019, 3, 39 8 of 24 ( ) = (1) a(t) ̂ , based on UAV- This ratio can be used to estimate the number of nests in the study area, derived adult individuals counts ( ), while accounting for the shift in breeding phenology, , between both areas: ̂ = ( − ∆ ) ( ) (2) The outlined approach was implemented as follows: We used time series of two time-lapse cameras at the Vapour Col colony (62.9912°S, 60.7201°W [50]) on Deception Island (South Shetland Islands; about 100 km southwest of Nelson Island) showing overviews of chinstrap nest groups. For the analysis, three images per day (01 Dec 2016 to 10 Jan 2017 at 11:00, 13:00 and 15:00 UTC-3h) were selected, since all UAV flights took place around these times (see Table 4). The number of adults was counted within a fixed area in every image, and the mean of the counts from both cameras, ( ), was calculated, yielding up to three daily values for 32 days with good visibility for a total of 93 values of ( ). We averaged all three daily values, since we found no systematic differences in the number of adults between these time points. We further determined the number of occupied nests, , one week after the peak of egg-laying (CCAMLR [51] Part I, Section 1: Method A3A) in the same area. The adults were counted using time-lapse imagery from 19 Nov 2016, which is one week after the local PoE (12 November 2016 [52]). For the standardization, we calculated the nest-to-individual ratio ( ) from the camera- derived and ( ). A generalized additive model (GAM [53]) was used to model the (possibly nonlinear) temporal changes in the ratio ( ). This allowed us to remove random variability and close gaps in the camera-derived time series that were caused by unusable or missing imagery (e.g., due to fog or camera malfunctioning). We used the software R (v.3.2.3) and its mgcv package [54]. The 95% prediction intervals of the predicted ( ) were used to represent and propagate uncertainties. The regional time shift in breeding phenology between camera and UAV sites was determined based on data from Hinke et al. [52], who reported that the PoE of chinstrap penguins in the 2016/17 season on KGI (colony Patelnia, 22 November 2016) took place three days later than on Deception Island (Vapour Col, 19 November 2016). 2.6.2. Accuracy Assessment of the Model Since we had no ground truth data for season 2016/17, we estimated the model accuracy with data from season 2017/18. As the dates of the PoE for the colonies at Deception Island and KGI in season 2017/18 were unknown, we estimated the PoE using a modified model of Lynch et al. [46]. For modification, we did not include the adjustment for the geographic latitude of the colony location as recent data about chinstrap phenology [52,55] suggested that clutch initiation dates are not delayed with increasing latitude between colonies of the South Shetland Islands. The data we used for the accuracy assessment were: Ground counts of 233 nests on Unnamed Islands #1 taken on 2 Jan 2018 around noon (about half an hour after the UAV flight) UAV-derived counts of adults ( ) covering the area of the ground counts The number of adults ( ) counted in the imagery of two time-lapse cameras of the Vapour Col colony (Deception Island) at the time of the UAV and ground surveys. There was no information on differences in breeding phenology ; a correction was therefore not applied. The number of occupied nests visible in time-lapse imagery of the Vapour Col colony taken one week after the local PoE (24 November 2017).
Drones 2019, 3, 39 9 of 24 The number of breeding pairs was calculated using the procedure described above, and the deviation of the estimated breeding pair numbers was determined using the ground counts as a reference. 2.7. Change in Abundance and Distribution We compiled a time series of penguin abundance from all academic peer-reviewed and grey literature available to us. This includes unpublished field reports of the German participants of Soviet Antarctic Expeditions to King George Island (e.g., field reports of Erfurt and Grimm [56], Mönke and Bick [57]). 2.7.1. Determination of Colony Locations of Previous Surveys One of the main challenges was the inaccurate location information of the colonies given in earlier studies which made it difficult to match those with the current colony location presented in this study. In particular, three of the breeding sites located along the coast of northwest Nelson Island are unnamed. Some of the colonies in that area could therefore only be located based on their relative position and their relative size in comparison to other colonies. In cases where only the name of the site was given, we used the SCAR Composite Gazetteer of Antarctica to locate them. If maps of the colony locations had been published e.g., [14,16], we used them for geolocating the colonies, too. The scanned maps were georeferenced based on the coastline and compared with the locations of the current breeding sites. 2.7.2. Modeling the Number of Nests of Previous Surveys For two colonies in the northwestern part of Nelson Island, the most precise and complete data we could find was from the survey of Shuford and Spear [16] in 1984/85. Nevertheless, a comparison with our survey data is difficult since they counted adult individuals in February while our survey took place mainly in December. As mentioned previously (see Section 2.6), it is difficult to compare counts that took place at different dates due to intra-seasonal variation. To be able to compare both counts, we estimated the number of nests ̂ for the counts of adults from Shuford and Spear [16] using Equations (1) and (2). The ratio of the peak number of nests and adults ( ) was calculated from the 2016/17 time series of the time-lapse cameras of chinstrap penguins from Deception Island. For the estimation of the number of nests, ̂ , we used the following data: The mean of the range of the number of adults ( ) given by Shuford and Spear [16] The maximum number of occupied nests n visible in time-lapse imagery of the Vapour Col colony (Deception Island) taken one week after the local PoE (12 November 2016; [52]). The number of adults ( ) counted in the imagery taken at noon (the exact time of the historic ground counts are unknown) of two time-lapse cameras of the Vapour Col colony at 20 Jan 2016 which is 69 days after the local PoE. We used 69 days because this is the period between the PoE and the counts in season 1984/85 by Shuford and Spear [16]. We estimated the date of the PoE in season 1984/85 using the modified model of Lynch et al. [46] (see section 2.6). A correction for nest attrition [46] was not applied for the studies that counted occupied nests because the dates of the counts were not given e.g., [15]. To estimate the magnitude of the resulting uncertainties we measured the nest attrition from the PoE (12 November 2017) until the mean crèche (21 January 2017) using the time series of 2016/17 from the time-lapse cameras at Deception Island. 2.7.3. Estimating the Change Including Uncertainty of Counts Most of the reported historical counts, particularly those for northwest Nelson Island, were only based on estimates that lacked information on their accuracy. We therefore decided to make quantitative comparisons to our results only where the accuracy was indicated or where it could be inferred based on our knowledge of the methods used. To indicate the accuracy of the different counts we applied a factor based on the scheme of Woehler [58] (see Table 3).
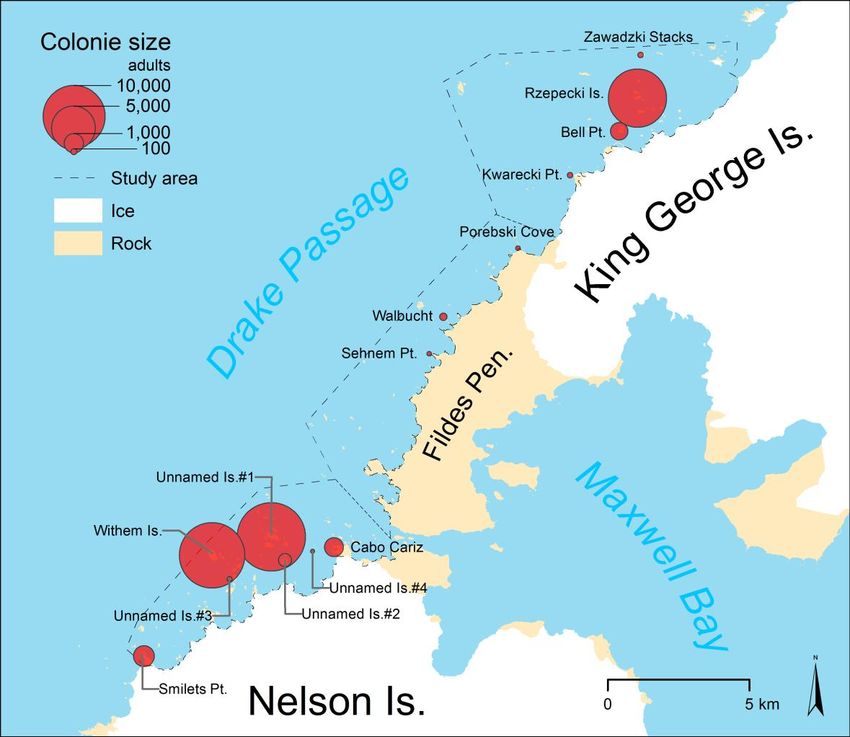
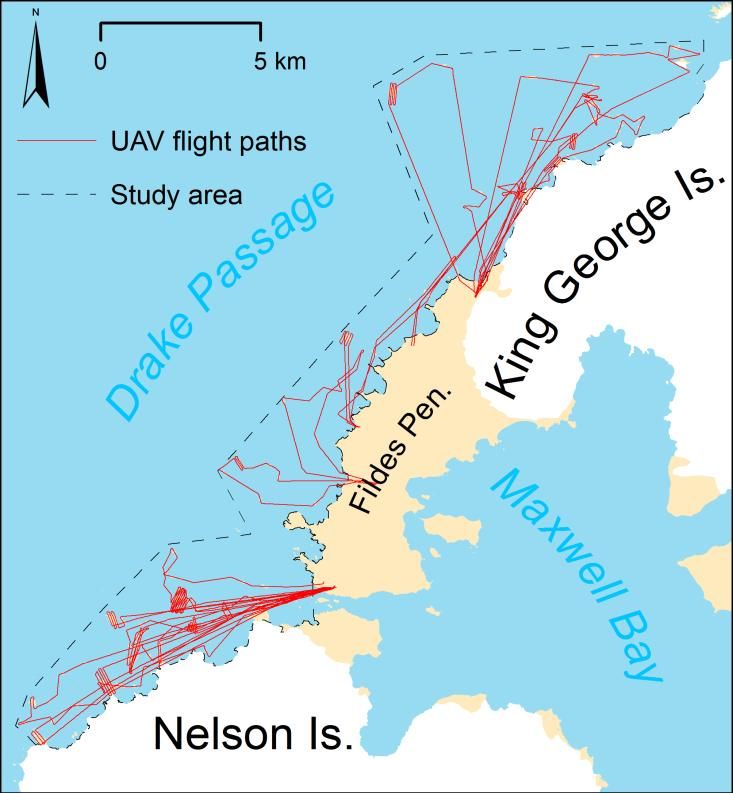
Drones 2019, 3, 39 10 of 24

 Table 3. The accuracy of the previous counts has been classified using the scheme of the census
 compilation of Woehler [58] and the factor of inferred uncertainty used for the comparison with
 our counts. Counts based on: A—adults; N—nests; C—chicks.

 Base of Counts and Accuracy Inferred Uncertainty

 A1, N1, C1 (±0 to 5%) 0.05

 A2, N2, C2 (±5 to 10%) 0.1

 A3, N3, C3 (±10 to 25%) 0.25

 A4, N4, C4 (±25 to 50%) 0.5

 A5, N5, C5 (nearest order of magnitude) -
 We estimated changes using the published [14,15] or modeled number of nests [16] of the
previous counts ( 1 ) and the modeled number of nests of this survey ( 2 ). Based on historical
information, the inferred margin of error ( 1 ) of the number of nests is
 ( 1 ) = ( 1 ) ( 1 ),
 while for 2 , our modeling approach directly gives us a margin of prediction error ( 2 ) at
the 95% confidence level. We combine these to estimate a plausible, but most likely conservative,
margin of error for the change in the number of nests.
 We use this information to calculate rough, but plausible lower and upper limits for the change
in the number of nests,
 ( 2 ) − ( 2 )
 :
 ( 1 ) + ( 1 )
 ( 2 ) + ( 2 )
 :
 ( 1 ) − ( 1 )
 We consider uncertainty ranges that do not include the value zero as strong evidence of change,
although we acknowledge that this is not a rigorous statistical test due to the use of inferred
uncertainties for historical counts.

3. Results

3.1. UAV Survey
 During the five-day survey, we were able to conduct 16 flights (Figure 5). Two flights had to be
repeated because a flight height was chosen that was too low on two small islands without elevation
data, which resulted in insufficient image overlap. This mistake could be detected and accounted for,
since photogrammetric image preprocessing took place on the same day as the flights.
 Altogether, the UAV covered a flight distance of 317 km with an average of 19.8 km per flight
(total coverage included in Supplementary Material S1). An area of 2,585 ha with more than 300 islets,
islands or headlands was mapped with the onboard digital camera. Around 500–1,000 images in
JPEG format were collected per flight. With sufficient batteries for five flights, we were able fly up to
about 100 km per day (e.g., 11 December 2016 and 28 December 2016) and cover an area of up to 10
km².
 Flights could not be conducted when there was fog, low clouds (
Drones 2019, 3, 39 11 of 24

offshore (Atherton Islands) and up to 10 km linear distance (Sygit Point) from the starting point.
Flight times ranged from 30 to 42 minutes.

 Figure 5. Flight paths of all 16 flights.

3.2. Abundance and Distribution
 We identified 14 penguin colonies along the coast between Smilets Point on Nelson Island and
Sygit Point on KGI with a total of 35,604 adult penguins in December 2016 to January 2017. The
repeated counts of four different image observers had a standard deviation of 62 adults, which is
equivalent to 1.9% of the 3,211 adults identified in this test area on average. This corresponds to an
estimated area-wide standard deviation of 661 adults. We also identified the position (absolute
positional accuracy is probably
Drones 2019, 3, 39 12 of 24

 Table 4. Number of adults and modeled number of nests with the margin of error (ME) at the 95%
 confidence level for all colonies and subcolonies in the study area.

 Modeled Number of
 Number of Adults
Sub− Nests ±ME Survey Date /
 Site Lat. Lon.
Area Sub− Sub− Time (UTC−3h)
 Colony Colony
 Colony Colony

 Zawadzki Stacks − 83 − 68±4 28 Dec 2016 / 14:34 −62.0815 −58.8388

 2,486 2,046±126 −62.0995 −58.8394

 Rzepecki Islands 3,327 8,703 2,738±168 7,162±440 28 Dec 2016 / 13:28 −62.0951 −58.8417

 2,890 2,378±146 −62.0934 −58.8416
 North

 807 664±41 −62.1054 −58.8546

 Bell Point 5 869 4±0 715±44 28 Dec 2016 / 11:49 −62.1071 −58.8592

 57 47±3 −62.106 −58.8594

 85 70±4 −62.1188 −58.8887

 Kwarecki Point 46 136 38±2 112±6 28 Dec 2016 / 11:59 −62.119 −58.891

 5 4±0 −62.1187 −58.8861

 Porebski Cove − 61 − 50±3 28 Dec 2016 / 12:19 −62.1415 −58.9254
 Center

 Walbucht − 155 − 131±7 12 Dec 2016 / 12:54 −62.1625 −58.9773

 Sehnem Point − − − 48 1 15 Dec 2016 −62.174 −58.9877

 1,460 1,145±70 −62.2330 −59.0889

 26 20±1 −62.2307 −59.0900

 5,625 4,410±268 −62.2304 −59.0985

 Unnamed Islands #1 145 11,959 114±7 9,376±569 20 Dec 2016 / 11:07 −62.2311 −59.0928

 136 107±6 −62.2308 −59.1024

 1,370 1,074±65 −62.2280 −59.0984

 3,197 2,506±152 −62.2329 −59.1010

 Unnamed Island #4 − 41 2 − 35±2 11 Dec 2016 / 14:11 −62.2354 −59.0709
 South

 Cabo Cariz − 935 − 791±48 04 Jan 2017 / 15:04 −62.2343 −59.0563

 Unnamed Island #3 − 63 2 − 53±3 04 Jan 2017 / 12:42 −62.2433 −59.1279

 408 352±19 −62.2375 −59.0902

 Unnamed Island #2 7 444 6±0 383±21 11 Dec 2016 / 14:09 −62.2385 −59.0914

 29 25±1 −62.2391 −59.0881

 10,921 9,409±520 −62.2356 −59.1392
 Withem Island 11,007 9,483±524 11 Dec 2016 / 12:24
 86 74±4 −62.2355 −59.1335

 570 491±27 −62.2667 −59.1878
 Smilets Point 1,148 989±55 11 Dec 2016 / 15:06
 578 498±28 −62.2685 −59.1863
 1 Ground count of nests
 2 First record
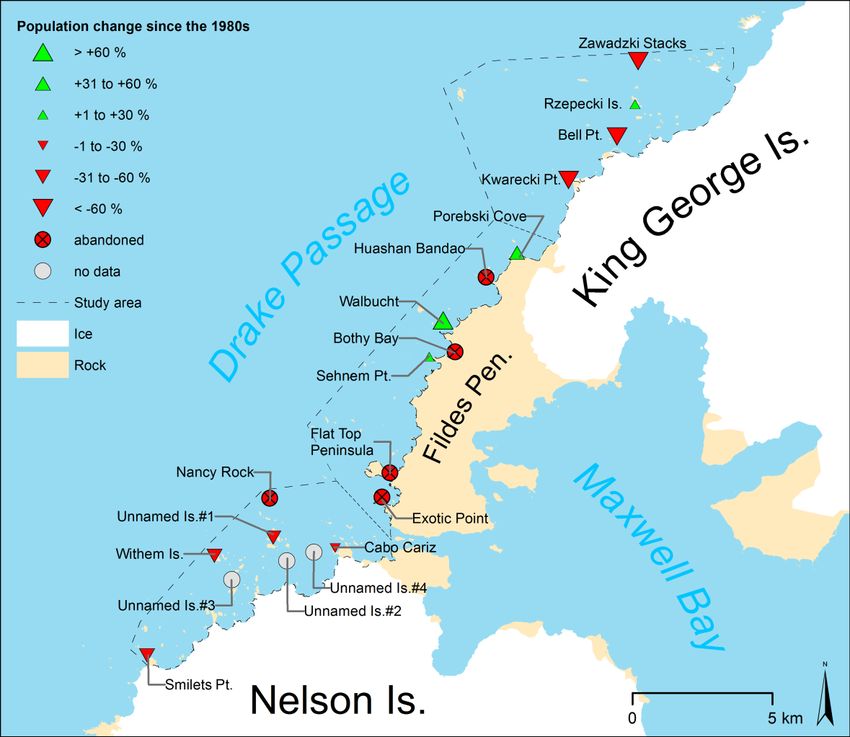
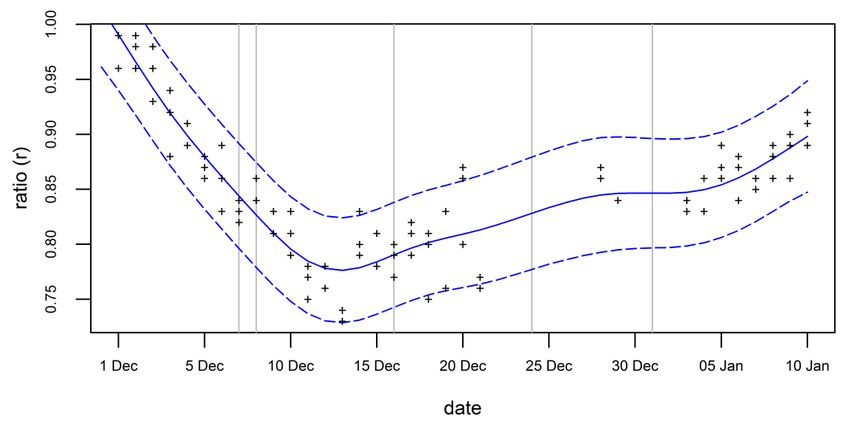
Drones 2019, 3, 39 13 of 24

 Figure 6. Size and location of chinstrap penguin colonies in the study area.

3.3. Number of Occupied Nests
 In total, we estimated that there were 29,396 ± 1,722 (estimate ± margin of error at the 95%
confidence level, standardized to one week after PoE) occupied nests in the study area. The estimated
number of occupied nests for every colony and subcolony is given in Table 4.
 The ratio applied to the number of adults varies strongly with the image acquisition date
(Figure 7). The GAM predicted ratios ranging from 0.78 to 0.86. The first flights took place at a time
with a strong declining ratio, while the last flights were in a period of a slowly increasing ratio.
 For accuracy analysis, we counted a test group of penguins in a UAV orthomosaic of Unnamed
Islands #1, resulting in several 275 adults. With the ratio of 0.87 derived from the time-lapse cameras
on Deception Island, we estimated 239 nests (margin of error: 11 nests), i.e., 7% more than a ground-
based count of 223 nests.
 The nest attrition from PoE to mean crèche in season 2016/17 at Vapour Col (Deception Island)
derived from the time series of the time-lapse cameras was 18%.
Drones 2019, 3, 39 14 of 24

 Figure 7. GAM-modeled variation of the ratio (peak number of nests divided by number of adults
 (blue solid line) and the 95% prediction interval (blue dashed lines) in the chinstrap colony at Vapor
 Col (Deception Island) on the phenology corrected dates of the survey flights 2016/17 (grey vertical
 lines) derived from time series of counts.

3.4. Long-Term Changes in Abundance and Distribution

3.4.1. Assignment of Colonies
 An overview of the assigned colonies is shown in Table 5. Shuford and Spear [16] did not
describe the precise location of three colonies in the vicinity of Rip Point (site #36 in Shuford and
Spear [16]; see Figure 1). Nevertheless, one particularly large colony (15,000–20,000 adults) of these
three can be matched with the colony on Unnamed Islands #1 since Shuford and Spear [16] listed the
only other similarly sized colony on Withem Island separately. They also did not define the precise
location of a colony 3–4 km east of Harmony Point (site #39 in Shuford and Spear [16]). Based on all
available information, we inferred that this colony is located at Smilets Point.
 We were unable to match the locations of the chinstrap colonies with 10,000 adults mentioned
by Croxall and Kirkwood [60] and Zippel [61]. The description of the locations corresponds to Cabo
Cariz, but an analysis of a UAV-derived orthomosaic and a digital surface model of the headland
showed that the area suitable for breeding would not support a colony of that size.

 Table 5. Assignment of the colony location of colonies where the precise position was not given by
 previous surveys.

 Description in Reference
 Reference Assigned Position
 (Translated to English)

 “Islands between Bell Island and Kwarecki Pt.” -
 Jablonski [15] Kwarecki Point
 Map #41

 Shuford and Spear [16] “15,000-20,000 adults” at No. 36 Unnamed Islands #1

 Peter et al. [14] “Figure 8” Unnamed Island #2

 Peter et al. [14] “off Withem Island”/ “Figure 8” Withem Island

3.4.2. Long-Term Change
 The long-term changes in abundance from previous counts are summarized in Table 6. It shows
the comparison of the estimated breeding pair numbers of this study with the first available previous
Drones 2019, 3, 39 15 of 24

counts with sufficient accuracy for all colonies in the study area. The change for Unnamed Island #2
was not estimated because of the high uncertainty of the previous counts. There were no previous
counts for the colonies at Unnamed Islands #3 and #4. The detailed list is available in Supplementary
Materials S2. The distribution of the changes is illustrated in Figure 8. In the following section, we
will present the most substantial changes in detail.
 In the northern subarea, the number of colonies has not changed since the survey of Jablonski
[15] in austral summer 1980/81, although three subcolonies have been abandoned at Kwarecki Point
and Zawadzki Stacks. The total number of occupied nests in the northern subarea decreased by about
24%. However, the largest colony at Rzepecki Islands most likely increased by 11%, while the smaller
colonies decreased by up to 87%.
 In the central subarea, the total number of nests increased by 51% since the first complete census
in 1984/85 [14]. However, the distribution has changed as the number of colonies decreased from six
to three since season 1979/80 [13] and the remaining colonies showed an increase of their population
by more than 33% since 1984/85 [14].
 In the southern subarea, the estimated total population in season 1984/85 [14] was 70% larger
than in this study. However, due to the low accuracy of the previous studies, we do not have strong
evidence of a decline. Nevertheless, at four colonies, the accuracy of the previous surveys allowed a
more accurate estimation of the population change. The colonies at Unnamed Islands #1 and Smilets
Point decreased by about 45% since 1986/87 [16]. The population of the colony at Withem Island had
probably also decreased since 1984 [14], but has remained stable since 2013/14 [20]. The comparison
with Shuford and Spear [16] also revealed that the colony at Nancy Rock had been abandoned. The
two colonies at Unnamed Island #2 and #3 that were newly discovered during this study were very
small and may have been overlooked or found irrelevant by the authors of previous studies. We
consider the establishment of new colonies during a period of general population decline in the area
to be rather unlikely.

 Table 6. Changes in breeding pair numbers with the first available previous counts in the study area.
 Values are based on adults (A), nests (N) or chicks (C) with an accuracy better than ±5% (1), ±5–10%
 (2), ±10–15% (3), ±25–50% (4) or order of magnitude (5) [58]
Drones 2019, 3, 39 16 of 24

 Colony Base of Change [%]
 Sub−
 Site Size Counts and (Uncertainty Season Reference
 Area
 [Nests] Accuracy Interval)

 450 N2 or C2 1980/81 Jablonski [15]
 Zawadzki Stacks −85 (−87,−82)
 68 A1 2016/17 This study

 6,430 N2 or C2 1980/81 Jablonski [15]
 Rzepecki Islands 12 (−5,31)
 7,162 A1 2016/17 This study
 North

 3,274 N1−2 or C2 1980/81 Jablonski [15]
 Bell Point −78 (−81, −74)
 715 A1 2016/17 This study

 800 N2 or C2 1980/81 Jablonski [15]
 Kwarecki Point −86 (−88,−84)
 112 A1 2016/17 This study

 32 N1 1980/81 Jablonski [15]
 Porebski Cove 56 (40,74)
 50 A1 2016/17 This study

 20−30 A3−4 1980/81 Jablonski [15]
 Huashan Bandao abandoned
 0 A1 2016/17 This study

 39 N1 1984/85 Peter et al. [14]
 Walbucht 235 (203,272)
 131 A1 2016/17 This study
 Center

 3 N1 1984/85 Peter et al. [14]
 Bothy Bay abandoned
 0 A1 2016/17 This study

 36 N1 1984/85 Peter et al. [14]
 Sehnem Point 33 (21,47)
 48 N1 2016/17 This study

 18 N1 1980/81 Jablonski [15]
 Flat Top Peninsula abandoned
 0 A1 2016/17 This study

 25 N1 1984/85 Peter et al. [14]
 Exotic Point abandoned
 0 A1 2016/17 This study

 “covered with penguins” 1986/87 Shuford and Spear [16]
 Nancy Rock abandoned
 0 A1 2016/17 This study

 21,444 A3 1986/87 Shuford and Spear [16]
 Unnamed Islands #1 −56 (−64,−45)
 9,376 A1 2016/17 This study

 1000 N4 1984/85 Peter et al. [14]
 Cabo Cariz −21 (−50, 68)
 791 A1 2016/17 This study
 South

 100−999 N5 1984/85 Peter et al. [14]
 Unnamed Island #2 not defined
 383 A1 2016/17 This study

 20,000 N4 1984/85 Peter et al. [14]
 Withem Islands −53 (−70,0)
 9,483 A1 2016/17 This study

 2,142 A3 1986/87 Shuford and Spear [16]
 Smilets Point −54 (−62,−43)
 989 A1 2016/17 This study
Drones 2019, 3, 39 17 of 24

 Figure 8. Estimated changes in the population of all chinstrap penguin colonies compared to previous
 counts of Jablonski [15] in season 1980/81, Peter et al. [14] in season 1984/85 and Shuford and Spear
 [16] in season 1986/87

4. Discussion

4.1. Comparison with Earlier Survey Methods
 In comparison to the previous surveys conducted by boat in the region, fixed-wing UAVs
provide some major advantages. The main advantage is that UAVs are more efficient. Two persons
operating the UAV covered an area of up to 10 km²in only five flights, enabling us to derive detailed
numbers of adult individuals [33] for all penguin colonies in this area. In comparison, Shuford and
Spear [16] needed a full day to cover the same area, but only achieved estimates of the number of
adult penguins. In case of possible future monitoring campaigns, the number of flights and flight
days necessary to map all 14 now known colonies could be reduced by two-thirds with the
knowledge derived from this study. This means that only 26 islands, islets or headlands instead of
the more than 300 of the whole study area would have to be covered.
 UAV-based surveys can cover colonies that are not accessible or visible from a boat and are
therefore unlikely to miss colonies located on one of the more than 300 islets in the area, including
very small colonies of just four nests. For comparison, Shuford and Spear [16] reported only one
colony between Fildes Peninsula and Sygit Point, while Jablonski [15] and this study found four
colonies in the same area. The level of disturbance of the UAV used in the survey is also assumed to
be lower than the disturbance produced by counting the penguins on the ground [20].
 The major disadvantage of using UAVs is that nests are not clearly visible in the aerial images,
and therefore adjustments have to be applied to the counts of individual adults. Nevertheless, it is
Drones 2019, 3, 39 18 of 24

still possible to derive accurate nest counts from the number of adults if flights are performed when
only a few non-breeders are in the colony [28]. If flights were accomplished at a non-optimal time
(number of adults and nests differs), an accurate estimation of the number of nests is still possible by
using time-lapse cameras to calibrate correction factors ([44,47,62] or this study).
 In this study, we used a battery-powered fixed-wing UAV for detecting chinstrap penguin
colonies only. However, this type has proved to be suitable also for detecting other penguins species
in the Antarctic such as Adélie (Pygoscelis adeliae), gentoo (Pygoscelis papua; see [20]) and possibly
emperor penguins (Aptenodytes forsteri), as well as flying birds breeding on surface such as Antarctic
shags (Phalacrocorax bransfieldensis) or southern giant petrels (Macronectes giganteus) [63]. Using
automated counting methods [64] could reduce the time necessary for counting the individual
penguins particularly for larger colonies e.g., [28].

4.2. Comparison with Other UAV Types
 Battery-powered micro fixed-wing UAVs fill the gap between multicopter UAVs, which are
most effective at the scale of individual colonies [20], and larger fixed-wing UAVs with internal
combustion engines, which are able to cover numerous colonies in a single flight [6]. They combine
the advantage of multicopter UAVs of being able to take off and land nearly anywhere with the
longer range of large fixed-wing UAVs. The maximum flight range of 27 km achieved in this study
under windy conditions (3–6 m/s wind speed) is still four to five times smaller than the range of the
fixed-wing UAV with internal combustion engine used by Goetzendorf-Grabowski and Rodzewicz
[32], but five times larger than the range of the multicopter UAV used by Mustafa et al. [20].
 The long flight range, the ability to fly beyond the visual line of sight and outside the range of
the onboard receivers also bears risks, since it is no longer possible to recognize and evade other
aircraft. In this study, the risk of collision with manned aircraft was eliminated by accomplishing all
flights below 120 m AGL, which is far below the minimum flight height of 610 m AGL for manned
aircraft above bird concentrations and the coastline [65]. Our experience also underlines the
importance of precise topographic elevation data for flights beyond the visual line of sight in
particular with flight heights below 100 m AGL to ensure adequate image overlap and to prevent
unintended ground contact.
 Another advantage of the low- and slow-flying battery-powered fixed-wing UAV are relatively
small ground sampling distances (GSDs) of the derived orthomosaics, similar to the ones of mapping
missions of the multicopter UAV used by Mustafa et al. [20] and about half the size of GSDs achieved
by the larger fixed-wing UAV used by Zmarz et al. [6].
 We measured a sound level of 40 dB for the Ninox UAV at a cruising speed of 12 m/s and at 50
m AGL, which should not be an acoustic disturbance as it is below the ambient sound level of a
chinstrap colony, which ranged from 60 to 84 dB at a distance of up to 90 m [29]. Nevertheless,
possible effects of the shape of the Ninox-UAV at low flight heights due to its similarity to the shape
of predators such as brown skuas (Catharacta antarctica lonnbergi) are unknown. Further experiments
to reveal the possible disturbance level are necessary.
 With its low weight and compact size, the UAV used in this study was as portable as a small
multicopter e.g., [30]. This keeps the requirements for the logistics to and in Antarctica very low since
the UAV can be transported on commercial flights as checked baggage, and the batteries as hand
luggage. In contrast, larger UAVs that cannot be carried on commercial flights need to be transported
by ship or cargo planes. The cost of the BORMATEC Ninox including equipment (approx. 2,000 €) is
comparable to the cost of commercial off-the-shelf multicopters. Nevertheless, flight training and
testing required months of preparation and should not be underestimated.

4.3. Abundance and Distribution
 The results of this study enabled us to compile the first complete census of all colonies at
northwestern Nelson Island since 1986/87 [16], of all colonies on Fildes Peninsula since 1989/90 [56],
and of all colonies north of Fildes Peninsula since 1980/81 [15]. For eleven of the 14 colonies, we
Drones 2019, 3, 39 19 of 24

reported the most accurate counts of individuals ever made, and for two colonies, the first counts at
all. Although miscounts are possible due to the confounding of penguins with rocks and cast
shadows, the variation of the counts between the observers was relatively small (SD 1.9%).
 Since the counted number of adult penguins in the colonies has little significance for determining
the colony population, we estimated the number of occupied nests for all colonies. For the colonies
located in the southern subarea these are the most accurate numbers ever. A comparison of the
accuracy of our counts with the ones from of Jablonski [15] is difficult, since the accuracy of
population estimates reported in that study is unknown. It is not even clear if the published numbers
of nests in that study were based on counts of nests or chicks since both methods have been used.
 The method we used to estimate the number of nests is based on the assumption that the ratio
of adults and nests in the colonies in the study area and in the colony at Deception Island is similar.
Though it is known in Adélie penguins in East Antarctica [44,62] that there is a significant spatial and
temporal variability in nest attendance, we found no studies in chinstrap penguins that analyzed
these site-specific variations. Because we only had data from one colony, we could not account for
possible site-specific variability. We considered variations during the day and intra-colony specific
variation by using the data of three time points per day and two cameras in one colony. So if the site-
specific variations (which are unknown) exceed the intra-day and intra-colony specific variation, the
margins of error are potentially underestimated in this study. In consequence, the uncertainty
intervals of the estimated population change would increase and therefore making clear and
conclusive statements concerning possible changes more difficult. To account for this, we also
published the raw counts of the number of adults giving other researchers the possibility to estimate
the number of nests with more accurate methods in the future. An important step to improve the
applied method would be the extension of the regional time-lapse camera network [52] in order to
provide locally adapted estimations of the number of nests based on the raw counts of adults for the
different species.
 The evaluation of the method of the estimation of nest numbers with ground truth data from
season 2017/18 revealed a deviation of 7%. However, this number should be considered with caution,
as the evaluation of a colony was done with only 275 adults, which is less than one percent of the
total number of adults. Nevertheless, the results of the evaluation are consistent with the mean
margin of error of 6% of the modeled results for 2016/17. This result confirms the calculated
uncertainty of our nest estimations of 5–10%.
 We also report for the first time the precise position and the extent of all colonies in the study
area, which makes a comparison with potential future counts possible. Since we also publish the
position of the subcolonies (Supplementary Material S3), future counts will be able to compare
changes on a subcolony scale.

4.4. Changes in Distribution and Abundance
 The recorded decrease in the population of six of the colonies and the decrease in the total
population is consistent with observations in other chinstrap colonies at KGI [12,17,63,66,67], Nelson
Island [68], Deception Island [10,11] and Livingston Island [69,70], where changes of the order of −25
to -100% were found. Reasons for the decline of chinstrap populations may possibly be linked to
regional effects of climate change such as changes in sea ice coverage and biological productivity [11],
or to fishery [71], both of which may affect food availability.
 It is remarkable how the changes vary between the individual colonies. As an example, four of
the five colonies with a population of >30 nests in 1984/85 were abandoned completely, as was the
small colony at Nancy Rock (100 to 999 nests) [58], which was the one furthest off the shore of all
colonies at subarea South. The decline of the larger colonies manifests itself in abandoned
subcolonies, as it was recorded at the Zawadzki Stacks and Kwarecki Point. Nevertheless, not all
surveyed colonies declined. With Rzepecki Island, the biggest colony at the subarea North, we report
only the second chinstrap penguin colony with a population of >200 nests in the Antarctic that most
likely increased since the 1980s. The other is the colony at Narebski Point [72]. We also report three
very small chinstrap penguin colonies (< 200 nests) that increased since the 1980s in addition to the
Drones 2019, 3, 39 20 of 24

one already known at Lions Rump [21]. All these colonies have in common that the surrounding
colonies decreased drastically by around 80% (e.g., Bell Point) or were abandoned completely (e.g.,
Exotic Point). In the southern subarea, the data suggests that the largest colonies (Withem Island and
Unnamed Islands #1) did not increase. The cause of this irregular pattern of increasing colonies
during a period of general decrease is unknown, and further studies are necessary.
 Please note that the numbers for the comparisons are either based on estimates of adults [16] or
on estimates of breeding pairs [14,15] with an accuracy of ± 10 to 50%. This should be kept in mind
when interpreting the calculated change of the colonies in Table 6. When comparing the change of
the single colonies it should also be kept in mind that the previous counts are from different seasons.
 When using the SCAR Composite Gazetteer of Antarctica [73] for geolocating the breeding sites,
we noticed that these were often inaccurate or that in some cases there were even multiple locations
for the same name, making a definite localization difficult [74]. The given text descriptions were often
too vague to be useful.
 All these findings are only possible as we were able to cover all colonies in a region and because
there were historic counts available to compare these with. A more precise comparison with the
previous studies was not possible, as the dates and/or the detailed methods of the counts were not
published. We would like to point out the importance to publish the precise date and method when
implementing censuses as well as an accuracy estimation to be able to compare these with other
counts.

5. Conclusion
 This study showed that it is feasible to survey penguin colonies with battery powered fixed-
wing UAVs at a difficult to access geomorphological complex coastal area. It demonstrated the
advantages of using a small and lightweight low-cost fixed-wing UAV with its low logistic demands
and long flight range. We proved that it is possible to detect and map the precise location of
previously unknown colonies, or colonies with inaccurate location information. The study revealed
the importance of detailed elevation information for a survey with flight heights below 100 m AGL
to ensure sufficiently high image overlap and to prevent unintended ground contact. Using the UAV
orthomosaics, we were able to determine the most accurate abundance data ever published for most
penguin colonies in the study area. The comparison with previous studies from the 1980s gave strong
evidence for a general decline of the chinstrap penguin population in the study area although several
colonies with a most likely increasing number of nests were found. Overall, we conclude that the
developed method is able to efficiently perform a high-quality survey of chinstrap penguin colonies
in a difficult to access area. Using these UAVs instead of the widely used multicopters enables
scientist in the Antarctic to map colonies in a radius of at least 10 km around the research stations.
This could significantly increase the number of colonies that get monitored and thus help to increase
the understanding of the changes in the Antarctic ecosystem.

Supplementary Materials: The following are available online at www.mdpi.com/2504-446X/3/2/39/s1,
www.mdpi.com/2504-446X/3/2/39/s2 and www.mdpi.com/2504-446X/3/2/39/s3. Shape-File S1: complete UAV
coverage, Table S2: detailed comparison with previous counts, Shape-File S3: penguin groups.

Author Contributions: conceptualization, C.P.; methodology, C.P., O.M and A.Br.; software, C.P. and A.Br.;
validation, C.P., O.M. and M.R.; formal analysis, C.P. and A.Br.; investigation, C.P.; resources, C.P., A.Ba., H.P.
and M.R.; data curation, C.P.; writing—original draft preparation, C.P.; writing—review and editing, all;
visualization, C.P. and O.M.; supervision, C.P. and O.M.; project administration, O.M.; funding acquisition, O.M.

Funding: This research was commissioned by the German Federal Environment Agency and funded by the
German Federal Ministry for the Environment, Nature Conservation and Nuclear Safety (UFOPLAN 3716 18
201 0). Data from Deception Island were obtained under the project CTM2015-64720-R funded by the Spanish
Research Agency. The cameras at Deception Island were funded by the support of the CCAMLR (Commission
for the Conservation of Antarctic Marine Living Resources) Ecosystem Monitoring Program Special Fund.

Acknowledgment: We thank the crew of the Bellingshausen Station (Russia) for accommodation and support
during our expedition. We further like to thank Christina Braun, Hannes Grämer, Daniel Prowaznik and
Drones 2019, 3, 39 21 of 24

Raphael Ritter who conducted most of the ground surveys at the long and rough coast of Fildes Peninsula. We
also want to thank the developer teams of ArduPilot, ExifTool, QGIS and R for developing and sharing their
open-source software that we used in this study. We thank the crew of the Gabriel de Castilla Station (Spain) for
support and hospitality, the RV/Hesperides for transportation to Deception Island and the Spanish Research
Council Marine Technology Unit for logistic support.

Conflicts of Interest: The authors declare no conflict of interest.

References
1. Clarke, A.; Murphy, E.J.; Meredith, M.P.; King, J.C.; Peck, L.S.; Barnes, D.K..; Smith, R.C. Climate change
 and the marine ecosystem of the western Antarctic Peninsula. Philos. Trans. R. Soc. B Biol. Sci. 2007, 362,
 149–166.
2. Croxall, J.P.; Trathan, P.N.; Murphy, E.J. Environmental Change and Antarctic Seabird Populations. Science
 2002, 297, 1510.
3. Chabot, D.; Bird, D.M. Wildlife research and management methods in the 21st century: Where do
 unmanned aircraft fit in? J. Unmanned Veh. Syst. 2015, 3, 137–155.
4. Hodgson, J.C.; Baylis, S.M.; Mott, R.; Herrod, A.; Clarke, R.H. Precision wildlife monitoring using
 unmanned aerial vehicles. Sci. Rep. 2016, 6, 22574.
5. Rush, G.P.; Clarke, L.E.; Stone, M.; Wood, M.J. Can drones count gulls? Minimal disturbance and
 semiautomated image processing with an unmanned aerial vehicle for colony-nesting seabirds. Ecol. Evol.
 2018, 8, 12322–12334.
6. Zmarz, A.; Rodzewicz, M.; Dąbski, M.; Karsznia, I.; Korczak-Abshire, M.; Chwedorzewska, K.J.
 Application of UAV BVLOS remote sensing data for multi-faceted analysis of Antarctic ecosystem. Remote
 Sens. Environ. 2018, 217, 375–388.
7. Forcada, J.; Trathan, P.N.; Reid, K.; Murphy, E.J.; Croxall, J.P. Contrasting population changes in sympatric
 penguin species in association with climate warming. Glob. Chang. Biol. 2006, 12, 411–423.
8. Trivelpiece, W.Z.; Trivelpiece, S.G.; Geupel, G.R.; Kjelmyr, J.; Volkman, N.J. Adélie and Chinstrap
 Penguins: Their Potential as Monitors of the Southern Ocean Marine Ecosystem. In Antarctic Ecosystems;
 Kerry, K.R., Hempel, G., Eds.; Springer: Berlin/Heidelberg, Germany, 1990; pp. 191–202.
9. Lynch, H.J.; White, R.; Naveen, R.; Black, A.; Meixler, M.S.; Fagan, W.F. In stark contrast to widespread
 declines along the Scotia Arc, a survey of the South Sandwich Islands finds a robust seabird community.
 Polar Biol. 2016, 39, 1615–1625.
10. Barbosa, A.; Benzal, J.; De León, A.; Moreno, J. Population decline of chinstrap penguins (Pygoscelis
 antarctica) on Deception Island, South Shetlands, Antarctica. Polar Biol. 2012, 35, 1453–1457.
11. Naveen, R.; Lynch, H.J.; Forrest, S.; Mueller, T.; Polito, M. First direct, site-wide penguin survey at
 Deception Island, Antarctica, suggests significant declines in breeding chinstrap penguins. Polar Biol. 2012,
 35, 1879–1888.
12. Sander, M.; Balbão, T.C.; Polito, M.J.; Costa, E.S.; Carneiro, A.P.B. Recent decrease in chinstrap penguin
 (Pygoscelis antarctica) populations at two of Admiralty Bay’s islets on King George Island, South Shetland
 Islands, Antarctica. Polar Biol. 2007, 30, 659–661.
13. Bannasch, R.; Odening, K. Zoologische Untersuchungen im Gebiet der sowjetischen Antarktisstation
 “Bellingshausen”. Geodätische Und Geophys. Veröffentlichungen 1981, Reihe I 8, 3–20.
14. Peter, H.-U.; Kaiser, M.; Gebauer, A. Untersuchungen an Vögeln und Robben auf King George Island
 (South Shetland Islands, Antarktis). Geodätische Und Geophys. Veröffentlichungen 1988, Reihe I 14, 1–127.
15. Jablonski, B. Distribution and numbers of penguins in the region of King George Island (South Shetland
 Islands) in the breeding season 1980/1981. Pol. Polar Res 1984, 5, 17–30.
16. Shuford, W.D.; Spear, L.B. Surveys of breeding Chinstrap Penguins in the South Shetland Islands,
 Antarctica. Br. Antarct. Surv. Bull. 1988, 81, 19–30.
17. Braun, C.; Esefeld, J.; Peter, H.-U. Monitoring the Consequences of Local Climate Change on the Natural Resources
 of the Ice-Free Regions of Maxwell Bay (King George Island, Antarctic); Texte 26/2017; German Environment
 Agency: Dessau-Roßlau, Germany, 2017; pp. 1–177.
18. Peter, H.-U.; Braun, C.; Janowski, S.; Nordt, A.; Stelter, M. The Current Environmental Situation and Proposals
 for the Management of the Fildes Peninsula Region; Texte 02/2013; Federal Environment Agency (Germany):
 Dessau-Roßlau, Germany, 2013; pp. 1–127.
You can also read