District of Invermere - Housing Needs Assessment whistlercentre.ca
←
→
Page content transcription
If your browser does not render page correctly, please read the page content below
District of
Invermere
Housing Needs Assessment
                                4325 Blackcomb Way
                                Whistler, BC V8E 0X5
                                info@whistlercentre.

                           whistlercentre.ca
All Rights Reserved.
The preparation of this report was carried out by
WCS Engagement + Planning, with assistance from
M’akola Development Services.

Cover photo credit:
Contents
Introduction .................................................................................. 1
   Purpose ......................................................................................................................................................... 1
   Policy Context ............................................................................................................................................... 1
   Housing 101 .................................................................................................................................................. 4
   Methodology ................................................................................................................................................. 4

Community Profile ....................................................................... 7
   About ............................................................................................................................................................. 7
   Population and Demographic Context ...................................................................................................... 8
   Households Context .................................................................................................................................... 9
   Economic Context ...................................................................................................................................... 10

Current Housing.......................................................................... 14
   Current Dwellings ....................................................................................................................................... 14
   Housing Costs ............................................................................................................................................. 18
   Housing Needs and Affordability ............................................................................................................. 20
   Supportive Housing Needs and Other Groups ....................................................................................... 26
   Housing for Employees/ Transient Workforce........................................................................................ 27
   Current Housing Need Summary ............................................................................................................. 28

Anticipated Housing Needs (5 Year Timeframe) .................... 30
   Anticipated Population .............................................................................................................................. 30
   Anticipated Number of Households ........................................................................................................ 33
   Engagement Feedback .............................................................................................................................. 36

Key Findings ................................................................................ 38
   Housing stock ............................................................................................................................................. 38
   Affordability ................................................................................................................................................ 38
   Current housing needs .............................................................................................................................. 39
   Anticipated housing needs ........................................................................................................................ 40

Appendices .................................................................................. 41
Executive Summary
This Housing Needs Report provides an overview of Invermere’s current housing availability,
suitability, and affordability across the entire housing continuum from basic shelter to the
availability of high-end real estate. The report also speaks to projections and makes
recommendations for future population growth and significant expected changes in housing
demand and provide a breakdown of housing units by typology in the District, and information on
number of bedrooms, condition and state of repair, where available.
The report is intended to fulfill the District’s requirements under Bill 18 - 2018: Local Government
Statutes (Housing Needs Reports) Amendment Act, 2018.
COVID-19: The global pandemic over the past 10 months has translated to population shifts to
smaller communities such as Invermere where a large proportion of dwellings are vacation homes.
In many cases, property owners, many with families moved to their vacation homes over the past 10
months resulting in population growth. Anecdotal reports from Invermere suggest the presence of
this trend. Growth projections for this report from 2020 to 2025 have not factored in this recent
trend as it is not yet clear whether it will continue or reverse over the next year.

Population
•            The District of Invermere’s population was 3,215 in 2016, a 20% increase from 2011. This
             increase is larger than both the Regional District of East Kootenay increase of 6.6% and the
             provincial increase of 6.6%.

•            The population of Invermere is slightly younger than the region: Invermere’s median age is 42.9,
             compared to the median age in the Regional District of 45.1, but is almost exactly the same as
             the provincial median age of 43.

•            Estimated future population numbers for Invermere are based on recent studies completed for
             the District and a constant growth rate of 1.7% was chosen for consistency. Projections show
             Invermere growing to 3,557 residents by 2025.

                           4000                                                                             68000
                           3500                                                                             66000
                                                                                                            64000
    Invermere Population

                           3000
                                                                                                                    RDEK Population
                                                                                                            62000
                           2500
                                                                                                            60000
                           2000
                                                                                                            58000
                           1500
                                                                                                            56000
                           1000                                                                             54000
                           500                                                                              52000
                             0                                                                              50000
                                  2006   2011   2016    2020   2021      2022      2023       2024   2025
                                                               Year

                                                 Invermere      Regional District East Kootenay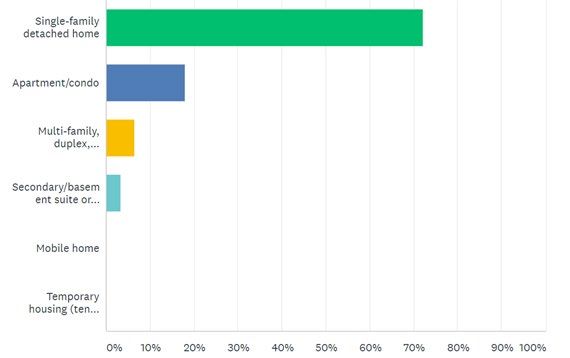
Economy
•        The participation rate in 2016 was at 70% of the working age population, down by 3% points
         from 2006. The employment rate of 66% is higher than in the Regional District, where 60% of
         the population 15 years of age and over were employed.

•        Seven sectors account for 71% of the 1,855 job positions in Invermere. As Invermere is a resort
         municipality, tourism-related jobs account for the largest employment sectors, and the
         remaining sectors include a mix of health care, construction, education and manufacturing.
         Tourism related job growth is evident compared to 2006.

•        The 2016 median household income of $74,798 in Invermere is about 3% lower than the RDEK
         household income of $76,887.

Current Housing Stock                                                         Dwelling Types, 2016
•        There are 2,032 dwellings in Invermere                                                 Semi-detached house, 100
         and 68% of those, or 1,375, are
                                                                                                        Row house, 85
         considered inhabited by full-time
                                                                                                   Apartment or flat in a
         residents. About 32% (about 650) are not                                                duplex, 80
         utilized permanently.                                                                     Apartment in a building
                                                                         Single-
                                                                        detached                 that has fewer than five
•        The majority of dwelling types are single-                    house, 965                storeys, 125
         detached home.                                                                              Other single-attached
                                                                                                         house, 10
•        Despite a very large number of one and
         two-person households, most dwellings                                                     Movable dwelling,
                                                                                                         10
         have 3 or more bedrooms.

                                               Household Size and Bedrooms, 2016
                            600

                            500
                                                                                          490                   505
    # of households/units

                                                        465
                            400
                                   415
                            300
                                                              295
                                                                                                        280
                            200
                                                                                    220

                            100
                                          85
                             0
                                  1 person/ 1 bd      2 persons/ 2bd           3 persons/3 bd      4+ persons/ 4 bd+
• There were 104 dwellings constructed in Invermere from 2016 to 2018 and 64 of those were
single detached homes. Recent construction reveals a slight shift toward multi-unit homes
compared to the baseline in 2016.
• Just over half of the occupied dwellings were built before 1990 and very few homes were
constructed in the period from 2011 to 2016. The housing stock is slightly newer than in the
greater region.
Current Housing Suitability
• The vast majority of both renter (86%) and owner (94%) respondents to the Invermere housing
survey indicated that their current housing type and size meets their needs or is “okay” given
their household/family situation.
Current Housing Affordability
• Overall monthly shelter costs 1 are increasing in Invermere, and the average monthly cost of
renting a home ($1,130) is slightly lower than the average monthly cost of owning a home
($1,193). That said, since 2006, incomes for both renters and owners have increased at a slightly
faster rate than shelter costs, making shelter costs slightly lower when compared to income.
• Average 2016 monthly shelter costs are higher than in the regional district, and shelter costs
compared to incomes are slightly higher than in the regional district.
Invermere RDEK
Average monthly shelter cost $1,175 $1,035
Average (shelter cost-to-income ratio 2) .21 .18
• For owners, housing values have increased by one third from $311,241 in 2006 to $474,144 in
2019, though are moderately assessed compared to elsewhere in BC.
• Of the 390 renter and 985 owner householders in Invermere, 275 households (155 out of 390
renter and 120 out of 985 owner) in Invermere are spending 30% or more of their before-tax
income on shelter costs.
• There are up to 355 households without the income to support the median priced rental
dwelling shelter costs of $1,049/month.
1
Shelter cost refers to the average or median monthly total of all shelter expenses paid by households that own or rent their
dwelling. Owner costs include mortgage payments, property taxes and condominium fees, along with the costs of electricity,
heat, water and other municipal services. Renter costs include rent, electricity, heat, water and other municipal services.
2
Proportion of average total income of household which is spent on shelter costs.• There are up to 500 households in Invermere without the income to support the average strata
based 3 one-bedroom residential dwelling ownership costs of $1,236/month.
Median Assessment of a Detached Home
500,000 $474,144
$423,549 $430,859 $438,872 $434,410
400,000
$311,241
300,000
200,000
100,000
0
2006 2011 2016 2017 2018 2019
Value 311,241 423,549 430,859 438,872 434,410 $474,144
Core Need
• There are 125 households in Invermere with a “core need” for housing (85-90) renter households
and 45 owner households) This means they are in unsuitable housing due to affordability
challenges, major repairs needed or inadequate number of rooms for the family type, and they
cannot afford alternative housing options in the community.
• Most of these households in a core need are one or two-person households.
Other Needs
• Other groups with identified housing needs included seniors, those with special needs and the
homeless.
District of Invermere, Current High Priority Housing Needs
Core Need
Targeted Households Special Total
Seniors Housing for
Demographic (families and Needs increase
Homeless
other)
Current
Required, Required,
Housing
95+ 40+ Amount Amount 145+
Increase
Unclear Unclear
Needed
• It is hard to determine the unit-sizes required for the high priority housing needs, but most of
those in a core need for housing are currently one or two-person households.
3Strata units on average have slightly lower costs than non-strata units so strata prices are used to for this
statistic.Anticipated Housing Demand
From 2020 to 2025 the number of households in Invermere is expected to increase from 1,391 to
1,514. The most anticipated demand is expected to be in 3+ bedroom units, which will continue to
make up more than 50% of total housing stock. This anticipated demand aligns with survey
responses, and could be met by townhomes. However, when asked what housing type respondents
expect to need in the next five years, 66% of respondents indicated that their needs would be best
met by a single-detached home.
• Interviewees were asked what other forms of housing were needed in the next five to ten years,
and the top answers were aging in place and duplexes.
District of Invermere, Anticipated Change in Number of Households by Unit Size, 2020-2025
Total
Unit type 0-bedroom/1-bedroom 2-bedroom 3-3+ bedroom
increase
Increase +9 +29 +85 +123Introduction
Purpose
Municipalities and regional districts in B.C. are required to complete housing needs reports by April
2022, and every five years thereafter. This report, Invermere’s Housing Needs Assessment, will help
Invermere better understand and respond to housing needs over the next five to ten years.
The report provides an overview of Invermere’s current housing availability, suitability, and
affordability across the entire housing continuum from basic shelter to the availability of high-end
real estate. The report also speaks to projections and makes recommendations for future
population growth and significant expected changes in housing demand and provide a breakdown
of housing units by typology in the District, and information on number of bedrooms, condition and
state of repair, where available. In addition, the report provides high level bylaw and policy
recommendations for an update to the specific residential policies contained within the Official
Community Plan (OCP).
Policy Context
Invermere’s housing needs and future efforts to address them should be considered within the
context of Invermere’s Imagine Invermere Official Community Plan, which draws from vision
descriptors within the sustainability plan and articulates goals, objectives and policies, with some
related to housing.
IMAGINE INVERMERE INTEGRATED SUSTAINABILITY PLAN
In 2010-2011 the District of Invermere crafted an Integrated Community Sustainability Plan (ICSP) as
a commitment to sustainability and a shared vision. The plan identifies four priorities that are
applied across nine strategy areas. Each strategy area offers up visions of future success and many
related to housing. For example:
Buildings and Sites Economy and Work
• Housing stock and accommodation options are diverse, • Invermere’s work culture offers fair wages and
affordable, and accessible for residents through all life innovative approaches to lifestyle benefits.
stages
• Invermere’s economy is mostly locally-based and
• Sustainable design and building practices are used to owned, attracts and sustains a diverse workforce and
produce buildings with minimal environmental impacts population.
• Energy systems within buildings are flexible and • There is an integrated approach to economic
adaptable and use locally generated energy sources development that includes the necessary social and
physical infrastructure to support it.
Land Use and Natural Areas Community and Individual Health
• The community of Invermere is compact, with a distinct • Neighbourhoods are diverse, healthy, safe and multi-
urban boundary and well-understood limits to growth. generational, supporting families and seniors to age-in-
Smart growth strategies and principles guide place
development planning and decisions
• Land development practices have transitioned to energy
conservation and efficiency in neighbourhood design
and sustainably harvested materials in buildings.
1IMAGINE INVERMERE OFFICIAL COMMUNITY PLAN
Building off the ICSP and community input, the four goals articulated for the Official Community
Plan include:
Goal 1: Building a Complete Community Goal 3: Protecting the Environment
Goal 2: Managing Growth Goal 4: Improving Infrastructure
Under Goal 1: Building a Complete Community the Objectives related to housing include:
• To support initiatives developing a well-balanced mix of housing types, tenure options and
prices that will meet the accommodation needs of a full range of socio-economic groups and
maintain demographic diversity.
• To support the provision of affordable housing.
• To ensure efficient residential development and redevelopment of the limited land base that
exists within the District.
• To support architectural and urban design that reflects Invermere’s natural environment,
unique setting, and sustainability aspirations.
Residential policies include:
- The District will encourage a well-balanced mixture of housing types, tenure options and prices
that will strive to meet the accommodation needs of all socio-economic groups. Council will
encourage initiatives to supply affordable forms of accommodation. These initiatives could
include the development of new zones that would permit higher densities, different forms of
housing, endorsement of secondary suites, and the introduction of density bonus provisions.
- The District will encourage residential development that efficiently utilizes the existing land base to
prevent further sprawl.
- The District will encourage the development of entry level and rental accommodations within
existing and future residential areas and mixed-use developments within the downtown
commercial area.
- The District will ensure the housing stock accommodates a mix of permanent and seasonal
residents to facilitate vibrant neighbourhoods throughout the entire year.
- The District will encourage appropriate and affordable accommodation for seniors. The District
will support initiatives that will utilize “aging in place” principles, graduated care facilities and
principles that support the retention of family members within the community.
- The District may consider negotiating development amenities (as defined in the glossary) as part
of a development approval. [amenities to be considered include affordable housing units]
Growth Management policies include:
- The District will evaluate potential areas for expanding the District’s boundaries into lands that
will assist the District in achieving the policies of this OCP. 1 of 8 - b) Affordable, attainable, or
seniors housing initiatives that cannot be accommodated within existing boundaries.
2Energy & Water Conservation policies Include:
- The District will encourage developers and builders to implement the latest green building
technologies.
- The District will encourage developers and builders to design subdivisions and individual buildings
to take advantage of passive solar gains.
OCP DEVELOPMENT PERMIT AREAS (DPA)
DPAs are a further articulation of OCP policy in specific geographical areas in the community. There
are three DPAs with strongly related objectives/guidelines to housing.
Hollybow Kane Neighbourhood Plan DPA
The development permit area for the Hollybow Kane Neighbourhood includes objectives and
specific guidelines related specifically to housing (and affordable/seniors housing) in this area.
Invermere is a community that requires the provision of forms of housing that will address the
needs of a diverse economic and social population.
1. To address the housing needs of seniors in the community by providing a wide range of
housing options and services to retain seniors within the community.
2. Due to an increased rate of growth in the Invermere area the District is under pressure to
grow and expand its boundaries. The provision of affordable entry level housing units in
close proximity to Invermere’s schools will assist in the creation of an economically and
socially diverse neighborhood.
3. As the population of Invermere and the Upper Columbia Valley continues to age, the
demand for a range of seniors housing and services will increase. Due to the increased
growth in the senior population, the need for a seniors housing complex is required.
Residential Infill DPA
The development permit area for residential infill is located in pockets through Invermere to
encourage development in already developed areas. The document articulates justification,
objectives and specific design requirements. Justification and objectives include:
1. The designated infill and redevelopment area consists of vacant land or sites presently
occupied by older single family dwellings. With continuing growth and development, more
intensive use of these areas is encouraged including multiple unit dwellings.
2. Due to an increased rate of growth in the Invermere area the District is under pressure to
grow and expand its boundaries. Infill residential redevelopment in areas of low density
surrounding the downtown core is needed to offset this concern.
3. Increasing the density of residential development in areas surrounding the downtown core
of Invermere will increase the its economic viability of the downtown area by providing a
greater population base within close proximity.
4. Guidelines concerning the form and character of multi- family residential development are
required to ensure that new development in existing neighbourhoods is compatible with
adjacent land uses and the general character of Invermere. As well it should be effectively
integrated with the natural setting. These guidelines are contained in following sections and
chapters of this plan.
3Energy Efficiency & Water Conservation DPA
The development permit area for energy efficiency and water conservation is located in pockets
through Invermere where growth is expected. The document articulates justification, objectives and
specific design requirements. Justification and objectives include:
1. The District has committed to targets for greenhouse gas emissions for both corporate and
community greenhouse gas emissions. Development guidelines for energy efficiency and
water conservation will help the District achieve these milestones.
2. Create a positive impact on the natural environment; locally in the protection of air quality
and globally in the mitigation of climate change and its associated impacts.
3. Optimize building energy performance to reduce costs associated with the operation of
buildings.
4. Reduce the long-term infrastructure costs associated with sourcing and supplying potable
water.
5. Support innovation in building design including the use of passive solar, local materials and
renewable energy.
DESIGN GUIDELINES
Design guidelines clearly define the objectives and expectations in terms of design quality and assist
developers, designers and staff to evaluate development proposals for housing and other. The
guidelines apply to new buildings in the areas of architectural style and character, size and scale, etc.
and may have an impact on housing exterior design.
Housing 101
The housing continuum model, which has been used around the world for some time, visually
describes the different segments of housing. While ownership may not be the end goal for
residents, what’s critical is that a healthy housing stock in a city or community should ideally include
a variety of housing forms and tenures, in order to meet the diverse needs of residents from
different socio-economic backgrounds and as they move through every stage of their lives.
Source: Canada Mortgage and Housing Corporation
Methodology
In order to estimate current and future housing needs for the District of Invermere, demographic
and housing data from a variety of government data sources such as BC Statistics and Statistics
Canada were compiled, reviewed and analyzed. Much of this data was from custom tables provided
by the Ministry of Municipal Affairs and Housing. Due to the smaller population, the full suite of
government agency housing data for the analysis (e.g. market rental rates by home size) was not
4available; therefore, the housing data retrieved was supplemented with a community housing
survey, questions to local government officials, internet research and stakeholder interviews. The
community survey had a large response with 294 respondents and good mix of age demographics,
though the responses were weighted toward the 68% of respondents who were female (or identified
as).
PROJECTION METHODOLOGY
To determine future needs, communities rely on projections of population and anticipated
household demand. A well constructed projection can give stakeholders and decision-makers an
idea of where to allocate resources, which issues to prioritize, and what the future might look like.
To fulfil the requirements of BC’s Housing Needs Reports legislation, the province requires two core
projections be undertaken: first, a projection of population from 2020 to 2025 with breakdowns of
different age cohorts and special consideration of cohorts that may be growing or diminishing; and
second, a projection of anticipated number of households with breakdowns of different unit types
by number of bedrooms.
To help communities through the projection process, the Province has commissioned a specialized
projection dataset that is available through the Statistics BC website. However, the dataset is only
available on a regional level and is not granular enough to offer meaningful information for the
District of Invermere. To keep all studies in Invermere consistent, this report adopted the population
projection metrics from the Development Cost Charge update process which was agreed upon by
District of Invermere staff.
Population projections are typically developed using two main modelling techniques:
1. The Cohort Survival Method
Population projections use the Cohort Survival Method to anticipate growth every five years until the
chosen cut-off period using historical birth, mortality, and migration rates. Essentially, each five-year
cohort is given a coefficient representing the number of members of the cohort who are likely to die
or give birth during any given period. That coefficient determines how many members will make it to
the next cohort and how many new members will be added to the 0-5 cohort. Younger cohorts
typically have a coefficient of around 1 as they have high survival rates, but low birth rates. Middle-
age cohorts tend to have a coefficient of greater than 1 as they have high survival rates and high
birth rates. Older cohorts tend to have a coefficient of less than one as they have lower survival
rates and low birth rates. This data is supplemented with immigration and emigration data. The
Cohort Survival Method is generally considered to be the most accurate when working with larger
populations and is the method used by the Province to construct regional projections.
2. Constant Share Method
Constant Share is typically applied to smaller populations and relies on a well constructed cohort
survival projection to work properly. The constant share technique assumes that a smaller
community will make up a consistent proportion of a larger population and that it will broadly follow
the same growth or decline trends. This is the projection model used to project the population and
household demand of Invermere. Over the past three census periods, Invermere has made up an
average of 4.9% of the population of the Regional District East Kootenay (RDEK), never varying more
than 0.5% from the number. However, due to recent studies completed for the District of Invermere
and to avoid conflicting data, a standard population growth rate of 1.7% was chosen to keep
consistency across all reports. Housing demand by unit size is projected by analysing the historical
5share of the housing stock that each unit type occupies and assuming that those trends will
continue as the population grows. For example, if the proportion of 2-bedroom units grew between
2006 and 2016, it is assumed that the proportion of 2-bedroom units will continue to grow from
2016 to 2025. Housing demand is projected by analysing historical demand and population size a
assuming household size will remain relatively constant as the populations grows.
Like any projection exercise, results become less accurate over longer periods. These methods
assume the District of Invermere will remain in a constant state economically, socially, and
environmentally. In reality, population and household demand can change constantly due to local,
regional, and wider influences. The numbers reported in this study are meant as one tool in a
complete toolbox. Engagement and anecdotal data can be just as important when determining how
to build your community.
STATISTICS CANADA DATA LIMITATIONS
Data reported here was provided by Statistics Canada. Statistics Canada data rounds to the nearest
five in its data sets, which creates different rounding results when data is combined and when cross
tabulations are undertaken for analysis. Due to methodological changes for the 2011 Census, many
comparisons can only be made between 2006 and 2016. Finally, Census data for incomes and
housing costs are for 2015, though reported as 2016 Census data.
Total population and household reporting data are collected through the Short Form Census,
distributed to 100% of Canadian households, so the data has a high degree of accuracy. Data for
renter and owner populations and information on housing unit size (number of bedrooms) rely on
the Long Form Census, which is only distributed to 25% of households, making it less accurate. Also,
as a result, the data for renters, owners and housing unit size may not always add up perfectly.
6Community Profile
About
The District of Invermere is situated in British Columbia’s Columbia Valley, about 100km from the
Alberta border in the Regional District of East Kootenay. It sits within the Columbia River Wetlands
(one of North America’s largest intact wetlands) nestled between the Canadian Rocky Mountains to
the east, the Purcell Mountains to the west and the shores of Lake Windermere. It lies within the
traditional territories of the Ktunaxa Nation and the Secwepemc peoples.
Invermere was incorporated as a village on May
22, 1951, as a district municipality in 1983, and
became a provincially designated ‘resort
municipality’ in 2008, allowing it to receive
special privileges in hotel taxation for tourism
development initiatives.
Approximately 3,400 people live permanently in
the community and 4,200 in the surrounding
Columbia Valley area – the rural area between
Golden and Canal Flats 4. The rural area
population figure includes the 300 Aqkisqnuk
First Nation members on reserve near
Windermere south of Invermere.
Residents are proud of their community and
their enviable quality of life. The region’s
hospitable climate and natural beauty have also
attracted retirees, seasonal home owners and
recreationalists from across Canada and the world. 5
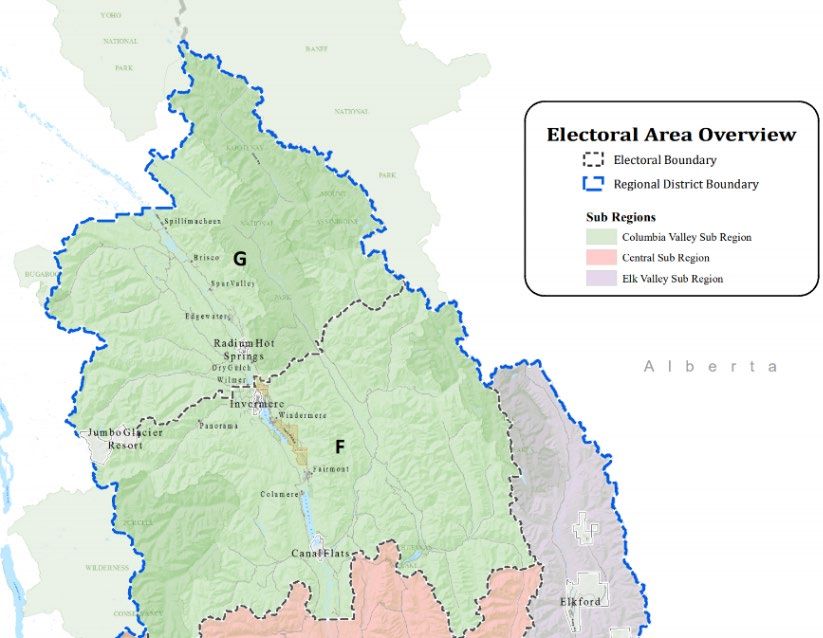
Invermere is anchored by a lively downtown that is
occupied by unique, boutique-style shops, local
restaurants and cafes, and professional services for
residents and visitors alike. Invermere is the home to
most of the Valley’s major services including the
Invermere and District Hospital, Eddie Mountain Arena,
David Thompson Secondary School, the College of the
Rockies, Pynelogs Cultural Centre, Windermere Valley
Museum Invermere and District Curling Club and the
Invermere Public Library. Since 1951 several boundary
expansions have taken place adding the neighbouring
Westside and Athalmer Improvement Districts.
Regional District of East Kootenay map 6
4
RDEK G and F
5
BC Touring
6 https://rdek.maps.arcgis.com/home/index.html#
7Due to the spectacular surroundings and tourism offerings, the community is now a year-round
destination drawing visitors from across Canada and the world. At its doorstep, residents and
visitors have the opportunity to golf, ski, mountain bike, hike, boat and enjoy the wildlife and natural
beauty of the physical setting. A short 18km drive to the west of Invermere is Panorama Mountain
Resort, ranking in the top 10 ski resorts in North America.
Population and Demographic Context
POPULATION
The District of Invermere’s population was 3,215 7 in 2016, a 20% increase from 2011 as shown in
Figure 1. This increase is much higher than both the Regional District of East Kootenay increase of
6.6%, and than the provincial increase of 6.6%.
Figure 1: Population 2011-2016.
70,000
60,439
60,000 56,685
50,000
40,000
30,000
20,000
10,000
2,675 3,215
0
Invermere RDEK
2011 2016
AGE
Median age
The population of Invermere is slightly younger than the region: Invermere’s median age is 40.1
compared to the median age in the Regional District of 44.6, but is almost exactly the same as the
provincial median age of 43.
• The age of home owner households (median age of 45 years) tends to be older than that of
renter households (median age 31 years) in 2016.
• Invermere’s median age has increased slightly from 2006 (40 years) to 2011 (44 years) and
2016 (40.1).
Age distribution
Those aged 0-14 years of age make up 17% of the population and those aged 65 and over make up
18% of the population. The population across all age categories increased from 2006 and those aged
65 and over make up a larger proportion compared to 2006.
7 Sourced from BC Statistics Housing Data from the 2016 Census
8Figure 2 Age Distribution, 2006-2016
2,500
2,000
2,105
1,500 2016
2006
1,000
500
545 565
0
0 to 14 years 15 to 64 years 65 years and over
Households Context
Number of households
• The number of households in 2016 increased to 1,375 from 1,195 in 2006.
Household size
• In general, households in Invermere are small, with most being one or two persons.
• The average household size is 2.3 with owner households being slightly larger at 2.4
compared to the average renter household size of 2.1.
Figure 3 Household Size, 2016
500
450
465
400
415
350
300
250
200
220
150 190
100
50 90
0
1 person 2 persons 3 persons 4 persons 5 or more persons
9Household tenure
• About three quarters of households are Geography Owner Renter
owner households, and Invermere leans
Invermere 985 (72%) 390 (28%)
toward less home ownership than the
region. RDEK 20,180 (78%) 5,670 (22%)
Economic Context
UNEMPLOYMENT AND PARTICIPATION RATE
In 2016, 66% of the population (1,750) 15 years of age and over in Invermere were employed with
70% (1,855) employed or looking for work (participation rate). The employment rate is higher than in
the Regional District, where 60% of the population 15 years of age and over were employed.
• Participation in the economy slowed since 2006 as those employed or looking for work in
Invermere dropped by 3 percentage points in 2016.
• Renter households in Invermere participate more in the economy than owner households.
Figure 4 Participation rate of those 15 years of age and over by household tenure, 2016
100%
90%
80%
81%
70%
60% 65%
50%
40%
30%
20%
10%
0%
Owner Renter
10NUMBER OF WORKERS BY INDUSTRY
Seven sectors account for 71% of the 1,855 job positions in Invermere. Being a resort municipality,
tourism-related jobs account for the largest employment sectors, and the remaining sectors include
a mix of health care, construction, education and manufacturing.
Table 1 Employment sectors, 2016
District of Invermere Regional District of East Kootenay
Sector Rank # % Sector Rank # %
Accommodation and 1 285 15% Retail trade 1 4,045 13%
food services
Retail trade 2 245 13% Mining, quarrying, 2 3,395 11%
and oil and gas
extraction
Health care and 3 210 11% Health care and 3 3,390 11%
social assistance social assistance
Construction 4 200 11% Accommodation and 4 3,220 10%
food services
Arts, entertainment 5 140 7.5% Construction 5 2,730 8.5%
and recreation
Educational services 6 125 6.7% Educational services 6 1,975 6.1%
Manufacturing 7 120 6.5% Manufacturing 7 1,720 5.4%
Since 2006 there has been a significant increase in tourism sector-related jobs:
District of Invermere 2016 District of Invermere 2006
Sector Rank # % Sector Rank # %
Accommodation and 1 285 15% Construction 1 210 12%
food services
Retail trade 2 245 13% Accommodation and 2 195 11%
food services
Health care and 3 210 11% Retail trade 2 195 11%
social assistance
Construction 4 200 11% Arts, entertainment 4 165 10%
and recreation
Arts, entertainment 5 140 7.5% Health care and 5 115 7%
and recreation social assistance
11COMMUTING
There was a similar proportion of Table 2 Commuting flow, Census 2016
workers commuting in 2016 as in 2006.
The majority of those work in the District of Invermere 2016 2006
District of Invermere; however, the Total - Labour force population
percentage of workers commuting aged 15 years and over 1,855 1,720
outside of Invermere (within the
Commuters with a usual place
Regional District) has increased from of work 1,390 (75%) 1,340 (78%)
21% in 2006 to 31% in 2016.
within the District of
• In 2016, 760 workers from outside Invermere 67% 75%
the District commuted to it from the
different area with the
region, including 100 from the
immediate region 31% 21%
Shuswap IR.
HOUSEHOLD INCOME
The 2016 median household income of Table 3 Household Income all, adjusted to 2015, 2006-2016 Census
$74,798 in Invermere is about 3% lower
than the RDEK household income of Median Household Income 2006 2016
$76,887.
All $65,262 $74,798
• Median household incomes in
today’s dollars trended upwards by Owners $ 73,749 $87,208
13% from 2006 to 2016, indicating Renters $ 36,035 $49,928
an increase in purchasing power.
One-person households – with
• Owner households’ median income no family $ 37,248
was greater than renter households’ Two-or-more person
median income in 2016. households $ 91,676
• A disparity in income between owners and renters is displayed in Figure 5 with a much higher
percentage of renter households than owner households with incomes below $35,000.
Figure 5 Household Income Distribution, 2016 Census
100%
90% 370 55
80% 70
70%
60% 135
245
50%
40%
30% 260
115
20%
10%
110
0%
Owner Renter
$34,999 and Under $35,000-$69,999 $70,000-$99,000 $100,000+
12In 2016, the median income of a single person living alone was $37,248 and for two or more-person
households it was $91,676. Lone parent households have significantly less income than couples with
kids.
Figure 6 Median Incomes by Household Type, Census 2016
Couple with kids (355) $118,528
Couple without kids (455) $84,224
All households (1375) $74,606
Lone parent (120) $48,384
Single not in famlies (370) $37,248
13Current Housing
This section of the document summarizes information on Invermere dwellings, housing stock,
market values and affordability, core housing need indicators, as well as other types of housing.
Most of the data in this section is taken from Statistics Canada Census program data as processed
and organized in the custom information delivered to the BC Ministry of Municipal Affairs (direct
Census data is used where significant differences exist); other sources include BC Assessment, BC
Housing, District of Invermere and local interviews.
Current Dwellings
Statistics Canada collects data on private dwellings occupied by “usual residents”, which means
dwellings occupied on a permanent basis.
DWELLINGS AND STRUCTURAL TYPE
The District of Invermere neighbouring region housing demand and supply is strongly influenced by
non-resident owners. There are 2,032 dwellings in Invermere and only 68% of those, or 1,375, are
considered inhabited by usual residents. About 32% or about 650 are not utilized permanently. In
2018, a survey by Host Compliance Inc. of vacation rentals showed 171 units 8 in Invermere, so most
of the 650 are likely for personal vacation use or other.
Note the Statistics Canada data in the following sections refers to only occupied private dwellings and does
not include information on homes that are occupied seasonally or that are not used.
Of the 1,375 occupied dwellings in Invermere, the majority are single detached dwellings providing
more than two thirds (70%) of all housing options. In comparison, the provincial rate of single
detached dwellings is only 44%.
Figure 7 Dwelling Type by Number
Semi-detached
Dwelling Types, 2016 house, 100
Row house, 85
Apartment or
flat in a duplex, 80
Single-detached Apartment in a
house, 965 building that has
fewer than five
storeys, 125
Other single-
attached house, 10
Movable
dwelling, 10
8
Emailed note from the RDEK.
14Other dwelling types make up 30% of all dwellings and refer to semi-detached houses (duplexes),
apartments or flats in a duplex (may include secondary suites), row houses, apartments in buildings
less than five storeys, and movable dwellings such as a trailer.
Owners in Invermere mostly live in single detached dwellings (82%) and only 38% of the renter
households in Invermere live in single detached dwellings.
Figure 8 Dwelling Types by Tenure
Owner Dwelling Type, 2016 Renter Dwelling Type, 2016
Single-detached
house, 815
Other attached
Single-detached
Other attached dwelling, 240
dwelling, 165
house, 150
The breakdown of housing types is essentially unchanged for owners between 2006 and 2016;
however, there is now a greater percentage of renters living in single detached homes: 39% in 2016
vs. 29% in 2006.
NUMBER OF BEDROOMS
Despite a very large number of one and two-person households, most dwellings have 3 or more
bedrooms. There is potentially a mismatch (shown in Figure 9) between housing needs and housing
supply and perhaps an opportunity to better meet community housing needs by better aligning
dwellings and households based on size. However, even with the significant number of 3 or more-
bedroom dwellings, some survey respondents indicated a need for 3 bedrooms and focus group
participants noted a trend for 3 plus bedrooms for guests and families to visit. Additional
consideration will be required to better understand market needs.
Figure 9 Comparison of the number of households by size to the number of bedrooms in dwellings
Household Size and Bedrooms, 2016
600
500
# of households/units
490 505
400 465
415
300
295 280
200
220
100
85
0
1 person/ 1 bd 2 persons/ 2bd 3 persons/3 bd 4+ persons/ 4 bd+
15PERIOD OF CONSTRUCTION
• Just over half of the occupied Table 4 Dwelling Age, Census 2016
dwellings were built before 1990 and
very few homes were constructed in
Dwelling Age 2016 # 2016 % 2016 % RDEK
the period from 2011 to 2016.
• The housing stock is slightly newer 1960 or before 215 16% 18%
than in the greater region. See Table
1961 to 1980 375 27% 37%
4.
1981 to 1990 185 13% 13%
• There were 104 dwellings
constructed in Invermere from 2016 1991 to 2000 245 18% 14%
to 2018 and while the list includes 2001 to 2010 340 24% 13%
five secondary suites, 64 of the 104
were single detached homes. Recent 2011 to 2016 15 1% 4%
construction reveals a slight shift
toward multi-unit homes compared
to the baseline in 2016.
RENTALS AND SECONDARY SUITES
Interviews highlighted the importance of secondary suites for rental housing, but also the challenge
of these units being rented out for short-term use in the summer months, impacting access to long-
term leases.
BC Assessment records from 2020 specifically indicate that there are 129 single family “residential
dwellings with suite” and a few other arrangements with suites such as large rural lots with a home
and a suite. However, not all suites are registered 9. According to interviewees most of the rentals in
the community are in secondary suites and these units play an important role for workforce
housing. The same BC Assessment actual property use data shows four purpose-built rental facilities
in the community ranging from four to 18 units..
SENIORS
Current seniors’ housing can be broken down into independent seniors’ housing and assisted
housing. Independent housing includes market units such as detached homes or adult townhome
communities such as the18 multi-family units at Osprey Lane and eight units at Fieldstone Glen.
These multi-family units along with some others specific to older adults were built in the early 1990s,
though they may not be resided only by seniors at the moment. Independent seniors’ housing is
also included in the 24-unit Lake View Manor Society building.
Seniors’ housing type Name of rental residence Units
Lakeview Manor – Lion’s Club 24
Osprey Lane (Ownership) 18
Independent Living
Fieldstone Glen 8
Columbia Garden Village 55
9
Interviews
16Assisted Living Columbia Garden Village 8
Residential/Long-Term Care Columbia House/Hospital 35 (2 for short stays)
Total 148
Assisted and independent living situations are housed in the Columbia Garden Village building,
which has 63 units. Most (55) units are market units and rented out on a private pay basis and eight
of the units are subsidized units based on incomes. Full residential care with around the clock
nursing services is offered at Columbia House with 35 beds (two for short stays), which is subsidized
by the Interior Health Authority and located beside the hospital. While it appears there is an
adequate number of public and private seniors’ housing units in Invermere it should be noted that
this housing serves the greater region, not just Invermere residents.
SUPPORTIVE AND OTHER NON-MARKET HOUSING
Community Living BC supports housing for adults with At time of writing, all units at
diverse abilities at Mount Nelson Place. This housing Carriage Court (managed by Family
residence provides 24/7 support for up to 12 residents. Dynamix (FDx)) were being used as
affordable housing to meet the
BC Housing data of non-market housing, with which BC
demand despite the ability to rent
Housing has a financial relationship, shows 61 services
up to nine units at market rental
mixed between rent assistance, independent social
rates.
housing units and transition/assisted living units. See
Table 5. The 42 services of independent social housing
make up the majority of the 61 services with 18 units
targeted at low income families (of all life stages) in Carriage Court (managed by Family Dynamix
Association, a registered not for profit society based in Invermere) and 24 units targeted at low
income seniors in Lakeview Manor, supported and subsidized by the Lions Club of Invermere.
In addition to these units there are nine units of transitional/assisted living housing for frail seniors,
special needs, or women and children fleeing violence. The remaining 10 services from BC Housing
includes rent assistance for families/seniors as of 2019.
Table 5 BC Housing Services
Emergency Independent Rent
BC Housing Services (overlaps Transitional/
Shelter Living Support Assistance
with seniors table) Assisted Units
Support Units
Invermere 0 9 42 10
As of 2019 there were no emergency shelters and housing for the general homeless population, of
which there are some. However, Family Dynamix owns three single family homes with support from
federal funding in Invermere that are used for those at risk of homelessness and/or youth/women
who have experienced or are at risk of domestic violence.
The 18 units for Carriage Court created in 2014 targeted at families was funded by the Governments
of Canada and British Columbia with contributions from the Columbia Basin Trust. The units were
developed by converting an existing apartment complex. 10
10
https://archive.news.gov.bc.ca/releases/news_releases_2013-2017/2014mngd0007-000159.htm
17As for new developments, Family Dynamix is a partner with BC Housing in a new 30-unit
Farmhouse 11 affordable housing development. Family Dynamix will operate and manage all of the
units, 25 of the units will be owned by BC Housing. and five will be owned by Family Dynamix under
an agreement with BC Housing.
Housing Costs
RENTAL AND OWNER SHELTER COSTS
Shelter costs provide a snapshot in time of monthly costs for all households. They cover the real
costs of those living in the community for potentially many years plus those who’ve recently moved,
and do not necessarily reflect the cost of someone moving to the community with a small down
payment for a home, for example.
• Renters’ monthly housing costs in 2016 are slightly lower than owners’ monthly housing
costs.
• While the average monthly shelter cost for renters is similar to that for owners, the shelter
cost-to-income ratio 12 for renters is much higher than for owners.
• The shelter cost-to-income ratio slightly improved from 2006 to 2016.
• Rental and ownership costs as well as the shelter cost-to-income ratios are higher than in
the regional district.
Table 6 Stats Canada, Shelter Costs 2006, 2016, - 2015 constant dollars
Invermere RDEK
2006 2016 2016
All
Average monthly shelter cost $1,050 $1,175 $1,035
Average (shelter cost-to-income ratio) .22 .21 .18
Renter (390 Dwellings)
Average monthly shelter cost $855 $1,130 $932
Average (shelter cost-to-income ratio) .31 .29 .28
Owner (985 Dwellings)
Average monthly shelter cost $1,107 $1,193 $1,064
Average (shelter cost-to-income ratio) .20 .18 ./16
11
http://generationhomesinvermere.com/
12
Shelter-cost-to-income ratio refers to the proportion of average total income of household which is spent on
shelter costs.
18OWNERSHIP – ASSESSED VALUES AND PRICES
The median assessed value for a residential home in Invermere in 2019 was $474,144. This recent
value represents an increase of 12% since 2011 and 52% since 2006. As expected, single
detached dwellings are assessed at a higher value than other dwelling as seen in Table 7.
Figure 10 Median Assessment, BC Assessment 2011-2019
Median Assessment of a Detached Home
500,000 $474,144
430,859 438,872 434,410
450,000 423,549
400,000
350,000 311,241
300,000
250,000
200,000
150,000
100,000
50,000
0
2006 2011 2016 2017 2018 2019
Value 311,241 423,549 430,859 438,872 434,410 $474,144
Table 7 Average Value, BC Assessment 2020
Average
Property Type Number of Units Assessed Value
Residential (Single Detached) 1,116 $495,481
Other 898 $333,310
Average
One bedroom Number of Units Assessed Value
Residential (Single Detached) 13 $ 342,085
Other 28 $ 182,957
Average
Two bedroom Number of Units Assessed Value
Residential (Single Detached) 131 $ 374,236
Other 404 $ 253,711
Average
Three bedroom+ Number of Units Assessed Value
Residential (Single Detached) 972 $ 513,873
Other 466 $ 411,353
19Housing Needs and Affordability
RENTAL HOUSING AFFORDABILITY
Affordable housing is considered affordable when the shelter costs are 30% or less of the
occupant’s before tax household income.
To better understand housing affordability in Invermere, the annual household income required to
afford shelter costs was calculated along with the shelter costs afforded by a different household
incomes.
Table 8 highlights that households in Invermere earning the 2016 median renter household income
of $49,928 are able to afford $1,248/month in shelter costs.
• The median income renter household is able to afford a current one-bedroom unit, but the
two bedroom and larger units are a stretch.
• A household with an income of $42,000 (slightly below the median household income) is
able to afford the 2016 median rental shelter costs of $1,049, however there are 345-355
households in Invermere reporting under that income level.
Table 8: Affordable Shelter, Census 2016 and CMHC (green means affordable, yellow means difficult to afford, orange
means unaffordable)
30%-
Renter Median Affordable Monthly 2020 Median Shelter
< 35% of >
Household Income Rent (30% of Income) Prices/month
income
Census All Rental Shelter: $1,049
(2016)
One-bedroom: $925 13
$49,928 $1,248
Two-bedroom: $1,325
Three-bedroom+: $1,625
Table 9 Affordable Shelter, Census 2016 and CMHC
Household (# of household types) Affordable 2020 Median Shelter
Median
Monthly Rent Prices/month
Household
(30% of
Income (All)
Income)
Two-bedroom: $1,325
Lone Parent (120) $48,384 $1,210
Three-bedroom: $1,625
One-person household (370) $37,248 $931 One-bedroom: $925
Couple families without children (455) $84,224 $2,105 One-bedroom: $925
Two-bedroom: $1,325
Couple families with children (355) $118,528 $2,963
Three-bedroom: $1,625
13 Estimated rent based on web search and conversation with local property management company, includes
$125 for utilities as per CMHC estimate for owned homes. Facebook Columbia Valley Rentals,
http://www.gdpm.ca/
20RENTER HOUSEHOLD NEEDS
Engagement findings
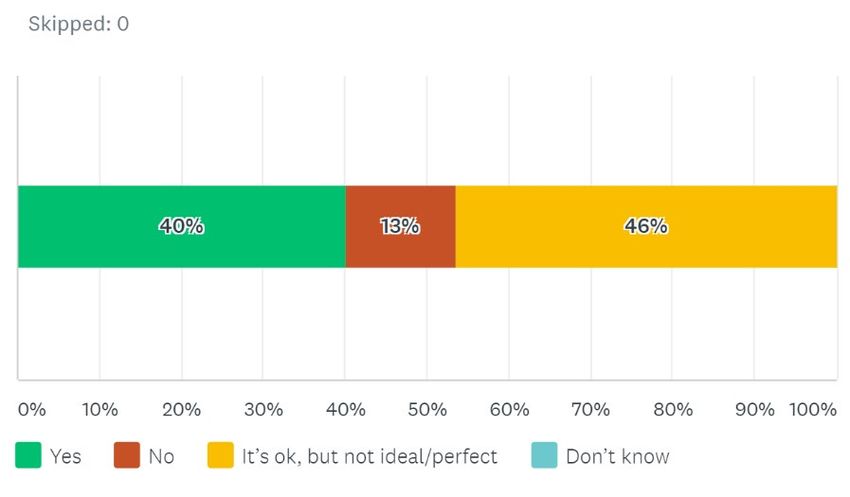
Figure 11 Renter, housing type and size perspective – Does your current housing type
and size meet the needs of your household/family situation?
Most renter survey
respondents
indicated that their
current housing type
and size meets the
needs or was “ok”
given their situation.
Those indicating it did not meet their needs or Additional secondary concerns included:
that it was just “ok” noted a variety of primary
• “not enough storage”/”no garage”
concerns in order of frequency:
• ‘not enough green space or space for a
• “too expensive”
garden”,
• “too small – general living area”,
• “poor quality”
• “arrangement is not secure” and “unsafe”.
A few noted not enough accessibility features.
Only six noted that they didn’t have enough
bedrooms and most of those respondents
required three bedrooms.
What housing type would better meet your needs?
Single-family
detached homes are
the type of dwelling
sought after by
those without ideal
housing.
21Please indicate which supportive features would better meet your current housing
needs (61 answered)
Of those requiring
supportive design
features most would
like single level
dwellings, followed
by accessible
dwelling units and
“other”.
RENTER CORE HOUSEHOLD NEEDS
Beyond the local housing survey, the most recent Census Of all the renter households,
tracks the core housing issues of affordability, 85-90 or 25% are in core
overcrowding and the safety of home systems. housing need, meaning that
Of the 390 renter households in Invermere, 40% they fall into one of the core
(approx. 155 households) are spending 30% or more categories and cannot afford
of their before tax income on shelter costs. alternative housing.
• Most of those renters are one and two-person
households.
• Of the 155 households, about 10% are in severe affordability need, which is defined as
spending between 50% and 100% of income on housing and not able to find other
housing. 14
Overcrowding can also be an issue and overcrowded conditions may indicate inadequate housing
and affordability issues. About 7-8% or 25-35 of Invermere’s rental households are inadequately
housed. Housing requiring significant repairs also challenges tenants.
Only 3% (10) of the renters in Invermere in the 2016 Census indicated that major repairs 15
were needed. RDEK results for renters requiring repairs is higher at 10% of renter households.
14
Stats Canada Census 2016
15The 'major repairs needed' category includes dwellings needing major repairs such as dwellings with
defective plumbing or electrical wiring, and dwellings needing structural repairs to walls, floors or ceilings.
22OWNERSHIP HOUSING AFFORDABILITY
Housing that costs 30% or less of occupants’ before tax household income is considered to be
“affordable.”
To better understand housing affordability the annual household income required to afford the
average assessed values of homes in Invermere was calculated. Assumptions include using a 25-
year amortization, 5% down payment, 3.14% interest rate, and other monthly costs 16 including:
taxes ($176), heat etc. ($125), strata or other costs ($167).
Table 10 highlights that owner households in Invermere earning the median household income of
$87,208 are able to afford $2,180/month in housing costs. (Comparatively, renters earning the
median income can afford $1,248/month in housing costs.)
• Current owners with a median household income are more than able to afford the average
costs for one- and two-bedroom strata/other and detached dwellings; however, they would
be stretched to afford the three bedroom plus units.
• There are up to 500 households in Invermere without the income to support the ownership
costs of the average strata based 17 one-bedroom residential dwelling of $1,236/month.
Table 10: Affordable Ownership, Census 2016 and BC Assessment
30%- Owner Median Affordable Average Detached Average Strata/Other
< 35% of > Household Monthly Costs Monthly Prices 2019 Monthly Prices 2019
income Income (30% of Income)
2016 Census (med.): 2016 Census (med.):
$1,020 18 $1,020 19
$ 87,208 Owner $2,180
One-bedroom: $1,561 One-bedroom: $1,236
Two-bedroom: $1,708 Two-bedroom: $1,559
Three-bedroom: $2,346 Three-bedroom: $2,279
16 http://www.cmhc-schl.gc.ca/en/co/buho/buho_020.cfm
17
Strata units on average are lower costs than non-strata units so strata prices are used to for this statistic.
18 This result is likely very low due to the fact that only 51% of owners have a mortgage.
19 This result is likely very low due to the fact that only 51% of owners have a mortgage.
23You can also read