Seismotectonic Snapshots: The 18 March 2020 Mw 5.7 Magna, 31 March 2020 Mw 6.5 Stanley, and 15 May 2020 Mw 6.5 Monte Cristo Intermountain West ...
←
→
Page content transcription
If your browser does not render page correctly, please read the page content below
Focus Section: Intermountain West Earthquakes

              Seismotectonic Snapshots: The 18 March
              2020 M w 5.7 Magna, 31 March 2020 M w 6.5
              Stanley, and 15 May 2020 M w 6.5 Monte
              Cristo Intermountain West Earthquakes
              Steven G. Wesnousky*1

                  Abstract
                  Seismological characteristics of the 18 March 2020 M w 5.7 Magna, 31 March 2020 Mw 6.5
                  Stanley, and 15 May 2020 M w 6.5 Monte Cristo Intermountain West earthquakes are
                  largely consistent with expectations arising from observations accumulated over the
                   ∼ 40 yr since implementation and subsequent growth of seismic networks in the broad
                  region. Each occurred within a zone of relatively elevated seismicity, active faults, and
                  geodetically observed strain accumulation. Aftershock distributions in each are con-
                  fined primarily to depths of < 15 km, and the total number of aftershocks correlates
                  with the relative size of the events. In each case, the number per day decays exponen-
                  tially in the days following the mainshock. None of the mainshocks was preceded by a
                  foreshock sequence that delivered a plausible warning of the impending earthquakes.
                  With respect to tectonics, each earthquake brings new insights. The Stanley and Monte
                  Cristo earthquakes are at the margins of geodetically defined regions of right-lateral
                  transtension, though the pattern of faulting in each region is markedly different.
                  The strike-slip mechanism of the Stanley earthquake stands in contrast to the zone
                  of normal major range bounding faults and historical earthquake ruptures that charac-
                  terize the region in which it occurred and is the first relatively well instrumented event
                  to show a rupture extending northward through the Trans-Challis fault system. The
                  Magna event has been interpreted to represent low-angle normal slip near the base
                  of a listric Wasatch range bounding fault (Pang et al., 2020). The east-striking left-lateral
                                                                                                                                                       Cite this article as Wesnousky, S. G.
                  Monte Cristo earthquake within the Walker Lane is in contrast to the major northwest-                                                (2021). Seismotectonic Snapshots: The 18
                  striking right-lateral faults that dominate the area, though predictable from prior                                                  March 2020 Mw 5.7 Magna, 31 March
                  regional mapping. Surface rupture reportedly accompanied only the Monte Cristo                                                       2020 Mw 6.5 Stanley, and 15 May 2020
                                                                                                                                                       Mw 6.5 Monte Cristo Intermountain West
                  earthquake, though its trace does not clearly follow the zone of aftershocks.                                                        Earthquakes, Seismol. Res. Lett. XX, 1–18,
                                                                                                                                                       doi: 10.1785/0220200314.

              Introduction                                                                                    Earthquake Locations in General
              The United States Intermountain West produced three signifi-                                    Tectonic Framework
              cant large earthquakes in 2020 (Fig. 1). The M w 5.7 Magna,                                     The appellation Intermountain West here refers to the
              Utah, the M w 6.5 Stanley, Idaho, and the M w 6.5 Monte                                         continental western United States located between the Sierra
              Cristo range, Nevada, earthquakes are the largest registered in                                 Nevada and Cascade mountain ranges in the west and the
              the last several decades or more in each of the areas where they                                Wasatch Range and Rocky Mountains in the east (Fig. 1).
              occurred. The earthquakes are reminders of the seismic hazard                                   The area encompasses three distinct regions distinguished
              that accompanies the ongoing diverse tectonic processes across                                  by different orientations and styles of active faults. Each region
              this vast area. Here, each is briefly described in context of con-                              was host to one of the 2020 earthquakes.
              temporary seismicity of M > 2 documented in the Advanced
              National Seismic System (ANSS) Comprehensive Earthquake
                                                                                                              1. Center for Neotectonic Studies and Nevada Seismological Laboratory, University of
              Catalog (U.S. Geological Survey [USGS], 2020a), the historical                                  Nevada, Reno, Nevada, U.S.A.
              and geological record of prior large and nearby earthquakes,                                    *Corresponding author: wesnousky@unr.edu
              and the tectonic framework of the surrounding regions.                                          © Seismological Society of America

              Volume XX        •   Number XX          •   – 2021      •   www.srl-online.org                                                          Seismological Research Letters             1

Downloaded from http://pubs.geoscienceworld.org/ssa/srl/article-pdf/doi/10.1785/0220200314/5217237/srl-2020314.1.pdf
by wesnousky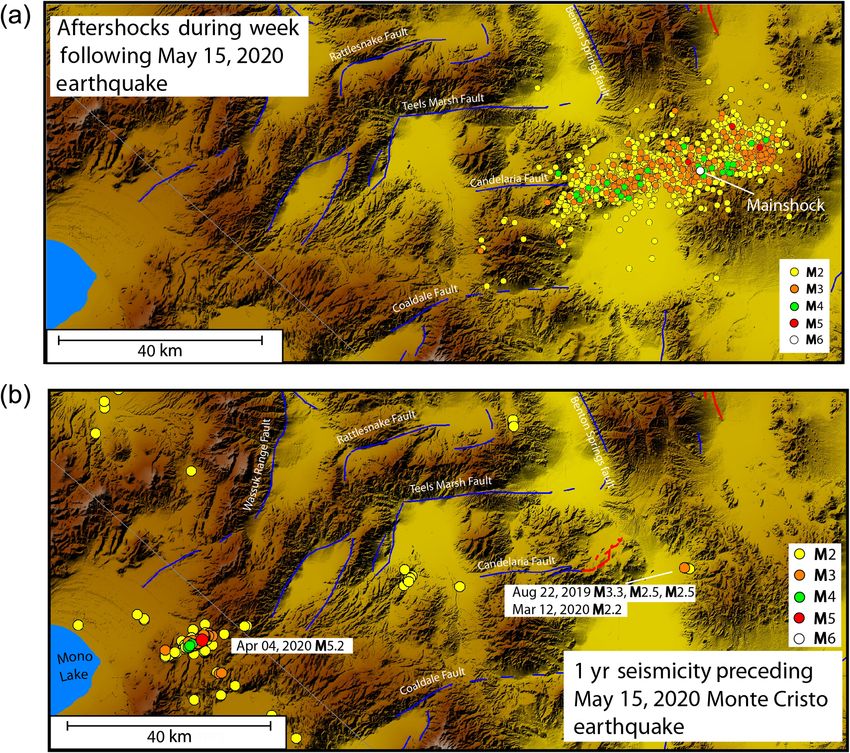
Figure 1. (a) Aftershocks (white dots) and mainshock focal                                      Earthquake Catalog (ComCat) since 1930 (USGS, 2020a).
                  mechanisms of three significant 2020 earthquakes (each labeled)                                 Dashed polygons encompass seismicity used in regional seis-
                  in the Intermountain West shown on physiographic map dis-                                       micity analysis. Physiography is from Becker et al. (2009). Fault
                  playing distribution of major active faults (colored lines).                                    distribution modified from the U.S. Geological Survey (USGS)
                  (b) Aftershock sequences shown in relation to epicenters of                                     Fault and Fold Database (USGS, 2020b) and earthquake data
                  M ≥ 2 earthquakes across western United States reported in                                      taken from ANSS ComCat (USGS, 2020a). The color version of
                  Advanced National Seismic System (ANSS) Comprehensive                                           this figure is available only in the electronic edition. (Continued)

                      The zone of northwestward-striking (blue) faults along the                                  northeast, generally exhibit normal displacement, and the dis-
                  eastern edge of the Sierra Nevada is right-lateral, largely                                     placements have resulted in the distinct basin and range topog-
                  strike-slip and associated with higher levels of instrumentally                                 raphy from which the region derives its name: the Basin and
                  recorded seismicity than adjacent regions (Fig. 1). Cumulative                                  Range province (Fig. 1 and, e.g., Stewart, 1978). Estimates of
                  right-lateral offsets across the zone from ∼12–8 Ma register                                    the cumulative extension that has accompanied development
                  between ∼30 and 100 km, generally decreasing from south to                                      of the basin and ranges since initiation in the early Miocene are
                  north (e.g., Faulds et al., 2005; Wesnousky, 2005a; Oldow et al.,                               on the order of 50–100 km at ∼40° N (Thompson, 1959;
                  2008). The zone of faults is commonly referred to as the eastern                                Hamilton and Meyers, 1966; Stewart, 1971). Instrumentally
                  California shear zone in the southeast and the Walker Lane as it                                recorded seismicity is distributed unevenly across the province:
                  progresses northwestward from California into Nevada. The                                       generally broad, diffuse, and at relatively low rates of occur-
                  M w 6.5 Monte Cristo earthquake occurred in the Walker                                          rence within the interior of the province relative to higher rates
                  Lane. Ongoing right-lateral shear across the Walker Lane at                                     at the margins adjacent to the Wasatch and within the Walker
                  the latitude of the earthquake is ∼8 mm=yr (Bormann                                             Lane. The pronounced belt (zone) of seismicity at the eastern
                  et al., 2016).                                                                                  margin of the Basin and Range initially documented by Cook
                      East of the Walker Lane, the pattern and style of faulting                                  and Smith (1967) is now commonly referred to as the
                  abruptly changes. The faults (green in Fig. 1) strike north to                                  Interseismic Mountain Belt following the early efforts of

                  2       Seismological Research Letters                                                               www.srl-online.org   •   Volume XX   •   Number XX    •   – 2021

Downloaded from http://pubs.geoscienceworld.org/ssa/srl/article-pdf/doi/10.1785/0220200314/5217237/srl-2020314.1.pdf
by wesnousky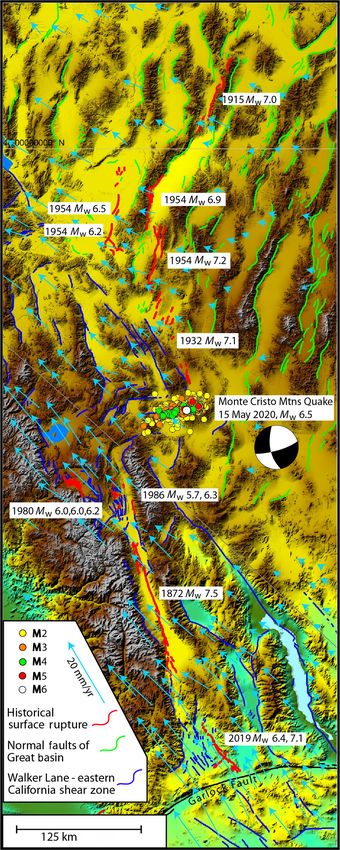
Figure 1. Continued

              Sbar et al. (1972) and Smith and Sbar (1974) to place the zone                                      The region north of the east Snake River Plain also displays
              in a geophysical and tectonic framework. Abrupt geophysical                                     basin and range topography and normal faults distinguishable
              and tectonic changes from west to east across the belt include a                                from those to the south by their northwesterly strike (light blue
              marked increase in crustal thickness from ∼30 to 40 km or                                       faults in Fig. 1). The zone of faults and associated seismicity has
              greater (Gilbert, 2012), a similarly abrupt decrease in heat flow                               been labeled the Centennial Tectonic belt, following the study
              (Lachenbruch, 1978; Davies, 2013) (47  16 mWm−2 to                                             of Stickney and Bartholomew (1987). The Trans-Challis fault
              83  21 mWm−2 ), and reduction in crustal extension rates of                                    system (TCFS) consists of northeast-trending faults and erup-
              ∼2–3 mm=yr to virtually zero (Chang et al., 2006; UNAVCO,                                       tive centers that correlate to and may provide structural control
              2020). The west-dipping normal fault that defines the western                                   to the northwest extent of the major northwest ranges, basins,
              flank of the Wasatch mountains is recognized to accommodate                                     and normal faults that compose the area (Bennett, 1986).
              the larger share of the extension (Schwartz and Coppersmith,                                    Instrumentally recorded seismicity within the belt is generally
              1984; DuRoss et al., 2016). On the basis of structural analysis                                 sparse and distributed (Fig. 1) except for distinct concentra-
              of seismic reflection profiles and geodetic observation, it has                                 tions of seismicity at its margin in the vicinity of the 1959
              been interpreted that the Wasatch range bounding fault is                                       M w 7.3 Hebgen Lake normal-fault surface rupture (Witkind
              listric rather than planar at depth (Smith and Bruhn, 1984;                                     et al., 1962), the Yellowstone Plateau, and what are the after-
              Mohapatra and Johnson, 1998; Velasco et al., 2010), though                                      shock distributions of the Stanley and large normal 1983
              the idea has yet to be tested with the occurrence of a large sur-                               M w 6.9 Borah Peak earthquakes (Richins et al., 1987). The east
              face-rupturing earthquake along the Wasatch. The M w 5.7                                        Snake River Plain is located along a time-transgressive belt of
              Magna epicenter and aftershocks are located within the                                          silicic and caldera-forming volcanism that commenced within
              Intermountain Seismic belt and along the Wasatch range                                          the Owyhee Plateau ∼14–12 Ma and migrated northeastward
              bounding fault.                                                                                 to reach the Yellowstone Plateau about 2 Ma, where volcanic

              Volume XX        •   Number XX          •   – 2021      •   www.srl-online.org                                                 Seismological Research Letters    3

Downloaded from http://pubs.geoscienceworld.org/ssa/srl/article-pdf/doi/10.1785/0220200314/5217237/srl-2020314.1.pdf
by wesnousky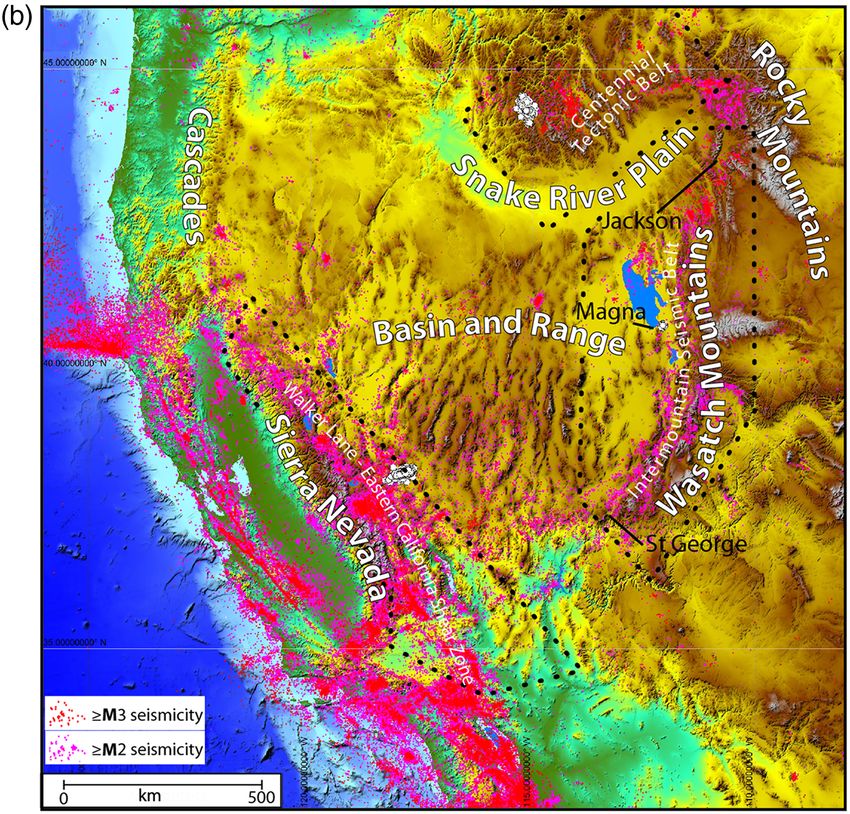
processes remain active today (Pierce and Morgan, 1992). The                                    azimuth (trend of majority of faults along Wasatch) suggests
                  time-transgressive sequence of volcanism is now generally                                       an inclination and thus dip of the fault plane to the southwest,
                  attributed to migration of the North American continent over                                    consistent with displacement on the near north-striking nodal
                  a mantle plume now commonly referred to as the Yellowstone                                      plane of the focal mechanism for the event shown in Figure 1.
                  “hot spot” (Morgan, 1972). Subsequent Quaternary eruptions                                      The rupture appears to have propagated up-dip from the hypo-
                  of basalt flows are responsible for the smooth surface that                                     center. The event occurred in the densest portion of the Utah
                  marks the east Snake River Plain (Fig. 1 and Kuntz et al., 1992).                               Regional Seismic Network (Pankow et al., 2020) and the depth
                  The Centennial Tectonic belt overall has been interpreted to                                    uncertainties attached to the event locations average 100 km from the margin of the Snake River Plain.                                       the day following the mainshock (Fig. 3b,d), and then rapidly
                                                                                                                  and exponentially decayed to less than an aftershock per day a
                  The Earthquakes                                                                                 week following the event. The decay rate is formalized with a
                  18 March 2020 Mw 5.7 Magna event                                                                curve fit in the form of the modified Omori Law of Utsu (1961)
                  In framework of regional seismicity. The location of the                                        with a p-value of 0.74 in Figure 3d. The b-value of the after-
                  Magna event is labeled and shown by white dots within the                                       shock distribution when plotted in the form of the Gutenberg–
                  dashed polygon that encompasses the Wasatch Mountains                                           Richter distribution (Fig. 3e) is 0.71, less than the value of 1.1
                  in Figure 1. The noticeable increase in the recorded number                                     observed for the entirety of the region (Fig. 2e).
                  of events per year during 1975–1980 followed a significant
                  modernization of the Utah seismic network (Arabasz, 1979)                                       In framework of active faults, instrumentally recorded
                  (Fig. 2a). Seismicity here also shows most events occurring                                     seismicity, and geodetic velocity field. The aftershock
                  at midcrustal depths of 5–10 km (Fig. 2b,c), with a lesser num-                                 distribution of the Magna earthquake is plotted in the context
                  ber of events located at depths reaching to 20–25 km. The log                                   of the distribution of nearby active faults, the geodetic velocity
                  of the cumulative number of events (N) greater than or equal                                    field, and seismicity in Figure 4. The historical and instrumen-
                  to magnitude M per year since 1980 is plotted in Figure 2d.                                     tal record along the Wasatch, though absent of major surface
                  The observations are characterized by a b-value of 1.1 when                                     rupture earthquakes, has identified a number of moderate-size
                  fit to the Gutenberg–Richter relationship log N=yr  a − bM.                                    events prior to the Magna earthquake that have gained the
                  Assuming 34 yr of recording is sufficiently representative of                                   attention of analysts and are noted in Figures 1 and 4. The
                  longer-term rates of seismicity, the curve fit predicts the                                     1884 M 6.3 Bear Lake earthquake is the earliest (Fig. 1).
                  expectation of an M 6.5 or greater earthquake every ∼184 yr.                                    Evans et al. (2003) integrate felt reports with geologic obser-
                  In this regard and to similar prior analyses (e.g., Working                                     vation to interpret the event occurred on an east-dipping nor-
                  Group on Utah Earthquake Probabilities [WGUEP], 2016),                                          mal fault antithetic to a major west-dipping normal fault. The
                  the lack of any M 6.5 or greater earthquakes in the historical                                  M w 1934 Hansel Valley earthquake was accompanied by
                  record can reasonably be expected. Similarly, the plot indicates                                upward of 5 km of generally north to northeast-striking and
                  that events equal to or greater than the M 5.7 event may be                                     commonly en échelon ground cracks (Bodle, 1934; Shenon,
                  expected every 25 yr or so.                                                                     1936) that most recently have been correlated with seismic
                                                                                                                  profiling to correlate spatially with subsurface offsets in
                  Mainshock and aftershocks. Aftershocks from the ANSS                                            Quaternary deposits (Bruno et al., 2017). The analysis of
                  catalog are confined to depths between 5 and 12 km (Fig. 3a)                                    Doser (1989) of P waveforms for the event places the event
                  with the majority between 8 and 10 km (Fig. 3c). The main-                                      M w at 6.6 and suggests the earthquake produced largely
                  shock hypocenter determined with travel time is ∼12 km and                                      left-slip on a northeasterly striking fault plane, consistent with
                  at the lowest depth of the aftershock distribution (Fig. 3a,c).                                 east–west tension. The nearby 1962 Cache Valley earthquake
                  The plot of aftershocks as a function of depth along a 50°                                      was subjected to similar waveform analysis, assigned a moment

                  4       Seismological Research Letters                                                               www.srl-online.org   •   Volume XX   •   Number XX   •   – 2021

Downloaded from http://pubs.geoscienceworld.org/ssa/srl/article-pdf/doi/10.1785/0220200314/5217237/srl-2020314.1.pdf
by wesnousky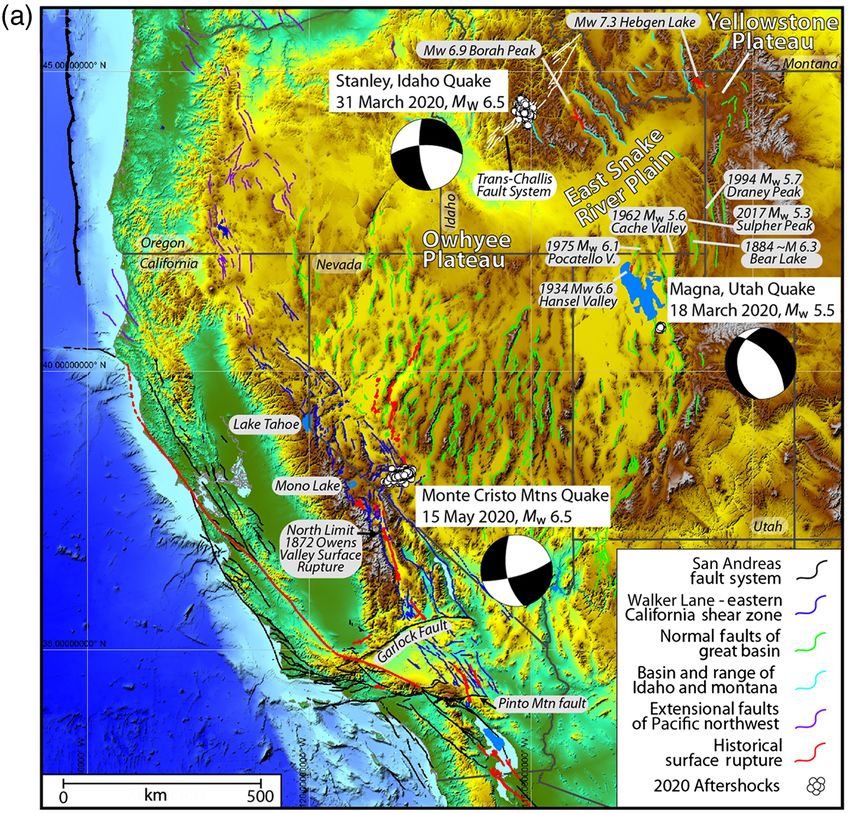
magnitude M w 5.6, and attrib-
uted to slip on a northeast-
striking oblique normal fault
(Westaway and Smith, 1989).
Immediately to the north
first-motion study and wave-
form analysis of the 1975
Pocatello Valley earthquake
show the M w 6.1 event was
produced by normal displace-
ment on a northerly dipping
fault plane. The Pocatello event
was accompanied by ground
fractures but apparently an
absence of primary surface
rupture on the causative fault
(Coffman and Stover, 1975;
Arabasz et al., 1981). The most
recent 2017 M w 5.3 Sulphur
Peak mainshock similarly
exhibits normal displacement
on a northerly striking fault
plane and distinguished by an
energetic aftershock sequence
attributed to aseismic afterslip
(Koper et al., 2018). In sum,
each of the events exhibited
focal depths less than 10 km
and produced slip consistent
with east–west crustal exten-
sion. When viewing the
Magna event location in
context of the entire record
of instrumentally recorded
events, small events have
occurred in the vicinity of the
Magna earthquake since 1972
though the number is not par-
ticularly elevated in compari-
son to that observed in
locations elsewhere in the
region.
The number of paleoearth-
quake studies of active faults
along the Wasatch range is
numerous. They have been
synthesized in a number of
Figure 2. Characteristics of instrumental record of seismicity along Wasatch range. (a) Number of studies addressing characteris-
events per year. (b) Hypocentral depths versus distance projected along 13° azimuth. (c) Number of tics of earthquake behavior
events versus depth. (d) Log of cumulative events per year versus magnitude annotated to show
average period of time between selected moderate and large magnitude earthquakes. Sampled
(e.g., Schwartz and
area outlined by dashed polygon encompassing Wasatch range in Figure 1. The color version of this Coppersmith, 1984; Machette
figure is available only in the electronic edition. et al., 1991; DuRoss et al.,
2016). The consensus report
Volume XX • Number XX • – 2021 • www.srl-online.org Seismological Research Letters 5
Downloaded from http://pubs.geoscienceworld.org/ssa/srl/article-pdf/doi/10.1785/0220200314/5217237/srl-2020314.1.pdf
by wesnousky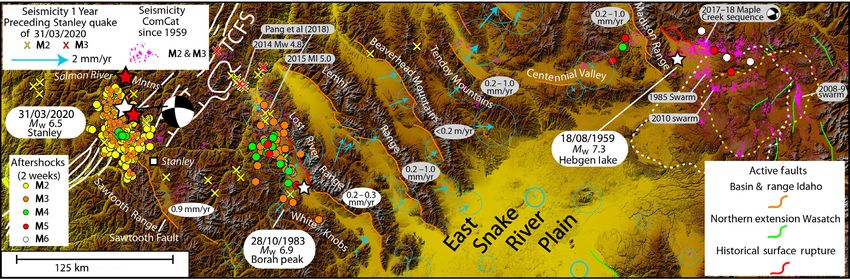
of Lund (2005) also considers other major faults mapped adja-                                   Figure 3. Magna earthquake aftershock characteristics.
                  cent to the range front. The brief accounting of fault character-                               (a) Aftershocks shown in Figures 1 and 4 reprojected as function
                  istics (slip rates and recurrence times) that follows is, unless                                of depth along azimuths approximately parallel (∼330°) and
                                                                                                                  perpendicular (∼70°) to the trend of major adjacent active faults.
                  otherwise noted, derived from this latter report. Active faults                                 Distances measured from −111.938° W, 40.576° N and
                  in the region encompassed by Figure 4 are invariably of normal                                  −112.229° W, 40.645° N, respectively. Average and median
                  mechanism and north striking, oriented to accommodate east–                                     depth errors are 0.66 km and 0.59 km, respectively.
                  west crustal extension. The geodetic velocity field in like man-                                (b) Histogram of number of events of each magnitude per day
                  ner shows 2–3 mm/yr of extension occurring across the                                           after mainshock. (c) Number of aftershocks as function of depth.
                                                                                                                  (d) Total number of aftershocks per day with damped least-
                  range front today (Fig. 4 and Chang et al., 2006; Kreemer et al.,
                                                                                                                  squares fit (Marquardt, 1963) to modified Omori Law relation-
                  2010). The most prominent and continuous active fault in the                                    ship. R is Pearson correlation coefficient. (e) Cumulative number
                  vicinity of the Magna event is the west-dipping normal fault                                    (N) of aftershocks as function of magnitude M. The color version
                  that runs along the western front of the Wasatch range.                                         of this figure is available only in the electronic edition.
                  Pang et al. (2020) utilize this spatial relationship in conjunction
                  with the depth and low-angle normal mechanism of Magna
                  aftershocks to interpret that the Wasatch range front fault here
                  is listric. Exhumation of the Wasatch range front and range                                     range front fault system include the East Great Salt Lake,
                  front faulting commenced ∼11 Ma (Kowallis et al., 1990;                                         Oquirrh, Utah Lake, and West Valley faults. Where reported,
                  Armstrong et al., 2003). Preferred vertical Holocene slip rates                                 best estimates of the average return time of surface rupture
                  reported for the main range bounding fault are generally on the                                 earthquakes on the faults and fault segments are generally
                  order of 1.1–1.4 mm/yr (Fig. 4). Discussions today generally                                    in the range of 1–2 k.y. along the range front and greater
                  divide the range front fault into a number of named sections                                    for those faults to the west (Fig. 4). Displacements registered
                  or segments, each separated by geometrical complexities in                                      in individual events are generally 1–2 m or more (DuRoss et al.,
                  fault strike such as steps and bends and defined by a unique                                    2016) and from comparison to historically observed
                  paleoseismic history. From north to south, these include the                                    earthquakes are reasonably considered the result of earth-
                  Brigham City, Weber, Salt Lake City, Provo, Nephi, and                                          quakes of M 6.5–7 and greater (e.g., Wells and
                  Levan fault segments. Faults subparallel and west of the main                                   Coppersmith, 1994).

                  6       Seismological Research Letters                                                               www.srl-online.org   •   Volume XX   •   Number XX   •   – 2021

Downloaded from http://pubs.geoscienceworld.org/ssa/srl/article-pdf/doi/10.1785/0220200314/5217237/srl-2020314.1.pdf
by wesnousky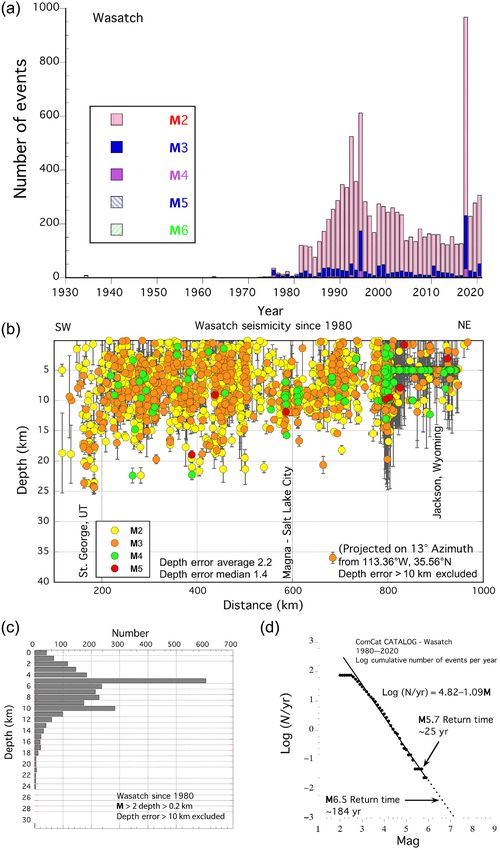
Seismicity preceding the
mainshock and comparison
of rates of large earth-
quakes observed geologi-
cally and from modern
seismicity. Epicenters of
earthquakes in the year preced-
ing the earthquake are shown
by crosses in Figure 4. The epi-
centers are widely distributed.
No measurable foreshocks pre-
ceded the Magna earthquake.
The paleoearthquake record
makes clear that the Magna
earthquake is preceded by
numerous prehistoric surface
ruptures on surrounding faults.
An accounting of the paleo-
earthquake reported by Lund
et al. (2005) for the faults
shown in Figure 4 shows 25
surface rupture earthquakes
occurring in the preceding
7000 yr. DuRoss et al. (2016)
more recently give a similar
accounting of ∼24 events in
the last 6–7 ka on the
Wasatch range front.
Notwithstanding uncertainties
arising from a possibly incom-
plete paleoseismic record, the
potential of large earthquakes
occurring on unmapped faults,
and the possibility that some
paleoearthquakes along the
Wasatch range front actually
occurred at the same time,
the occurrence of 25 surface
ruptures during 7000 yr equa-
tes on an average return time of
M 6.5 and greater earthquakes
on the order of 280 yr, assum-
ing that surface rupture earth-
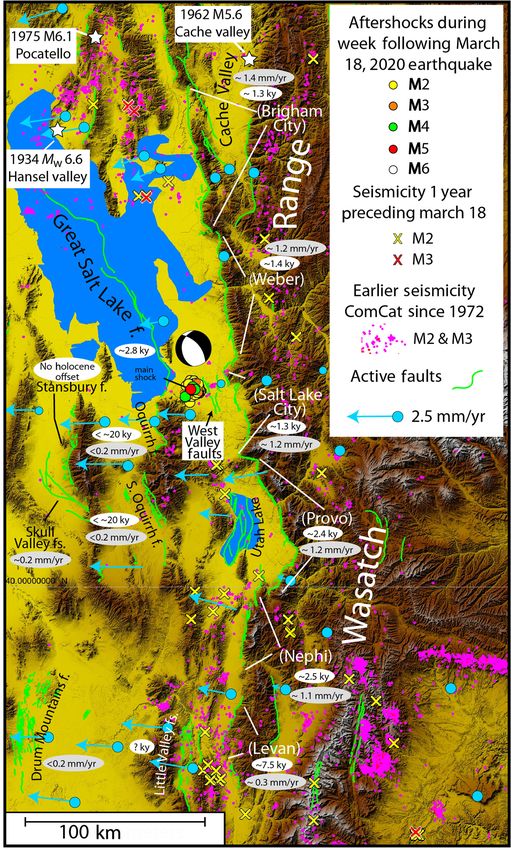
Figure 4. Epicenters of mainshock and aftershocks of 18 March 2020 Mw 5.7 Magna earthquake on quakes register magnitudes of
physiographic map showing location of major surrounding active faults, the geodetic velocity field M 6.5 and greater. This value
(blue arrows) and epicenters of earthquakes registered in year preceding the mainshock. Names of
of average return time of events
sections of the major normal fault that bounds the western edge of the Wasatch range (white, in
parentheses) are taken from the USGS Fault and Fold Database (USGS, 2020b). Focal mechanism in the region is somewhat
of mainshock from ANSS ComCat (USGS, 2020a). Orientation of Magna event nodal planes are greater than the ∼184 yr
strike 182°, dip 34°, rake −52°, and strike 319° dip 64°, rake −112°. Average mid- to late-Holocene implied by rates of instrumen-
slip rates and average recurrence intervals between surface rupture earthquakes are in gray and tally recorded seismicity shown
white ovals, respectively. Values along Wasatch range front, the Great Salt Lake fault, and Oquirrh in Figure 2d.
faults are best estimates reported by Lund (2005). Geodetic velocity vectors (light blue) copied from
UNAVCO (2020) and with respect to stable North America reference frame. The color version of
this figure is available only in the electronic edition.
Volume XX • Number XX • – 2021 • www.srl-online.org Seismological Research Letters 7
Downloaded from http://pubs.geoscienceworld.org/ssa/srl/article-pdf/doi/10.1785/0220200314/5217237/srl-2020314.1.pdf
by wesnousky
31 March 2020 Mw 6.5 Stanley, Idaho, event                                                      Figure 5. Epicenters of mainshocks (white stars) and aftershocks
                  In framework of regional seismicity. Event aftershocks                                          in two weeks following each of the 31 March 2020 Mw 6.5
                  place the Stanley earthquake north of the Snake River Plain                                     Stanley, Idaho, the 28 October 1983 Borah Peak, and 18
                  (Figs. 1 and 5). Seismicity within the dashed polygon shown                                     August 1959 Hebgen Lake earthquakes on physiographic map
                                                                                                                  showing location of major surrounding active faults (orange).
                  in Figure 1 that encompasses the aftershocks is plotted as
                                                                                                                  Red stars are M > 6 earthquakes of 1944 and 1945 reported by
                  the number of recorded earthquakes per year in Figure 6.                                        Dewey (1987). Portions of faults experiencing historical surface
                  The rapid increase in number of recorded events per year                                        rupture are red. Epicenters of all events in ComCat since 1959
                  in the 1970s correlates with the initiation and development                                     shown as magenta dots and those registered in the year before
                  of the Idaho National Lab seismic monitoring program                                            the Stanley earthquake denoted by crosses. Focal mechanism of
                  (Payne et al., 2005). The relative increase in the number of M 2                                Stanley mainshock from ANSS ComCat (USGS, 2020a). The
                                                                                                                  focal mechanism of the Stanley event is described by nodal
                  events with time, particularly around 2014, likely reflects an
                                                                                                                  planes with strike 269°, dip 67°, rake −163°, and strike 172°,
                  improvement of the regional seismic network and capability                                      dip 74°, rake −24°, respectively, and the horizontal projection of
                  to detect relatively smaller earthquakes. Seismicity is largely con-                            a T axis that is oriented at 222°. Blue arrows are geodetic
                  centrated at depths  3 events is indicated by                                   Framework of Active Faults and Geodesy section and those in
                  the lessening of the slope below M 3. Similarly, the lessening in                               gray ovals from the USGS Fault and Fold Database (USGS,
                  slope at M ≳ 4:7 likely reflects the short duration of the catalog                              2020b). White and yellow dotted lines approximate boundaries
                  as compared with the actual return times of earthquakes greater                                 of 2.1 and 0.64 Ma Yellowstone Calderas. The 1985, 2008–
                  than this magnitude. The best-fitting curve of the form log N                                  2009, and 2010 earthquake swarms within Caldera are doc-
                                                                                                                  umented in Waite and Smith (2002), Farrell et al. (2010), and
                  a − bM displays a slope (b-value) of 1.2 constructed with events
                                                                                                                  Shelly et al. (2013), respectively. TCFS, Trans-Challis Fault
                  only between M 3.0 and 4.7. Extrapolation of the curve fit yields                               System from Bennett (1986). The color version of this figure is
                  the expectation of an M 6.0 or greater earthquake every ∼77 yr,                                 available only in the electronic edition.
                  in contrast to the numerous M > 6 earthquakes that have
                  occurred since the 1940s. It may reasonably be suggested that
                  the mismatch in significant part arises from the shorter and less
                  complete instrumental record of seismicity for this area.                                       observations taken together suggest that displacement respon-
                                                                                                                  sible for the earthquake occurred on the north-striking left-
                  Mainshock and aftershocks. Recognizing that lo-                                                 lateral nodal plane of the mainshock focal mechanism
                  cation uncertainties particularly with depth is significantly                                   (Fig. 5). As with the Magna earthquake, significantly greater res-
                  greater here than in the vicinity of the other two earthquakes,                                 olution of the fault architecture will arise with further analysis of
                  aftershocks during the two weeks after the mainshock are mostly                                 arrival time and waveform data collected with instruments
                  confined to depths between 5 and 15 km (Fig. 7a) with the main-                                 deployed soon after the earthquake (e.g., Liberty et al., 2021).
                  shock hypocenter at ∼12 km. The general alignment of after-                                         Aftershocks of M 2 and greater during the day following the
                  shocks in map view is northerly (Fig. 5) and the plot of                                        mainshock surpassed 100 (Fig. 7b). The rate subsequently
                  aftershocks as a function of depth along a 75° azimuth (left panel                              decreased in exponential fashion to an average of ∼10 per day
                  of Fig. 7a) appears to delineate the vertical plane. The two                                    a month after the mainshock, and this rate held steady for an

                  8       Seismological Research Letters                                                               www.srl-online.org   •   Volume XX   •   Number XX   •   – 2021

Downloaded from http://pubs.geoscienceworld.org/ssa/srl/article-pdf/doi/10.1785/0220200314/5217237/srl-2020314.1.pdf
by wesnousky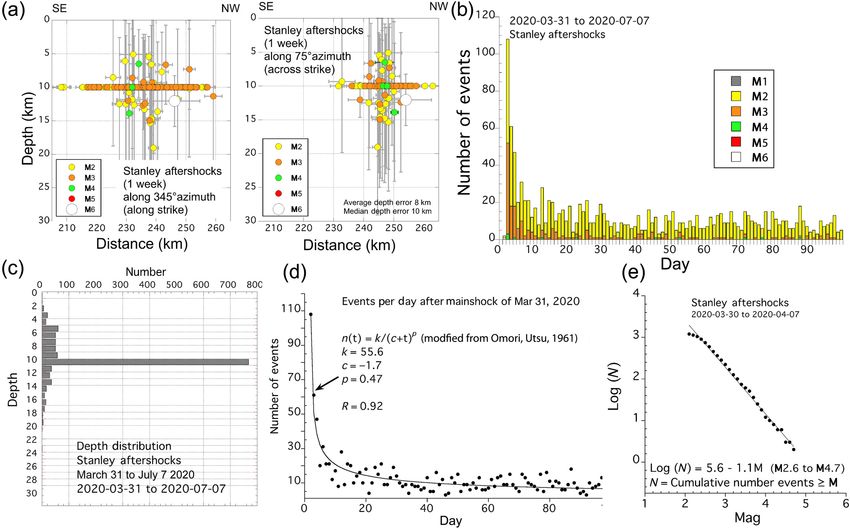
additional two months. Curves
of standard exponential form
and the modified Omori Law
of Utsu (1961) are fit to the ob-
served number of events per day
in Figure 7d. Approximations of
the aftershock decay rate are
provided with the modified
Omori Law with a p-value of
∼0:5. The b-value of the after-
shock distribution when plotted
in the form of the Gutenberg–
Richter distribution is 1.1
(Fig. 7e), as compared with
the value of 1.2 observed for
the entirety of the
region (Fig. 6d).
In framework of active
faults and geodesy. The
basin and range structure north
of the Snake River Plain is the
result of displacement on a set
of northwest-striking, primarily
normal faults distributed
between about the Madison
range on the east and
Sawtooth range to the west
(Fig. 5). Neotectonic studies
bearing on fault-slip rates and
paleoearthquake histories are
few in comparison to the
Wasatch Range. Thackray et al.
(2013) document several latest
Pleistocene–Holocene displace-
ments and a vertical slip rate
of 0.9 mm/yr along the
Sawtooth fault that extends
southward from the area of
Stanley aftershocks, and
further postulate that active
faulting may have migrated
northward along the fault dur-
ing Pleistocene time. Late
Pleistocene faulting along the
Figure 6. Characteristics of instrumental record of seismicity within Idaho Basin and Range Lost River Range is demon-
(dashed polygon outlining Centennial Tectonic belt in Fig. 1b). (a) Number of events per year. strated with surface ruptures
(b) Hypocentral depths versus distance projected along 45° azimuth. (c) Number of events that accompanied the 1983
versus depth. (d) Log of cumulative events per year versus magnitude annotated to show average Borah Peak earthquake. Most
period of time between selected moderate and large magnitude earthquakes. Sampled area
outlined by dashed polygon in Figure 1. The color version of this figure is available only in the
topical studies concur faulting
electronic edition. previously occurred along the
fault from 15 ka (Haller
and Wheeler, 2020). Fault
Volume XX • Number XX • – 2021 • www.srl-online.org Seismological Research Letters 9
Downloaded from http://pubs.geoscienceworld.org/ssa/srl/article-pdf/doi/10.1785/0220200314/5217237/srl-2020314.1.pdf
by wesnousky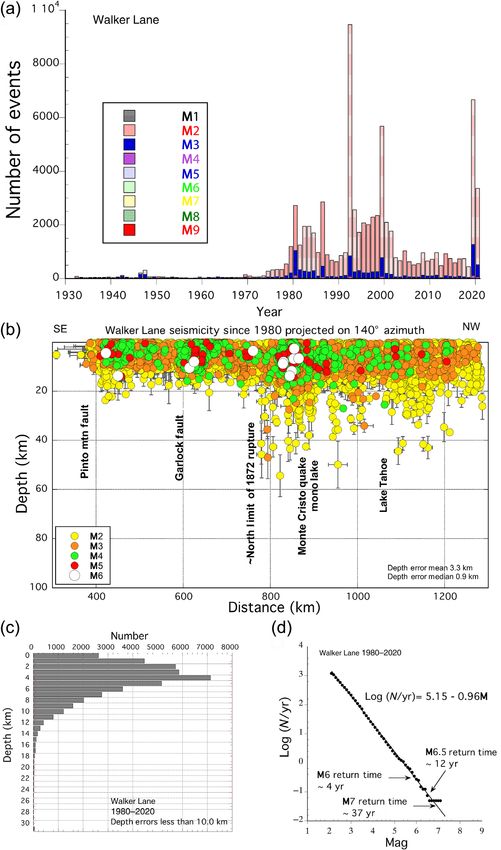
morphology and displaced alluvial surfaces provide the basis on                                 Figure 7. Stanley earthquake aftershock characteristics.
                  which Hanks and Schwartz (1987) and Scott et al. (1985) esti-                                   (a) Aftershocks shown in Figure 5 projected as function of depth
                  mate that the portion of the fault that broke in 1983 slips at                                  along northwest (345°) and northeast (∼75°) azimuths. Distances
                                                                                                                  measured from 114.478° W, 42.296° N and −118.179° W,
                  ∼0:2–0:3 mm=yr. Studies documenting fault-slip rates and                                        43.826° N, respectively. Average and median depth errors are 8
                  paleoearthquake histories are largely absent from professional                                  and 10 km, respectively. Average and horizontal location errors
                  publications for the remaining normal faults shown in                                           are 2.6 and 2.4 km, respectively. (b) Histogram of number of
                  Figure 5. Compilers of the USGS Fault and Fold Database, which                                  events of each magnitude per day after mainshock. (c) Number of
                  also draws upon unpublished geologic reports, place the slip                                    aftershocks as function of depth. Large spike at 10 km depth is
                                                                                                                  artifact of assignment of this depth to events for which depth
                  rates of the remaining faults broadly between 0.2 and
                                                                                                                  constraints are poor and absent. (d) Total number of aftershocks
                  1.0 mm/yr. Values within the lower end of this range are sug-                                   per day with damped least-squares fit (Marquardt, 1963) to
                  gested by Pierce and Morgan (1992) analogous compilation and                                    modified Omori Law relationship. R is Pearson correlation
                  assessment of offsets across the same faults.                                                   coefficient. (e) Cumulative number (N) of aftershocks as function
                      Global Positioning System derived surface velocities of                                     of magnitude M. The color version of this figure is available only
                  Payne et al. (2013) for the period of 1994–2010 are reproduced                                  in the electronic edition.
                  in Figure 5. The velocities are plotted with respect to a stable
                  Snake River Plain reference frame. The subparallel trend and
                  increasing size of the vectors from southeast to northwest indi-                                normal faulting is the dominant mode of strain release in con-
                  cate ongoing extension perpendicular to the trend of the major                                  trast to strike-slip faulting in much of the Walker Lane. The
                  normal faults is on the order of ∼1 mm=yr. If representative of                                 northwest-trending, left-stepping, en échelon pattern of fault-
                  the long term, the geodetic rate would imply that the geologic                                  ing along the east-striking Centennial fault reported by Petrik
                  fault-slip rates fall at the lower end of the 0.2–1.0 mm/yr range                               (2008), cited by Payne et al. (2013), and observed in seismic
                  reported by the USGS. The general increase in velocities along                                  reflection profiles by Bruno et al. (2019) are consistent with
                  transects extending northeast from Snake River Plain is addi-                                   the interpreted right-lateral shear.
                  tionally interpreted by Payne et al. (2013) to indicate the area is                                 An intuitive explanation of the location and mechanism of
                  experiencing right-lateral shear at 0.3–1.5 mm/yr. The velocity                                 the Stanley event is not easily gained within this framework of
                  field shows transtension in a manner like that observed                                         active faulting and geodetic deformation. The major faults in
                  in the Walker Lane (Fig. 1). In this instance, it appears that                                  this region are primarily normal faults. The Stanley event

                  10        Seismological Research Letters                                                             www.srl-online.org   •   Volume XX   •   Number XX   •   – 2021

Downloaded from http://pubs.geoscienceworld.org/ssa/srl/article-pdf/doi/10.1785/0220200314/5217237/srl-2020314.1.pdf
by wesnousky
occurred on none of these faults and is the result of slip on a zone is plotted in Figure 8a. The instrumental record of seis-
north-striking left-lateral fault. Unlike other mapped faults of micity extends back to about 1930. The abrupt increase in num-
the area, the Stanley earthquake is within rugged terrain devoid ber of events per year around 1975 in significant part reflects
of an adjacent basin and appears to cross and extend north of increased instrumentation accompanying establishment of the
the TCFS. One may speculate that the event in some manner Nevada Seismological Laboratory in 1974 (Nevada Seismological
reflects the northward progression of Pleistocene activity on Laboratory [NSL], 2020). Seismicity is largely concentrated at
the Sawtooth fault suggested in the Thackray et al. (2013) depthshistorical right-lateral strike-
slip surface ruptures, on strike
with the left-lateral nodal plane
of the mainshock focal mecha-
nism, and within an abrupt
and broad right-step between
northwest-striking right-lateral
faults to the north and south,
respectively. The geodetic dis-
placement field (blue arrows
in Fig. 10) shows the area of
the broad step is characterized
by both northwest-directed,
right-lateral shear and exten-
sion (arrows increase in size
on both southwest and north-
west transects across the area).
Viewed more closely in
Figure 11a, the trend of after-
shocks aligns with the left-lat-
eral Rattlesnake, Teels Marsh,
and Coaldale faults, and
directly along the eastward
projection of the Candelaria
fault, all of which displace late
Pleistocene and younger
deposits (Wesnousky, 2005b).
The location of aftershocks
and mechanism of the main-
shock confirm at seismogenic
depths that block rotations
rather than extensional fault-
ing take up deformation in this
right-step of the Walker Lane
fault system (Fig. 12). It is
expected that more detail of
fault architecture will ensue
with further analysis of arrival
time and waveform data col-
lected with instruments
deployed soon after the earth-
quake (Bormann et al., 2021;
Ruhl et al., 2021).
Surface rupture attributed
to the Monte Cristo earthquake
is dominated by the occurrence
of ground cracking and about
Figure 8. Characteristics of seismicity within dashed polygon of Figure 1 that encompasses the 14 km of fault trace that exhib-
Walker Lane-Eastern California shear zone. (a) Number of events per year. (b) Seismicity projected its left-lateral displacements no
as function of depth along 140° azimuth. (c) Number of earthquakes as function of depth. (d). greater than ∼15 cm (Koehler
Cumulative number (N=yr) of earthquakes per year as function of magnitude M. The color version et al., 2021). The trace overlaps
of this figure is available only in the electronic edition.
the eastern end of the previ-
ously mapped Candelaria fault,
12 Seismological Research Letters www.srl-online.org • Volume XX • Number XX • – 2021
Downloaded from http://pubs.geoscienceworld.org/ssa/srl/article-pdf/doi/10.1785/0220200314/5217237/srl-2020314.1.pdf
by wesnouskyand strikes northeasterly from that overlap and away from the Figure 9. Monte Cristo earthquake aftershock characteristics.
more easterly trend of aftershocks (Fig. 11). The aftershocks of (a) Aftershocks shown in Figures 1a and 10 projected as function
recent large surface ruptures in the region have generally cor- of depth along 70° azimuth. Distance measured from
−118.49° W 38.023° N. Average and median depth errors are 3
related directly to or followed the causative fault trace (Richins and 2 km, respectively. Both mean and median horizontal errors
et al., 1987; Hauksson et al., 2002; DuRoss et al., 2020). The are 1.2 km. (b) Histogram of number of events of each mag-
lack of alignment of the surface rupture trace with the after- nitude per day after mainshock. (c) Number of aftershocks as
shock distribution appears enigmatic. function of depth. (d) Total number of aftershocks per day with
damped least-squares fit (Marquardt, 1963) to modified Omori
Law relationship. R is the Pearson correlation coefficient.
Seismicity preceding the mainshock. Several small
(e) Cumulative number (N) of aftershocks as function of mag-
earthquakes occurred at the site of the future Monte Cristo epi- nitude M. The color version of this figure is available only in the
center in August 2019 and another on 12 March 2020 (Fig. 11b). electronic edition.
Whereas the events may in hindsight be interpreted to have
occurred in preparation of the Monte Cristo earthquake, numer-
ous similar small earthquakes also occurred elsewhere in the active faults that exhibit Holocene displacement, historically
area during this same time period. The largest concentration hosted large surface rupture earthquakes and, in these regards,
of seismicity during this period of time is associated with the could be anticipated (Fig. 1). The depth distributions of seis-
aftershocks of an M 5.2 earthquake that occurred well to the micity in the broader regions associated with each event
west near Mono Lake on 4 April 2020. Aftershocks in this earth- (Figs. 2c, 6c, and 8c) nicely illustrate that most seismicity in
quake also trend to the northeast. the Intermountain West is confined to depths of 5–10 km
where it is interpreted that crustal strength or shear resistance
Summary is greatest (e.g., Sibson, 1982), that the amount of seismicity
Most characteristics of these Intermountain West earthquakes diminishes in exponential fashion to near zero between 15
are largely consistent with expectations arising from observa- and 20 km primarily due to rheological change (brittle–ductile
tions accumulated over the ∼40 yr since the implementation transition) that accompanies increase in crustal temperature
and subsequent growth of seismic networks in the region. with depth (e.g., Scholz, 1988), and similarly decreases in num-
Each occurred within a zone of relatively elevated seismicity, ber upward to the surface from the maxima at midcrustal
Volume XX • Number XX • – 2021 • www.srl-online.org Seismological Research Letters 13
Downloaded from http://pubs.geoscienceworld.org/ssa/srl/article-pdf/doi/10.1785/0220200314/5217237/srl-2020314.1.pdf
by wesnouskydepths, which has been attributed to velocity strengthening
behavior of fault gouge at shallow crustal depths (Marone
and Scholz, 1988). The Monte Cristo, Magna, and Stanley earth-
quake aftershocks follow the same pattern (Figs. 3c, 7c, and 9c).
The brittle–ductile transition in each case falls well above the
depth of Moho, which ranges from ∼30 to 40 km in the vicinity
of each (Gilbert, 2012). As expected, the magnitude–frequency
distribution of both the regions and the aftershock sequences are
aptly described by the Gutenberg–Richter distribution. Whereas
the b-values of the Gutenberg–Richter distribution vary between
0.7–1.1 and 1.0–1.2 for the aftershock sequences and encom-
passing regions, respectively, the analysis is insufficient to
conclude the similarities and differences are significant.
Unfortunate though common, none of the mainshocks were
preceded by a sequence of foreshocks to provide an obvious
warning for preparation. Also as generally observed, the largest
aftershock for each earthquake sequence is on the order of a
magnitude unit less than the mainshock, the number of after-
shocks correlates to the size of the mainshock, and the number
of aftershocks each day subsequent to the mainshock decays
exponentially subsequent to the mainshock. The p-value from
the modified Omori law (Utsu, 1961) provides a measure of the
aftershock decay rate that may be compared between earth-
quakes. The values obtained here for the Magna, Stanley,
and Monte Cristo earthquakes are 0.71, 0.47, and 0 76, respec-
tively (Figs. 3d, 7d, and 9d). Compilation of more than 200
similarly derived p-value estimates from more than 50 pub-
lished papers reports p-values distributed between 0.6 and
2.5, with a median of 1.1 (Utsu et al., 1995). It has been con-
sidered that the variability is related to various physical and
tectonic factors such as structural heterogeneity, crustal stress,
and temperature. Which if any of these is the most significant
controlling factor is not to my knowledge established (Utsu
et al., 1995). To this puzzle then may be added the question
why each p-value assessed here falls at the lower end of the
spectrum of generally observed values.
Some aspects of the earthquakes do provide new tectonic
insights or that perhaps appear contrary to expectation. The
strike-slip mechanism of the Stanley earthquake stands in con-
trast to the zone of normal major range bounding faults and
historical earthquakes to which it is adjacent, and it is the first
relatively well instrumented rupture of an earthquake northward
across the Trans-Challis fault zone (Fig. 5). The Pang et al.
(2020) aftershock and moment-tensor analysis of the Magna
Figure 10. Epicenters of mainshock and aftershocks of 15 May earthquake gives further credence to the idea originally brought
2020 Mw 6.5 Monte Cristo earthquake on physiographic map forth with seismic reflection and geodetic study (Smith and
showing location of major surrounding active faults, where Bruhn, 1984; Velasco et al., 2010) that the seismogenic
historical surface ruptures have occurred on those faults, and Wasatch range bounding fault is listric, an idea that has yet
geodetic velocity field (blue arrows). Focal mechanism of main- to be confirmed by the occurrence of a large surface rupture
shock from ANSS ComCat (USGS, 2020a). Geodetic vectors
copied from Zeng and Shen (2016) with respect to stable North
event along the range front. The east-striking left-lateral mecha-
America reference frame. The color version of this figure is nism Monte Cristo earthquake along the eastern margin of the
available only in the electronic edition. Basin and Range might initially be viewed as contrary to expect-
ation, though it can be viewed as expected from prior mapping
14 Seismological Research Letters www.srl-online.org • Volume XX • Number XX • – 2021
Downloaded from http://pubs.geoscienceworld.org/ssa/srl/article-pdf/doi/10.1785/0220200314/5217237/srl-2020314.1.pdf
by wesnouskyruptures in the western United
States (Richins et al., 1987;
Hauksson et al., 2002; DuRoss
et al., 2020).
Data and Resources
Seismological data in this article
are sourced from Advanced
National Seismic System (ANSS)
Comprehensive Earthquake
Catalog Event and Products
(ComCat), available at https://
earthquake.usgs.gov/data/comcat/.
Locations of mapped active faults
are adapted and modified from
the U.S. Geological Survey
Quaternary Fault and Fold
Database website available at
https://earthquakes.usgs.gov/
hazards/qfaults. Digital elevation
data used in construction of
Figures 1, 4, 5, 10, and 11 accessed
from the National Elevation
Data Set hosted at https://
www.usgs.gov/core-science-systems/
national-geospatial-program/
national-map and the global
Shuttle Radar Topography
Mission (SRTM) elevation model
Figure 11. (a) Aftershock epicenters in week following the 15 May 2020 Mw 6.5 Monte Cristo
hosted at https://topex.ucsd.edu/
mainshock. (b) Earthquake epicenters in year preceding mainshock and surface ruptures with left-
lateral displacement extending northeastward from Candelaria fault (red lines) reported by Koehler WWW_html/srtm30_plus.html
et al. (2021). The color version of this figure is available only in the electronic edition. and described in Becker et al.
(2009). All websites were last
accessed in July 2020.
Acknowledgments
The author particularly thanks
two anonymous reviewers and
Ryan Gold for lending comment
and guidance concerning tectonics
and earthquake history along
the Wasatch and Idaho. Research
supported in part by National
Science Foundation (NSF) Grant
Figure 12. Aftershocks and focal mechanism of the Monte Cristo mainshock confirm that transfer Earth Sciences (EAR) 1920514.
of slip across the large right-step in the Walker Lane currently takes place as (a) rotation of crustal Center for Neotectonic Studies
blocks rather than by (b) normal faults that commonly accompany extension in pull-apart basins. Contribution Number 82.
of active faults in the area (Wesnousky, 2005b) and its location References
within the well-defined belt of transtensional shear that defines Anders, M. H., J. W. Geissman, L. A. Piety, and J. T. Sullivan (1989).
the Walker Lane (Fig. 10). Finally, the offset of a relatively well- Parabolic distribution of circumeastern Snake River Plain seismic-
defined zone of surface rupture to the well-defined trend of ity and latest Quaternary faulting—migratory pattern and associ-
aftershocks during the Monte Cristo range earthquake seems ation with the Yellowstone hotspot, J. Geophys. Res. 94, no. B2,
unique in comparison to other observed strike-slip surface 1589–1621.
Volume XX • Number XX • – 2021 • www.srl-online.org Seismological Research Letters 15
Downloaded from http://pubs.geoscienceworld.org/ssa/srl/article-pdf/doi/10.1785/0220200314/5217237/srl-2020314.1.pdf
by wesnouskyArabasz, W. J. (1979). Historical review of earthquake-related studies Doser, D. I. (1989). Extensional tectonics in northern Utah southern
and seismographic recording in Utah, Special Publication of the Idaho, USA, and the 1934 Hansel Valley sequence, Phys. Earth
University of Utah Seismograph Stations and the Department of Planet. In. 54, nos. 1/2, 120–134.
Geology and Geophysics, 33–56. DuRoss, C. B., R. D. Gold, T. E. Dawson, K. M. Scharer, K. J. Kendrick,
Arabasz, W. J., W. D. Richins, and C. J. Langer (1981). The Pocatello S. O. Akciz, S. J. Angster, J. Bachhuber, S. Bacon, S. E. K. Bennett,
Valley (Idaho-Utah border) earthquake sequence of March to et al. (2020). Surface displacement distributions for the July 2019
April 1975, Bull. Seismol. Soc. Am. 71, no. 3, 803–826. Ridgecrest, California, earthquake ruptures, Bull. Seismol. Soc. Am.
Armstrong, P. A., T. A. Ehlers, D. S. Chapman, K. A. Farley, and P. J. J. 110, no. 4, 1400–1418.
Kamp (2003). Exhumation of the central Wasatch Mountains, Utah: 1. DuRoss, C. B., S. F. Personius, A. J. Crone, S. S. Olig, M. D. Hylland,
Patterns and timing of exhumation deduced from low-temperature W. R. Lund, and D. P. Schwartz (2016). Fault segmentation: New
thermochronology data, J. Geophys. Res. 108, no. B3, 17. concepts from the Wasatch Fault Zone, Utah, USA, J. Geophys.
Becker, J. J., D. T. Sandwell, F. W. H. Smith, J. Braud, B. Binder, J. Res. 121, no. 2, 1131–1157.
Depner, D. Fabre, J. Factor, S. Ingalls, S.-H. Kim, et al. Evans, J. P., D. C. Martindale, and R. D. Kendrick (2003). Geologic
(2009). Global bathymetry and elevation data at 30 arc seconds setting of the 1884 Bear Lake, Idaho, earthquake: Rupture in the
resolution: SRTM30_PLUS, Mar. Geodes. 32, no. 4, 355–371. hanging wall of a basin and range normal fault revealed by his-
Bennett, E. H. (1986). Relationship of the Trans-Challis Fault system torical and geological analyses, Bull. Seismol. Soc. Am. 93, no. 4,
in Central Idaho to Eocene and basin and range extensions, 1621–1632.
Geology 14, no. 6, 481–484. Farrell, J., R. B. Smith, T. Taira, W. L. Chang, and C. M. Puskas (2010).
Bodle, R. R. (Editor) (1934). The Utah Earthquake, March 12, 1934, Dynamics and rapid migration of the energetic 2008-2009
Earthq. Notes (Seismol. Res. Lett.) V, no. 4, 2–3. Yellowstone Lake earthquake swarm, Geophys. Res. Lett. 37, 5.
Bodle, R. R. (Editor) (1946). United States Earthquakes 1944, U.S. Faulds, J. E., C. D. Henry, and N. H. Hinz (2005). Kinematics of the
Coast Geodetic Surv. Serial No. 682, 43 pp. northern Walker Lane: An incipient transform fault along the
Bormann, J. M., W. C. Hammond, C. Kreemer, and G. Blewitt (2016). Pacific-North American plate boundary, Geology 33, no. 6, 505–508.
Accommodation of missing shear strain in the Central Walker Gilbert, H. (2012). Crustal structure and signatures of recent tecton-
Lane, western North America: Constraints from dense GPS mea- ism as influenced by ancient terranes in the western United States,
surements, Earth Planet. Sci. Lett. 440, 169–177. Geosphere 8, no. 1, 141–157.
Bormann, J. M., E. A. Morton, K. D. Smith, G. M. Kent, W. S. Honjas, Haller, K. M., and R. L. Wheeler (2020). Fault number 601c, Lost
G. L. Plank, and M. C. Williams (2021). Nevada seismological lab- River fault, Thousand Springs section, Quaternary fault and fold
oratory rapid seismic monitoring deployment and data availability database of the United States, U.S. Geological Survey, available at
for the 2020 M6.5 Monte Cristo Range, Nevada earthquake https://earthquakes.usgs.gov/hazards/qfaults (last accessed March
sequence, Seismol. Res. Lett. this volume. 2020).
Bruno, P. P. G., C. Berti, and F. J. Pazzaglia (2019). Accommodation, Hamilton, W., and W. B. Meyers (1966). Cenozoic tectonics of the
slip inversion, and fault segmentation in a province-scale shear western United States, Rev. Geophys. 4, no. 4, 509–549.
zone from high-resolution, densely spaced wide-aperture seismic Hanks, T. C., and D. P. Schwartz (1987). Morphological dating of the
profiling, Centennial Valley, MT, USA, Sci. Rep. 9, 13. pre-1983 fault scarp on the Lost River fault at Doublespring Pass
Bruno, P. P. G., C. B. DuRoss, and S. Kokkalas (2017). High-resolution road, Custer County, Idaho, Bull. Seismol. Soc. Am. 77, no. 3,
seismic profiling reveals faulting associated with the 1934 Ms 6.6 837–846.
Hansel Valley earthquake (Utah, USA), Geol. Soc. Am. Bull. 129, Hauksson, E., L. M. Jones, and K. Hutton (2002). The 1999 Mw 7.1
nos. 9/10, 1227–1240. Hector Mine, California, earthquake sequence: Complex
Chang, W. L., R. B. Smith, C. M. Meertens, and R. A. Harris (2006). conjugate strike-slip faulting, Bull. Seismol. Soc. Am. 92, no. 4,
Contemporary deformation of the Wasatch Fault, Utah, from GPS 1154–1170.
measurements with implications for interseismic fault behavior Koehler, R. D., S. Dee, A. Elliott, A. Hatem, A. Pickering, I. Pierce, and
and earthquake hazard: Observations and kinematic analysis, J. G. Seitz (2021). Field response and surface rupture characteristics
Geophys. Res. 111, no. B11, 19. of the 2020 M6.5 Monte Cristo Range earthquake, central Walker
Coffman, J. L., and C. W. Stover (1975). United States Earthquakes, Lane, Nevada, Seismol. Res. Lett. this volume.
1975, U.S. Geol. Surv. Open-File Rept. 84-975, 136 pp. Koper, K. D., K. L. Pankow, J. C. Pechmann, J. M. Hale, R. Burlacu, W.
Cook, K. L., and R. B. Smith (1967). Seismicity in Utah 1850 through L. Yeck, H. M. Benz, R. B. Herrmann, D. T. Trugman, and P. M.
June 1965, Bull. Seismol. Soc. Am. 57, no. 4, 689–718. Shearer (2018). Afterslip enhanced Aftershock activity during the
Crone, A. J., M. N. Machette, M. G. Bonilla, J. J. Lienkaemper, K. L. 2017 earthquake sequence near Sulphur Peak, Idaho, Geophys. Res.
Pierce, W. E. Scott, and R. C. Bucknam (1987). Surface faulting Lett. 45, no. 11, 5352–5361.
accompanying the Borah Peak earthquake and segmentation of Kowallis, B. J., J. Ferguson, and G. J. Jorgensen (1990). Uplift along the
the lost river fault, central Idaho, Bull. Seismol. Soc. Am. 77, Salt Lake segment of the Wasatch Fault from apatite and zircon
no. 3, 739–770. fission-track dating in the Little Cottonwood Stock, Nucl.
Davies, J. H. (2013). Global map of solid Earth surface heat flow, Tracks Radiat. Meas. 17, no. 3, 325–329.
Geochem. Geophys. Geosys. 14, no. 10, 4608–4622. Kreemer, C., G. Blewitt, and W. C. Hammond (2010). Evidence for an
Dewey, J. W. (1987). Instrumental seismicity of central Idaho, Bull. active shear zone in southern Nevada linking the Wasatch fault to
Seismol. Soc. Am. 77, no. 3, 819–836. the Eastern California shear zone, Geology 38, no. 5, 475–478.
16 Seismological Research Letters www.srl-online.org • Volume XX • Number XX • – 2021
Downloaded from http://pubs.geoscienceworld.org/ssa/srl/article-pdf/doi/10.1785/0220200314/5217237/srl-2020314.1.pdf
by wesnouskyKuntz, M. A., H. R. Covington, L. J. Schorr, P. K. Link, M. A. Kuntz, network monitoring in the Eastern Intermountain West, Seismol.
and L. B. Piatt (1992). Chapter 12: An overview of basaltic volcan- Res. Lett. 91, no. 2, 631–646.
ism of the eastern Snake River Plain, Idaho, in Regional Geology of Payne, S., A. A. Holland, J. M. Hodges, and R. G. Berg (2005). INL
Eastern Idaho and Western Wyoming, P.K. Link, M. A. Kuntz, and Seismic Monitoring Annual Report: January 1, 2004 - December 31,
L. B. Platt (Editors), Geological Society of America, Boulder, 2004, Idaho National Laboratory, Idaho Falls, Idaho.
Colorado, Vol. 179, 227–267. Payne, S. J., R. McCaffrey, and S. A. Kattenhorn (2013). Extension-
Lachenbruch, A. H. (1978). Heat-flow in Basin and Range province driven right-lateral shear in the Centennial shear zone adjacent
and thermal effects of tectonic extension, Pure Appl. Geophys. 117, to the eastern Snake River Plain, Idaho, Lithosphere 5, no. 4,
nos. 1/2, 34–50. 407–419.
Liberty, L. M., Z. M. Lifton, and T. D. Mikesell (2021). The 32 March Petrik, F. E. (2008). Scarp analysis of the Centennial Normal fault,
2020 Mw 6.5 Stanley, Idaho earthquake: Seismotectonics and pre- Beaverhead County, Montana and Fremont County, Idaho, M.S.
liminary aftershock analysis, Seismol. Res. Lett. this volume, 1–16, Thesis, Montana State University, Bozeman, Montana, 267 pp.
doi: 10.1785/0220200319. Pierce, K. L., and L. A. Morgan (1992). The track of the Yellowstone
Lund, W. R. (2005). Consen\sus preferred recurrence-interval and hot spot: Volcanism, faulting, and uplift, in Regional Geology of
vertical slip-rate estimates: Review of Utah paleoseismic-trenching Eastern Idaho and Western Wyoming, P.K. Link, M. A. Kuntz,
data by the Utah Quaternary fault parameters working group, and L. B. Platt (Editors), Geological Society of America
Utah Geol. Surv. Bull. 134, 109 pp. Memoir, Boulder, Colorado, Vol. 179, 1–51.
Machette, M. N., S. F. Personius, A. R. Nelson, D. P. Schwartz, and Reynolds, M. W. (1979). Character and extent of Basin-Range fault-
W. R. Lund (1991). The Wasatch fault zone, Utah segmentation ing, Western Montana and East-Central Idaho, Rocky Mountain
and history of Holocene earthquakes, J. Struct. Geol. 13, no. 2, Association of Geologists and Utah Geological Association, 1979
137–149. Basin and Range Symposium, Las Vegas, Nevada, 7–11 October
Marone, C., and C. H. Scholz (1988). The depth of seismic faulting 1979, 185–193.
and the upper transition from stable to unstable slip regimes, Richins, W. D., J. C. Pechmann, R. B. Smith, C. J. Langer, S. K. Goter,
Geophys. Res. Lett. 15, no. 6, 621–624. J. E. Zollweg, and J. J. King (1987). The 1983 Borah Peak, Idaho,
Marquardt, D. (1963). An algorithm for least-squares estimation of earthquake and its aftershocks, Bull. Seismol. Soc. Am. 77, no. 3,
nonlinear parameters, SIAM J. Appl. Math. 11, 431–441. 694–723.
McQuarrie, N., and D. W. Rodgers (1998). Subsidence of a volcanic Ruhl, C. J., E. A. Morton, M. H.-I. Bormann, G. Ichinose, and K. D.
basin by flexure and lower crustal flow: The eastern Snake River Smith (2021). Complex fault geometry of the 2020 Mw6.5 Monte
Plain, Idaho, Tectonics 17, no. 2, 203–220. Cristo Range, Nevada earthquake sequence, Seismol. Res. Lett. this
Mohapatra, G. K., and R. A. Johnson (1998). Localization of listric volume.
faults at thrust fault ramps beneath the Great Salt Lake Basin, Sbar, M. L., R. B. Smith, C. H. Scholz, M. Barazang, and J. Dorman
Utah: Evidence from seismic imaging and finite element modeling, (1972). Tectonics of Intermountain Seismic Belt, Western United
J. Geophys. Res. 103, no. B5, 10,047–10,063. States—Microearthquake seismicity and composite fault plane
Morgan, W. J. (1972). Plate motions and deep mantle convection, solutions, Geol. Soc. Am. Bull. 83, no. 1, 13–28.
Geol. Soc. Am. Mem. Vol. 132, 7–22. Scholz, C. H. (1988). The brittle-plastic transition and the depth of
Nevada Seismological Laboratory(NSL) (2020). Mission statement of seismic faulting, Geol. Rundsch. 77, no. 1, 319–328.
Nevada seismological laboratory, available at http://www.seismo Schwartz, D. P., and K. J. Coppersmith (1984). Fault behavior
.unr.edu/About (last accessed July 2020). and characteristic earthquakes—Examples from the Wasatch
Oldow, J. S., J. W. Geissman, and D. F. Stockli (2008). Evolution and and San Andreas fault zones, J. Geophys. Res. 89, no. NB7,
strain reorganization within Late Neogene structural stepovers 5681–5698.
linking the central Walker Lane and northern Eastern California Scott, W. E., K. L. Pierce, and M. H. Hait (1985). Quaternary tectonic
Shear Zone, Western great Basin, Int. Geol. Rev. 50, no. 3, 270–290. setting of the 1983 Borah-Peak earthquake, Central Idaho, Bull.
Pang, G. N., K. D. Koper, J. M. Hale, R. Burlacu, J. Farrell, and R. B. Seismol. Soc. Am. 75, no. 4, 1053–1066.
Smith (2019). The 2017-2018 Maple Creek earthquake sequence in Shelly, D. R., D. P. Hill, F. Massin, J. Farrell, R. B. Smith, and T.
Yellowstone National Park, USA, Geophys. Res. Lett. 46, no. 9, Taira (2013). A fluid-driven earthquake swarm on the margin
4653–4663. of the Yellowstone Caldera, J. Geophys. Res. 118, no. 9, 4872–
Pang, G. N., K. D. Koper, M. Mesimeri, K. L. Pankow, B. Ben, J. Farrell, 4886.
J. Holt, J. M. Hale, P. Roberson, R. Burlacu, et al. (2020). Seismic Shenon, P. J. (1936). The Utah earthquake of March 12, 1934 (extracts
analysis of the 2020 Magna, Utah, Earthquake sequence: Evidence from unpublished report), in United States Earthqakes, 1934, F.
for a Listric Wasatch fault, Geophys. Res. Lett. 47, no. 18, 10. Neuman (Editor), United States Government Printing Office,
Pang, G. N., K. D. Koper, M. C. Stickney, J. C. Pechmann, R. Burlacu, Washington, D.C., Serial 593, 43–48.
K. L. Pankow, S. Payne, and H. M. Benz (2018). Seismicity in the Sibson, R. H. (1982). Fault zone models, heat-flow, and the depth dis-
Challis, Idaho, Region, January 2014-May 2017: Late Aftershocks tribution of earthquakes in the continental-crust of the United-
of the 1983 Ms 7.3 Borah Peak earthquake, Seismol. Res. Lett. 89, States, Bull. Seismol. Soc. Am. 72, no. 1, 151–163.
no. 4, 1366–1378. Smith, R. B., and R. L. Bruhn (1984). Intraplate extensional tectonics
Pankow, K. L., M. Stickney, J. Y. Ben-Horin, M. Litherland, S. Payne, of the Eastern Basin-Range—Inferences on structural style from
K. D. Koper, S. L. Bilek, and K. Bogolub (2020). Regional seismic seismic-reflection data, regional tectonics, and thermal-
Volume XX • Number XX • – 2021 • www.srl-online.org Seismological Research Letters 17
Downloaded from http://pubs.geoscienceworld.org/ssa/srl/article-pdf/doi/10.1785/0220200314/5217237/srl-2020314.1.pdf
by wesnouskyYou can also read