MUDELTA: DELTA-ORIENTED MUTATION TESTING AT COMMIT TIME
←
→
Page content transcription
If your browser does not render page correctly, please read the page content below
MuDelta: Delta-Oriented Mutation Testing at
                       Commit Time
                       Wei Ma∗ , Thierry Titcheu Chekam∗ , Mike Papadakis∗ and Mark Harman†
                                           ∗ SnT,University of Luxembourg, Luxembourg
                                          † Facebook and University College London, UK
                                     ∗ {firstname.surname}@uni.lu, † mark.harman@ucl.ac.uk

   Abstract—To effectively test program changes using mutation          Specifically, we need a mutation testing formulation in
testing, one needs to use mutants that are relevant to the altered   which mutants can be found, on the fly, based on their rel-
program behaviours. We introduce MuDelta, an approach that           evance to specific changes to the system under consideration.
identifies commit-relevant mutants; mutants that affect and are
affected by the changed program behaviours. Our approach uses        In this ‘evolving mutation testing’ approach, both the set of
machine learning applied on a combined scheme of graph and           mutants M and the tests that distinguished their behaviours
vector-based representations of static code features. Our results,   T , are each able to change with each new commit. Such
from 50 commits in 21 Coreutils programs, demonstrate a strong       a mutation testing formulation is better suited to industrial
prediction ability of our approach; yielding 0.80 (ROC) and 0.50     practice, e.g., at Google [7], since mutation testing can be
(PR-Curve) AUC values with 0.63 and 0.32 precision and recall
values. These predictions are significantly higher than random       applied at commit time, to each code change as it is submitted,
guesses, 0.20 (PR-Curve) AUC, 0.21 and 0.21 precision and recall,    thereby keeping pace with the changes to p. More importantly,
and subsequently lead to strong relevant tests that kill 45%         such an approach will focus the test effort deployed at commit
more relevant mutants than randomly sampled mutants (either          time specifically to the changes in the commit, rather than
sampled from those residing on the changed component(s) or           wasting test effort on re-testing old code.
from the changed lines). Our results also show that MuDelta
selects mutants with 27% higher fault revealing ability in fault        In order to apply mutation testing on the fly in this manner,
introducing commits. Taken together, our results corroborate the     we need a fast lightweight approach to determine a priority
conclusion that commit-based mutation testing is suitable and        ordering on a given set of mutants, where priority is deter-
promising for evolving software.                                     mined by the relevance of a mutant to the change in hand.
   Index Terms—mutation testing, commit-relevant mutants, con-       This paper introduces a machine learning-based approach
tinuous integration, regression testing, machine learning
                                                                     to tackle this problem using a combined scheme of graph
                                                                     and vector-based representations of simple code features that
                      I. I NTRODUCTION                               aim at capturing the information (control and data) flow and
                                                                     interactions between mutants and committed code changes.
   Mutation testing has been shown to be one of the strongest        We train the learner on a set of mutants from historical code
fault-revealing software test adequacy criteria available to         changes that are labeled with respect to given test suites. The
software testers [1]. Nevertheless, although mutation testing        machine learner is subsequently used to predict the priority
has been widely studied for over four decades in the scientific      ordering of the set of mutants to identify those most likely to
literature, the formulation that underpins it has remained           be relevant to a given change.
largely unchanged since its inception in the 1970s [2], [3].            This way, once the learner has been trained, it can be used to
   In this unchanged formulation, a program p is tested by a         quickly predict the priority order for the set of mutants in terms
test suite, T , the adequacy of which is measured in terms of        of their relevance to unseen changes, as they are submitted
its ability to distinguish executions of p and a set of mutants      into the continuous integration system for review. This allows
M . Each mutant in M is a version of p into which a fault            the tester (and/or some automated test design technology) to
has been deliberately inserted, in order to simulate potential       focus on those mutants that are most likely to yield tests that
real faults, thereby assessing the ability of the test suite T to    are fault revealing for the change in hand.
detect such faults.                                                     We implemented our approach in a system called MuDelta,
   The problem with this formulation is that it has not kept         and evaluated it on a set of 50 commits from Coreutils wrt
pace with recent software engineering practices. Most notably,       a) prediction ability, b) ability to lead to relevant tests (tests
the assumption of a fixed program p, set of mutants M ,              killing commit-relevant mutants) and c) ability to reveal faults
and test suite T , is unrealistic; modern software systems           in fault introducing commits. Our results indicate s strong
undergo regular change, typically in continuous integration          prediction ability; MuDelta yields 0.80 ROC-AUC value, 0.42
environments [4]–[6]. In order to render mutation testing            F1-score, 0.63 precision and 0.32 recall, while random guesses
applicable to practising software engineers, a fundamentally         yield 0.20 F1-score, 0.21 precision and 0.21 recall. Killing the
new approach to finding suitable mutants is required in which        predicted mutants results in killing 45% more relevant mutants
p, T , and M are each continually evolving.                          than random mutant sampling baselines.
Perhaps more importantly, our results show that our ap- Injecting faults by altering the syntax of the program may
proach leads to mutants with 27% higher fault revealing result in semantically equivalent program versions, i.e., ver-
ability in fault introducing commits. Taken together, our results sions that behave the same way for all possible inputs. These
corroborate the findings that MuDelta enables effective delta- equivalent versions need to be removed and not taken into
relevant mutation testing, i.e., mutation testing targeting the consideration, as even a perfect test suite cannot kill them.
specific code changes of the software system under test. Unfortunately, equivalent mutants form one of the known
Our study also reveals some surprising findings, additional problems of mutation testing [8].
results and discussion can be found in our project page1 . Interestingly, many killable mutants are equivalent to others,
For example, one might believe that mutants that reside in introducing an additional problem, skew in the Mutation Score
the changed code would be adequate in testing it. However, [9], [10]. The problem though, is more severe since not
our empirical findings contradict this natural, but incorrect, all mutants are equally important; many mutants are killed
assumption. This surprising finding highlights the importance collaterally, and thus, they do not contribute to the testing
of finding mutants in the unchanged part of the program. process [11], [12]. Unfortunately, these collateral kills inflate
This unchanged code that forms a contextual environment the mutation score measurement and may lead to wrong
into which changes deployed. Such δ-relevant mutants in the conclusions [10]. Therefore, the recent mutation testing liter-
context C, for some change, δ, tend to focus on (and reveal ature [8], [10] suggest using the so-called subsuming mutants
issues with) interactions between the change, δ, and the context (computing the subsuming mutation score [12], [13]) when
C into which it is deployed. Developers are less likely to evaluating test effectiveness.
notice these since they are more likely to be familiar with their
changes than the existing unchanged code. Such bugs may also B. Change-aware regression testing
be more subtle as they involve unforeseen interactions between Testing program regressions require test suites to exercise
parts of the system. the adequacy of testing wrt to the program changes. In case
In summary, our primary contributions are: the used test suites are insufficient, guidance should be given
in order to help developers create test cases that specifically
• The empirical evidence that mutant relevance (to partic-
target the behaviour deviations introduced by the regressions.
ular program changes) can be captured by simple static
One potential solution to this problem may be based on
source code metrics.
coverage; one can aim at testing the altered parts of the pro-
• A machine learning approach, called MuDelta, that learns
grams using coverage information. However, the strengths of
to rank mutants wrt to their utility and relevance to
coverage are known to be limited [1], [14]. Moreover, the most
specific code changes.
severe regression issues are due to unforeseen interactions
• Empirical evidence suggesting that MuDelta outperforms
between the changed code and the rest of the program [14],
the traditionally random mutant selection/prioritization
[15]. Therefore, we aim at using mutation testing using the
method by revealing 45% more relevant mutants, and
so-called Commit-relevant mutants [16].
achieving 27% higher probability to reveal faults in these
changes. C. Commit-relevant mutants
Commit-relevant mutants are those that make observable
II. C ONTEXT any interaction between the altered code and the rest of the
A. Mutation testing program under test. These mutants alter the program semantics
that are relevant to the committed changes, i.e., they have
Mutation testing [2] measures the fault revealing potential behavioural effects on the altered code behaviour. This means
of test cases by checking the extend to which artificially that mutants are relevant to a commit when their behaviour is
seeded faults, called mutants, are triggered. When a behaviour changed by the regression changes. Indeed, changed behaviour
difference between the original program and a mutant is indicates a coupling between mutants and regressions, sug-
detected, the mutant is considered to be “killed”, otherwise the gesting relevance. In essence, one can use relevant mutants to
mutant is considered to be “live”. The point here is that mutant capture the ‘observable’ dependencies between changed and
killing shows an execution failure that was covered, triggered unchanged code [17], [18], which reflect the extent to which
by the altered code and propagated to the observable program test suites are testing the altered program behaviours.
output, signifying the potential of the test. The faults are In particular, mutants interact with program changes when
seeded in the code under analysis by making simple syntactic the post-commit mutant version (includes both the changes and
transformations, e.g., replacing the instance of an operator with the mutant) behaves differently from a) the related pre-commit
another one, if (a < b) into if (a ≤ b), and they mutant version and b) the post-commit non-mutated version.
represent the test requirements. This means that the ratio of These conditions establish that changes and mutants interact
mutants killed, called Mutation Score (MS), represents the test [16]. Condition a) establishes that the behaviour differences
thoroughness metric. are caused by the presence and absence of the committed
changes and condition b) that the behaviour differences are
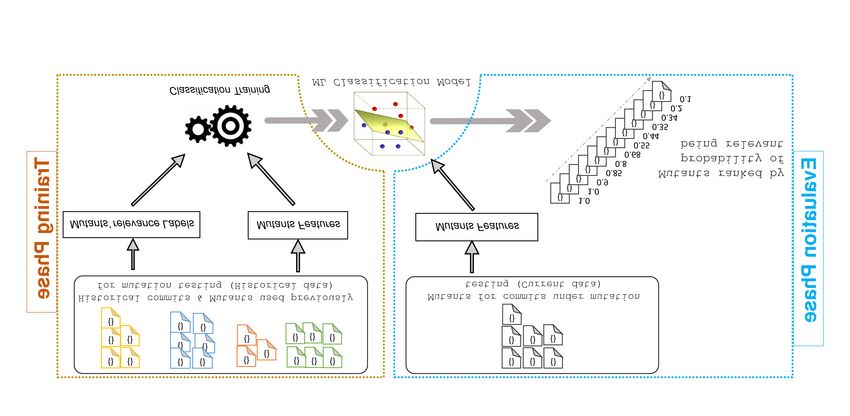
1 https://rml464.github.io/mutantlearning/ caused by the presence and absence of the mutants.Fig. 1. Overview of MuDelta. The learner is trained on a set of mutants from historical code changes that are labeled with respect to given test suites. The
machine learner is subsequently used to predict the priority ordering of the set of mutants to identify those most likely to be relevant to a given change.
The virtue of commit-relevant mutation testing, as described The program seq calls seq fast to print all the integers from
in the study of Ma et al. [16] is the best-effort application of the first parameter a to the second parameter b, and using a
mutation testing. This gives the potential for improved fault given character (first character of separator in post-commit
revelation under the same (relatively low) user effort than and ‘\n’ in pre-commit) to separate the printed numbers.
using randomly sampled mutants, i.e., traditional mutation Let four mutants such that: mutant M1 deletes the statement
testing. However, in order to be useful, these mutants need at line 414, which prints the first number using puts. Mutant
to be identified in advance, prior to any mutant analysis M2 deletes the modified statement at line 420, which add the
performed. This is because relevant mutants form the ob- separator to the buffer to print. Mutant M3 swaps the operands
jectives that developers will analyse. To achieve this, we of the last ”&&” operation at the modified line 543. Mutant
develop a machine learning approach, which we describe in M4 replaces the exit value at line 595 by −1.
the following section. We observe that M4 is not relevant to the commit. In fact,
Figure 2 presents a commit-relevant mutant on a fault- there is no test that can kill M4 in the post-commit version,
introducing commit of GNU Coreutils2 . This is the com- and create an output difference between pre- and post-commit
mit with ID 8 from CoREBench [19]. The commit affects versions of M4 . If a test kills post-commit M4 , it must avoid
two functions of the program seq (main and seq fast). The executing line 547, thus, seq fast is either not called or its call
entry-point is the function main, which, calls the functions does not succeed (does not print anything). Thus, the output of
print numbers and seq fast to compute and print the results. the execution of the pre- and post-commit versions of M4 with
The function seq fast is an optimized implementation of the such test will be same (both computed with print numbers,
function print numbers, used only when the inputs meet spe- which is not altered by the commit). Mutant M3 is equivalent,
cific conditions. In Figure 2, the line 543 checks the condition because no clause has side effect that is controlled by another
to call seq fast. If the condition is satisfied, seq fast is called. clause in the if condition.
Otherwise, print numbers is called. Note that print numbers
However, M1 is relevant to the commit. An execution of the
may be called after seq fast if the later fails (the condition at
test “seq -s, 1 2”, which sets the separator to the comma (‘,’),
line 405 is not satisfied, i.e. a > b). In that case, the execution
outputs “1,2\n” in pre-commit M1 (print numbers is called),
of seq fast does not alter the program state or output.
“2,” in post-commit M1 (‘puts(p)’ is deleted and seq fast
The commit aims at relaxing the condition that guards the
is called), and “1\n2,” in the post-commit original version
call to function seq fast. In the pre-commit version, seq fast
(the first number is printed using ‘puts(p)’, which appends an
is not called when the user specifies a separator. However, in
‘\n’). Similarly, M2 is relevant to the commit. The execution
the post-commit version, seq fast is called whenever a) the
of same test “seq -s, 1 2” outputs “1,2\n” in pre-commit
user specifies a separator, and b) the separator string has a
M2 (print numbers is called), “1\n2” in post-commit M1 (no
single character.
comma separator printed and seq fast is called).
In the function seq fast, the commit only replaces the hard
coded separator (‘\n’) with separator’s global string variable. Moreover, a fault introduced by the commit makes the
In the function main, the commit relaxes the “if” condition program use ‘\n’ instead of the user specified separator,
at line 543, in a way that seq fast is also called when the after printing the first number, when the user separator is a
user specifies a separator, which can be any single ”8-bits” single character other than ‘\n’. This happens because in such
character (it is not limited to ‘\n’). scenario, the program calls seq fast, which calls ‘puts(p)’ (line
414) to print the first number. This automatically add an extra
2 https://www.gnu.org/software/coreutils ‘\n’ and do not use the specified separator.390 static bool seq_fast (char const *a, char const *b) { A. MuDelta Feature Engineering
…
404 bool ok = cmp (p, p_len, q, q_len)Complexity: Complexity of SM , approximated by the number of mutants on SM . NumConditional: Number of conditional statements in the modification.
CfgDepth: Depth of BM according to CFG. NumHunks: Number of hunks (blocks) in the commit diff.
CfgPredNum: Number of predecessor basic blocks, in CFG, of BM . HasExit: The modification involves program termination commands.
CfgSuccNum: Number of successors basic blocks, in CFG, of BM . ChangesCondition: The modification involves the condition of an if or a loop.
AstNumParents: Number of AST parents of EM . InvolesOutput: The modification involves a function call to printf or error.
NumOutDataDeps: Number of mutants on expressions data-dependent on EM . IsRefactoring: The modification only does code refactoring.
NumInDataDeps: Number of mutants on expressions that EM is data-dependent. NumUPDATE: Number of UPDATE operations from GumTree tool [30].
NumOutCtrlDeps: Number of mutants on statements control-dependents on EM . NumINSERT: Number of INERT operations from GumTree tool [30].
NumInCtrlDeps: Number of mutants on expressions that EM is control-dependent NumMOVE: Number of MOVE operations from GumTree tool [30].
NumTieDeps: Number of mutants on EM . NumDELETE: Number of DELETE operations from GumTree tool [30].
AstParentsNumOutDataDeps: Number of mutants on expressions data-dependent NumActionClusters: Number of action clusters from GumTree tool [30].
on EM ’s AST parent statement. NumActions: Number of actions from GumTree tool [30].
AstParentsNumInDataDeps: Number of mutants on expressions that EM ’s AST
parent expression is data-dependent. Fig. 4. Mutant-Modification Interaction Features
AstParentsNumOutCtrlDeps: Number of mutants on statements control-
dependent on EM ’s AST parent expression.
AstParentsNumInCtrlDeps: Number of mutants on expressions that EM ’s AST 1) Modification Characteristics Features: We have features
parent expression is control-dependent. extracted from the commit diff and features extracted from
AstParentsNumTieDeps: Number of mutants on EM ’s AST parent expression.
TypeAstParent: Expression type of AST parent expressions of EM . the changed or added statements in the post-commit version
TypeMutant: Mutant type of M, transformation rule. E.g., a + b → a − b. of the program. Figure 4 describes the features extracted from
AstChildHasIdentifier: AST child of expression EM has an identifier.
AstChildHasLiteral: AST child of expression EM has a literal. the commit diff. The features extracted from the changed or
AstChildHasOperator: AST child of expression EM has an operator. added statements are: (a) The mean of the depth, according
OutDataDepNumStmtBB: Number of CFG basic blocks containing an expression
data-dependent on SM . to CFG, of the basic blocks in BC (modificationCfgDepth).
InDataDepNumStmtBB: Number of CFG basic blocks containing an expression (b) The mean of the complexity of the statements in SC
on which SM is data-dependent.
OutCtrlDepNumStmtBB: Number of CFG basic blocks containing an expression (modificationComplexity). (c) The contextual features (see
control-dependent on SM . Section III-B) of the added or changed statements in the
InCtrlDepNumStmtBB: Number of CFG basic blocks containing an expression on
which SM is control-dependent. program. When the modification involves multiple statements,
AstParentMutantTypeNum: Number of each mutant type of EM ’s AST parents. the mean of each feature value for all statements is computed.
OutDataDepMutantTypeNum: Number of each mutant type on expressions data-
dependents on EM . 2) Information-flow Features: The first feature that we use,
InDataDepMutantTypeNum: Number of each mutant type on expressions on which
EM is data-dependent. in this category, is a Boolean variable (MutantOnModification)
OutCtrlDepMutantTypeNum: Number of each mutant type on statements control- that represents whether the mutant M mutates an altered code
dependents on EM .
InCtrlDepMutantTypeNum: Number of each mutant type on expressions on which (SM ∈ SC). Additionally, we consider the 6 graphs presented
EM is control-dependent. in section III-B, and compute, for each graph, the set of
Fig. 3. Mutant utility features shortest paths between SM and SC.
.
For every set of paths, we compute the size (NumPaths), the
Overall, we get a set of features FS , for each statement S maximum path length (MaxPathLen), minimum path length
and for each graph G, by computing the score of the node (MinPathLen) and mean path length (MeanPathLen). Our
corresponding to S, using all graph analysis algorithms on G. features are thus, the combination of each one of these metrics
This gives us 6 * 5 (graphs * Metrics) features per program on every shortest path set.
statement.
E. Implementation
C. Mutant utility features
We used the features proposed by Chekam et al. [20]. These We implemented MuDelta in Python. For learning, we used
features relate to the complexity of the mutated statement SM , stochastic gradient boosting [31] (decision trees), which has
the position of SM in the control-flow graph, the dependencies been found to work well in the context of mutation [20]. We
with other mutants, and the nature of the code block BM used the XGBoost [32] framework and set the number of trees
where SM is located. The selected features are recorded in to 3,000 with a maximum trees depth to 10. We adopt early
Figure 3. Note that for this study, we added the last 9 features stopping during training to avoid over-fitting.
(marked in the figure with italic), and the contextual features MuDelta uses both numerical or categorical features. The
of SM (Section III-B). The first 4 features (with italic) are categorical features are: TypeAstParent, TypeMutant. In order
similar to the features NumOutDataDeps, NumInDataDeps, to use the feature values with XGBoost, we pre-process them
NumOutCtrlDeps, NumInCtrlDeps used by Chekam et al. [20], using a normalization of numerical and an encoding of cate-
but, instead of the number of mutants, they count the number gorical features. We normalize numerical features, between 0
of basic blocks. and 1 using Rescaling (also known as min-max normalization).
We use binary encoding (binary encoding helps to keep a
D. Mutant-Modification Interaction Features reasonably low feature dimension, when comparing to one-
To capture the interaction between mutant and altered code, hot-encoding) for the categorical features. We also use Net-
we use features related to the information flow that the altered workX3 in the graph representation in order to extract the
code C incur to the execution of mutant M . In this regard, we contextual features that were described in section III-B.
propose features that characterize the altered code and features
that capture the information flow between C and M . 3 https://networkx.github.io/IV. R ESEARCH Q UESTIONS TABLE I
T EST S UBJECTS
We start our analysis by investigating the prediction ability
Benchmark #Programs #Commits #Mutants #Relevant #Tests
of our machine learning method. Thus, our first research
question can be stated as: CoREBench 6 13 154,396 21,597 8,828
Benchmark-1 17 37 412,060 65,982 14,785
RQ1 (Prediction performance): How well does MuDelta
predict commit relevant mutants?
To answer this question we collect a set of commits from V. E XPERIMENTAL S ETUP
the subject programs where we apply mutation testing and A. Benchmarks Used
identify relevant mutants. Then, we split the commits into We selected C programs from the GNU Coreutils4 , a col-
training/validation (80% of the commits) and test sets (20% lection of text, file and shell utility programs widely used in
of the commits) based on the timeline of the project(older software testing research [19], [35], [36]. The whole code-
commits are used for training and newer for commits are used base of Coreutils comprises approximately 60,000 lines of
for evaluation), and perform our experiment. C code5 . To perform our study on commits we used the
After checking the performance of the predictions, we benchmark6 introduced by Ma et al. [16] that is composed of
turn our attention to the primary problem of interest; mutant two parts and includes Benchmark-1, a set of commits mined
ranking. We investigate the extent to which our predictions from the Coreutils’ Github repository from year 2012 to 2019
can lead to strong and relevant tests (by using the predictive and CoREBench [19] that has fault introducing commits.
mutants as test objectives) in contrast to baseline mutants, The benchmark contains a) mutants generated by Mart [37],
i.e., randomly sampled mutants among those residing in the a state-of-the-art tool that supports a comprehensive set of
changed components (Random) or among those residing on mutation operators and TCE7 [9], [38] on both pre- and post-
the altered lines (Modification). Hence we ask: commit program versions of each commit, b) the mutant labels
RQ2 (Test assessment): How MuDelta compare with the (whether they are commit-relevant), and c) large test pools
baseline mutant sets with respect to killing commit- created using a combination of test generation tools [35], [36],
relevant mutants? [39]. It is noted that the mutant test executions involved require
We answer this question following a simulation of a testing excessive computational resources, i.e., require roughly 100
scenario where a tester analyse mutants in order to generate weeks of computation. Details about the data we used are
tests [12], [33]. We are interested in the relative differences recorded in Table I. The column #Relevant records the number
between the subsumming relevant mutation score, denoted as of commit-relevant mutants.
rM S∗, when test generation is guided by the predicted or the
baseline mutants. We use the subsumming relevant mutation B. Experimental Procedure
score to avoid bias from trivial/redundant mutants [10]. We To account for our working scenario, we always train
also use the random mutant selection baseline since it performs according to time, i.e, we use the older commits for training
comparably to the state-of-the-art [12], [20], [34]. We compare and the newer for evaluation. This ensured that we follow the
with random on a best effort basis, i.e., the rM S∗ achieved historical order of the commits.
by putting the same level of effort, measured by the number of Following the stated RQs, our experiment is composed
mutants that require analysis. Such a simulation is typical in of three parts. The first part evaluates the prediction ability
mutation testing literature [9], [12] and aims at quantifying the (performance) of MuDelta, answering RQ1. The second at
benefit of one method over the other. To further show the need evaluating the ability of MuDelta to rank commit-relevant
for mutant selection out of the changed code, we also compute mutants, answering RQ2, and the third part at evaluating the
the extend to which mutants on modification are sufficient in fault revealing potential, answering RQ3.
killing commit-relevant mutants. First experimental part: We evaluate the trained classifiers
Answering the above question provides evidence that using using five typically adopted metrics, namely, the Area Under
our approach yields significant advantages over the baselines. the Receiver Operating Characteristic Curve (ROC-AUC),
While this is important and demonstrates the potential of our the Area Under the Precision-Recall Curve (PR-AUC), the
approach, still the question of actual test effectiveness (actual precision, the recall and the F1-score.
fault revelation) remains. This means that it remains unclear The Receiver Operating Characteristic (ROC) curve records
what the fault revelation potential of our approach when the the relationship between true and false positive rates [40].
commit is fault-introducing. Therefore, we seek to investigate: The Precision-Recall (PR) Curve records the decrease in true
RQ3 (Fault Revelation): How MuDelta compare with positive classifications when the predicted positive values
the baseline mutant sets with respect to (commit- increase. In essence, the PR curve shows the trade-off between
introduced) fault revelation? precision and recall [40].
To answer this question, we investigate the fault revelation 4 https://www.gnu.org/software/coreutils/
potential of the mutant selection techniques based on a set of 5 Measured with cloc (http://cloc.sourceforge.net/)
real fault-introducing commits. We follow the same procedure 6 https://github.com/relevantMutationTesting
as in the previous research questions. 7 Compiler-based equivalent and duplicate mutant detection techniquePrecision is defined as the number of items that are truly Third experimental part: To evaluate the fault revealing
relevant among the items that predicted to be relevant. Recall ability of MuDelta, we used the CoREBench commits. We
is defined as the number of items that are predicted to be adopted a chronological ordering for training, validation and
relevant among all the truly relevant ones. The F1-score or testing when splitting the commits similar to what we did
F-measure of a classifier is defined as the weighted harmonic in previous experimental parts. We use the same process and
mean of the precision and recall. These assessment metrics effort metric as in the the second part of the experiment and
measure the general classification accuracy of the classifier. report results related to fault revelation and the average per-
Higher values denote a better classification. centage of commit-introduced faults revealed (APFD) within
To reduce the risk of over-fitting, we split our commit data the range, 1-100, of analysed mutants.
into three mutually exclusive sets (training, validation and test To account for the stochastic selection of test cases and
data). We also use early stopping during training to overwhelm mutant ranking, we used the Wilcoxon test to determine
over-fitting. We use the following procedure: whether there is a statistically significant difference between
1) Chronologically order the commit (from older to newer). the studied methods. To check the size of the differences we
2) Select the newest 20% of commits as test data. used the Vargha Delaney effect size Â12 [44], which quantifies
3) Randomly shuffle all the mutants from the remaining the differences between the approaches. A value Â12 = 0.5
80% of commits (oldest commit), then, select 20% of suggests that the data of the two samples tend to be the same.
them as validation data and the rest as training data. Values Â12 > 0.5 indicate that the first data-set has higher
Thus, the training, validation and test data represent 64%, values, while values Â12 < 0.5 indicate the opposite.
16% and 20% of the data-set, respectively. The model evalu- VI. R ESULTS
ation is performed on the test data. This experiment part was
performed on both CoREBench and Benchmark-1. A. Assessment of the Prediction Performance (RQ1)
Second experimental part: We simulate a scenario where a To evaluate the performance of MuDelta, we check the
tester selects mutants and designs tests to kill them. This typ- model’s convergence. During training and after each iteration
ical procedure [1], [12], [16], [20], [41] consists of randomly of the training process, we check the model performance on
selecting test cases, from the test pools of the benchmark, that both the training and validation data we used for training.
kill the selected mutants. Specifically, we rank the mutants and Figure 5 shows the ROC-AUC and PR-AUC values wrt the
then we follow the mutant order by picking test cases, from the number of training iterations. We observe that the model
test pool, that kill them. We then remove all the killed mutants performance on both the training and validation data increase
and pick the next mutant from the list. If the mutant is not with the number of iteration and stabilizes at specific values,
killed by any of the tests, we discard it without selecting any suggesting that our model is able to learn the characteristics
test. We repeat this process 100 times for all the approaches. of commit-relevant mutants.
MuDelta ranks all the mutants by the predicted commit- We then evaluate the performance of our model to predict
relevance probability, Random randomly ranks all the mutants commit-relevant mutants on the future commits that appear
in the changed components, and Modification randomly ranks in the test set. To compute the precision, recall and F1-score,
the mutants located on the altered code. we set the prediction threshold probability to 0.1, which we
Our effectiveness metrics are the relevant subsuming muta- obtained by applying the geometric mean [45], [46] on the
tion score (rM S∗) achieved by the test suites when analysing validation dataset. The precision, recall and F1-score of our
up to a certain number of mutants. Subsuming score metrics classifier are 0.63, 0.32 and 0.42, respectively. These values
allows reducing the influence of redundant mutants [10], [13], are higher than those that one can get with a random classifier
[42]. We also compute the Average Percentage of Faults (0.21, 0.21 and 0.20, respectively). Figure 6 shows the ROC
Detected (APFD) [43] that represents the average relevant and PR curves of our classifier (strong lines) and a random
subsuming mutation score when analysing any number of classifier (dashed lines). We observe that the ROC-AUC of
mutants within a given range. our classifier is 0.80 indicating a strong prediction ability.
Our effort metric is the number of mutants picked (analysed Similarly, we see that the PR-AUC of our classifier is 0.50
by the tester). This includes the mutants, killable or not, that while the random classifier PR-AUC is 0.20.
should be presented to testers for analysis (either design a In this context [7] it is important to give few mutants
test to kill them or judge them as equivalent) when applying to developers for analysis. To evaluate the performance of
mutation testing [9], [12]. In the spirit of the best-effort MuDelta with lower thresholds, we also study the performance
evaluation, we focus on few mutants (up to 100) that testers of MuDelta with thresholds ranging from the 10 to 100
need to analyse. This evaluation aims at showing the benefits mutants. We observe that the median precision of MuDelta
of MuDelta over Random under the same relative testing effort. ranges from 0.76 to 0.90 when the threshold goes from 10
The contrast with the Modification shows whether there is a to 30 mutants. These values are significantly higher than the
need for mutant selection outside of the modified code, i.e., random classifier, which has a precision of 0.15.
whether mutants on modification are sufficient leading to tests These results provide evidence that MuDelta provides a
that kill commit-relevant mutants. This part of the experiment good discriminative ability for assessing the utility of mutants
was performed on both CoREBench and Benchmark-1. to test particular code changes.1.0
1.0
0.8
0.6
0.4
0.9 0.2
0.0
Performance
rMS*
1.0
Random
MuDelta
0.8 0.8
0.6
Modification
0.4
0.7 Training PR-AUC 0.2
0.0
Training ROC-AUC 0 25 50 75 100 0 25 50 75 100 0 25 50 75 100 0 25 50 75 100 0 25 50 75 100
0.6 Eval PR-AUC
Eval ROC-AUC Fig. 7. rM S∗ achieved when analysing up to 100 mutants.
0 500 1000 1500 2000 2500 1.0
Training Round
0.8
Fig. 5. Training and Validation Curves from the Training phase.
0.6
rMS*
1.0
0.4
Precision / True Positive Rate
0.8 0.2
0.0
0.6 lta om ion lta om ion lta om ion lta om ion
M uDe Rand dificat MuDe Rand dificat MuDe Rand dificat MuDe Rand dificat
10 10 0 Mo 30 30 0 Mo 50 50 0 Mo 100 100 00 Mo
1 3 5 1
0.4
ROC (area = 0.80) Fig. 8. rM S∗ values when analysing up to 10, 30, 50 and 100 mutants.
0.2 PR-Curve (area = 0.50)
Truth Positive Ratio Figure 9 shows the Vargha Delaney Â12 values between
0.0
0.0 0.2 0.4 0.6 0.8 1.0 MuDelta and both Random and Modification. We observe that
Recall / False Positive Rate the median value is between 77% and 83% for threshold
Fig. 6. Precision-Recall and ROC Curves on test data. between 10 and 100 mutants, for Random. Suggesting that
MuDelta is better than Random in 77% to 83% of the cases for
B. Mutant Ranking for Tests Assessment (RQ2) these thresholds. The differences are larger for Modification.
We further validate our approach by considering the dis-
Figure 7 shows the median rM S∗ achieved by the mutant tributions of APFD (Average Percentage of Faults Detected)
ranking strategies, when the number of analysed mutant budget values for all possible thresholds (for 1-100 mutants). Fig-
range from 1 to 100 mutants. In other words, the figure ure 10 depicts these results and shows that MuDelta yields
shows test effectiveness (measured with rM S∗, y-axis) that is an APFD median of 71%, Random and Modification reach
achieved by a developer when analysing a number of mutants, median APFD values of 26% and 11% respectively, confirm
representing the cost factor (recorded in x-axis). Each sub- the superiority of our approach.
figure is a commit taken from the test data. We observe that To account for the stochastic nature of the compared
the curve for MuDelta is always higher than the curves of approaches and increase the confidence on our results, we
random and Modification, and Random is above Modification. further perform a statistical test on the APFD values. The
To further visualize the differences, Figure 8 shows the Wilcoxon test results yielded p-values much lower than our
distribution of the rM S∗ of the mutant ranking strategies significance level for the compared data, i.e., samples of
for budget thresholds 10, 30, 50 and 100 mutants. As can be MuDelta and Random, MuDelta and Modification, Random
seen from the plots, MuDelta outperforms both Random and and Modification, respectively. Therefore, we conclude that
Modification. Interestingly, Random outperforms Modification. MuDelta outperforms Random with statistically significance,
With threshold 10 mutants, the difference of the median values while Modification is not sufficient for testing the deltas.
is 22% and 26% for Random and Modification, respectively.
This difference is markedly increased when analysing more C. Mutant Ranking and Fault Revelation (RQ3)
mutants, i.e., it becomes 45% and 50% for the thresholds of Figure 11 shows the distributions of APFD (Average Per-
30 and 50 mutants, for Random. centage of Faults Detected) values for the CoREBench fault
To check whether the differences are statistically significant introducing test commits, using the three approaches under
we performed a Wilcoxon rank-sum test and computed the evaluation. While MuDelta yields an APFD median of 52%,
Vargha Delaney Â12 effect size and found that MuDelta Random and Modification reach median APFD values of 25%
outperforms both Random and Modification with statistically and 0% respectively. The improvement over Random and
significant difference (at 0.01 significant level). Random has Modification are 27% and 52%, respectively. These results
also statistically significant differences with Modification. confirm the superiority of our approach wrt to fault revelation.1.0 1.0
Vargha and Delaney A measure
0.9
0.8
0.8
0.6
0.7
APFD
0.6 0.4
0.5 MuDelta - Random 0.2
MuDelta - Modification
0.4
1 0 2 0 3 0 40 50 6 0 7 0 80 op 90 p 100 0.0
Top Top Top Top Top Top Top Top T To MuDelta Random Modification
Fig. 9. Vargha and Deianey Â12 (MuDelta VS Random, MuDelta VS Fig. 11. APFD Fault-revelation (up to 100 mutants).
Modification) about rM S∗
1.0 MuDelta Random Modification
1.0
0.8
0.8
0.6
APFD (rMS*)
Fault Revelation
0.6
0.4
0.4
0.2
0.2
0.0
MuDelta Random Modification 0.0
1 11 21 31 41 51 61 71 81 91 100
Fig. 10. APFD rM S∗ (up to 100 mutants). Number of Mutants
Fig. 12. Median fault-revelation in fault introducing commits.
The Wilcoxon test yielded p-values much lower than our
significance level for the compared data, i.e., samples of TABLE II
MuDelta and Random, MuDelta and Modification, Random M ODEL C OMPARISON
and Modification. Therefore, we conclude that MuDelta out- Precision on
ROC-AUC PR-AUC MCC
performs Random and Modification with statistically signifi- Top-100
cance while Random outperforms Modification. AdaBoost 0.6 0.35 0.26 0.55
Random Forest 0.66 0.31 0.24 0.57
Figure 12 shows the distribution of fault revelation for the Logistic 0.58 0.26 0.13 0.21
ranking strategies and for mutant set size thresholds up to MLP 0.51 0.19 0.1 0.2
100 mutants. We observe that the curve for MuDelta is above Mixed MLP 0.68 0.45 0.31 0.2
XGBoost 0.80 0.50 0.36 0.61
the curves of random and Modification, and Random is above
Modification. Specifically, we observe that MuDelta reaches a
fault revelation of 60% and 100% when analysing the top 30
and 61 mutants, while Random 7% and 12%, respectively. Table II reports the ROC-AUC, PR-AUC, MCC, and pre-
cision on top 100 ranked mutants of the prediction results
VII. D ISCUSSION of all different learners we built. The results show that the
A. Comparison with other models XGBoost model, that we use, perform best in all cases. The
To further assess the effectiveness of our model, we contrast general prediction metrics (ROC-AUC,PR-AUC, MCC) show
it with the prediction ability of five other models (on the that Mixed MLP model is the second best case though it
same training, validation and test data-sets) that are typically falls behind the Ensemble models wrt to the top-100 mutants.
used in prediction modelling studies. In particular, we used Nevertheless, the results provide clear indications that the
three families of models (Ensemble model classifiers, Logistic XGBoost model we use is indeed the best choice.
classifiers and Neural Networks) and built five models; namely
Adaboost, Random Forest, Logistic Regression, Multilayer
All Features
Perceptron (MLP) and Mixed MLP. MLP and Mixed MLP
Input Layer
were inspired by the work of Li et al. [47], their architecture
is shown in Figure 13 and 14. To train and evaluate the models
FC Layer
we used the Sklearn library8 . Since our data are imbalanced
we also used class weighting strategies that are commonly
used to tackle this issue. To avoid bias from improper setting Dropout Layer
of the learners, in all the cases we used Grid Search Cross
Output Layer
Validation on the validation set to tune our hyperparameters.
8 https://scikit-learn.org/stable/ Fig. 13. MLP - Neural Network ArchitectureMutant Utility Contextual Mutant-Modification VIII. T HREATS TO VALIDITY
Features Features Interaction Features
Input Layer
A possible threat to external validity could be due to our test
subjects. Our target was commits that do not alter test contracts
FC Layer and make small modifications, similar to those observed in
industrial CI pipelines. Such commits are usually hard to test
Dropout Layer and typically result in subtle faults. Large commits that add
new features, should be anyway tested by using a mutation
Merge Layer testing approach that involves (almost) all the relevant mu-
tants residing on the added code. To reduce this threat, we
Dropout Layer sampled a commit set where we could reasonably perform our
experiments. At the same time, to diminish potential selection
FC Layer bias, we also used the Coreutils commits of CoREBench [19],
which are frequently used in testing studies.
Dropout Layer We are confident on our results since the relevance prop-
erties of the mutants reside on the context of the committed
Output Layer
code, which includes the area around the dependencies to the
committed code (where we draw our feature values), that is
Fig. 14. Mixed MLP - Neural Network Architecture
small and its characteristics should be as representative as our
subjects. Moreover, our predictions converge well, do not have
significant variance wrt to the baselines and consistently out-
DG nts nts nts low ion DG nts UG ype
DD-pareendeendetion-f ificat Cende tantT
perform the baselines in all test subjects we used. Additionally,
p Mu
the statistical significance we observe indicates the sufficiency
of our data analysis [49]. Future work should validate our
AS a-Derl-De ormat-mo rl-De
findings and analysis to larger programs.
at Ct Inf an n-Ct
d
I
Another threat may relate to the mutants we use. To mitigate
this threat, we selected data from a mutation testing tool [37]
t-D ut- Mut
T p p
that has been used in several studies [16], [20], [39] that
0.000 0.025 0.050 0.075 0.100 0.125 0.150 0.175 supports the most commonly used operators [50] and covers
Ou O
XGBoost SHAP Score the most frequent features of the C language.
Threats to internal validity may be due our features. We use
Fig. 15. Feature Importance, SHAP Score of top-10 feature sets. The 10 a large number of features, selected either based on previous
most important features are “Mutant Type”, “Utility Graph”, “Incoming Con-
trol Dependencies”, “Mutant-modification features”, “Control Dependency
studies [20] or by using our intuition, which are automatically
Graph”, “Information-flow”, “Outgoing Control Dependencies”, “Outgoing filtered by gradient boosting. To further reduce this concern,
Data Dependencies”,“AST parents” and “Directed Data Dependency Graph”. we split our data in three parts, training, validation and test
data. During training (using training data) we measure the
model convergence on training and validation data. As demon-
B. Feature Importance strated in Figure 5, our model converges both on the training
To evaluate the importance of our features we used the and validation data, showing that there are low chances for
SHapley Additive exPlanations (SHAP)9 method [48], i.e., a over- or under-fitting because in these cases, the model would
game theory method that explains individual predictions based not converge on the validation data.
on the game theoretically optimal Shapley Values. In particu- The test-based approximation of relevant and killable mu-
lar, we aim at explaining our predictions by assuming that each tants may introduce additional threats. To reduce it, we used
feature value we use is a “player” in a game where the predic- test suites generated by KLEE [35] and SeMu [39], together
tion is the payout. Shapley values – a method from coalitional with developer test suites.
game theory – tells us how to fairly distribute the “payout” A possible threat to construct validity could be due to the
among the features. We thus measure and report the feature effort metric, i.e., the number of analysed mutants, we use.
importance (Shapley values) of the feature categories we use. This is a typical metric for this kind of studies [12] aiming at
Results are depicted on Figures 15 and show that “Mutant capturing the manual effort involved when analysing mutants
Type”, “Utility Graph”, “Incoming Control Dependencies”, or asserting automatically generated tests. Since, our data have
“Mutant-modification features”, “Control Dependency Graph” been filtered by TCE [9], [38], a state-of-the-art equivalent
and the “Information-flow” are the top 6 feature sets and that mutant detection technique, this threat should be limited.
all three types of features we use are important. Additional Overall, we tried to reduce threats by using various evalu-
results related to the feature importance of the individual ation metrics, i.e., prediction performance, relevant mutation
features we used can be found on the accompanied website. score and fault revelation, and established procedures. Further-
more, to enable replication and future research we will make
9 https://github.com/slundberg/shap our tools and data publicly available.IX. R ELATED W ORK Related to continuous integration, Google [7] is using a
mutation testing tool that is integrated with the code review
The problem of determining the set of mutants that are process (reviewers select mutants). This tool proposes mutants
most relevant to particular code changes might resemble a to developers in order to design test cases. The key basis of
dependence analysis problem. One natural solution involves this approach is to choose some mutants from the lines of
forming a program slice on the set of changed statements. Any the altered code. We share a similar intent, though we aim at
mutant that lies in the slice should be considered relevant. making an informative selection of mutants among all project
Unfortunately, this approach does not scale well for several mutants. According to our results mutants residing on non-
reasons. Firstly, as have been previously observed [51], [52], altered code tend to be powerful at capturing the interactions
even a single static slice of a program tends to occupy between between the altered and non-altered code.
one and two thirds of the program from which it is constructed. Regression mutation testing [63] and the predictive mutation
Therefore, the union of a set of such slices, will be large, and testing [64], [65] also focus on regression testing. Similarly,
thereby fail to exclude many mutants. Secondly, the depen- Pitest [66], a popular mutation testing tool, implements an
dence analysis would need to be incremental, which raises incremental analysis that computes which mutants are killed
further challenges. Although there have been incremental de- or not by a regression test suite. This means that the goal
pendence analyses in the literature [53], many well-developed of the above techniques is to estimate the mutation score
slicing systems are not incremental. In general, the problem of achieved by regression test suites thereby not making any
incremental program analysis at scale remains challenging [5]. distinction between commit-relevant and non-relevant mutants,
Thirdly, it is hard to use dependence analysis to provide the not making any mutant ranking and not proposing any live
priority ordering we need, where priority is based on degree mutant to be used for test generation.
of relevance. Potentially, unions of dynamic slices or some Fault revealing mutant selection [20] aims at selecting
form of observation-based slicing [17] could achieve this, mutants that are likely to expose faults. While powerful, that
but such approaches have a prohibitive computational cost in technique targets the entire program functionality and not the
comparison to our method. changed/delta one. Since it is unaware of the deltas it selects
Change impact analysis [54] aims at determining the effects many irrelevant mutants, while missing many delta-relevant
of changes on the other parts of the software. Similar to mutants related to the delta-context interactions.
program slicing, such approaches are conservative, therefore Perhaps the closest work to ours is the commit-aware
they result in large number of false positives, does not account mutation testing study [16] that defines the notion of mutant
for equivalent mutants located on potentially infected code relevance and demonstrates its potential. In essence that work
and is hard to provide the mutant ranking (prioritizes mutant describes the fundamental aspects of relevant mutants but does
types and location) we need. Other attempts aim at testing the not define any way to identify them at the testing time. We
potential propagation flows of the changes [14], [15], [55], therefore built on top of this notion by providing a static
[56]. Similarly to change impact analysis their purpose is to technique that identifies relevant mutants.
identify the program paths (flows) that may be impacted by Overall, there is a fundamental difference on the aims of
the changes. They rely on symbolic execution to check for our approach and previous research since we statically produce
the feasibility of the flows, form test requirements (conditions relevant, to code changes, mutants and rank them to provide
to be fulfilled) and decide on relevance. Unfortunately, such a best effort testing application.
techniques inherit most of the issues of symbolic execution, are X. C ONCLUSION
complex to implement and test the propagation of the changes.
We presented MuDelta a delta-oriented mutation testing
In contrast our technique scales since it relies on static code
approach that selects delta-relevant mutants; mutants capturing
features, does not require any complex analysis techniques and
the program behaviours affected by specific program changes.
applies mutation testing that is known for capturing the fault-
Experiments with MuDelta demonstrated that it identifies
revealing properties of test suites [1], [20].
delta-relevant mutants with 0.63 and 0.32 precision and recall.
Automatic test case generation aims at producing test inputs
Interestingly, killing these mutants leads to strong tests that
that a) make observable the code differences of two program
kill 45% more relevant mutants than killing randomly selected
versions [57], b) increase and optimize coverage [58] and kill
mutants. Our results also show that MuDelta selects mutants
mutants [39], [59], [60]. Among these techniques, the most
with a 27% higher fault revealing ability than randomly
relevant to our study are the are the ones related to patch
selected mutants.
testing, i.e., differential symbolic execution [61], KATCH
[62] and Shadow symbolic execution [35]. These techniques ACKNOWLEDGEMENT
generate tests exercising the semantic differences between This work is supported by the Luxembourg National
program versions guided by coverage. All these techniques Research Funds (FNR) through the CORE project grant
do not propose any test requirements as done by MuDelta and C17/IS/11686509/CODEMATES. Mark Harman is part sup-
thus, they are complementary to our goal. This means that ported by European Research Council Advanced Fellowship
they can be used to generate tests to kill the commit-relevant grant number 741278; Evolutionary Program Improvement
mutants proposed by MuDelta. (EPIC).R EFERENCES [16] W. Ma, T. Laurent, M. Ojdanic, T. T. Chekam, A. Ventresque, and
M. Papadakis, “Commit-aware mutation testing,” in Proceedings of
[1] T. T. Chekam, M. Papadakis, Y. L. Traon, and M. Harman, “An empirical the 36th IEEE International Conference on Software Maintenance and
study on mutation, statement and branch coverage fault revelation Evolution, ICSME, 2020.
that avoids the unreliable clean program assumption,” in Proceedings [17] D. W. Binkley, N. Gold, M. Harman, S. S. Islam, J. Krinke, and S. Yoo,
of the 39th International Conference on Software Engineering, ICSE “ORBS: language-independent program slicing,” in Proceedings of
2017, Buenos Aires, Argentina, May 20-28, 2017, 2017, pp. 597–608. the 22nd ACM SIGSOFT International Symposium on Foundations of
[Online]. Available: https://doi.org/10.1109/ICSE.2017.61 Software Engineering, (FSE-22), Hong Kong, China, November 16 -
[2] R. A. DeMillo, R. J. Lipton, and F. G. Sayward, “Hints on 22, 2014, S. Cheung, A. Orso, and M. D. Storey, Eds. ACM, 2014, pp.
test data selection: Help for the practicing programmer,” IEEE 109–120. [Online]. Available: https://doi.org/10.1145/2635868.2635893
Computer, vol. 11, no. 4, pp. 34–41, 1978. [Online]. Available: [18] M. Kintis, M. Papadakis, and N. Malevris, “Employing second-order
https://doi.org/10.1109/C-M.1978.218136 mutation for isolating first-order equivalent mutants,” Softw. Test., Verif.
[3] T. A. Budd and D. Angluin, “Two Notions of Correctness and Their Reliab., vol. 25, no. 5-7, pp. 508–535, 2015. [Online]. Available:
Relation to Testing,” Acta Informatica, vol. 18, no. 1, pp. 31–45, March https://doi.org/10.1002/stvr.1529
1982. [19] M. Böhme and A. Roychoudhury, “Corebench: studying complexity of
[4] M. Fowler, “Continuous integration,” regression errors,” in International Symposium on Software Testing and
https://martinfowler.com/articles/continuousIntegration.html, online; Analysis, ISSTA ’14, San Jose, CA, USA - July 21 - 26, 2014, 2014, pp.
accessed 10 February 2020. 105–115. [Online]. Available: https://doi.org/10.1145/2610384.2628058
[5] M. Harman and P. W. O’Hearn, “From start-ups to scale-ups: [20] T. T. Chekam, M. Papadakis, T. F. Bissyandé, Y. L. Traon, and
Opportunities and open problems for static and dynamic program K. Sen, “Selecting fault revealing mutants,” Empirical Software
analysis,” in 18th IEEE International Working Conference on Source Engineering, vol. 25, no. 1, pp. 434–487, 2020. [Online]. Available:
Code Analysis and Manipulation, SCAM 2018, Madrid, Spain, https://doi.org/10.1007/s10664-019-09778-7
September 23-24, 2018. IEEE Computer Society, 2018, pp. 1–23. [21] M. Chalupa, “Slicing of llvm bitcode,” Masaryk Univ, 2016.
[Online]. Available: https://doi.org/10.1109/SCAM.2018.00009 [22] J. J. McAuley, L. da Fontoura Costa, and T. S. Caetano, “Rich-club
[6] C. Leong, A. Singh, M. Papadakis, Y. L. Traon, and J. Micco, phenomenon across complex network hierarchies,” Applied Physics
“Assessing transition-based test selection algorithms at google,” Letters, vol. 91, no. 8, p. 084103, 2007.
in Proceedings of the 41st International Conference on Software [23] R. Milo, N. Kashtan, S. Itzkovitz, M. E. Newman, and U. Alon, “On the
Engineering: Software Engineering in Practice, ICSE (SEIP) 2019, uniform generation of random graphs with prescribed degree sequences,”
Montreal, QC, Canada, May 25-31, 2019, 2019, pp. 101–110. [Online]. arXiv preprint cond-mat/0312028, 2003.
Available: https://doi.org/10.1109/ICSE-SEIP.2019.00019
[24] J. Saramäki, M. Kivelä, J.-P. Onnela, K. Kaski, and J. Kertesz, “Gener-
[7] G. Petrovic and M. Ivankovic, “State of mutation testing at google,”
alizations of the clustering coefficient to weighted complex networks,”
in Proceedings of the 40th International Conference on Software
Physical Review E, vol. 75, no. 2, p. 027105, 2007.
Engineering: Software Engineering in Practice, ICSE (SEIP) 2018,
[25] G. Fagiolo, “Clustering in complex directed networks,” Phys.
Gothenburg, Sweden, May 27 - June 03, 2018, 2018, pp. 163–171.
Rev. E, vol. 76, p. 026107, Aug 2007. [Online]. Available:
[Online]. Available: https://doi.org/10.1145/3183519.3183521
https://link.aps.org/doi/10.1103/PhysRevE.76.026107
[8] M. Papadakis, M. Kintis, J. Zhang, Y. Jia, Y. L. Traon, and M. Harman,
“Chapter six - mutation testing advances: An analysis and survey,” [26] J.-P. Onnela, J. Saramäki, J. Kertész, and K. Kaski, “Intensity and
Advances in Computers, vol. 112, pp. 275–378, 2019. [Online]. coherence of motifs in weighted complex networks,” Physical Review
Available: https://doi.org/10.1016/bs.adcom.2018.03.015 E, vol. 71, no. 6, p. 065103, 2005.
[9] M. Kintis, M. Papadakis, Y. Jia, N. Malevris, Y. L. Traon, and [27] P. G. Lind, M. C. González, and H. J. Herrmann,
M. Harman, “Detecting trivial mutant equivalences via compiler “Cycles and clustering in bipartite networks,” Phys. Rev.
optimisations,” IEEE Trans. Software Eng., vol. 44, no. 4, pp. 308–333, E, vol. 72, p. 056127, Nov 2005. [Online]. Available:
2018. [Online]. Available: https://doi.org/10.1109/TSE.2017.2684805 https://link.aps.org/doi/10.1103/PhysRevE.72.056127
[10] M. Papadakis, C. Henard, M. Harman, Y. Jia, and Y. L. Traon, “Threats [28] L. Page, S. Brin, R. Motwani, and T. Winograd, “The pagerank citation
to the validity of mutation-based test assessment,” in Proceedings of the ranking: Bringing order to the web.” Stanford InfoLab, Technical Report
25th International Symposium on Software Testing and Analysis, ISSTA 1999-66, November 1999, previous number = SIDL-WP-1999-0120.
2016, Saarbrücken, Germany, July 18-20, 2016, 2016, pp. 354–365. [Online]. Available: http://ilpubs.stanford.edu:8090/422/
[Online]. Available: https://doi.org/10.1145/2931037.2931040 [29] J. M. Kleinberg, “Authoritative sources in a hyperlinked environment,”
[11] P. Ammann, M. E. Delamaro, and J. Offutt, “Establishing theoretical J. ACM, vol. 46, no. 5, p. 604–632, Sep. 1999. [Online]. Available:
minimal sets of mutants,” in 2014 IEEE Seventh International Confer- https://doi.org/10.1145/324133.324140
ence on Software Testing, Verification and Validation. IEEE, 2014. [30] J. Falleri, F. Morandat, X. Blanc, M. Martinez, and M. Monperrus,
[12] B. Kurtz, P. Ammann, J. Offutt, M. E. Delamaro, M. Kurtz, and “Fine-grained and accurate source code differencing,” in ACM/IEEE
N. Gökçe, “Analyzing the validity of selective mutation with dominator International Conference on Automated Software Engineering, ASE
mutants,” in Proceedings of the 24th ACM SIGSOFT International ’14, Vasteras, Sweden - September 15 - 19, 2014, 2014, pp. 313–324.
Symposium on Foundations of Software Engineering, FSE 2016, [Online]. Available: http://doi.acm.org/10.1145/2642937.2642982
Seattle, WA, USA, November 13-18, 2016, 2016, pp. 571–582. [Online]. [31] J. H. Friedman, “Stochastic gradient boosting,” Computational Statistics
Available: https://doi.org/10.1145/2950290.2950322 & Data Analysis, vol. 38, no. 4, pp. 367–378, 2002.
[13] M. Papadakis, T. T. Chekam, and Y. L. Traon, “Mutant [32] T. Chen and C. Guestrin, “Xgboost: A scalable tree boosting system,”
quality indicators,” in 2018 IEEE International Conference in Proceedings of the 22nd ACM SIGKDD International Conference
on Software Testing, Verification and Validation Workshops, on Knowledge Discovery and Data Mining, ser. KDD ’16. New York,
ICST Workshops, Västerås, Sweden, April 9-13, 2018. IEEE NY, USA: Association for Computing Machinery, 2016, p. 785–794.
Computer Society, 2018, pp. 32–39. [Online]. Available: [Online]. Available: https://doi.org/10.1145/2939672.2939785
http://doi.ieeecomputersociety.org/10.1109/ICSTW.2018.00025 [33] J. H. Andrews, L. C. Briand, Y. Labiche, and A. S. Namin,
[14] T. Apiwattanapong, R. A. Santelices, P. K. Chittimalli, A. Orso, and “Using mutation analysis for assessing and comparing testing coverage
M. J. Harrold, “MATRIX: maintenance-oriented testing requirements criteria,” IEEE Trans. Software Eng., vol. 32, no. 8, pp. 608–624, 2006.
identifier and examiner,” in Testing: Academia and Industry Conference [Online]. Available: https://doi.org/10.1109/TSE.2006.83
- Practice And Research Techniques (TAIC PART 2006), 29-31 [34] R. Gopinath, I. Ahmed, M. A. Alipour, C. Jensen, and A. Groce,
August 2006, Windsor, United Kingdom, 2006, pp. 137–146. [Online]. “Mutation reduction strategies considered harmful,” IEEE Trans.
Available: https://doi.org/10.1109/TAIC-PART.2006.18 Reliab., vol. 66, no. 3, pp. 854–874, 2017. [Online]. Available:
[15] R. A. Santelices, P. K. Chittimalli, T. Apiwattanapong, A. Orso, https://doi.org/10.1109/TR.2017.2705662
and M. J. Harrold, “Test-suite augmentation for evolving software,” [35] T. Kuchta, H. Palikareva, and C. Cadar, “Shadow symbolic
in 23rd IEEE/ACM International Conference on Automated Software execution for testing software patches,” ACM Trans. Softw. Eng.
Engineering (ASE 2008), 15-19 September 2008, L’Aquila, Italy, 2008, Methodol., vol. 27, no. 3, pp. 10:1–10:32, 2018. [Online]. Available:
pp. 218–227. [Online]. Available: https://doi.org/10.1109/ASE.2008.32 https://doi.org/10.1145/3208952You can also read